NEW FORMED HEMOGLOBIN AND PROTEIN CATABOLISM CONSERVATION OF INTERMEDIATES IN THE ANEMIC DOG ON A PROTEIN-FREE DIET BY FLOYD SHELTON DAFT, FRIEDA S. ROBSCHEIT- ROBBINS, AND G. H. WHIPPLE (Prom the Department of Pathology, The University of Rochester School 0.f Medicine and Dentistry, Rochester, New York) (Received for publication, July 10, 1933) Several years ago it was reported by Whipple, Hooper, and Rob- scheit (4) that more new red cells and hemoglobin would be re- generated during a fasting period than during a sugar feeding period in short anemia experiments on dogs. This suggested a sparing action of the carbohydrate with a very pretty conservation of materials suitable for red cell and hemoglobin construction, as obviously new hemoglobin was produced during diet periods con- taining no nitrogen intake. About this time Davis, Hall, and Whipple (1) reported that the liver necrosis caused by chloroform would be followed by little evidence of liver repair during fasting periods but by ample evi- dence of almost complete liver repair during sugar feeding periods. With no nitrogen intake the body could produce much new liver cell protein dependent upon sugar feeding. This was believed to be evidence of conservation of body protein waste products due to the sugar intake-a reconstruction of complex liver cell protein from split-products coming from body protein. The term “body protein” as used here would include all proteins in the body- plasma, tissue, muscle, hemoglobin, and organ proteins. More recently Whipple and Robscheit-Robbins (unpublished material) have observed that during prolonged anemia periods due to blood loss in dogs the animal can produce a considerable sur- plus of red cells and hemoglobin during fasting or sugar diet periods and that sugar and iron administered by mouth will raise this 495 by guest on October 13, 2019 http://www.jbc.org/ Downloaded from
Transcript
NEW FORMED HEMOGLOBIN AND PROTEIN CATABOLISM
CONSERVATION OF INTERMEDIATES IN THE ANEMIC DOG ON A PROTEIN-FREE DIET
BY FLOYD SHELTON DAFT, FRIEDA S. ROBSCHEIT- ROBBINS, AND G. H. WHIPPLE
(Prom the Department of Pathology, The University of Rochester School 0.f
Medicine and Dentistry, Rochester, New York)
(Received for publication, July 10, 1933)
Several years ago it was reported by Whipple, Hooper, and Rob- scheit (4) that more new red cells and hemoglobin would be re- generated during a fasting period than during a sugar feeding period in short anemia experiments on dogs. This suggested a sparing action of the carbohydrate with a very pretty conservation of materials suitable for red cell and hemoglobin construction, as obviously new hemoglobin was produced during diet periods con- taining no nitrogen intake.
About this time Davis, Hall, and Whipple (1) reported that the liver necrosis caused by chloroform would be followed by little evidence of liver repair during fasting periods but by ample evi- dence of almost complete liver repair during sugar feeding periods. With no nitrogen intake the body could produce much new liver cell protein dependent upon sugar feeding. This was believed to be evidence of conservation of body protein waste products due to the sugar intake-a reconstruction of complex liver cell protein from split-products coming from body protein. The term “body protein” as used here would include all proteins in the body- plasma, tissue, muscle, hemoglobin, and organ proteins.
More recently Whipple and Robscheit-Robbins (unpublished material) have observed that during prolonged anemia periods due to blood loss in dogs the animal can produce a considerable sur- plus of red cells and hemoglobin during fasting or sugar diet periods and that sugar and iron administered by mouth will raise this
hemoglobin production to very high levels. With zero nitrogen intake the anemic dog may be able to form more than 100 gm. of new hemoglobin during 2 weeks on an intake of sugar (75 gm.) and iron (400 mg.) daily. Obviously t,he new hemoglobin must come from material derived from the animal’s body protein and one can imagine that the sugar and iron enable the body to con- serve nitrogenous waste products for new hemoglobin fabrication or that body protein cat,abolism is accelerated under these con- ditions. Both mechanisms may come into play.
Whatever the true and complete explanation may be, this fleet- ing glimpse of the internal metabolism of hemoglobin and other body proteins stimulates one’s imagination and does not point to a simple standard tied reaction but rather t,o intriguing possibili- ties of exchange between various body proteins and hemoglobin or other proteins according to the physiological needs of the moment.
EXPERIMENTAL
The anemic dogs used in these metabolism experiments were taken from the anemia colony in this laboratory. Their history is complete from birth and the care of these dogs has been fully described (5). Conditions are as uniform as possible and the anemia level is maintained between 40 and 50 per cent hemoglobin, the normal being 140 to 150 per cent hemoglobin, where 100 per cent hemoglobin is equivalent to 13.8 gm. of hemoglobin per 100 cc. The standard salmon-bread made in the laboratory is a com- plete diet on which dogs live indefinitely in perfect health and its make-up has been described (5). The newly formed cells and hemoglobin are removed to maintain t,he anemia level a constant. The total hemoglobin production due t.o any given diet is readily calculated frqm Tables I-A, II-A, and III-A. During the anemia periods on salmon-bread diet the dogs produce about 2 t.o 5 gm. of new hemoglobin per week. In our large colony the average value is closer to 2 gm. We deduct this 2 gm. from each week’s hemo- globin output. The hemoglobin level at{ the end of the fore period or last bread control week is compared wit,h the hemoglobin level at the end of the 3 week aft,er period. We correct for this differ- ence in hemoglobin levels (6). The anemia data are given in Tables I-A, II-A, and III-A.
All dogs used in these metabolism experiments were active and
healthy whether anemic or normal hemoglobin controls. These periods of fasting or sugar feeding with or without iron are well tolerated and the dogs were in good condition at the end of the experiment (with the possible exception of Dog 29-326, experimen- tal history, Table I). When the salmon-bread diet was resumed they came back to their normal weight promptly. The dog dur- ing any given experiment was kept in a galvanized iron metabolism cage in the laboratory where the animal was under constant super- vision.
The dogs fasted as a rule 3 days to lower the nitrogen excretion approximately to the fasting level. Each period, as shown in Tables I to IV, whether 2, 5, or 7 days, was terminated by cathe- terization and rinsing of the bladder. The urine was collected several times daily as it was passed, and was preserved by toluene and refrigeration. Urine analyses were made daily or every other day for the following constituents: total nitrogen by macro- Kjeldahl, ammonia by aeration, urea by the urease method with aeration, creatinine and creatine by the methods of Folin (2), and uric acid by the method of Morris and Macleod (3).
After the preliminary 3 days fast the dog was given daily ap- proximately 75 gm. of glucose or glucose and sucrose in 250 to 400 cc. of water by stomach tube. At the end of the 1st week of carbohydrate feeding, ferric citrate sufficient in amount to con- tain 400 mg. of Fe was added to the sugar and given by stomach tube. The dog had access to water at all times.
The last day of fasting and 6 days of sugar feeding comprise the 1st week. In cases where the periods were less than 1 week, the actual figures are not given, the excretion per week being calcu- lated and tabulated instead. The figures for ammonia and urea are combined and considered together. For our purpose, the ratio between the two is of little importance and in the occasional cases of contamination of the urine by feces, the conversion of urea to ammonia was too rapid, despite the toluene, to permit t-he ac- curate determination of this ratio.
Total hemoglobin production 112 gm., equivalent to 19.0 gm. of nitrogen in anemic period.
Experimental Histories during Metabolism Study Periods (Tables I and I-A)
Dog 29-326, male coach mongrel, adult. Non-Anemic State-3 days fasting. Diet: 1st week-300 gm. glucose,
150 gm. cane-sugar; 2nd week-350 gm. glucose, 175 gm. cane-sugar, 2.8 gm. Fe in form of ferric citrate; 3rd week-225 gm. glucose, 175 gm. cane- sugar, 2.8 gm. Fe; 4th period (2 days)-50 gm. glucose, 50 gm. cane-sugar; 15 gm. kaolin daily. Dog in good condition at end of experiment.
Anemic State-3 days fasting. Diet: 1st week-325 gm. glucose, 125 gm. cane-sugar; 2nd week-350 gm. glucose, 175 gm. cane-sugar, 2.8 gm. Fe in form of ferric citrate; 3rd period (5 days)-250 gm. glucose, 125 gm. cane-sugar, 2.0 gm. Fe; 4th period (2 days)-125 gm. glucose, 25 gm. cane- sugar; 15 gm. kaolin daily. Dog in somewhat weakened but not serious clinical condition at end of experiment. Recovery prompt and complete.
The abbreviations in the diet column represent the following: br. = bread, Sal. = salmon, Kl. = Klim, and c.-sug. = cane-sugar. The hemoglobin index = Hb, per cent/red cell hematocrit, per cent.
* Cod liver oil, 15 cc. daily.
Tables I and I-A present data concerning Dog 29-326 during heavy iron feeding periods both preceded and followed by sugar feeding. The animal, which had no previous history of anemia, was subjected to the first metabolism experiment while in the non-anemic state with a hemoglobin value of 151 per cent. After the conclusion of this experiment, the dog regained weight rapidly on a diet of table scraps. The dog, during a 2 month period, was bled to reduce its hemoglobin level and exhaust its potential hemo- globin reserves. The removal of 287 gm. of hemoglobin was re- quired for these purposes. When a fairly stable base-line level
of hemoglobin had been reached, the second metabolism experi- ment was begun and the animal was studied during a period of hemoglobin regeneration. Because of marked plasma volume concentration only very moderate amounts of blood were removed during the metabolism period but a rapid construction of hemo- globin is apparent when one observes the high hemoglobin level during and following the iron feeding period. This animal had a tendency to vomit after being fed by stomach tube. This tend- ency was aggravated near the close of this metabolism period. As a result it became rather weak necessitating intravenous adminis- tration of glucose. During the subsequent 4 weeks of salmon- bread feeding, the plasma volume again attained the prefasting level and the dog regained most of the weight lost. During this period the hemoglobin level was reduced to approximately the original value. Adjusting for the slight difference in hemoglobin levels at the beginning and end of the experiment, one may com- pute 112 gm. as the amount of hemoglobin regenerated due to the sugar and iron feeding.
The contrast in the total urinary nitrogen excretion during the two experiments is very striking. This is particularly true of the urea and ammonia fraction. The output of these constituents decreased very much more during the anemia experiment than during the control experiment. The figures for the 3rd weeks of the metabolism periods are 38 and 62 per cent, respectively, of the values for the 1st weeks.
The amount of hemoglobin produced is more than sufficient to account for the nitrogen which does not appear in the urine. A simple calculation will serve to clarify this point. In the first ex- periment the amount of urinary nitrogen elimination, during the 2 weeks of iron feeding, was 1.34 times the amount during the preliminary week of sugar feeding. In the next experiment, then, we might expect 1.34 X 25.5 gm. = 34.2gm. of nitrogen to appear during the combined 2nd and 3rd weeks. Instead, only 25.3 gm. appeared, a difference of 8.9 gm. from the expected amount. The nitrogen of the excess hemoglobin produced was 19.0 gm., more than double the amount calculated as missing from the urine.
It will be noted that in the preliminary sugar periods, before the picture was complicated by the addition of iron salt to the diet, the dog showed greater nitrogen elimination when anemic; 25.5 gm.
during the 7 day period in contrast to 19.3 gm. when non-anemic, or an increase of approximately 32 per cent. It is also of interest t,hat the excretion of creatine and of uric acid during anemia is disproportionately high.
TABLE II
Hemoglobin Construction and Decrease in Urinary Nitrogen Due to Anemia and Iron Feeding
Non-anemic Dog 31-186
7 7 7
!am. %lLY y&pm per cent m,,pm “$,Ii” per cent mtkqa ,n,,&y,
Hemoglobin production 152 gm., equivalent to 25.8 gm. of nitrogen in anemic period. S* = salmon-bread diet 1250 gm., equivalent to 58 mg. of Fe (per 3 days).
Experimental Histories during Metabolism Study Periods (Tables II and IT-A)
Non-Anemic Dog-Dog 31-186, female German police mongrel, adult. 1 day fasting. Diet: 1st week-900 gm. cane-sugar; 2nd week-50 gm. glucose, 1000 gm. cane-sugar, 2.4 gm. Fe in form of ferric citrate; 3rd week -350 gm. glucose, 700 gm. cane-sugar, 2.8 gm. Fe; 5 to 20 gm. kaolin daily. Urine contaminated with feces on several occasions. Dog in good con- dition at end of experiment.
Anemic Dog-Dog 2445, female bull mongrel, adult. Anemic 74 yea.rs. 2 days fasting. Diet: 1st week-275 gm. glucose, 300 gm. cane-sugar; 2nd week-250 gm. glucose, 275 gm. cane-sugar, 2.8 gm. Fe in form of ferric citrate; 3rd week-350 gm. glucose, 175 gm. cane-sugar, 2.8 gm. Fe; 4th period (4 days)-200 gm. glucose, 100 gm. cane-sugar; 5th period (3 days)- 1250 gm. salmon-bread; 15 to 20 gm. kaolin daily during first four periods. Urine contaminated frequently with feces. Dog in good condition at end of experiment.
The abbreviations in the diet column represent the following: br. = bread, sal. = salmon, Kl. = Klim, and c.-sug. = cane-sugar. The hemoglobin index = Hb, per cent/red cell hematocrit, per cent.
Table II offers further comparison of the results of metabolism experiments with heavy iron feeding in the non-anemic and the an- emic dog. In this instance two different animals were employed. Dog 31-186 had no history of anemia. Its hemoglobin level was 149 per cent at the beginning of the experiment. The blood pit-
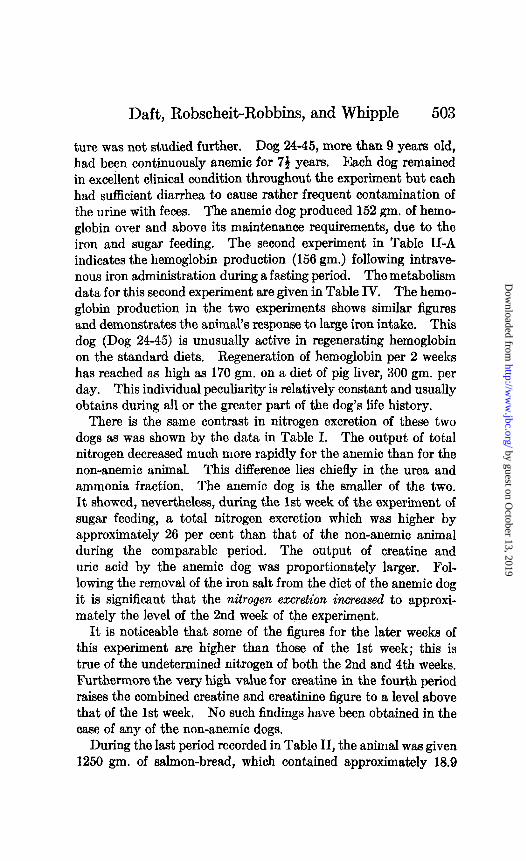
ture was not studied further. Dog 24-45, more than 9 years old, had been continuously anemic for 73 years. Each dog remained in exceilent clinical condition throughout the experiment but each had sufficient diarrhea to cause rather frequent contamination of the urine with feces. The anemic dog produced 152 gm. of hemo- globin over and above its maintenance requirements, due to the iron and sugar feeding. The second experiment in Table II-A indicates the hemoglobin production (156 gm.) following intrave- nous iron administration during a fasting period. The metabolism data for this second experiment are given in Table IV. The hemo- globin production in the two experiments shows similar figures and demonstrates the animal’s response to large iron intake. This dog (Dog 24-45) is unusually active in regenerating hemoglobin on the standard diets. Regeneration of hemoglobin per 2 weeks has reached as high aa 170 gm. on a diet of pig liver, 300 gm. per day. This individual peculiarity is relatively constant and usually obtains during all or the greater part of the dog’s life history.
There is the same contrast in nitrogen excretion of those two dogs as was shown by the data in Table I. The output of total nitrogen decreased much more rapidly for the anemic than for the non-anemic animal. This difference lies chiefly in the urea and ammonia fraction. The anemic dog is the smaller of the two. It showed, nevertheless, during the 1st week of the experiment of sugar feeding, a total nitrogen excretion which was higher by approximately 26 per cent than that of the non-anemic animal during the comparable period. The output of creatine and uric acid by the anemic dog was proportionately larger. Fol- lowing the removal of the iron salt from the diet of the anemic dog it is significant that the nitrogen excretion increased to approxi- mately the level of the 2nd week of the experiment.
It is noticeable that some of the iigures for the later weeks of this experiment are higher than those of the 1st week; this is true of the undetermined nitrogen of both the 2nd and 4th weeks. Furthermore the very high value for creatine in the fourth period raises the combined creatine and creatinine figure to a level above that of the 1st week. NO such findings have been obtained in the case of any of the non-anemic dogs.
During the last period recorded in Table II, the animal was given 1250 gm. of salmon-bread, which contained approximately 18.9
gm. of nitrogen. The amount of nitrogen excreted in the urine was only 9.92 gm. or slightly more than one-half of that ingested. The amount of creatine excreted is equivalent to 640 mg. of nitrogen per week in contrast to 1660 mg. per week in the final sugar feeding period.
TABLE III
Urinary Nitrogen Decrease and Hemoglobin Output in the Anemic Dog As Injluenced by Sugar or Sugar Plus Iron by Mouth
Hemoglobin production with sugar feeding 36 gm., equivalent to 6.1 gm. of nitrogen. Hemoglobin production with Fe feeding 128 gm., equivalent to 21.8 gm. of nitrogen.
Experim.entaZ Histories during Metabolism Study Periods (Tables ZZZ and Ill-A)
Dog 24-59, male bull mongrel, adult. Anemic 6 years. Sugar Control-3 days fasting. 50 gm. glucose, 25 gm. cane-sugar, 15
gm. kaolin daily thereafter. Dog in good condition at end of experiment. Iron Feeding-2 days fasting. Diet: 1st week-300 gm. glucose, 150
gm. cane-sugar; 2nd week-350 gm. glucose, 175 gm. cane-sugar, 2.8 gm. Fe in form of ferric citrate; 3rd week-350 gm. glucose, 175 gm. cane-sugar, 2.8 gm. Fe; 4th period (2 days)-100 gm. glucose, 50 gm. cane-sugar; 15 gm. kaolin daily. Dog in good condition at end of experiment.
Total sugar effect........................................................36
The abbreviations in the diet column represent the following: br. = bread, sal. = salmon, Kl. = Klim, and c.-sug. = cane-sugar. The hemoglobin index = Iib, per cent/red cell hematocrit, per cent.
* Cod liver oil. 15 cc.
Table III depicts two metabolism experiments with the same anemic dog (Dog 24-59). The first concerns an experiment of sugar feeding alone and the second a heavy iron feeding experiment similar to those in Tables I and II. This 8 year old animal had been continuously anemic for approximately 6 years.
The experiment in which iron was fed gave results not signifi- cantly different from the results of the two similar experiments reported in Tables I and II. There was the same large decrease in total nitrogen excretion accompanying the administration of iron salt. This decrease occurred principally in the urea and
ammonia fraction. In the after period of sugar feeding, the excre- tion of nitrogen returned approximately to the level of the 2nd week. The creatine figures are comparatively high. The out- put of uric acid, however, was quite low.
During the course of the sugar control experiment, the qualita- tive changes were the same. The output of urea and ammonia and of total nitrogen, however, diminished less rapidly than during iron feeding. This is especially noticeable in the 3rd weeks of the metabolism periods. A comparison of the 1st with the 3rd week in each of the two experiments demonstrates a decrease in the total nitrogen excretion of 36 per cent in the sugar feeding experi- ment in contrast to 53 per cent in the experiment where iron was
TABLE N
Hemoglobin coonstruction and Decrease in utinary Nitrogen in the Anemic Dog As InJluenced by Fasting Plus Iron by Vein
Hemoglobin production 156 gm., equivalent to 26.5 gm. of nitrogen.
fed with the-sugar. The figures for decrease in urea and ammonia excretion are 40 and 61 per cent, respectively.
It is significant that in the sugar control experiment, with a less significant decrease in the excretion of urea and ammonia, there is noted a modest regeneration of hemoglobin. Resulting from the 3 weeks sugar feeding alone we obtain a hemoglobin output of 36 gm. above the animal’s maintenance level whereas the hemoglobin production due to the feeding of iron and sugar together amounted to 128 gm.
Table IV gives the results of an experiment in which iron was administered intravenously instead of by stomach tube. Colloidal ferric hydroxide, sufficient in amount to contain 32 mg. of iron,
was injected daily and, in contrast to the iron feeding experiments, the animal was fasted except for water. The dog used for this experiment, Dog 24-45, had been previously used for a metabolism experiment with iron feeding (Table II) and the blood data for both experiments are given in Table II-A.
The results of these experiments (Tables II and IV) on Dog 24-45 show certain similarities. The excretion of nitrogen dimin- ished greatly during iron administration in each experiment and the production of hemoglobin was extensive in each case (152 and 156 gm. of hemoglobin respectively). There are, however, a number of differences. In the fasting experiment (Table IV) with iron given intravenously, the general level of nitrogen me- tabolism is lower; and the output of urea and ammonia and of the related total nitrogen did not decrease as markedly during the 1st week of iron administration. It is interesting that the values for undetermined nitrogen rise steadily throughout this experiment and that the high excretion of creatine in the after period brings the combined creatine and creatinine figure to almost double that of the 1st week.
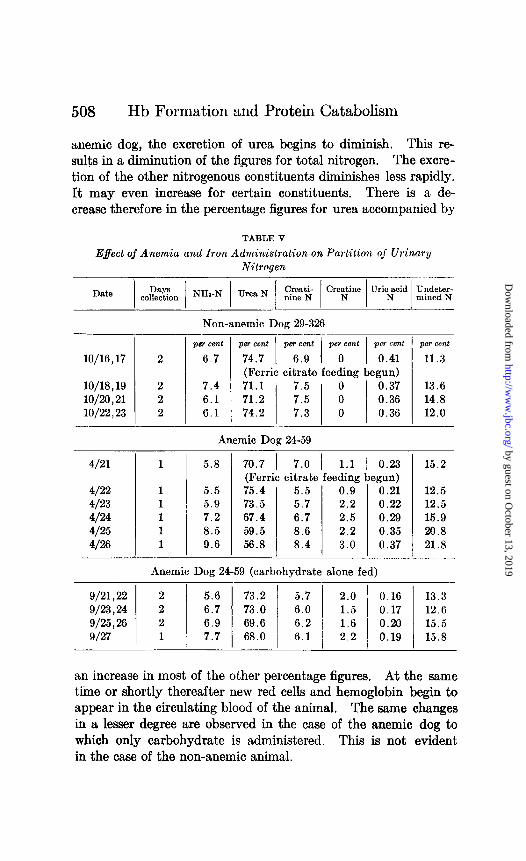
In Table V is shown the partition of the urinary nitrogen for a selected period in each of three representative experiments. The periods selected include parts of the 1st and 2nd weeks of the ex- periments. Table V shows, therefore, the results of the first few analyses after the administration of iron was begun. In one of the experiments a non-anemic dog was used and in one of the two experiments with anemic dogs no ferric citrate was added to the diet. The animals were not catheter&d every day so that the daily changes in the actual amounts of nitrogen excretion can- not be shown. Other experiments show reactions of similar character. By the middle of the 2nd weeks (October 21, April 25, and September 26 respectively) of these experiments differ- ences in the percentage figures for urea are very evident. There is a marked decrease in this percentage for the anemic dog to which iron was administered. This decrease is much less marked when the anemic dog is not given iron. It is virtually absent in the case of the non-anemic dog.
Considering these data (Table V) in conjunction with the data previously tabulated, one can picture the following series of events: A few days after the beginning of the administration of iron to the
anemic dog, the excretion of urea begins to diminish. This re- sults in a diminution of the figures for total nitrogen. The excre- tion of the other nitrogenous constituents diminishes less rapidly. It may even increase for certain constituents. There is a de- crease therefore in the percentage figures for urea accompanied by
TABLE V
Effect of Anemia and Iron Administration on Partition oj Urinary Nitrogen
Date j ,,~$,, 1 N&-N / Urea N 1 22% 1 Cre$ine 1 Uripd j $+E
an increase in most of the other percentage figures. At the same time or shortly thereafter new red cells and hemoglobin begin to appear in the circulating blood of the animal. The same changes in a lesser degree are observed in the case of the anemic dog to which only carbohydrate is administered. This is not evident in the case of the non-anemic animal.
The experimental data tabulated above show clearly that the anemic dog during periods of fasting or sugar feeding with or with- out iron intake can produce a very considerable bulk of new hemo- globin within new red cells. This new hemoglobin can amount to 50 to 150 gm. resulting from this period of zero protein intake. Ob- viously this new hemoglobin must be derived from the animal’s body protein as all reserves of hemoglobin building material have been exhausted by years of continuous severe experimental anemia.
In the non-anemic dogs it will be noted that t,he decrease in nitrogen excretion in the course of an experiment is divided al- most proportionately between the various fractions. When the dogs are anemic and the hemoglobin regeneration is high due to iron feeding we note a conspicuous drop in the urea-ammonia frac- tions. In contrast the output of creatine and creatinine as well as of undetermined nitrogen decreased even less than in the case of the non-anemic dogs.
During periods of iron and sugar intake there may be formed as much as 150 gm. of new hemoglobin which amounts to about 25.5 gm. of nitrogen. As this large amount of nitrogen must come from the dog’s body protein it is proper to ask whether this required nitrogen is derived from an increase of tissue catabolism or from a more complete conservation of nitrogenous intermediate prod- ucts. The tabulated data indicate the increased conservation of nitrogenous intermediates evidenced by a decrease in the urea- ammonia fractions. There is a probability of an increased tissue catabolism. This increase in catabolism may be accelerated by the administration of iron salts.
When one inquires as to the conservation of nitrogenous inter- mediate products it must be admitted that not all of the nitrogen of the new formed hemoglobin can be accounted for on the basis of conservation of intermediates. This fact together with evidence that the anemic dog cataboliaes more of its body protein t.han the non-anemic dog points to the probability that in emergencies the body can rob one protein tissue to make another prot,ein which is urgently needed. Experiments in progress we believe should give the answer to this long disputed point.
Under conditions of protein starvation the anemic dog is com- petent to fabricate new hemoglobin from nitrogenous material derived from its own body proteins. This construction of new hemoglobin is greatly augmented by t.he addition of iron salt to the sugar diet or by the intravenous injection of colloidal ferric hydroxide.
During protein starvation in the anemic animal, especially during the administration of iron, the excretion of urea and am- monia decreases greatly below the non-anemic control level. From the data presented it appears logical to assume that this change is due to a conservation of nitrogenous intermediates for use in new hemoglobin production. Iron may facilitate this particular type of conservation.
There are differences in creatine and uric acid excretion between the anemic and the non-anemic dog.
There is some evidence that the anemic dog has a higher nitrogen metabolism than the non-anemic dog.
It is possible that iron increases the nitrogen catabolism in the anemic dog as compared with normal controls.
BIBLIOGRAPHY
1. Davis, N. C., Hall, C. C., and Whipple, G. H., Arch. Znt. Med., 23, 689 (1919).
2. Folin, O., J. Biol. Chem., 17, 469 (1914). 3. Morris, J. L., and Macleod, A. G., J. Biol. Chem., M), 55 (1922). 4. Whipple, G. H., Hooper, C. W., and Robscheit, F. S., Am. J. Physiol.,
63, 167 (1920). 5. Whipple, G. H., and Robscheit-Robbim, F. S., Am. J. Physiol., 72,
395 (1925). 6. Whipple, G. H., Robscheit-Robbins, F. S., and Walden, G. B., Am. J.