Next Generation Very Large Array Memo No. 8 Science Working Group 3 Galaxy Assembly through Cosmic Time Caitlin M. Casey 1 , Jacqueline A. Hodge 2,3 , Mark Lacy 2 , Christopher A. Hales 4 , Amy Barger 5 , Desika Narayanan 6 , Chris Carilli 4,7 , Katherine Alatalo 8 , Elisabete da Cunha 9 , Bjorn Emonts 10 , Rob Ivison 11,12 , Amy Kimball 13 , Ko- taro Kohno 14 , Eric Murphy 15 , Dominik Riechers 16 , Mark Sargent 17 , Fabian Walter 18 Abstract The Next-Generation Very Large Array (ngVLA) will be critical for un- derstanding how galaxies are built and evolve at the earliest epochs. The sensitivity and frequency coverage will allow for the detection of cold gas and dust in ‘normal’ distant galaxies, including the low-J transitions of molecular gas tracers such as CO, HNC, HCN, and HCO+; synchrotron and free-free continuum emission; and even the exciting possibility of thermal dust emis- sion at the highest (z ∼ 7) redshifts. In particular, by enabling the total molecular gas reservoirs to be traced to unprecedented sensitivities across a huge range of epochs simultaneously – something no other radio or sub- millimeter facility will be capable of – the detection of the crucial low-J transitions of CO in a diverse body of galaxies will be the cornerstone of ngVLA’s contribution to high-redshift galaxy evolution science. The ultra- wide bandwidths will allow a complete sampling of radio SEDs, as well as the detection of emission lines necessary for spectroscopic confirmation of elusive dusty starbursts. The ngVLA will also deliver unique contributions to our understanding of cosmic magnetism and to science accessible through 1
Transcript
Next Generation Very Large Array Memo No. 8
Science Working Group 3
Galaxy Assembly through Cosmic Time
Caitlin M. Casey1, Jacqueline A. Hodge2,3, Mark Lacy2, Christopher A.Hales4, Amy Barger5, Desika Narayanan6, Chris Carilli4,7, Katherine Alatalo8,Elisabete da Cunha9, Bjorn Emonts10, Rob Ivison11,12, Amy Kimball13, Ko-taro Kohno14, Eric Murphy15, Dominik Riechers16, Mark Sargent17, FabianWalter18
Abstract
The Next-Generation Very Large Array (ngVLA) will be critical for un-derstanding how galaxies are built and evolve at the earliest epochs. Thesensitivity and frequency coverage will allow for the detection of cold gas anddust in ‘normal’ distant galaxies, including the low-J transitions of moleculargas tracers such as CO, HNC, HCN, and HCO+; synchrotron and free-freecontinuum emission; and even the exciting possibility of thermal dust emis-sion at the highest (z ∼ 7) redshifts. In particular, by enabling the totalmolecular gas reservoirs to be traced to unprecedented sensitivities acrossa huge range of epochs simultaneously – something no other radio or sub-millimeter facility will be capable of – the detection of the crucial low-Jtransitions of CO in a diverse body of galaxies will be the cornerstone ofngVLA’s contribution to high-redshift galaxy evolution science. The ultra-wide bandwidths will allow a complete sampling of radio SEDs, as well asthe detection of emission lines necessary for spectroscopic confirmation ofelusive dusty starbursts. The ngVLA will also deliver unique contributionsto our understanding of cosmic magnetism and to science accessible through
1
microwave polarimetry. Finally, the superb angular resolution will move thefield beyond detection experiments and allow detailed studies of the mor-phology and dynamics of these systems, including dynamical modeling ofdisks/mergers, determining the properties of outflows, measuring black holemasses from gas disks, and resolving multiple AGN nuclei. We explore thecontribution of a ngVLA to these areas and more, as well as synergies withcurrent and upcoming facilities including ALMA, SKA, large single-dishsubmillimeter observatories, GMT/TMT, and JWST.
1Department of Astronomy, The University of Texas at Austin, 2515 Speedway Blvd,
Austin, TX 78712, USA2National Radio Astronomy Observatory, 520 Edgemont Road, Charlottesville, VA 22903,
USA3Leiden University, J.H. Oort Building, Niels Bohrweg 2 NL-2333 CA Leiden, The Nether-
lands4National Radio Astronomy Observatory, 1003 Lopezville Rd, Socorro, NM 87801, USA5Department of Astronomy, University of Wisconsin–Madison, 475 North Charter Street,
Madison, WI 53706, USA6Department of Physics & Astronomy, Haverford College, 370 Lancaster Ave, Haverford,
PA 19041, USA7Cavendish Astrophysics Group, JJ Thomson Avenue, Cambridge, CB3 0HE, UK8Carnegie Observatories, 813 Santa Barbara St, Pasadena, CA 91101, USA9Center for Astrophysics and Supercomputing, Swinburne University of Technology, Hawthorn
VIC 3122, Australia10Centro de Astrobiologia, Instituto Nacional de Tecnica Aeroespacial, 28850 Torrejon de
many12Institute for Astronomy, University of Edinburgh, Royal Observatory, Blackford Hill,
Edinburgh EH9 3HJ, UK13CSIRO Astronomy & Space Science, Epping, PO Box 76, NSW 1710 Australia14Institute of Astronomy, The University of Tokyo, 2-21-1 Osawa, Mitaka, Tokyo, 181-
0015 Japan15IPAC, Caltech, MC 220-6, Pasadena, CA 91125, USA16Astronomy Department, Cornell University, 220 Space Sciences Building, Ithaca, NY
14853, USA17CEA Saclay, DSM/Irfu/Service dAstrophysique, Orme des Merisiers, F-91191 Gif-sur-
The Karl G. Jansky Very Large Array (VLA) is a 27-element radio inter-ferometer located on the Plains of San Agustin, New Mexico, which hasenabled cutting-edge radio astronomy for over three decades. Each of the25-m diameter antennae are situated on rail tracks that form the shape ofa ‘Y’, providing baselines up to 36 km and angular resolutions as high as∼0.04′′ at the top end of the 74–50,000 MHz frequency range. Originallyknown as simply the Very Large Array, the array was renamed as the JanskyVery Large Array in 2012 to mark the completion of a major expansion of itscapabilities. This upgrade to several of the major hardware areas allowed forcomplete frequency coverage between 1–50 GHz, an order of magnitude im-provement in continuum sensitivity, and increased spectroscopic capabilityand correlator flexibility.
In late 2014, NRAO established several working groups in order to ex-plore the scientific potential of a next-generation large array for centimeter-wave (0.3–30 cm) astronomy, well beyond the current capabilities of eventhe JVLA. Currently designated the ‘Next Generation Very Large Array’(ngVLA), such an array would entail ten times the effective collecting areaof the JVLA and ALMA, operating from 1 GHz to 115 GHz, with ten timeslonger baselines (300 km) providing mas-resolution, plus a dense core onkm-scales for high surface brightness imaging (Carilli et al.). The ngVLA isenvisioned to represent a factor of 5–10× improvement over the present-dayVLA in multiple parameters, including frequency coverage, instantaneousradio frequency (RF) and processed bandwidth, total collecting area, max-imum baseline length, field of view, and correlator modes. These workinggroups have subsequently identified a number of key science goals that wouldbenefit greatly from a substantial upgrade to one or more of these parame-ters, and for which no other existing or upcoming facility will suffice.
The high-redshift science goals of the ngVLA − which are the key focusof this report (working group 3) − are intimately intertwined with someof the most important questions surrounding galaxy evolution studies to-day. Specifically, how and when did most galaxies in the Universe assem-ble? What physical processes dominate the buildup of stellar mass in theUniverse, and how has that changed and evolved over the past 12-13 bil-lion years? What role does environment play in galaxy growth? Can ourunderstanding of the first galaxies shed light on early Universe cosmology,including hierarchical growth and collapse of large scale structure? In thiswhite paper, we explore the many important contributions that the ngVLAwill make to studies of galaxy assembly over cosmic time and out to the
5
Figure 1: At left we show the total star formation rate density (SFRD) of the universeas a function of redshift as traced by deep UV/optical surveys out to z ∼ 8 (Bouwens etal., 2009). The two curves indicate the SFRD measured directly from star-light (blue) andafter correction for estimated dust content (tan), where the latter is extrapolated from therest-frame ultraviolet slope of galaxies. Note that direct dust observations of the SFRDcurrently only extend to z ∼ 2 − 4. While much work has been done on the history ofstar formation, there has been relatively little work done on the history of the Universe’sgas content, shown at right. Observational constraints on the molecular gas content ofgalaxies − the fuel for star formation − are far from complete, and models are not in clearagreement as to what the redshift evolution of the gas content should resemble. Figureadapted from Carilli & Walter (2013).
earliest epochs of galaxy formation.
2 Motivation
Deep, legacy optical surveys of the Universe have laid down a frameworkfor our understanding of the formation of galaxies at early times. Theyhave indicated that galaxies were forming stars at rates hundreds of timeshigher at z ∼ 2 than in the present day. This is the epoch where thestar formation rate density (SFRD) peaks, and at earlier times, very deepsurveys attempt to learn when galaxies first became illuminated (see Figure 2for a depiction of the redshift evolution of the SFRD from optical surveys).However, at redshifts beyond z ∼ 1.5, the measurements which constrain thisunderstanding have largely been limited to optical and near-infrared pencil-beam surveys of direct starlight, thus limited in dynamic range, accessiblevolume, and to galaxies readily visible via their direct emission from stars.This, despite the fact that half of all energy emitted by extragalactic sourcesis obscured and emitted by dust or gas at much longer wavelengths.
The submillimeter and radio long-wavelength regime tell a crucial partof the galaxy evolution story, but they have been largely set aside by a largefraction of the galaxy evolution community in past decades due to limita-tions in long-wavelength instrumentation and sensitivity. Yet recent yearshave seen a dramatic increase in our understanding of galaxy evolution froma bolometric point of view, from both dust and gas emission, thanks to fa-
6
cilities like the Very Large Array (VLA), Scuba on the JCMT, the HerschelSpace Observatory, IRAM’s Plateau de Bure Interferometer (PdBI), and theAtacama Large Millimeter Array (ALMA). Here we present the argumentthat the next few decades will see a significant shift in galaxy evolution workaway from the rest-frame optical/UV and towards long-wavelength studies.The ngVLA will play a critical part in defining what we will be able to learnabout galaxy assembly and large scale structure.
Cold molecular gas is the most fundamental building block for star for-mation, yet the Universe’s molecular gas content is very poorly understoodrelative to its measured stellar content (Figure 2). Solving the existing mys-teries of how the Universe’s stars assembled requires a detailed look at sucha fundamental building block. Cosmological simulations are now makingdetailed predictions as to how this gas migrates, heats, cools, and entersand leaves galaxies via accretion and feedback mechanisms. While thesesimulations represent a huge leap forward in theoretical modeling, these pre-dictions have yet to be tested through direct observation of the moleculargas at high-redshift.
In addition to the much needed molecular gas census at high-redshift,the galaxy evolution community also needs a more detailed understanding ofhow galaxies in the distant Universe may be fundamentally different physi-cally than those in the low-redshift Universe. Dynamics play a key role inthe distinction. While high-redshift galaxies seem to be substantially differ-ent from nearby galaxies in terms of their star formation rates and stellarmass characteristics (Noeske et al., 2007; Daddi et al., 2008), it is unclearwhether or not these differences are driven primarily by cosmic downsizingassociated with the different conditions of the intergalactic medium (Cowie& Songaila, 1986), or if the galaxies grow in fundamentally different ways athigh-redshift. Probing the internal kinematics through rest-frame millime-ter molecular lines gets to the heart of this debate, but to-date, has onlybeen done for a handful of galaxies beyond z > 2.
3 Cold Gas Emission
Cold molecular gas is the fuel which powers star formation, the productionof metals, the formation of stellar byproducts, and therefore galaxy growth.The bulk of the Universe’s cold gas reservoir is comprised of hydrogen gas inthe form of atomic hydrogen, Hi, and molecular hydrogen, H2, the latter ofwhich is responsible for star formation in cold, condensed molecular clouds.Though H2 is not directly observable under normal circumstances, CO gas
7
is typically used as a proxy given that its particularly bright transitions aretightly correlated with the ambient density of molecular hydrogen. Thissection discusses the primary goals of ngVLA science as they relate to coldgas at high-redshift, through observations of CO and tracers of denser gasphases.
3.1 CO
Transitions of carbon monoxide are particularly bright due to CO’s low criti-cal density, making it the easiest molecule to detect in high-redshift galaxies.Indeed, the vast majority of the few hundred molecular line detections inthe high-redshift Universe have been of CO (see more in reviews of Solomon& Vanden Bout, 2005; Carilli & Walter, 2013). Due to frequency shifting atsufficiently high-redshift, millimeter-operating facilities like IRAM’s PdBI,CARMA and ALMA can only observe the higher-J transitions of CO. Thelower-J transitions, including the ground state CO(1-0) transition, are onlyaccessible to longer wavelength radio observatories like the VLA. See Fig-ure 3.1 for an illustration of this problem for surveying CO (particularlylow-J CO) at high-redshift.
While high-J lines are useful for confirming the existence of galaxies’molecular gas reservoirs, higher-J CO transitions alone cannot constrain thetotal molecular gas reservoir, which requires two significantly uncertain con-versions. The first is the conversion of high-J CO line strength to the groundstate CO(1-0) line strength. This conversion requires knowledge of internalgas temperature and excitation, which might vary substantially in differentregions of the galaxy by up to factors of five, and even between the relativelylow-J transitions from CO(3-2) to CO(1-0). The second uncertainty is theCO–H2 conversion factor, XCO or αCO, which is required to convert fromCO(1-0) to the mass of molecular hydrogen. This conversion varies by up toa factor of five depending on the conditions of the gas in the ISM, includingmetallicity.
The uncertainties involved in scaling high-J CO transitions to moleculargas mass are illustrated in Figure 3.1, which shows both the diversity of COspectral line energy distributions (SLEDs) amongst high-redshift galaxiesand the existing constraints on the CO–H2 conversion factor amongst high-redshift galaxy populations. When all uncertainties are accounted for, high-J CO-derived gas masses are uncertain by factors of ∼25, an uncertaintyfar too large to precisely measure important quantities like galaxies’ gasfractions.
Due to the uncertainties involved with converting high-J CO lines to gas
8
0 2 4 6 8REDSHIFT
ALMA Bands
NGVLA
CO(1-0)
CO(2-1)
CO(3-2)
CO(4-3)
CO(5-4)CO(6-5)CO(7-6)CO(8-7)
5:1 3:1
10
100
Obs
erve
d Fr
eque
ncy
[GH
z]
Figure 2: The observed frequencies of various transitions of CO from z = 0 to z = 8.While the ALMA bands are sensitive to many transitions of CO at low redshift, the low-JCO lines redshift out of the bands beyond z ∼ 0.5 − 2. These low-J CO lines are criticalfor characterization of the total molecular gas reservoir in high-z galaxies and are onlycurrently accessible for high-redshift galaxies using the VLA (lower gray region plus grayhashed). The blue regions represent ALMA bands, and the blue hashed region representsthe hypothetical ALMA band 0). The gray region indicates the ngVLA with a frequencycoverage of 5–100 GHz, with a gap around the 59–75 GHz water band. The gray hashedregion represents the reach capabilities for ngVLA at low frequencies. With the adventof very wide-bandwidth setups for the ngVLA, we will be able to obtain multiple COtransitions for galaxies beyond z ∼ 3.5 in one correlator setup, which will be revolutionaryfor studying dust and gas in very high-redshift galaxies.
9
Figure 3: An illustration of the diversity in CO spectral line energy distributions(SLEDs) for high-redshift galaxies (top) and existing constraints on the XCO (or αCO)conversion factor used to convert CO line luminosity to molecular hydrogen gas mass(bottom). The uncertainty in scaling from high-J CO lines to CO(1-0) luminosity is a fac-tor of ∼5 (from CO(3-2), and more at higher-J transitions), and the uncertainty in XCO
is similar, meaning gas masses derived from high-J transitions of CO alone will necessarilybe uncertain by factors of ∼25. This margin of uncertainty is astrophysically importantquantities for understanding galaxy evolution like gas fraction and total gas mass. theuncertainty is likely even larger for the lower mass galaxies which ngVLA will readilystudy out to moderate redshifts, and for which we have the most to learn about basic gascontent characteristics and interplay with the ISM.
10
masses, recent work has focused on using dust continuum measurements toscale to gas masses (Magdis et al., 2011, 2012; Scoville et al., 2014; Santiniet al., 2014). However, this technique typically assumes that the dust-to-gas ratio is fixed across a wide range of galaxies and redshifts, which hasbeen shown to be a poor assumption in some cases (Remy-Ruyer et al.,2014; Capak et al., 2015). In particular, the dust-to-gas ratio is known todepend strongly on metallicity (e.g., Issa, MacLaren & Wolfendale, 1990;Lisenfeld & Ferrara, 1998; Draine et al., 2007). Furthermore, the importantkinematic signatures that come along with molecular line measurements areabsent from dust continuum measurements.
The ideal probe of the cold molecular gas reservoir is the ground statetransition of CO, CO(1-0), where the scaling to molecular hydrogen masshas only the uncertainty in XCO with which to contend. Furthermore, con-straining XCO more precisely in high-z galaxies is possible with constraintson dynamical mass and stellar mass, which reduces the uncertainty on gasmass further. The JVLA, GBT, and ATCA have detected CO(1-0) in anumber of high redshift starburst galaxies, albeit a few at a time with longintegrations (Ivison et al., 2011; Hodge et al., 2012; Papadopoulos et al.,2012; Greve et al., 2014; Emonts et al., 2014). These initial detections ofCO(1-0) at high-redshift have not only constrained the total molecular gasmass of hydrogen in these high-z systems, but also highlighted the impor-tance of understanding the spatial distribution of gas in distant galaxies.
While the submillimeter-luminous galaxy population, i.e. dusty starforming galaxies (DSFGs) have been found to be relatively compact in high-J transitions (Tacconi et al., 2008; Bothwell et al., 2010), consistent with theidea that they are scaled-up analogs to local ULIRGs (Sanders & Mirabel,1996), their CO(1-0) maps are dramatically different, showing gas extendingas far as 16 kpc from the galaxy centers (Ivison et al., 2011; Spilker et al.,2015). Studies of high-redshift proto-cluster radio galaxies even revealedbright CO(1-0) reservoirs out to distances of ∼60 kpc from the central galaxy(Emonts et al., 2014). While these larger sizes are more suggestive of disk-like rotation dynamics and widespread molecular gas reservoirs in the haloenvironment of massive galaxies, the number of galaxies surveyed at thecurrent VLA sensitivity makes it difficult to infer large-scale populationdynamics or draw comparisons between low-z and high-z galaxy populations.
The ngVLA is desperately needed to dramatically increase the number ofgalaxies surveyed in CO(1-0) at high-redshift − by factors in the thousands,in line with what is currently observed from high-redshift galaxies via di-rect starlight. Figure 3.1 illustrates the anticipated improvement in ngVLAsensitivity over the current VLA and ALMA depths across 10–120 GHz.
11
0 20 40 60 80 100 120Frequency (GHz)
0
50
100
150
Flux
Den
sity
Sen
sitiv
ity L
imit
(µJy
)
CO(1-0)
CO(2-1)CO(3-2)
CO(4-3)
CO(5-4)Current VLA
ALMA
NGVLA
NGVLA
Example CO-line emission in z=5 galaxywith SFR=30Msun/yrRMS reached after 1 hour, 300km/s resolutionwith NGVLA core (5xVLA collecting area)
Example CO-line emission in z=5 galaxywith SFR=30Msun/yrRMS reached after 1 hour, 300km/s resolutionwith NGVLA core (5xVLA collecting area)
Figure 4: The projected sensitivity limits of the proposed ngVLA core, which willhave five times the effective collecting area of the current VLA. This plot also showsthe sensitivity limits of ALMA alongside the current VLA and projected ngVLA as afunction of frequency (the gap from 50–75 GHz is due to atmosphere). Overplotted arethe anticipated CO line strengths, from CO(1-0) to CO(5-4) of a typical z = 5 galaxy(with SFR=30 M� yr−1). This type of galaxy is currently well below the detection limitof existing facilities, including ALMA, yet is crucial for understanding the star formingbudget of the Universe’s first galaxies.
12
Figure 5: A schematic of the field of view and spectroscopic line identifications for asingle ngVLA pointing tuned to ν=11-33 GHz (midpoint of log(ν) at 19 GHz) with a total3:1 RF bandwidth and 10µJy beam−1 RMS. The field of view is primarily dependent ondish diameter. From the perspective of mapping large regions of the Universe in CO, adish size of 12 m is clearly favored. The field of view also then depends on frequency andredshift; here we denote the lowest frequencies with the pink circles (corresponding to thefrequency where we would detect CO(1-0) at z = 9.5), and higher frequencies in yellow(CO(1-0) at z = 6.5), green (z = 4.5), and blue (z = 2.5). Mock sources in three redshiftbins (2.5 < z < 4.5 in blue, 4.5 < z < 6.5 in green, and 6.5 < z < 9.5 in red) are overlaid.Note that above z > 6.5, this configuration is capable of detecting both CO(1-0) andCO(2-1) if a source falls within the central high-frequency field of view.
3.2 A molecular gas deep field
To demonstrate the dramatic impact of ngVLA on detection rates of CO(1-0) in high-z samples, we have generated a mock observation with a 3:1bandwidth ratio tuned to 11–33 GHz. This frequency range will pick upthe CO(1-0) transition from 2.5 < z < 9.5. The RMS reached after a onehour integration with five times the collecting area of the current VLA is∼10µJy beam−1 across the whole bandwidth. This means that in 30 hours(including overheads), ngVLA will be able to achieve a 1σ = 10µJy beam−1
RMS in 2 MHz bins, sufficient to resolve individual CO lines into 3–5 spectralbins across the entire bandwidth.
To estimate the number of galaxies accessible to CO(1-0) detection withinone ngVLA pointing, we use the latest estimates of the integrated infraredluminosity function (Casey, Narayanan & Cooray, 2014) which is roughlycomplete out to z ∼ 2. For lack of a better assumption, we assert that thesame luminosity function holds out to z ∼ 10, and we translate LIR to abest-guess CO(1-0) luminosity function using a conservative estimate of aULIRG-type L′CO(1−0)-to-LIR scaling (Bothwell et al., 2013) and assuming
13
a linewidth of 200 km s−1. Figure 3.2 gives a schematic of detectable galax-ies within a single pointing to a fixed depth of 10µJy beam−1 RMS. Thisschematic highlights two things: the field of view is substantially larger forsmaller-dish antennae (12 m as opposed to the current 25 m), and the field ofview is substantially larger at low frequencies, corresponding to the regimewhere the highest-redshift CO emitters would be detectable. However, witha fixed flux density RMS, only the brightest galaxies will be detectable at thehighest redshifts and so are comparatively fewer in number than the fainter,z < 4.5 sources. For example, assuming 18 m antennae, we expect twelve2.5 < z < 4.5 sources to fall within a 2–3′ field of view, five 4.5 < z < 6.5sources to fall within a 3–4′ field of view, and two 6.5 < z < 9.5 sources tofall within a 5–6′ field of view.
Recently, da Cunha et al. (2013) published empirical predictions for thenumber of line emitters in a CO deep field. Using the deepest availableoptical/near-infrared data for the Hubble Ultra Deep Field (UDF), theyemployed a physically motivated spectral energy distribution model alongwith empirical relations between the observed CO line and infrared lumi-nosities of star-forming galaxies in order to predict the expected number ofline detections. In particular, for frequencies between 18–50 GHz over the 12arcmin2 UDF, and assuming a linewidth of 300 km s−2, they predict of order∼200 CO(1-0) detections down to a 5σ limit of 50µJy beam−1. In order tocompare the two methods, if we adjust our frequency tuning to cover thesame range, we predict ∼70 CO(1-0) line detections in a single (12-m dish)pointing, which is approximately one-third of the area of the UDF. The twomethods thus produce predictions that are of the same order. Given all ofthe assumptions that went into the models, and particularly since the esti-mates were derived in two completely different ways, this relative agreementis encouraging.
The mock observation described in this paper will not only be sensi-tive to CO(1-0), but also CO(2-1) emission at early epochs. However, thesensitivity and field of view for CO(2-1) will be significantly different forthe same redshift regime given the differences in frequency, and will moreclosely mirror the coverage for the low-redshift CO(1-0) emitters. The sur-vey sensitivity with respect to CO(2-1) depends on source excitation as theratio of SCO(2−1)/SCO(1−0) can vary from 2–4. Perhaps counter-intuitively,the depth of CO(2-1) observations at high-z will be greater than for CO(1-0), although the number of expected sources per single pointing will notdiffer substantially from the expected CO(1-0) emitters given the limitedfield of view. Line degeneracy may then be of concern, since it will be diffi-cult to disentangle low-redshift CO(1-0) emitters and high-redshift CO(2-1)
14
emitters. Other multiwavelength information (and perhaps parallel ALMAobservations) would be necessary to break this degeneracy.
Note that weaving a series of single pointings together will have uniqueadvantages with such a wide bandwidth. For a single pointing exampleabove, the low frequency space probes the largest volumes, but at shallowerluminosity limits at high-redshifts. Tiling a mosaic together by maximiz-ing overlap for the low-frequency observations will dramatically reduce theRMS at higher-redshifts, while mapping a large area. Figure 3.2 shows theeffect of mosaicing on the CO(1-0) luminosity limit out to high-redshifts,sensitive to objects in the gray parameter space. As an example, we predictthat a ≈750 hour mosaic made up of 41 individual pointings with 12 m an-tennae (5×5 pointings overlapped with an inset 4×4 pattern) could detectnearly 1500 individual CO(1-0) emitters, with the largest number abovez > 5 where the mosaic would be at its deepest. This mosaic would beapproximately 20′×20′ across. In contrast, antennae which are 18 m in sizewould yield only ∼600 detections, and 25 m dishes would yield only ∼300detections.
While direct molecular gas detections are certainly the main focus of fu-ture ngVLA extragalactic deep fields, it is worth noting that these surveyswill be done in well-surveyed legacy fields, where there is already substan-tial ancillary data including spectroscopic redshifts. With large numbers ofspectroscopic redshifts, stacking to measure the median molecular gas reser-voir in LBGs would become possible as a function of redshift, environment,or other physical factors.
Before leaving this topic, it is important to return to our a priori as-sumption that the luminosity function of CO will not substantially changebetween z = 2.5 and z ∼ 10. This undoubtedly is not the case, but as thereare currently no constraints on any alternative picture, we cannot hypothe-size on the change we will perceive in detection yields in molecular gas deepfields. In addition, it is likely the case that early Universe galaxies containfewer metals and may be less luminous in CO for their given mass. A finalimportant caveat is that at sufficiently high redshift, the temperature of theCMB is non-negligible and can contribute to dust continuum and gas heat-ing within galaxies. While this extra heating of the gas (and dust) will boostthe intrinsic fluxes, the CMB also becomes a stronger background againstwhich these fluxes must be measured. The net effect of these two competingeffects on CO emission is less straightforward than for the dust continuumemission (da Cunha et al., 2013), as the regions of cold molecular gas maynot be in local thermal equilibrium, or the kinetic temperature of the gasmay not be thermally coupled to the dust in an obvious way, particularly
15
Figure 6: The depth of a fixed-10µJy beam−1 RMS CO(1-0) search as a function ofredshift for a single pointing (dashed line) vs. a mosaic (blue). The units on the y-axisL′CO(1−0) are K km s−1 pc2; assuming a median value of αCO ≈ 2 M�/L′CO(1−0), a y-axis
value of 9.0 corresponds to a gas mass of roughly 2×10⁹ M�, and 10.0 is a gas massof roughly 2×10¹⁰ M�. The redshift range probed by CO(1-0) at these frequencies isindicated by the gray region. Using the high end of the frequency range to define thespatial distance between pointings causes significant spatial overlap for lower frequencies,pushing the RMS in those areas much lower and thus pushing the high-redshift discoveryspace deeper.
16
in early-Universe galaxies. However, the overall effect of CMB heating willbe to cut down the number of direct detections in the z >∼ 6 Universe at lowgas temperatures (T <∼ 20 K).
On a technical note, using phased array feeds (PAFs) with multiple pixelsinstead of single pixel feeds would allow the ngVLA to survey areas of skycorresponding to volumes of ∼ 0.1 Gpc3, covering the full range of cosmicenvironments. For example, if we were to use a 3×3 pixel PAF we couldsurvey the entire 2 deg2 COSMOS field to this depth in a few hundred hours,detecting ∼ 105 CO emitting galaxies. This would allow us, for example, tocompute 2-point correlation functions within the CO emitting population,and cross-correlations between CO emitting galaxies and other populationssuch as galaxies with large stellar masses, galaxy clusters and AGN, all ofwhich can be compared directly with the output of simulations. This iscritical for assessing the collapse of large scale structure and environmentalimpact on star formation in galaxies.
3.3 Using CO as a redshift beacon
The need for CO-based redshift confirmation for the most dust-obscuredstarburst galaxies has already been made clear by the past decade of ef-fort poured into obtaining spectroscopic confirmation for dusty star-forminggalaxies (DSFGs; e.g., Chapman et al., 2005; Swinbank et al., 2004; Caseyet al., 2011; Casey, 2012; Casey et al., 2012; Danielson et al., 2015). Thesestudies have clearly demonstrated that ∼50% of all dusty starbursts aretoo obscured to obtain spectroscopic confirmation via emission lines in theoptical/near-infrared. The question of whether the unconfirmed DSFGs sitat similar redshifts or higher redshifts than the others is yet to be clarified,but it is quite clear that DSFG samples beyond z > 3 suffer from severespectroscopic incompleteness. The discovery of bright dusty galaxies likeHFLS3 (Riechers et al., 2013) hint at the existence of such a populationat very high redshifts, but so far, confirming such sources (at more typi-cal, unlensed luminosities) in a systematic way through blind CO searcheshas not been efficient. In fact, even the existing capability of ALMA canonly complete a spectral scan for high-J CO emission for a single sourcein about an hour of integration time – still prohibitive for large samples,save the strongly lensed subset (Weiß et al., 2013). If we consider the mockobservation in § 3.2 and Figure 3.2, we expect to detect ∼100 galaxies inone pointing with a 3:1 RF bandwidth ratio above a CO line luminosity ofL′CO(1−0) = 109.2 K km/s pc2. Those CO detections can potentially probe aredshift range as wide as 2.8 < z < 10.5. This makes the case clear that
17
Figure 7: Simulated CO(1-0) emission (left) and CO(3-2) emission (right) from amodel z∼2 dusty star forming galaxy in high-resolution cosmological zoom simulations(Narayanan et al., 2015). The units of WCO are K km s−1. Dusty star forming galaxiestrace rich environments with central galaxies being bombarded by subhalos and diffusegas. Because much of the gas in the large scale environment is below the effective excita-tion conditions for dense gas tracers (even CO(3-2)), probing the environment of the mostextreme star-formers in the Universe at high-redshift will require observing the groundstate CO transition, with a compact configutation sensitive to large scale structures.
NGVLA will be revolutionary in providing unequivocal spectroscopic con-firmation for galaxies containing substantial molecular gas potential wells,potentially surpassing the optical/near-infrared in efficiency of follow-up.
3.4 Simulations of CO gas emission at high-z
Dusty star-forming galaxies at high-redshift are the most luminous, heavilystar-forming galaxies in the Universe (Casey, Narayanan & Cooray, 2014).As some of the most luminous star-formers, ngVLA is in a unique positionto study DSFGs’ CO emission in detail through high-resolution, pointedfollow-up.
Theorists argue at great length over physical models for DSFGs, withdiverse predictions existing for their masses, large scale environments, andpotential merger status. Broadly, models for the origin of DFSGs fall intotwo camps: one in which major mergers drive the luminosity of the galaxy,and one in which DSFGs are the centers of massive halos growing hierarchi-cally via numerous minor mergers and smooth accretion.
High-resolution observations may have the power to distinguish betweenthese two broad classes of models. For example, high resolution cosmo-logical zoom simulations (Dave et al., 2010; Narayanan, 2015) suggest thatDSFGs owe their origin to hierarchical growth in a LCDM cosmology willshow significant substructure around the central galaxy when observed athigh-resolution. However, much of this gas associated with subhalos may be
18
Figure 8: Illustration of ngVLA capabilities to detect CO(1-0) emission from a idealizedmodel galaxy at z = 2. In 40 hours of integration at 0.11′′ resolution, ngVLA will be ableto resolve great structural detail in the molecular gas reservoir of high-z systems, whichis currently inaccessible to both ALMA and the current JVLA. In this simulation, thengVLA reaches an RMS gas mass sensitivity of 3×10⁸ (αCO/4) M� at 1 kpc resolution;this is 10 times deeper than the current VLA would reach in the same time.
relatively diffuse compared to the relatively dense gas in the central halo.Figure 3.3 presents synthetic CO emission from one such model for DSFGformation (Narayanan et al., 2015). The subhalos being accreted onto thecentral halo are clearly present in the ground state CO(1-0) transition. How-ever, even CO(3-2) has an effective density too large to light up in the diffusesubhalos.
Because of this, (sub)mm-wave interferometers such as ALMA may missthe large scale gaseous substructure in high-z DSFGs, necessitating the useof sensitive radio-wave interferometers like the ngVLA. In this respect, re-cent observational work on low-surface-brightness CO(1-0) emission in andaround high-z proto-cluster radio galaxies (Emonts et al., 2014, 2015), al-ready revealed very widespread (∼ 60 kpc) reservoirs of diffuse molecularhalo gas, reminiscent of the simulations shown in Figure 3.3. These low-resolution observations were done with the Australia Telescope CompactArray, with its five antennas packed in ultra-compact array configurationsthat surpass those of the current VLA. The ngVLA can revolutionise thestudies of low-surface-brightness CO(1-0) emission with a densely packedcore that consists of many short-baseline elements, with more than an orderof magnitude more sensitivity than existing compact arrays.
Figure 3.3 shows this same hydrodynamically simulated z = 2 galaxy asshown in Figure 3.3, but with simulated noise properties characteristic ofthe ngVLA 40 hours of integration at 0.11′′ resolution. Such observations ofhigh-z systems is currently quite limited with the JVLA (GN20, shown in
19
Figure 4.1, is exceptionally luminous and required 120 hours of observationsto reach adequate sensitivity). The sensitivity improvements with ngVLAwill not only cut the time per source substantially but reach much moreintrinsically faint systems.
3.5 Dense gas tracers
The critical density required to collisionally excite CO is relatively low(nH2∼102–103 for the lower-J transitions), meaning that observations of COare a good way to trace the total molecular gas reservoirs in galaxies. At thesame time, this also makes CO a fairly poor tracer of the dense molecularcores where star-formation within distant galaxies is ultimately taking place.High dipole moment molecules like hydrogen cyanide (HCN), on the otherhand, are only collisionally excited at very high densities, making them muchmore reliable tracers of the very dense gas directly associated with the for-mation of individual stars. Some studies of HCN in the nearby universe haveeven found evidence that the ratio of HCN luminosity to FIR luminosity re-mains constant over >8 orders of magnitude in HCN luminosity, suggestingthat HCN may be a fundamental direct probe of star forming ‘units,’ andthat the only difference between star formation on different scales and in dif-ferent environments is the number of these fundamental star-forming units(e.g. Gao & Solomon, 2004; Wu et al., 2005, 2010; Zhang et al., 2014).
While some recent observational studies argue that the local HCN-FIRrelation may in fact be more nuanced (e.g. Garcıa-Burillo et al., 2012) – apossibility for which further investigation by the ngVLA will be essential– it is clear that even less is known about dense gas tracers in the moredistant universe. Owing to the fact that they only trace the densest regionsof the ISM and are therefore less abundant, emission from the rotationaltransitions of molecules like HCN is usually an order of magnitude fainterthan CO, complicating efforts to detect and study these tracers at high-z. Asa result, only a few high-z galaxies have been detected in dense gas tracers to-date (e.g. Solomon et al., 2003; Vanden Bout, Solomon & Maddalena, 2004;Carilli et al., 2005; Gao et al., 2007; Riechers et al., 2007, 2011; Danielsonet al., 2011). With ALMA now online, the situation will clearly improvedramatically in the near future. However, as with CO, ALMA will only beable to detect the mid- and higher-J transitions of dense gas tracers likeHCN, HNC, and HCO+. These higher-level transitions are less directlytied to the total dense gas mass, requiring assumptions about the (highlyuncertain) excitation ratios. In addition, these higher-J transitions are morelikely to be affected by IR pumping, which local studies find may be common
20
Figure 9: Redshifted frequencies of dense gas tracers, many of which will be accessiblein single-tuning setups with the NGVLA at high-redshift. In particular, the 1-0 and 2-1transitions of HNC, HCO+, HCN and SiO lines are spaced very closely in frequency (seeinset zoom-ins). While ALMA will be able to detect the mid- and high-J transitions ofthese molecules at high-redshift, significant uncertainties regarding excitation mean thatthe low-J transitions accessible with the ngVLA more suitable as tracers of the total densegas mass.
21
in ultraluminous galaxies (e.g. Aalto et al., 2007). Thus, while necessary tounderstand the overall excitation properties of high-z sources, the ALMA-detectable transitions may be unsuitable as tracers of the total dense gasmass.
The current JVLA probes the right frequency range to detect the cruciallow-J transitions of these high critical density molecules (Figure 3.5). How-ever, its limited sensitivity means that the current state-of-the-art for high-z detections consists of a smattering of strongly lensed hyper-starburstingquasar hosts (e.g. Vanden Bout, Solomon & Maddalena, 2004; Riechers etal., 2007, 2011). With significantly increased sensitivity, the ngVLA wouldextend studies of the dense gas mass at high-z beyond this handful of ex-treme objects for the first time. In addition to tracing the dense gas massat high-z, such studies are critical for constraining models of star formationbased on the gas density PDF, as these models make testable predictionsabout the FIR-HCN relation in FIR-luminous objects (e.g. Krumholz &Thompson, 2007; Narayanan et al., 2008). Finally, while angular resolutionis not a priority for these photon-starved studies, the brightest objects couldeven be spatially resolved by a ngVLA on ∼kpc scales (requiring baselineson the order of the current VLA). The ngVLA would thus enable detailedstudies of the dense gas at high-redshift such as are currently only possiblein the local universe.
4 Dynamics
Of the several hundred z > 1 galaxies currently detected in molecular lineemission (see Carilli & Walter, 2013, for a review), the vast majority arespatially unresolved or – at best – marginally resolved. Particularly in thelow-J (J<3) CO transitions which trace the bulk of a galaxy’s gas reservoir,only a handful of high-redshift galaxies have been resolved to-date (Riecherset al., 2008; Hodge et al., 2012, 2013). This lack of spatial resolution makes itvery challenging to do any detailed dynamical modeling. By providing sub-arcsecond resolution imaging of the gas and dust in high-redshift galaxies,the ngVLA will allow detailed studies of morphologies and – even morecritically – galactic dynamics. This section discusses some of the applicationsthis ability will have for studies of galaxy evolution at high-redshift.
4.1 The relative role of mergers versus disks
What is the relative role of major mergers versus secular disk evolution togalaxies in the early Universe? This question applies not only to the most
22
massive, dust-obscured starbursts (e.g. Narayanan et al., 2010; Dave et al.,2010; Hayward et al., 2012), but also to the general mass assembly of galax-ies at z > 1 (e.g. Forster Schreiber et al., 2009; Dekel et al., 2009), whenhalf of the stellar mass in galaxies was assembled. While the JVLA canalready spatially resolve emission on scales as small as 0.05′′ (equivalent to∼400 pc at a redshift of z ∼ 1), it lacks the surface brightness sensitivityto use this capability on the faint, extended gas reservoirs in even the mostCO-luminous high-redshift galaxies. The best examples to-date of resolvedCO at high-redshift (e.g. Riechers et al., 2008; Hodge et al., 2012) there-fore settle for the VLA’s B-configuration (rather than the more extendedA-configuration), reaching angular resolutions of ∼0.2′′. This resolution al-lowed Hodge et al. (2012) to model the dynamics of the z = 4.05 DSFGnamed GN20, finding evidence for a rotating disk with a flat rotation curve(see Figure 4.1). However, even in this more compact configuration, theobservations of this extremely gas-rich galaxy (MH2 > 1011 M�) required50 hours on source, or a total of >100 hours with overheads. It is thuscurrently not possible to do this experiment on more than a handful of themost extreme high-redshift galaxies (this is also demonstrated by the ex-ample simulation in the previous section, shown in Figure 3.3). Thus, eventhough the angular resolution of the JVLA is already adequate for studies ofhigh-z galactic dynamics, an increase in the surface brightness sensitivity byan order of magnitude would be required for the ngVLA to feasibly conductsuch studies.
The newly completed ALMA has both the resolution and sensitivityrequired to study the resolved morphologies and dynamics of some high-redshift galaxies. However, as discussed in Section 3.1, ALMA is only able todetect the high-J transitions of CO in high-redshift galaxies (see Figure 3.1),with CO(3-2) and CO(5-4) the lowest transitions accessible at z = 3 andz = 6, respectively (assuming the current bands). Beyond the well-knownuncertainties in global excitation ratios (Figure 3.1), the higher-J (J≥3) lineshave been shown to give a biased and incomplete view of the reservoirs insome high-redshift galaxies, as shown previously in Figure 3.3. In partic-ular, observations of the CO in normal star-forming galaxies and DSFGsdemonstrate that CO(3–2) emission can miss up to half of the gas mass andimply reservoir sizes that are three times more compact than determinedfrom the ground-state CO(1–0) transition (e.g. Hainline et al., 2006; Ivisonet al., 2011; Dannerbauer et al., 2009; Aravena et al., 2010; Riechers et al.,2011). It is thus crucial to extend down to the frequency range of the VLA(i.e., down to ∼10-20GHz) in order to probe the dynamics of the bulk of thegas directly.
23
Figure 10: High-resolution VLA CO(2–1) moment maps for the z = 4.05 submillimetergalaxy (SMG) GN20 (Hodge et al., 2012). Using the VLA’s B+D configurations, Hodgeet al. achieved a resolution of ∼1.3 kpc, allowing them to resolve the extended cold gasreservoir as well as model its dynamics. This is the most detailed map of a high–z SMGto-date, but it required 120 hours of VLA time (50 hours on-source) on this extremely gas-rich source. The NGVLA is critical to extend such studies beyond a handful of extremehigh-redshift sources.
Note that the [Cii] emission line at a rest-frame 158µm has been quitesuccessful in characterizing the dynamics of some high-redshift galaxies,although the interpretation is difficult as the photo-disassociation region(PDR)-generated line’s emission represents a complex mix of physical mech-anisms (Olsen et al., 2015). While the kinematics of the [Cii] line is certainlya useful diagnostic of potential mergers, it is unlikely to trace the full extentof a galaxy’s cold gas reservoir. In contrast, the CO(1-0) line provides notonly dynamics, but a direct link to the molecular gas supply, as detailed inthe previous section.
4.2 Molecular outflows
In addition to distinguishing between mergers and disks, the dynamical in-formation can shed light on the presence of galactic inflows/outflows. Galac-tic winds, in particular, are thought to play a major role in regulating theformation of stars by acting as a source of negative feedback on the star-forming ISM. As such, they are now a common feature in theoretical modelsof galaxy evolution. By observing the molecular component of such winds,one can measure the total molecular mass outflow rate, which, along withthe cool atomic phase, is thought to comprise a significant fraction of thewind (e.g. Walter, Weiss & Scoville, 2002; Rupke, Veilleux & Sanders, 2005;
24
Alatalo et al., 2011). Recent studies with ALMA have mapped galacticwinds in the local Universe in unprecedented detail (e.g. Bolatto, Wolfire &Leroy, 2013) and, by detecting the redshifted emission from low-J CO tran-sitions in distant galaxies, the ngVLA would allow studies of the importanceof galactic outflows across cosmic time.
4.3 Measuring the CO-to-H2 conversion factor
Finally, the dynamical information is also critical to get back to the physicalparameter that is ultimately of concern: the total molecular gas mass. Evenwith the ground-state transition of CO, an assumption is required aboutthe CO–to–H2 conversion factor XCO in order to convert the observed COluminosity to the total molecular gas mass, MH2 . Locally, much progressis being made in directly measuring the conversion factor through variousmethods, including applying virial techniques to resolved CO emission fromdiscrete molecular clouds (Bolatto, Wolfire & Leroy, 2013, and referencestherein). Unfortunately, the direct determination of the conversion factorin high-z objects remains extremely challenging with current instruments.Thus, the best we can do at high-z right now is to extrapolate from whatwe know about local galaxies, which may not be appropriate analogues forthe galaxy populations that exist at earlier cosmic times. If our communityis able to build the ngVLA, that could achieve resolutions of ∼5-15mas inthe (unbiased) low-J CO lines, we could begin resolving individual molec-ular clouds on scales of ∼40-100 pc at z ∼ 4, allowing us to measure theconversion factor in high-z galaxies directly.
5 Continuum Emission
Single-dish submillimeter imaging has contributed immeasurably to the studyof high-redshift galaxy evolution, particularly by unveiling a significant pop-ulation of extremely dusty star-forming galaxies that have been incrediblychallenging for cosmological simulations to explain (Casey, Narayanan &Cooray, 2014, and references therein). This submillimeter imaging can coverlarge fields and produce uniformly selected samples of distant DSFGs chosenin a single bandpass to a well-established flux limit, making the selection ofthese sources straightforward to model. These wavelengths are also equallysensitive to both low and high redshift galaxies, due to the very negativek-correction on the Rayleigh-Jeans tail of dust emission’s blackbody. How-ever, images from single-dish submillimeter facilities have low resolution, and
25
blank field observations run up against the confusion limit quickly. Inter-ferometric submillimeter/millimeter imaging has high spatial resolution andsensitivity, but the field-of-view is small. Radio continuum imaging surveyswith the VLA do not suffer from extinction, have high spatial resolution,and can cover large areas. However, at the present time, the deepest surveysmade with the VLA can only find the most luminous galaxies at high red-shifts, with star-formation rates above 100 M� yr−1. Here we discuss variousways in which continuum work with the ngVLA will push the boundaries ofgalaxy evolution studies by probing the dust-unbiased star formation fromgalaxies at high redshift.
5.1 Synchrotron as a tracer of cosmic star formation
Unlike the rest-frame UV/optical, synchrotron emission is relatively unaf-fected by dust attenuation, making it a valuable tracer of the total amountof star formation in galaxies, unbiased by dust. The main downside to usingsynchrotron emission as a star formation tracer is the limiting sensitivityof current facilities. For example, the deepest existing 1.4 GHz VLA image(5σ of 11.5µJy of the CDF-N by F. Owen) only probes down to ULIRGluminosities (ultra-luminous infrared galaxies, LIR = 1012 L�) to z ∼ 3 andLIRG luminosities (luminous infrared galaxies, 1011 L�) to z ∼ 1. ThengVLA can help us construct a complete star formation history by deliv-ering a large homogeneous sample that is insensitive to extinction over awide range of luminosities and SFRs out to high redshifts (e.g., these sameluminosity limits to z ∼ 5 − 6). With its unprecedented sensitivity, thengVLA will even be sensitive to nearly Milky Way-like galaxies at redshiftsof z∼1–3, the peak epoch of galaxy formation. For example, using a 5–15 GHz band (3:1 instantaneous RF bandwidth) and assuming a sensitivity5×VLA (10×VLA) would result in a 5σ detection limit of 500 nJy beam−1
(250 nJy beam−1) after only 10 hours of on-source integration time. As-suming baselines where the source is unresolved, this translates to a SFR of10.8 M� yr−1 (5.4 M� yr−1) at z ∼ 2.5.
5.2 The promise of free-free as a SFR tracer
Although lower frequencies have the advantage of a larger field-of-view,which is necessary to get large numbers of very high-redshift galaxies, thereare several major issues to consider to determine which frequencies would bebest suited for mapping the star formation history in the radio. First, whatare the dominant physical mechanisms contributing to the radio emission
26
Figure 11: Observed flux density vs. wavelength for the SED of a typical SMG atredshifts of z = 1 (yellow), z = 2.5 (orange), z = 4 (red), z = 6 (magenta), z = 10(purple), and z = 15 (blue). The gray regions indicate possible frequency coverage rangesfor the ngVLA of 5-100 GHz and 1-118 GHz, demonstrating that the ngVLA will be able tosample the full radio spectral energy distributions (SEDs) of galaxies out to high-redshift.
27
at high redshifts? Second, how well can we calibrate these mechanisms toestimate SFRs? Third, can we separate AGNs from star-forming galaxies?With synchrotron emission, there is substantial contamination of the star-forming samples by AGNs, and there are uncertainties in the conversionfrom radio flux to star formation rate (SFR).
Free-free emission is dominant at rest-frame frequencies of tens of GHzand is directly proportional to the production rate of ionizing photons byyoung, massive stars (though it may be biased towards starbursts), makingit useful for measuring SFRs (e.g. Murphy et al., 2015). However, even atthese high frequencies there can be substantial synchrotron contributionsthat have to be taken into account. For example, Rabidoux et al. (2014)find a free-free fraction of 55% at 33 GHz for a sample of local star-forminggalaxies. Using multiple measurements over the broad wavelength coverageof the ngVLA, we will be able to observe the full radio spectral energydistributions (SEDs; Figure 5.1) of galaxies out to high-redshift, allowingus to separate the pure synchrotron and free-free regions of the spectraand hence estimate the relative fractions produced by each mechanism as afunction of frequency for determining more accurate SFRs.
One important factor to consider in this regard is the quenching ofthe synchrotron emission by the cosmic microwave background radiation(CMBR). Compton cooling of relativistic electrons on the CMBR dominatesover the synchrotron emission when the CMBR energy density exceeds thegalaxy magnetic energy density (e.g. Condon, 1992; Murphy, 2009). Sincethe energy density of the CMBR goes as (1 + z)4, there is a redshift de-pendence. Moreover, the synchrotron emission will be highly quenched inmoderate SFR galaxies at high redshifts but possibly never in ULIRGs,so there is also a luminosity dependence. This means that high-redshiftgalaxies with moderate SFRs will be totally free-free, modulo the possi-ble contribution from anomalous dust emission (Adam et al., 2015), whichmay arise from spinning dust grains (e.g. Draine & Lazarian, 1998). Weillustrate the various cases in Figure 5.2. In (a) we show the synchrotronemission (dotted; assuming a constant spectral index) as it would be for ei-ther a moderate luminosity, low-redshift galaxy or a ULIRG, as well as thefree-free emission (dashed), the dust emission (dot-dashed), and the totalemission (solid), while in (b) we show the synchrotron emission suppressed asit would be for a moderate luminosity, high-redshift galaxy. Thus, the mostsecure SFRs will come from observations made at high frequencies (rest-frame 30− 50 GHz) where the free-free emission significantly dominates forall galaxy types. This range will be readily accessible out to high-redshiftswith the ngVLA.
28
Figure 12: Rest-frame flux density vs. rest-frame frequency for (a) either a moderate lu-minosity, low-redshift galaxy or a ULIRG where the synchrotron emission is not suppressedby the CMBR, and (b) a moderate luminosity, high-redshift galaxy where the synchrotronemission is suppressed. Data points show the SEDs of five isolated submillimeter galaxieswith redshifts from Barger et al. (2012).
29
Figure 13: Energy density in ambient photon field and magnetic field vs. redshift for aULIRG and a local spiral (Carilli, 2001; McBride, 2014), and for the redshift-dependentCMBR. The corresponding magnetic field strength, assuming equipartition, is shown onthe right-hand axis.
One potentially interesting benefit of the CMBR quenching of the syn-chrotron emission is that by mapping out the radio SEDs for a numberof galaxies of a given luminosity with the ngVLA and seeing at what red-shift the shape changes from synchrotron plus free-free to free-free only, wecan get a rough galactic magnetic field measurement for that luminosity byequating it to the CMBR energy density (e.g. Carilli, 2001). We show thisin Figure 5.2, where we plot energy density versus redshift for a local spiraland a ULIRG (McBride, 2014), and for the redshift-dependent CMBR. Weshow the magnetic field strength on the right-hand vertical axis.
Another benefit of the CMBR quenching is that extended AGNs areexpected to be quenched at high redshifts since the magnetic fields in theextended radio jets are small, leaving only compact AGNs (e.g. Afonso etal., 2014). Since the typical radio sizes for star-forming galaxies (∼ 1′′) arelarger than those for compact AGNs (Cowie et al., in prep), it should bestraightforward to separate star-forming galaxies from AGNs even with onlymoderately sub-arcsecond spatial resolution.
5.3 Thermal dust emission at the highest redshifts
Thermal re-radiation from dust dominates a galaxy’s spectrum at rest fre-quencies above ∼200 GHz. This dust emission is dominantly powered byrecently-formed, massive stars, making it an excellent tracer of the bolomet-
30
ric luminosity in dusty starbursts. While ALMA is already revolutionizingour understanding of dusty star forming galaxies at intermediate redshifts(e.g., Karim et al., 2013; Hodge et al., 2013; Weiß et al., 2013; Hezavehet al., 2013; Simpson et al., 2014), at sufficiently high-redshift, the ngVLAbands will also benefit from the very-negative K-correction on the cold dustRaleigh-Jeans tail. As a consequence, the higher frequency coverage of thengVLA will bring with it the exciting possibility of detecting thermal emis-sion from dust at the highest (z ∼ 7) redshifts, providing important con-straints on high-z dust emission.
One crucial caveat is that detecting this thermal dust emission againstthe background of the CMB becomes more difficult at higher redshift (daCunha et al., 2013). As discussed in Section 3.2 in regards to CO emission,the net effect of the higher CMB temperature at high-z is to decrease thecontrast between the target and CMB, implying that detecting thermal dustemission at the highest redshifts may only be feasible for the most luminousstar-formers. It will be critical to take this effect into account even for de-tected galaxies, as the contrast against the CMB is frequency dependent.Failing to account for this effect could therefore affect the interpretation ofthe dust SED, yielding biased estimates of dust temperature, mass, emissiv-ity index and luminosity (da Cunha et al., 2013).
6 AGN and supermassive black holes
The ngVLA will have a large impact on studies of the evolution and char-acteristics of massive black holes at the centers of distant galaxies. In thissection we outline some key science goals related to the evolution of activegalactic nuclei (AGN) and how the ngVLA will be uniquely useful.
6.1 Black hole masses from gas dynamics
The proposed capabilities of the ngVLA offer the tantalizing possibility ofdirectly observing gas dynamics in the vicinity of the super-massive blackholes at the centers of massive galaxies, and thereby also of measuring themasses not just of AGN, but of quiescent super-massive black holes. Suchobservations require being able to resolve the “radius of influence” of ablack hole, i.e. the distance within which the black hole’s gravitationalpotential significantly affects the orbital motion of the surrounding starsand interstellar gas. From Krolik (1999), the radius of influence is givenapproximately by r = (MBH/M�)(σ/200km/s)−2. From the M-σ relationas calibrated by Kormendy & Ho (2013)
31
log10(σ/200km/s) ∼ 0.23(log10MBH − 8.5).
Combining these two formulae yields
r ∼ 7.5× 10⁻⁴(MBH/M�)(0.54) pc
Thus, a 109 M� black hole has a radius of influence of about 54 pc, corre-sponding to almost 30 mas at z = 0.1, easily resolvable to the ngVLA withlong baselines. The ngVLA will revolutionize estimates of black hole massesin the large fraction of systems that are heavily obscured in the optical/near-IR, where estimates from optical gas or stellar dynamics cannot be obtainedeven with 30 m class optical/near-IR telescopes like GMT, TMT, and theE-ELT.
Observations from the ngVLA will also enable high resolution observa-tions of galaxy dynamics (see discussion in § 4) to constrain models that canbe used to estimate velocity dispersions for use with the M − σ relation inhigh-z galaxies. Current observations barely resolve the host galaxies, mak-ing reliable separation of circular velocity and velocity dispersion difficult(e.g. Kimball et al., 2015). Although resolving the dynamic across parsecscales may be limited in practice to the z <∼ 0.1, full galaxy wide dynamicswill be essential for characterizing distant sources on the M − σ relation.
6.2 The nature of radio emission from radio-quiet AGN
Radio emission from radio-loud AGN is powered by synchroton emissionfrom relativistic jets emanating from a region very close to the central blackhole. However, even traditionally radio-quiet objects have significant radioemission, the origin of which is unclear. The radio emission may originatein scaled down versions of the jets of radio-loud objects, in synchrotronemission from material shocked by thermal winds from the accretion disk(Zakamska & Greene, 2014), or from star formation in the quasar host (e.g.Kimball et al., 2011). Determining which of these dominates is important,especially for our understanding of the feedback process in radio-quiet ob-jects. If jets are ubiquitous, they can be agents of feedback along with anythermal winds. If star formation dominates, it implies that most quasarhosts are heavily star-forming at the level of ULIRGs, which would be achallenge for models in which AGN feedback is supposed to inhibit starformation.
Determining which process dominates requires high spatial resolution,multifrequency observations to distinguish the jets and flat-spectrum cores
32
expected from weak radio AGN from more diffuse steep spectrum emissionfrom thermal shocks, and a combination of synchrotron and free-free thermalemission (at high frequencies) from star formation.
6.3 Weak radio AGN in normal galaxies
Our own galaxy contains a weak radio AGN, SgrA∗, with a luminosity inits flat spectrum core L8GHz ∼ 1016WHz−1. The ngVLA could detect suchan AGN in nearby galaxies out to ≈ 8 Mpc with a flux density of 1µJy (en-closing the nearest ∼ 100 nearby galaxies), with a 10σ detection in 10 hours.A more luminous radio AGN, such as that in M87 (L8GHz ∼ 1024WHz−1)could even be seen out to z > 6. Such AGN are important for “mainte-nance” or “radio” mode feedback in massive galaxies, and seem only to beproduced by the most massive black holes. They can thus trace the evo-lution of these black holes from when they form at z ∼ 5 to the currentepoch. Although the SKA will excel at finding many millions of such ob-jects, isolating those at high redshift will require additional selection usinghigh frequency data. In these data we can pinpoint the steepest spectrumobjects, which the ngVLA will easily identify. The ngVLA will also be theonly telescope capable of determining the morphologies of these objects andstudying how the radio jets interact with the ISM of their host galaxies.
6.4 Multiple AGN
The combination of high resolution and high sensitivity will allow the ngVLAto resolve two merging AGN within their host galaxies. At 10 GHz, thengVLA’s “goal” resolution is 30 mas, which could easily distinguish two AGNseparated by ∼ 300pc at z ∼ 1. Thus, the fraction of dual and multiple AGNcan be used to constrain black hole merger rates (e.g. Fu et al., 2015) andthe contribution of mergers to the growth of supermassive black holes.
If a VLBI component with intercontinental baselines is added to thengVLA, this opens up the possibility of obtaining baselines with high sensi-tivity at pc-scale resolutions for AGN at z ∼ 0.1. This is important, as, evenafter decades of work, it is still unclear how, or even if, the final stages of su-permassive black hole mergers take place in the centers of galaxies. This finalparsec problem refers to the difficulty of understanding how a binary blackhole loses angular momentum in a regime where neither dynamical frictionwith other stars nor gravitational radiation is effective. Although varioustheories have been put forward to overcome this problem (e.g. Vasiliev, An-tonini & Merritt, 2015), statistics of binary black hole separations in galaxy
33
cores with a range of dynamical properties are needed to constrain thesemodels.
6.5 Molecular gas and feedback in AGN
In order to understand the effects of AGN (and stellar) feedback on galaxyformation, it is important to be able to study molecular outflows, not justin CO, but also in dense gas tracers (HCN, HCO+, CS, etc, as discussedin § 3.5) where CO is optically thick. It remains an open question as towhether the most important feedback mechanism is through expulsion ofgas during short, but violent feedback episodes in “quasar” mode, or “radio”mode, where little, if any outflowing gas exceeds the escape velocity of thesystem, but jets can inject turbulence into the ISM sufficient to prevent starformation. The ngVLA will allow the detailed study of gas dynamics in thehost galaxy to help us answer this important question.
Another interesting application of the ngVLA will be the study of gaschemistry in AGN versus star-forming galaxies. A highly obscured AGNis very difficult to find using any conventional technique: optical line diag-nostics, X-rays and mid-IR emission from hot dust can all be blocked by asufficient column of dust and gas; far-infrared emission is hard to distinguishfrom star formation; and radio free-free emission can arise either from AGNphotoionization or from star formation. It has been speculated, however,that some molecular species may be more (or less) common in regions dom-inated by XDR chemistry, due to an AGN, or PDR chemistry, due to starformation (e.g. Martin et al., 2015; Izumi et al., 2015). If so, detection ofmolecular transitions in the 3 mm band (100 GHz) of ngVLA will providethe best evidence possible of the presence of very highly obscured AGN, andsome of the lower-J transitions at lower frequencies.
6.6 Sunyaev-Zeldovich Effect from Quasar/Starburst Winds
Thermal winds from AGN and starbursts are predicted to be detectablevia the Sunyaev-Zeldovich effect in long (several tens to hundreds of hours)integrations using ALMA (Chatterjee et al., 2008; Rowe & Silk, 2011), anngVLA would be many times faster at detecting these, and could be usedto characterize the outflows in extent and pressure, constraining quasar life-times and providing important information to feedback models. There hasbeen a claim of a statistical detection of quasar winds via this technique inPlanck data (Ruan, McQuinn & Anderson, 2015), but only the ngVLA willbe able to study it in detail in individual objects.
34
7 Polarimetry and Cosmic Magnetism
Magnetic fields are ubiquitous in nature and have been detected on all as-trophysical scales up to, and tentatively beyond, those of galaxy clusters.Magnetic fields can be dynamically important, for example having compara-ble energy density to gravity and turbulence in interstellar gas (Beck, 2007),and are essential for understanding a wealth of astrophysical processes fromstar to galaxy formation. The buildup and impact of magnetic fields overcosmic time remain outstanding problems in astrophysics. Polarimetry is apowerful tool for unveiling the magnetic Universe, and for providing a win-dow into associated science such as radiative transfer theory, properties ofdust, and black hole accretion flows.
To date, far-IR and millimeter polarimetry with facilities such as theJCMT and CARMA have been limited to angular resolutions of a few arcsec-onds. Sub-arcsecond resolution can be attained with the VLA and ALMA,and also with the VLBA albeit at limited surface brightness sensitivity. Po-larimetry with ALMA and the recently upgraded Jansky VLA is only justbeginning and will soon deliver scientific yields. The groundwork from thesestudies will set the stage for research directions within the new parameterspace of the ngVLA. Key to this new parameter space is angular resolution,which will minimize beam depolarization (vector averaging of polarizationposition angles within a large observing beam), enabling quantitative stud-ies of magnetic fields in unprecedented detail. The sensitivity improvementof the ngVLA will enable the lowest signal-to-noise total intensity sciencewith the VLA and ALMA to be studied in polarization.
The SKA will play a fundamental role in tracing cosmic magnetismthrough studies of synchrotron radiation and Faraday rotation. By goingto higher frequencies, the ngVLA will open a unique window on cosmicmagnetic fields and science accessible through microwave polarimetry. The5-100 GHz frequency range proposed for the ngVLA will facilitate observa-tions of polarized emission from dust, atomic and molecular spectral lines,and synchrotron radiation from extreme Faraday rotation environments aswell as those that are significant depolarized at lower frequencies. The ul-tra wide bandwidths proposed for the ngVLA will allow detailed Faradaystructure mapping. We address each of these with example science themesin the following sections. We note that while the following sections necessar-ily focus on extragalactic science, much of the discussions are also relevantfor Working Groups 1 (Cradle of Life) and 2 (Galaxy Ecosystems) throughtopics such as cometary comae, circumstellar disks, planetary nebulae, andGalactic molecular clouds.
35
7.1 Dust Continuum
Linearly and circularly polarized thermal emission at far-IR and millimeterwavelengths can be produced by elongated, spinning, aligned dust grains.Despite over half a century of effort, a comprehensive theory does not yetexist to explain exactly how dust grains are aligned (Lazarian, 2007). Ob-servations indicate that alignment is with respect to the magnetic field,though the alignment mechanism may not be magnetic. Promising candi-dates include radiative alignment via torques that are efficient when grainsizes are comparable to the wavelength, and mechanical alignment in thepresence of gas flows. The degree of fractional polarization can provide di-agnostics of grain characteristics (Hildebrand & Dragovan, 1995), Typicalobserved fractions in molecular clouds are a few percent (Leach et al., 1991;Greaves et al., 1999). When measurements of turbulent velocities and thedispersion of polarization position angles across a source are available, theChandrasekhar-Fermi method (Chandrasekhar & Fermi, 1953) can be usedto estimate magnetic field strengths in the plane of the sky (e.g. Falceta-Goncalves, Lazarian & G., 2008). This method requires the dispersion ofposition angles to be meaningfully coupled to turbulent structure. If thiscondition is not met, for example due to beam depolarization, then magneticfield strengths will be overestimated (Houde, 2009). Similarly, not all tan-gled magnetic field structures will be sampled along the line of sight (LOS)when the emission is optically thin, leading to overestimated magnetic fieldstrengths. The three-dimensional magnetic field distribution can be recon-structed through a combination of dust polarimetry and measurements ofion-to-neutral molecular line width ratios (Houde et al., 2005).
The ngVLA will be capable of mapping magnetic fields in the molecularenvironments of a large number of nearby galaxies through dust polarime-try. For example, an ngVLA with collecting area 5 x VLA could map themillimeter wavelength dust polarization and magnetic field geometry in agalaxy like the starburst M82 (d = 3.5 Mpc; Greaves et al., 2000; Reissl,Wolf & Seifried, 2014) in less than 10h if it were located at a distance of350 Mpc, i.e. well beyond the boundary of the Local Supercluster (La-niakea), sampling neighboring superclusters. Such studies will be highlycomplementary to other ngVLA probes of the interstellar medium in galax-ies such as (polarized) synchrotron emission and molecular line diagnostics,and also to lower frequency studies of nearby galaxies and their magnetismwith the SKA (Beck, 2015). This will enable a detailed understanding ofthe environments of local galaxies, including the interaction between gasand magnetic fields, in turn providing constraints on the end-points (z = 0)
36
of magnetized galaxy evolution models (e.g. Van Eck et al., 2015). Studiesof local volume supernova remnants through their sometimes highly frac-tionally polarized dust emission (Dunne et al., 2009) may be developed tosimilar effect. ngVLA studies of dust polarization in environments wheregrain alignment is expected to be occurring, such as accretion disks (Aitkenet al., 2002), will enable new probes of magnetic fields.
7.2 Spectral Lines
Rotational emission lines of molecules can be linearly polarized throughthe Goldreich-Kylafis (G-K) effect (Goldreich & Kylafis, 1982). This ariseswhen excited states of a molecule are exposed to anisotropic radiation, eitherfrom an external source (e.g. nearby infrared emitter) or internally from agradient in the line optical depth (e.g. due to a local velocity gradient).De-excitation then results in spectral lines with net linear polarization, withfractional levels typically a few percent. The production of linear polariza-tion in absorption lines against unpolarized continuum sources, as well as theproduction of both linear and circular polarization in the absorption linesagainst linearly polarized continuum sources, will also arise in the presenceof optical depth anisotropies (Kylafis, 1983).
By utilizing the G-K effect, the ngVLA will be capable of mapping mag-netic fields in the molecular environments of a large sample of galaxies ex-tending to high redshifts. For example, assuming a channel rms noise of 10µJy beam−1, the ngVLA could detect CO(1–0) in a Mgas = 1010 M� galaxyout to z ∼ 0.85 with sufficient sensitivity to detect a few percent polar-ization. Recently, Li & Henning (2011) mapped CO polarization in M33 toinvestigate the interplay between large and small scale magnetic fields on theformation of molecular clouds. ngVLA studies capturing more detail withinlarger source samples will be critical for understanding the environmentalimpacts of magnetic fields within galaxies over cosmic time. Spectral linepolarimetry with the ngVLA may be essential for studying galactic mag-netic fields at high redshift, for example in main sequence galaxies wheresynchrotron probes will be of limited use due to CMBR quenching (see Fig-ure 5.2).
The G-K effect will lead to polarization of polycyclic aromatic hydro-carbon (PAH) emission. ngVLA studies of polarized anomalous microwaveemission (AME; Draine & Lazarian, 1998) may therefore provide insight intograin alignment theory and perhaps even the very nature of PAHs. Whilesuch studies may be most productive within the Galaxy, extragalactic inves-tigations of AME (e.g. Hensley, Ostriker & Ciotti, 2014) and its polarization
37
characteristics will offer important consistency checks.Elliptical polarization of atomic and molecular emission and absorption
lines is produced by the Zeeman effect. The presence of a magnetic fieldcauses the spectral line to be split into three components: a linearly polar-ized component that is unshifted in frequency and two elliptically polarizedcomponents shifted symmetrically above and below the original line fre-quency. The elliptical polarization is a combination of (intrinsic) circularpolarization proportional to the strength of the line of sight magnetic fieldwith opposite sign for each split component, and (propagation induced) lin-ear polarization proportional to the strength of the magnetic field orientedperpendicular to the position angle in the plane of the sky. The magnitudeof the frequency shift depends on the strength of the total magnetic field andthe splitting factor (Lande g-factor), the latter dependent on the magneticmoment of the species. For most spectral lines except those associated withstrong masers (e.g. OH), the magnitude of the frequency splitting is muchless than the spectral line width, in which case the Zeeman observations areonly sensitive to the line of sight magnetic component. Zeeman splitting isapproximately 3 orders of magnitude weaker for non-paramagnetic speciesthan paramagnetic species.
The ngVLA frequency range will enable Zeeman studies of paramag-netic molecules such as C4H, SO, and C2H (and potentially CN depend-ing on the upper frequency bound), non-paramagnetic molecules such asH2O and NH3, and radio recombination lines from atomic species such asH and C. Unsampled magnetic structures within the telescope observingbeam or along the line of sight will reduce the measured Zeeman effect.The high angular resolution of the ngVLA is therefore critical for maximiz-ing Zeeman detectability, while its sensitivity will be necessary to improvedetection statistics in weak magnetic environments or for species with lowmagnetic moments. Robishaw et al. (2015) present a selection of Galacticand extragalactic science that can be addressed by SKA observations of theZeeman effect. Much of this is applicable to higher frequency science withthe ngVLA, for example mapping magnetic fields in galaxies using masersor megamasers to constrain the redshift evolution and dynamics of galac-tic magnetism. Robishaw et al. (2015) point out that measurements of theZeeman effect are currently sensitivity limited. The ngVLA can uniquelycontribute to this field.
Non-Zeeman circular polarization of molecular rotational spectral lines,with fractional levels of a few percent, can arise from resonant scatteringthrough the conversion of linear to circular polarization (Houde et al., 2013).This effect is proportional to the square of the magnetic field component in
38
the plane of the sky. The effect could be examined in ngVLA data to improvethe analysis of Zeeman observations, or exploited for Zeeman-insensitivemolecules.
7.3 Synchrotron Continuum
The synchrotron mechanism produces linearly polarized radiation with atheoretical maximum fractional level of approximately 70% in a uniformmagnetic field. However, observed fractions at radio wavelengths are oftenonly a few percent due to selection effects such as spectral (bandwidth) andspatial (beam) depolarization, depth depolarization (Faraday dispersion),and the degree to which the magnetic fields in the synchrotron emitting vol-umes are ordered. Faraday rotation describes the rotation of the plane oflinear polarization as linearly polarized radiation passes through a birefrin-gent medium, such as a magnetized thermal gas containing free electrons.The degree of rotation at wavelength λ is proportional to both λ2 and the‘rotation measure’ (RM). Observations of the position angle of linear po-larization at multiple λ’s enable measurement of the RM, which in turn isproportional to the path integral of the line of sight magnetic field compo-nent weighted by the electron density: RM ∝
∫BLOS ne dl. If ne can be
measured or modeled along the line of sight, then the magnetic field can beprobed.
Faraday rotation studies will feature prominently with the SKA as partof the cosmic magnetism key science driver. The higher frequency coverageof the ngVLA will provide unique parameter space for studies of Faradayrotation, with particular relevance for sources with very large rotation mea-sures (& 104 rad m−2) and those exhibiting significant depolarization atlower frequencies. This is important, for example, for studying accretionrates onto nearby supermassive black holes such as Sgr A* (Macquart et al.,2006) and M81* (Brunthaler, Bower & Falcke, 2006). These sources exhibitlarge rotation measures and are both depolarized at frequencies less thanapproximately 80 GHz. The ngVLA can facilitate an accretion rate censusof similar nearby black holes. For example, an ngVLA with collecting area5 x VLA could detect a black hole with similar millimeter wavelength proper-ties to Sgr A* out to a distance of 1.5 Mpc in less than 10h, i.e. encompassinga significant fraction of the local group. The high angular resolution andsensitivity of the ngVLA will aid in the observation and interpretation ofsub-parsec scale jet launching environments near supermassive black holes,with implications for precession and supermassive black hole binarity. Forexample, millimeter wavelength polarization position angles for BL Lac ap-
39
pear to match the structural position angle of the jet (Stirling et al., 2003).More generally, synchrotron polarization studies with the ngVLA at its
lowest frequencies will contribute to investigations into the nature of radioemission from radio-quiet AGN and weak radio AGN in normal galaxies(for example, comparing their fractional polarization properties with othersource populations Massardi et al., 2013), high rotation measure sources andtheir environments (Broderick et al., 2007; Martı-Vidal et al., 2015), polar-ized spectral energy distributions (Homan, 2012; Farnes et al., 2014), highangular resolution observations of rotation measure gradients and helicalmagnetic fields in jets (Hovatta et al., 2012; Gabuzda, Knuettel & Reardon,2015), and turbulence in galaxies through depolarization studies.
8 Synergies with other facilities
Here we describe how the ngVLA will complement and contrast with thecapabilities of other cutting-edge observatories. As the 21st century is clearlyan era of multi-facility use, and multiwavelength studies, it is essential thatngVLA’s discoveries in the area of galaxy evolution complement, but do notduplicate, the range of measurements made by other facilities.
8.1 The Atacama Large Millimeter Array (ALMA)
ALMAs design is optimized for high frequencies in the millimeter and sub-millimeter regime; it cannot be rivaled by ngVLA at wavelengths <∼1mm, inparticular due to the contrast of weather at the ALMA site and VLA site.However, ALMA has about half the collecting area of the current VLA, sowill be much less sensitive than the ngVLA at mm wavelengths where itswavelength range overlaps. For objects with large angular scales (for exam-ple, nearby galaxies and SZ decrements in galaxy clusters), its smaller dishesand compact array will remain valuable. At low frequencies, only ALMA’sBand-3 (84-116 GHz) is currently available on the telescope; however, bythe advent of ngVLA, we expect the antennas to be outfitted with Band-1and Band-2 receivers, allowing observations as low as 30 GHz. For objectsnear the celestial equator, ALMA baselines could therefore be used to fillin shorter baselines for ngVLA observations of objects with structure on awide range of angular scales.
Another area where we expect significant synergy between ALMA andthe ngVLA takes advantage of their very complementary angular resolu-tions. The recent ALMA long baseline campaign showed that images can
40
be obtained with baselines out to 15 km at 230 GHz, providing a resolu-tion of 15 mas. This resolution would match the ngVLA at 40 GHz baselinelength of 180 km (5×VLA). Working together, the two telescopes wouldthus be sensitive to a wide range of CO transitions (and the underlyingdust continuum) at comparable angular resolution, allowing studies of thespatially-resolved molecular gas excitation and resolved star formation lawin high redshift galaxies (e.g., Hodge et al., 2012, 2015).
8.2 The Square Kilometre Array (SKA)
The ngVLA will have a point-source sensitivity twice that of SKA phase-1 (SKA-1 MID) in the frequency range where they overlap. The upperfrequency being considered for the SKA is between 14 GHz and 24 GHz.Though 24 GHz and below could be useful for detecting CO(1-0) at ex-tremely high-redshift (z > 4), it falls short of the frequencies where theimpact of the ngVLA CO studies will be most profound, namely, from 25–50 GHz, covering low order CO (and other molecular) transitions over thepeak epoch of Cosmic star formation (z ∼ 1 to 4).
In terms of brightness temperature sensitivity at 10GHz, a comparisonbetween the ngVLA specifications and (Murphy et al., 2015) suggests thatat 1 resolution the surface brightness sensitivity in continuum will be similar(RMS in 1hr with a 5GHz bandwidth ≈ 15mK for both SKA-1 MID andthe tapered ngVLA beam), but at higher angular resolutions (≈ 30mas)ngVLA will be about twice as sensitive. Note that these conclusions dependultimately on the adopted configurations. The strength of SKA for highredshift galaxy studies is thus likely to be in HI and in continuum andpolarization studies that require high surface brightness sensitivity at GHzfrequencies, complementary to the ngVLA’s focus on molecular gas andhigher-frequency thermal radio emission.
8.3 Next Generation Bolometers on Single-Dish (Sub)mmtelescopes
Single-dish submillimeter and millimeter telescopes provide a unique dataproduct that submillimeter interferometric datasets cannot provide: theycan map large fields of view in multiple bandpasses swiftly and simultane-ously. The Herschel Space Observatory has contributed significantly to thelast five years developments in large field of view mapping, but is limited inscope due to its wavelength range (the SPIRE instrument operated at 250–500µm), and is particularly insensitive to the z > 2 Universe. The SCUBA-2
41
instrument in operation at the JCMT simultaneously maps at 450µm and850µm, and is currently surveying large areas, up to 4 deg2 to the 850µmconfusion limit (∼0.5 mJy/beam). These deep surveys, and those at longerwavelengths to be done by bolometer arrays like GISMO-2 at 1.2 mm and2 mm, are ideal for probing DSFGs in the z > 2 Universe, and would be idealcandidates for ngVLA spectroscopic follow-up. This is particularly relevantsince, historically, redshift confirmation has been most challenging for DS-FGs at z > 3, requiring direct confirmation through far-infrared/millimeterwavelength emission lines. The next generation of wide-field submillimeterbolometers will lean on facilities like the ngVLA significantly for quick andefficient redshift follow-up.
8.4 Future infrared astronomy space missions
Two infrared space telescopes have been proposed for launch in the next1-2 decades. SPICA, a joint project of the Japanese and European SpaceAgencies, will be a 3-m class cooled telescope, whose focus will be on spectro-scopic surveys of distant galaxies. SPICA is currently scheduled for launchin 2025. At the same time, NASA is currently considering a proposal for aFar-Infrared Surveyor telescope, which will be a 5-m class single-dish tele-scope, also concentrating on spectroscopic surveys. Both SPICA and theFar-Infrared Surveyor will be able to provide many targets for ngVLA follow-up of low order CO lines and dense gas tracers, essential for understandingtheir underlying gas mass.
8.5 Large optical/IR telescopes (GMT, TMT, and E-ELT)
The ngVLA will have an angular resolution comparable to adaptive-opticscorrected images from the GMT, TMT or E-ELT (∼15-20 mas). This willallow, for example, direct morphological comparisons of the ionized atomicand molecular gas in high redshift galaxies on sub-kpc scales. Moreover,the combination of the ngVLA and these large optical/IR telescopes willalso allow dynamical comparisons of these key ISM components, providingdetailed insight into the process of galaxy formation as a function of cos-mic time. This is particularly crucial for the formation of early, massivegalaxies, where star-formation rates would have to have been high, and thedust content proportionally high. By providing a direct route to observingthe star-forming molecular gas in high-redshift galaxies, ngVLA observa-tions will be necessary to interpret the complex rest-frame optical and UVemission in the earliest galaxies.
42
8.6 JWST
JWST will be highly sensitive to emission from starlight in high redshiftgalaxies up to at least z ∼ 10, and by the advent of the ngVLA, JWSTdeep fields should be available for follow-up with the ngVLA. A corollary ofthis synergy is that an ngVLA with survey capability (for example, if fittedwith phased array feeds) could be used to perform a high frequency surveyfor CO-emitting galaxies in these fields, some of which may not be visible –even to JWST – if they are sufficiently dusty and/or have very low stellarmass.
9 Summary, Outlook, & Technical Requirements
The ngVLA will be a truly unique facility, primed to reveal many of themore elusive mysteries of galaxy formation and evolution. In this whitepaper, we have discussed some of the possible focus areas for such a facilityto the best of our ability and given the constraints of current knowledge.Weighing the science cases for these focus areas, we identify five Key ScienceProjects where a ngVLA could have a significant impact on studies of galaxyassembly through cosmic time, and which we summarize here:
1. The cold gas history of the universe
To-date, our knowledge of galaxy assembly at high-z has been basedalmost entirely on the stars and ionized gas which result from the starformation process. Due to limitations in instrumentation, the cold gasreservoirs that fuel the star formation have largely been ignored. Byblindly detecting the low-J CO emission in multiple galaxies at once, angVLA would supply this crucial missing piece of the galaxy assemblypuzzle. Excellent sensitivity on relatively short baselines (few km orless) could be critical to avoid over-resolution in unbiased searches.
2. Galactic dynamics at high-z
Even with hundreds of hours of telescope time on some of the brightestgalaxies in the universe, it remains challenging to resolve the cold gasat high-z with the current VLA. The relative importance of mergersand isolated disks in the early dust-enshrouded universe is thus anopen question. By easily resolving the cold gas reservoirs in high-zgalaxies on scales of a few hundred parsec to 1 kpc, a ngVLA wouldallow the community to characterize the dynamics of even the dustiestsystems at high-z.
43
3. Tracing star formation in early galaxies with dense gas
Studies in the local universe suggest that dense gas may be a more fun-damental tracer of star formation than the cold gas typically studiedin more distant galaxies. An order of magnitude fainter than CO, suchgas is beyond the reach of the VLA for all but a handful of stronglylensed hyper-starbursting galaxies. A ngVLA would facilitate the de-tection of low-J dense gas tracers at high-z, directly revealing the star-forming gas in galaxies during the peak epoch of star formation andbeyond.
4. Measuring dust-unbiased star formation with free-free emis-sion
Free-free emission is both relatively unaffected by dust obscurationand directly proportional to the production rate of ionizing photonsby young massive stars, making it a promising tracer of star forma-tion at high-z. Unfortunately, its faintness makes it extremely difficultto detect with current instruments, and even when it is detected, itis difficult to quantify contamination by a synchrotron component.A ngVLA would deliver the full radio spectral energy distributions ofhigh-z galaxies, making it possible to isolate the free-free component ofthe spectrum and thus determine more accurate star formation rates.
5. Magnetic fields in galaxies
The role of magnetic fields in star formation and galaxy evolutionare still poorly understood. A ngVLA would have the sensitivity,angular resolution, and unique microwave frequency range to producea detailed observational census of magnetic fields in a wide range ofgalaxies throughout the Local Supercluster (Laniakea) on scales fromsupermassive black hole accretion flows up to molecular clouds. Suchwork would be highly complementary to lower-frequency studies ofmagnetic fields on typically larger scales with the SKA.
As the ngVLA is still in the initial technical design phase, it is important forus to clearly state the specifications required by these key science projectsfor the endeavor as a whole to be successful. We summarize those technicalremarks here:
• Sensitivity. A minimum of 5 times the collecting area of the currentVLA would be necessary for a substantial impact on extragalactic sci-ence. This will dramatically improve our ability to transform high-z
44
single-source CO(1-0) follow-up to blank-field CO(1-0) detection cam-paigns, and bring the number of high-z CO(1-0) detections from ahandful to several thousands. This type of contribution is substantial.The vast majority of the extragalactic community currently focuses ongalaxies’ UV, optical and near-infrared emission. This leap in instru-mentation capability in the 1 cm regime has the potential to refocusthe community’s energy on the often dominant and always criticalmechanisms for galaxies’ emission: their dust and gas. We point thereader back to Figure 3.1 for a simple depiction of the improved sen-sitivity limits of ngVLA over the current VLA and ALMA (see alsoNRAO ngVLA Memo No. 5, Carilli et al., Figure 2).
• Antennae Size. With its 25 m antennae, the current VLA has a rel-atively small field of view. Assuming equal collecting area and smallerantennae (12 m), this could increase the field of view substantially, en-abling larger area mosaicked maps at equal cost. The field of view hassubstantial impact on the number of sources detectable in moleculargas per pointing, from ∼45 sources in a single 18 hour exposure (with12 m antennae) down to 10 sources (with 25 m antennae). There isa similar impact on the number of galaxies we will be able to char-acterize in a large-field mosaic, ranging from ∼1500 galaxies across2.5 < z < 9.5 (12 m) to ∼300 (25 m) with a 700 hour investment.We direct the reader to Figure 3.2 for an illustration of the antennaesize on the yield of CO(1-0) emitters at high-redshift, assuming equalcollecting area.
• Bandwidth. Wide bandwidth is a very useful component of high-z science with the ngVLA. Prior limitations restricted spectral linescience of high-z sources in the radio in previous generations, as fre-quencies were often too poorly constrained to waste time on multipletunings. Both a 3:1 and 5:1 RF bandwidth ratio would change thelandscape of spectral-line surveys for high redshift galaxies, where somany of the challenges faced by the community are rooted in simplysecuring adequate redshifts. We point the reader to Figures 3.1 and 3.5for an illustration of which lines would be simultaneously accessible towide-bandwidth observations in the 10–50 GHz range. Note that thejump from the current JVLA 2:1 bandwidth ratio to 3:1 is not a sub-stantial change (it is equivalent to being able to detect CO(1-0) in thefollowing redshift ranges: 1.5 < z < 4 at 2:1 and 1.5 < z < 6.5 at3:1), however a wider bandwidth certainly would help the efficiency of
45
high-redshift molecular gas deep field searches by capturing all relevantlines across a huge chunk of cosmic time.
• Spatial Resolution. The characteristic resolution needed to charac-terize the kinematics and dynamics in distant galaxies is ∼0.1′′ and isprimarily limited by the sensitivity limits per beam. There is no needfor extra long baselines for high-redshift work, with the exception ofprojects focused on resolving the black hole radius of influence in moredistant galaxies, at ∼30 mas resolution. We highlight Figure 4.1 asan illustration of resolving dynamics in high-redshift galaxies on 0.1′′
scales, and Figure 3.3 as the possible future capabilities of ngVLA indetecting detailed sub-structure in intrinsically fainter systems.
• Frequency Coverage. Aside from our continuum emission goals,which would ideally make use of the entire frequency coverage availableto the ngVLA (Figure 5.1), the sweet spot for high-redshift science fallsin the 10–50 GHz range, where spectral features (both low-J CO anddense gas tracers) are most prevalent beyond z ≈ 2. Again, we drawthe reader’s attention to Figures 3.1 and 3.5 for illustrations.
• Polarization Purity. Low instrumental leakage in both linear andcircular polarization is crucial for magnetic field science with the ngVLA.Dust polarimetry, the Goldreich-Kylafis effect, and the Zeeman effectrequire sensitivity to sub-percent polarized radiation. This, in turn,requires stable on-axis polarization with leakage terms small enoughto enable beam-center calibration to 0.1% in Stokes Q, U, and V. Cal-ibration residuals no worse than about 0.5% at the primary beam halfpower radius are required to enable polarization mapping of extendedsources, which is of particular importance for dust polarimetry.
The next few decades of technological development for astronomical in-strumentation will certainly lead to baffling discoveries, many of which willbe difficult or impossible to predict. The next generation VLA will be anessential tool towards this end, fulfilling a unique niche untapped by anyother radio facility at 10s of GHz.
References
Aalto, S. et al. 2007, A&A, 464, 193.
Adam, R. et al. 2015, A&A, 576, A12.
46
Afonso, J. et al. 2014, ArXiv e-prints.
Aitken, D. K. et al. 2002, MNRAS, 329, 647.
Alatalo, K. et al. 2011, ApJ, 735, 88.
Aravena, M. et al. 2010, ApJ, 718, 177.
Barger, A. J. et al. 2012, ApJ, 761, 89.
Beck, R. 2007, A&A, 470, 539.
Beck, R. 2015, in Astrophysics and Space Science Library, ed. A. Lazarian,E. M. de Gouveia Dal Pino, and C. Melioli, volume 407 of Astrophysicsand Space Science Library, 3.
Bolatto, A. D., Wolfire, M., and Leroy, A. K. 2013, ARA&A, 51, 207.
Bothwell, M. S. et al. 2010, MNRAS, 405, 219.
Bothwell, M. S. et al. 2013, MNRAS, 429, 3047.
Bouwens, R. J. et al. 2009, ApJ, 705, 936.
Broderick, J. W. et al. 2007, MNRAS, 381, 341.
Brunthaler, A., Bower, G. C., and Falcke, H. 2006, A&A, 451, 845.
Capak, P. L. et al. 2015, Nature, 522, 455.
Carilli, C. et al., Next Generation VLA Memo. No. 5: Project Overviewhttp: // library. nrao. edu/ ngvla. shtml .
Carilli, C. L. 2001, in Starburst Galaxies: Near and Far, ed. L. Tacconi andD. Lutz, 309.
Carilli, C. L. et al. 2005, ApJ, 618, 586.
Carilli, C. L. and Walter, F. 2013, ARA&A, 51, 105.
Casey, C. M. 2012, MNRAS, 425, 3094.
Casey, C. M. et al. 2012, ApJ, 761, 140.
Casey, C. M. et al. 2011, MNRAS, 415, 2723.
Casey, C. M., Narayanan, D., and Cooray, A. 2014, Physics Reports, 541,45.
Chandrasekhar, S. and Fermi, E. 1953, ApJ, 118, 116.
Chapman, S. C. et al. 2005, ApJ, 622, 772.
Chatterjee, S. et al. 2008, MNRAS, 390, 535.
Condon, J. J. 1992, ARA&A, 30, 575.
Cowie, L. L. and Songaila, A. 1986, ARA&A, 24, 499.
da Cunha, E. et al. 2013a, ApJ, 766, 13.
da Cunha, E. et al. 2013b, ApJ, 765, 9.
Daddi, E. et al. 2008, ApJL, 673, L21.
Danielson, A. L. R. et al. 2011, MNRAS, 410, 1687.
Danielson, A. L. R. et al. 2015, MNRAS.
Dannerbauer, H. et al. 2009, ApJL, 698, L178.
Dave, R. et al. 2010, MNRAS, 404, 1355.
Dekel, A. et al. 2009, Nature, 457, 451.
Draine, B. T. et al. 2007, ApJ, 663, 866.
Draine, B. T. and Lazarian, A. 1998, ApJL, 494, L19.
Dunne, L. et al. 2009, MNRAS, 394, 1307.
Emonts, B. et al. 2014, MNRAS, 438(4), 2898.
Emonts, B. et al. 2015, MNRAS, 451(1), 1025.
Falceta-Goncalves, D., Lazarian, A., and G., K. 2008, ApJ, 679, 537.
Farnes, J. S. et al. 2014, ApJ, 795, 63.
Forster Schreiber, N. M. et al. 2009, ApJ, 706, 1364.
Fu, H. et al. 2015, ApJ, 799, 72.
Gabuzda, D. C., Knuettel, S., and Reardon, B. 2015, MNRAS, 450, 2441.
Gao, Y. et al. 2007, ApJL, 660, L93.
48
Gao, Y. and Solomon, P. M. 2004, ApJ, 606, 271.
Garcıa-Burillo, S. et al. 2012, A&A, 539, A8.
Goldreich, P. and Kylafis, N. D. 1982, ApJ, 253, 606.
Greaves, J. S. et al. 2000, Nature, 404, 732.
Greaves, J. S. et al. 1999, A&A, 344, 668.
Greve, T. R. et al. 2014, ApJ, 794, 142.
Hainline, L. J. et al. 2006, ApJ, 650, 614.
Hayward, C. C. et al. 2012, MNRAS, 424, 951.
Hensley, B., Ostriker, J. P., and Ciotti, L. 2014, ApJ, 789, 78.
Hezaveh, Y. D. et al. 2013, ApJ, 767, 132.
Hildebrand, R. H. and Dragovan, M. 1995, ApJ, 450, 663.
Hodge, J. A. et al. 2012, ApJ, 760, 11.
Hodge, J. A. et al. 2013, ApJ, 768, 91.
Hodge, J. A. et al. 2015, ApJL, 798, L18.
Homan, D. C. 2012, ApJ, 747, 24.
Houde, M. 2009, ApJ, 706, 1504.
Houde, M. et al. 2013, ApJ, 764, 24.
Houde, M. et al. 2005, in Astronomical Polarimetry: Current Status andFuture Directions, ed. A. Adamson, C. Aspin, C. Davis, and T. Fujiyoshi,volume 343 of Astronomical Society of the Pacific Conference Series, 154.
Hovatta, T. et al. 2012, AJ, 144, 105.
Issa, M. R., MacLaren, I., and Wolfendale, A. W. 1990, A&A, 236, 237.
Ivison, R. J. et al. 2011, MNRAS, 412, 1913.
Izumi, T. et al. 2015, ApJ, 811, 39.
Karim, A. et al. 2013, MNRAS, 432, 2.
49
Kimball, A. E. et al. 2011, ApJL, 739, L29.
Kimball, A. E. et al. 2015, MNRAS, 452, 88.
Kormendy, J. and Ho, L. C. 2013, ARA&A, 51, 511.
Krolik, J. H. 1999, Active galactic nuclei : from the central black hole tothe galactic environment, ).
Krumholz, M. R. and Thompson, T. A. 2007, ApJ, 669, 289.
Kylafis, N. D. 1983, ApJ, 267, 137.
Lazarian, A. 2007, JQSRT, 106, 225.
Leach, R. W. et al. 1991, ApJ, 370, 257.
Li, H.-B. and Henning, T. 2011, Nature, 479, 499.
Lisenfeld, U. and Ferrara, A. 1998, ApJ, 496, 145.
Macquart, J.-P. et al. 2006, ApJ, 646, 111.
Magdis, G. E. et al. 2012, ApJ, 760, 6.
Magdis, G. E. et al. 2011, A&A, 534, A15.
Martı-Vidal, I. et al. 2015, Science, 348, 311.
Martin, C. L. et al. 2015, ApJ, 803, 6.
Massardi, M. et al. 2013, MNRAS, 436, 2915.
McBride, J. D. G. 2014. PhD thesis, University of California, Berkeley.
Murphy, E. et al. 2015a, Advancing Astrophysics with the Square KilometreArray (AASKA14), 85.
Murphy, E. J. 2009, ApJ, 706, 482.
Murphy, E. J. et al. 2015b, ApJ.
Narayanan, D. 2015, in IAU Symposium, ed. B. L. Ziegler, F. Combes, H.Dannerbauer, and M. Verdugo, volume 309 of IAU Symposium, 214.
Narayanan, D. et al. 2008, ApJ, 684, 996.
Narayanan, D. et al. 2010, MNRAS, 401, 1613.
50
Narayanan, D. et al. 2015, Nature, 525, 496.
Noeske, K. G. et al. 2007, ApJL, 660, L43.
Olsen, K. P. et al. 2015, ArXiv e-prints.
Papadopoulos, P. P. et al. 2012, MNRAS, 426, 2601.
Rabidoux, K. et al. 2014, ApJ, 780, 19.
Reissl, S., Wolf, S., and Seifried, D. 2014, A&A, 566, A65.
Remy-Ruyer, A. et al. 2014, A&A, 563, A31.
Riechers, D. A. et al. 2013, Nature, 496, 329.
Riechers, D. A. et al. 2011, ApJL, 733, L11.
Riechers, D. A. et al. 2008, ApJ, 686, 851.
Riechers, D. A. et al. 2007, ApJL, 671, L13.
Robishaw, T. et al. 2015, ArXiv e-prints.
Rowe, B. and Silk, J. 2011, MNRAS, 412, 905.
Ruan, J. J., McQuinn, M., and Anderson, S. F. 2015, ApJ, 802, 135.
Rupke, D. S., Veilleux, S., and Sanders, D. B. 2005, ApJS, 160, 115.
Sanders, D. B. and Mirabel, I. F. 1996, ARA&A, 34, 749.
Santini, P. et al. 2014, A&A, 562, A30.
Scoville, N. et al. 2014, ApJ, 783, 84.
Simpson, J. et al. 2014, ApJ, 788, 125.
Solomon, P. et al. 2003, Nature, 426, 636.
Solomon, P. M. and Vanden Bout, P. A. 2005, ARA&A, 43, 677.
Spilker, J. S. et al. 2015, ApJ, 811, 124.
Stirling, A. M. et al. 2003, MNRAS, 341, 405.
Swinbank, A. M. et al. 2004, ApJ, 617, 64.
51
Tacconi, L. J. et al. 2008, ApJ, 680, 246.
Van Eck, C. et al. 2015, ApJ, 799, 35.
Vanden Bout, P. A., Solomon, P. M., and Maddalena, R. J. 2004, ApJL,614, L97.
Vasiliev, E., Antonini, F., and Merritt, D. 2015, ApJ, 810, 49.
Walter, F., Weiss, A., and Scoville, N. 2002, ApJL, 580, L21.
Weiß, A. et al. 2013a, ApJ, 767, 88.
Weiß, A. et al. 2013b, ApJ, 767, 88.
Wu, J. et al. 2005, ApJL, 635, L173.
Wu, J. et al. 2010, ApJS, 188, 313.
Zakamska, N. L. and Greene, J. E. 2014, MNRAS, 442, 787.
Zhang, C. et al. 2014, Research in Astronomy and Astrophysics, 14, 1221.

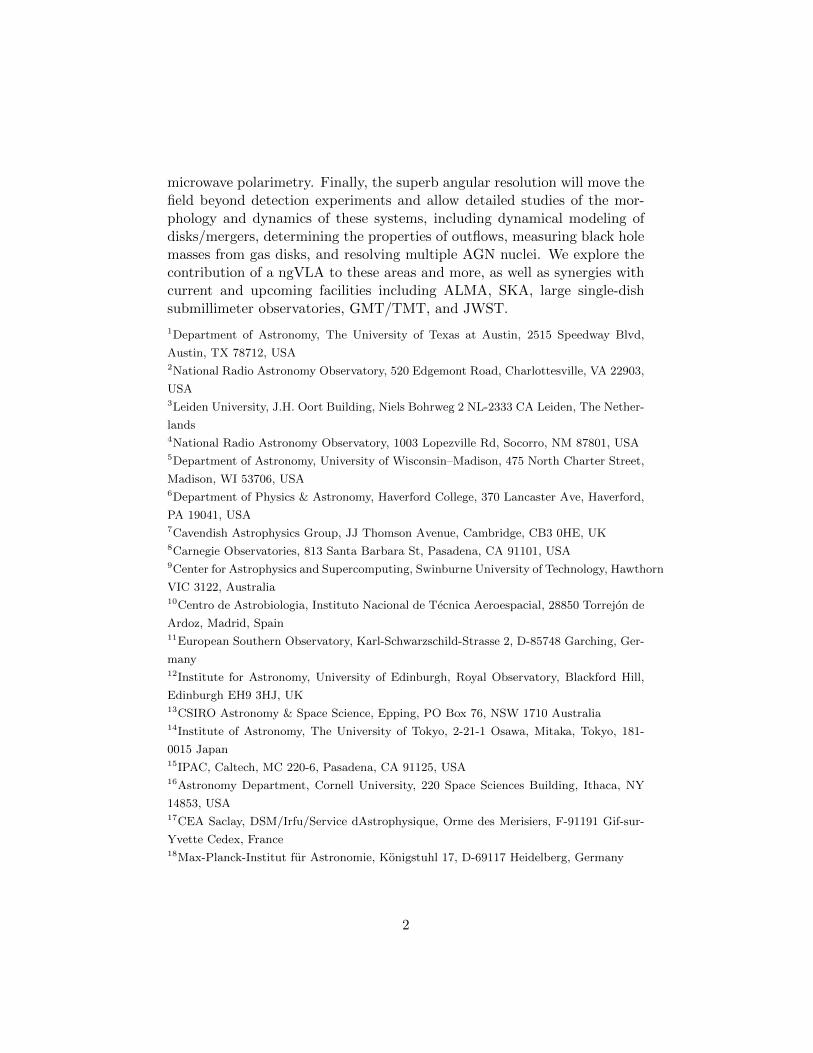


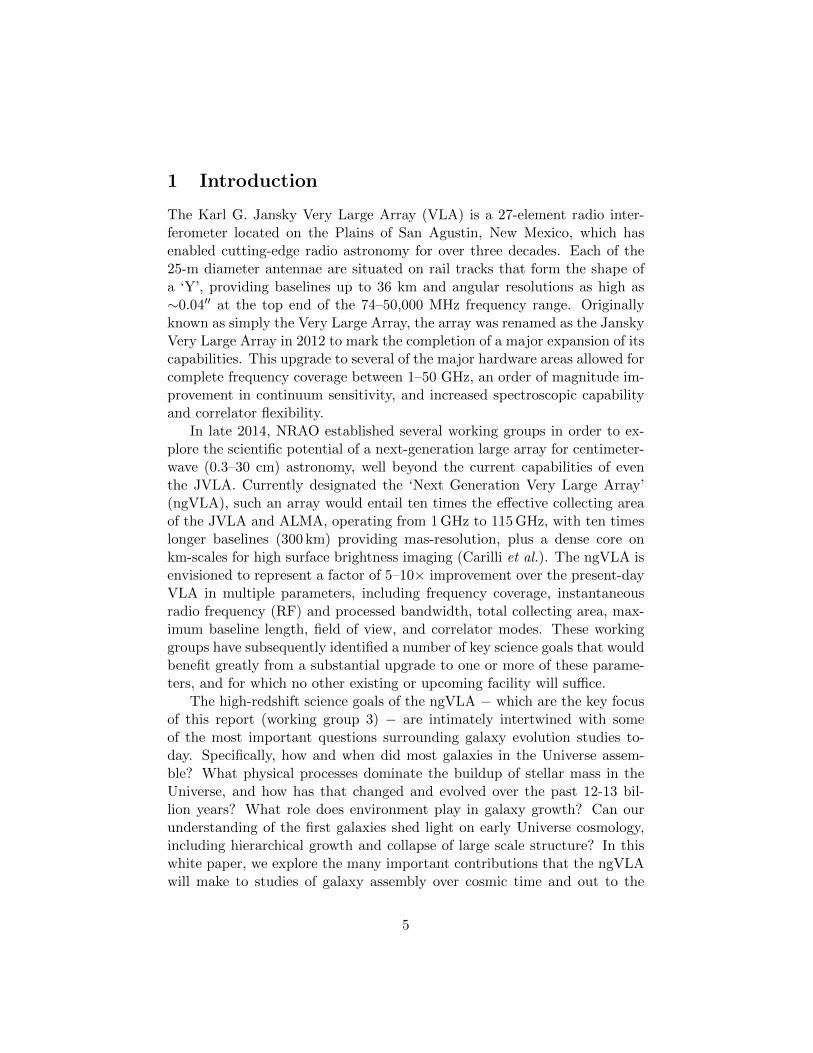
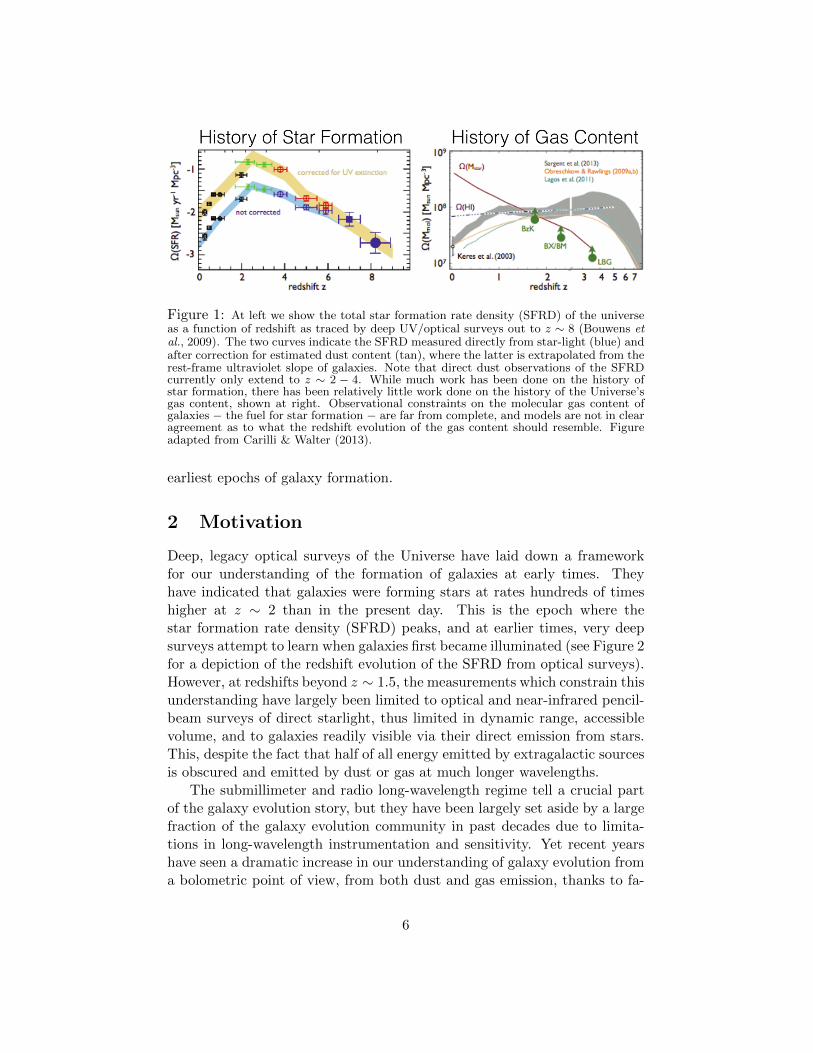


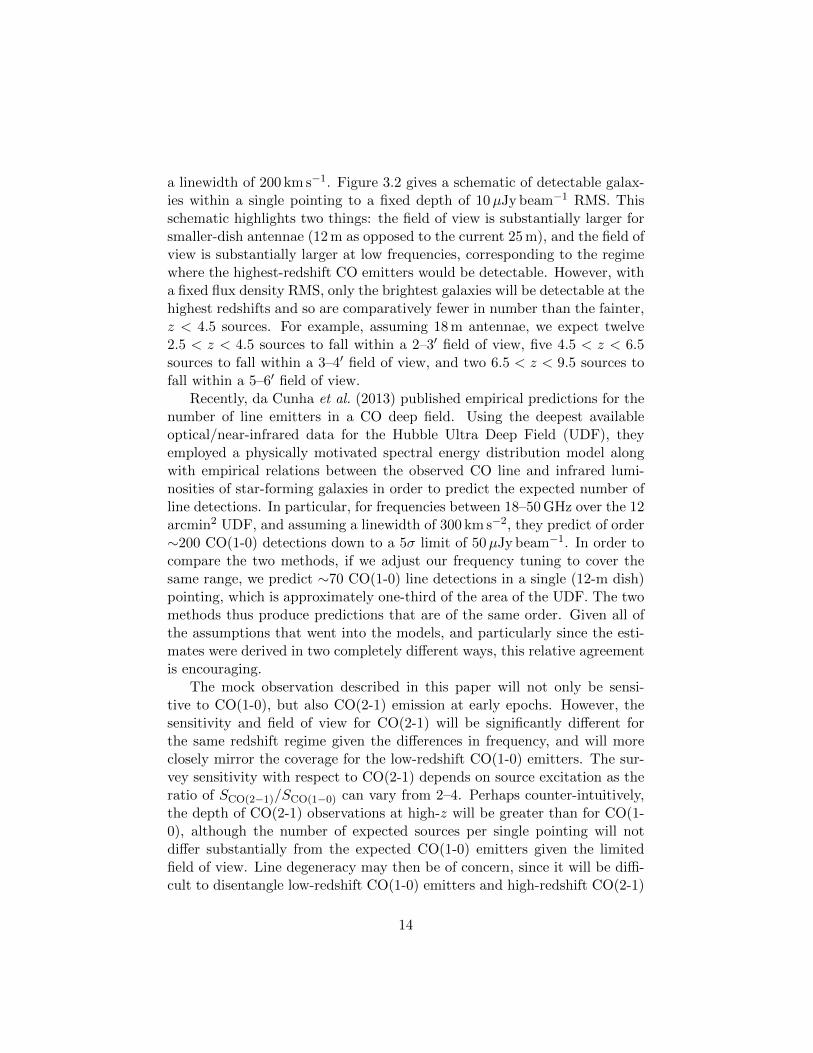
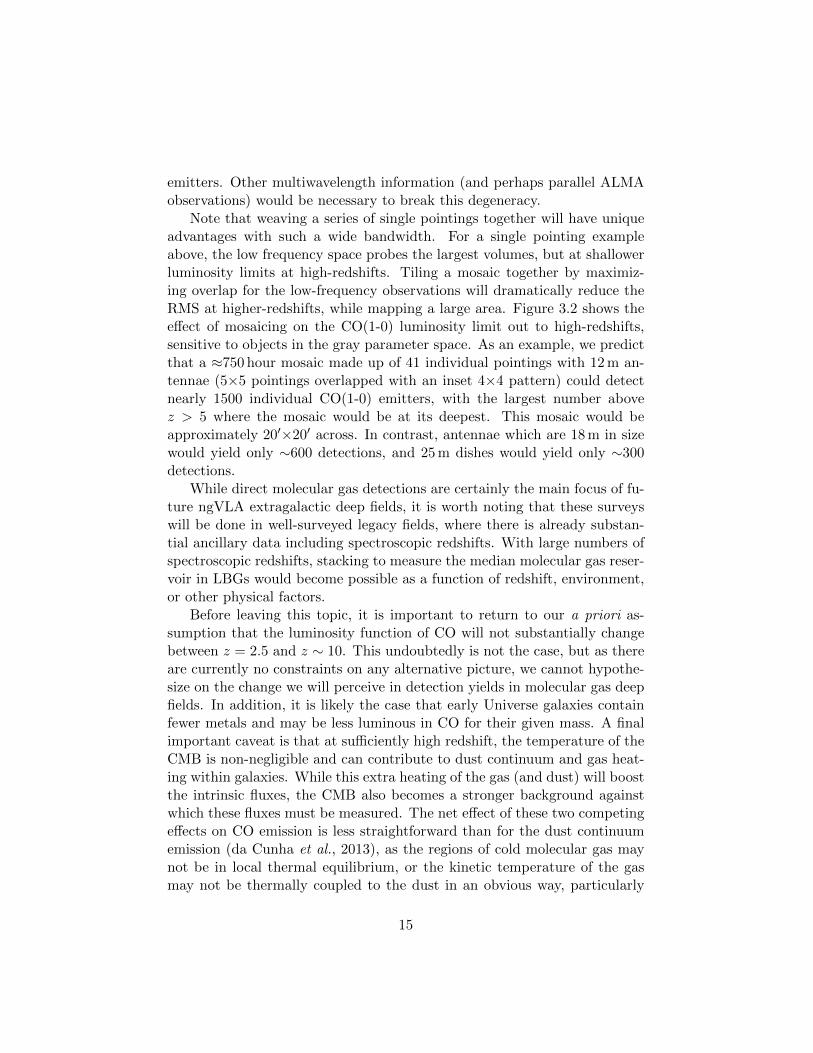

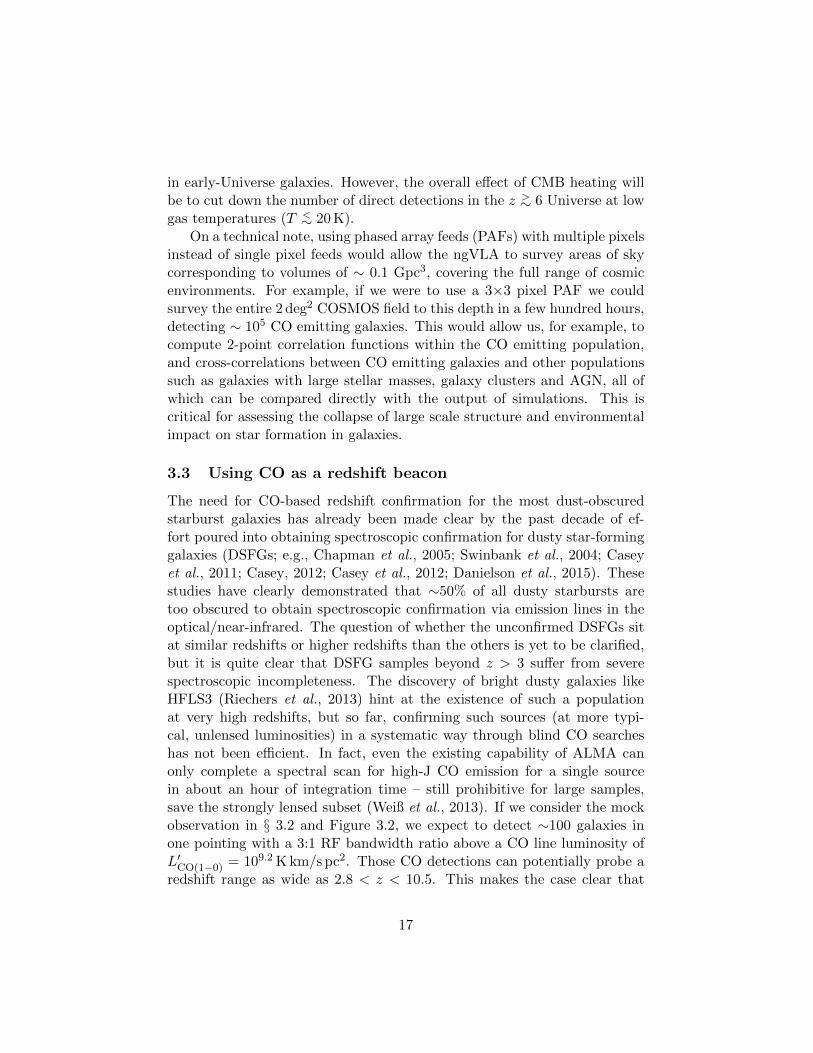

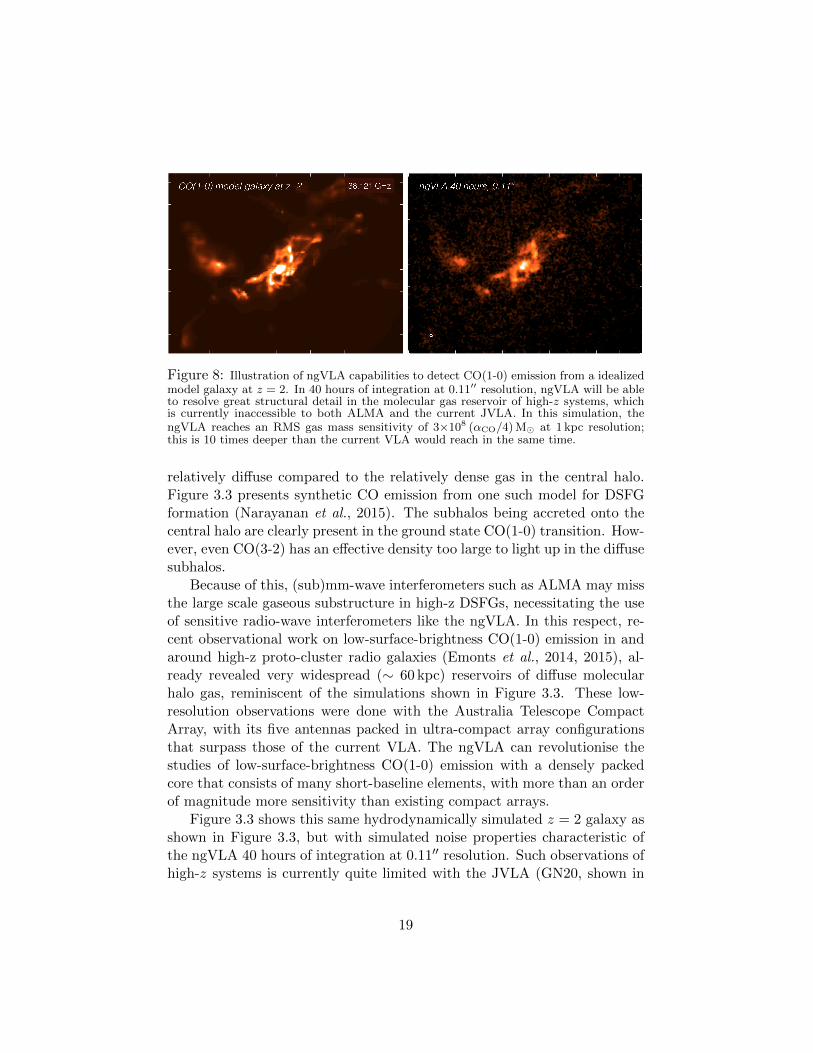

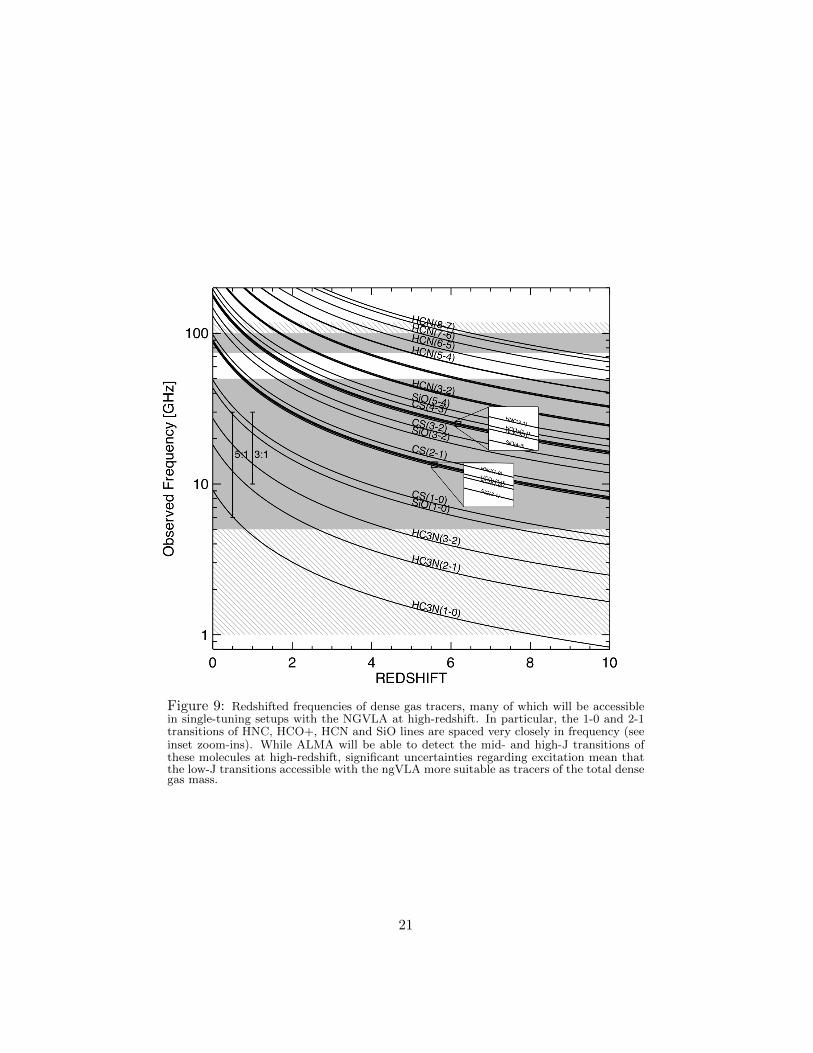


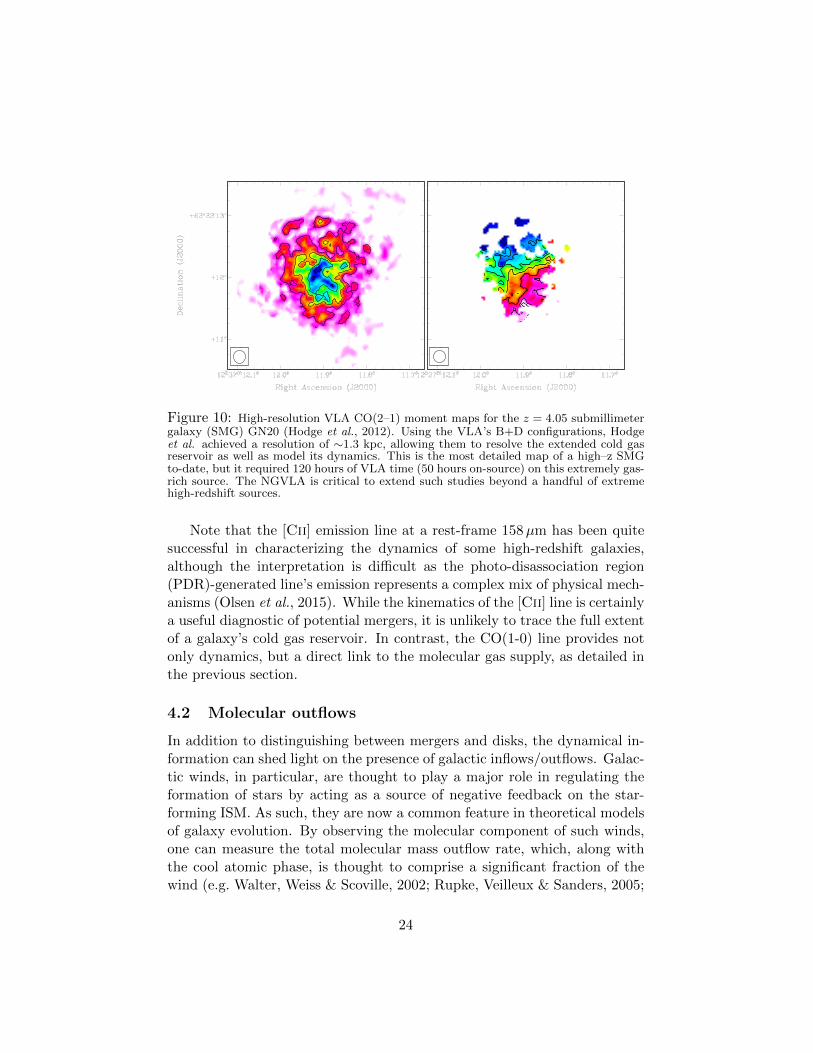


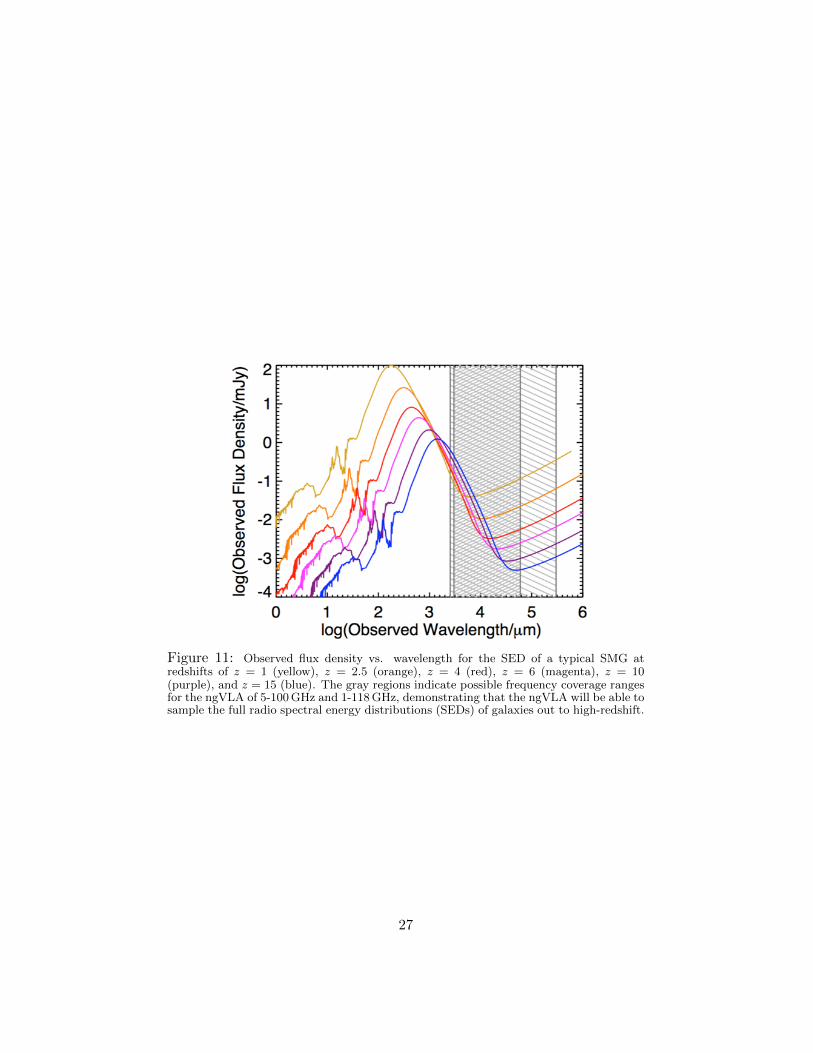

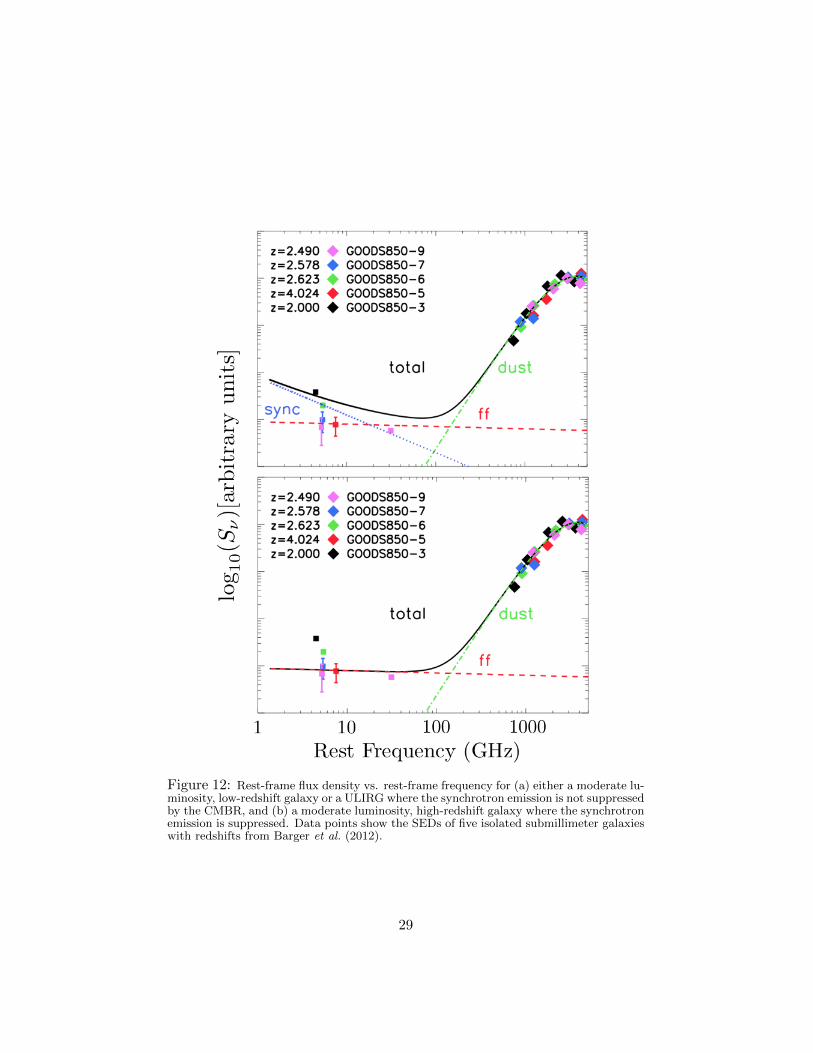


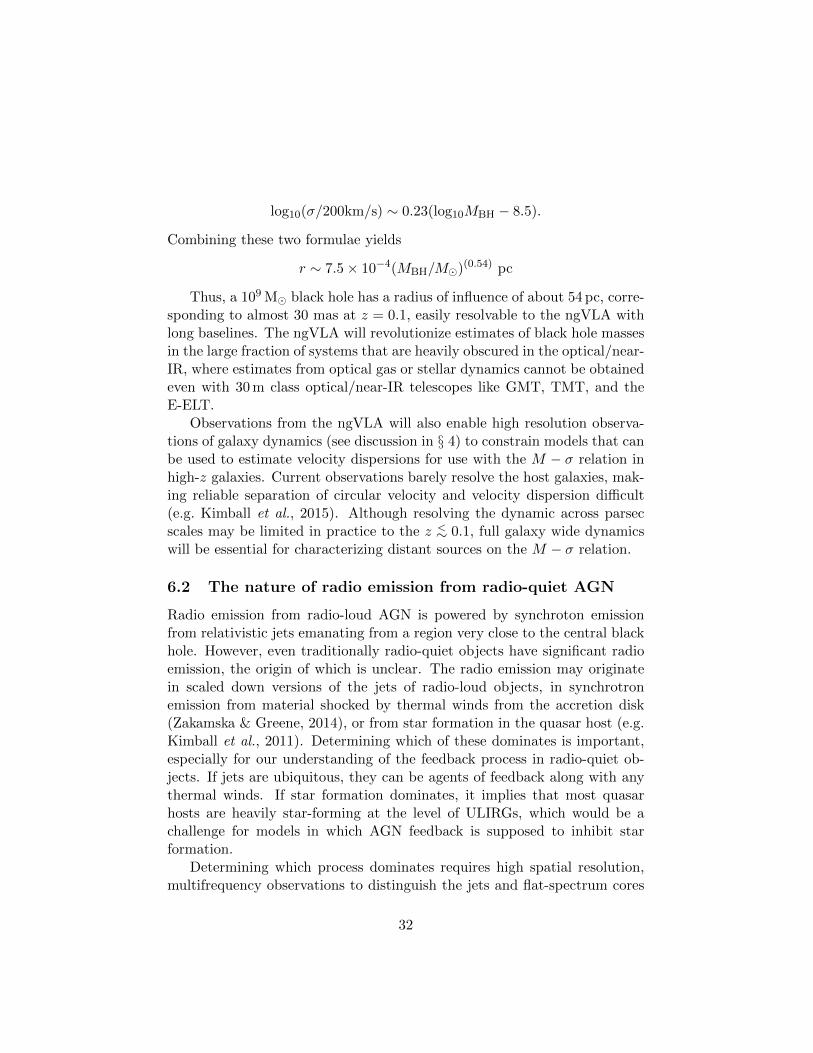


![To: VLBA Data Acquisition Group From: Alan E.E. Rogers A ...library.nrao.edu/public/memos/vlba/data/VLBAD_169.pdf1] Generate pseudo random square wave with 8 MHz sample rate 2] FFT](https://static.documents.pub/doc/80x56/60da98bd647ec85786793ae3/to-vlba-data-acquisition-group-from-alan-ee-rogers-a-1-generate-pseudo.jpg)


