38
November 2020 Non-Domestic Smart Energy Management Innovation Competition Evaluation case study: Energy in Schools
November 2020
Non-Domestic Smart Energy Management Innovation Competition Evaluation case study: Energy in Schools

Acknowledgements
This report was prepared by Ipsos MORI, in partnership with the Carbon Trust and Technopolis. The research would not have been possible without the cooperation of all of those who participated in interviews, surveys and workshops.
© Crown copyright 2020
This publication is licensed under the terms of the Open Government Licence v3.0 except where otherwise stated. To view this licence, visit nationalarchives.gov.uk/doc/open-government-licence/version/3 or write to the Information Policy Team, The National Archives, Kew, London TW9 4DU, or email: [email protected].
Where we have identified any third-party copyright information you will need to obtain permission from the copyright holders concerned.
Any enquiries regarding this publication should be sent to us at: [email protected]
3
Contents Executive summary _________________________________________________________ 4
1 Introduction ______________________________________________________________ 6
Overview of Energy in Schools _______________________________________________ 6
The anticipated effects of Energy in Schools ____________________________________ 7
Key features of Energy in Schools ____________________________________________ 8
How Energy in Schools was piloted __________________________________________ 11
This evaluation __________________________________________________________ 11
This report _____________________________________________________________ 11
2 How users engaged with Energy in Schools ____________________________________ 12
How Energy in Schools was used ___________________________________________ 12
Profile of users __________________________________________________________ 13
How use of Energy in Schools was promoted and supported _______________________ 14
Induction support ______________________________________________________ 14
Technology set-up support _______________________________________________ 14
Energy Champion programme ____________________________________________ 15
The TV and league table _________________________________________________ 15
3 The results of the pilot of Energy in Schools ____________________________________ 16
Immediate outcomes _____________________________________________________ 16
Energy-manager outcomes: improved monitoring and understanding ______________ 16
Energy-manager outcomes: increased engagement in the market _________________ 17
Teacher and pupil outcomes: learning and developing skills _____________________ 18
Medium-term outcomes ___________________________________________________ 20
Improved energy-management behaviours and operations ______________________ 20
Adoption of energy efficient technologies ____________________________________ 21
The effects of Energy in Schools on energy consumption and energy bills __________ 21
Longer-term outcomes ____________________________________________________ 23
4 Conclusions _____________________________________________________________ 25
Annex 1 Methodology ______________________________________________________ 27
Annex 2 Assessment of Energy in Schools’ contribution to energy savings _____________ 30
Annex 3 Components of the Energy in Schools dashboard and user access ____________ 35
Annex 4 Energy in Schools screenshots ________________________________________ 36
NDSEMIC evaluation case study: Energy in Schools
4
Executive summary This report describes findings and lessons from the pilot of Energy in Schools, an energy management tool piloted by Samsung as part of the UK Government’s Non-Domestic Smart Energy Management Innovation Competition (NDSEMIC). Energy in Schools is an online portal with an accompanying educational package aimed at helping schools to monitor and learn about their energy use in order to change their behaviour, save energy and save costs. It comprises: an online portal, energy monitoring equipment, a tariff-switching portal, a TV display of the portal (to be placed in a communal space) and a range of educational features. It was piloted across 20 primary and secondary schools.
There is clear evidence from the evaluation that schools who piloted the tool changed their energy behaviour to become more efficient – this is inferred to lead to energy savings. The qualitative evidence from the surveys, site visits and the research conducted by Samsung’s consortium partner (CSE) converge to provide a high level of confidence that the Energy in Schools tool has contributed to energy savings in at least some schools.1 Energy managers in pilot schools reported that, after using the tool, they introduced operational changes to reduce energy use such as the addition of timers for hot water points. Teachers used Energy in Schools tool to raise pupils’ awareness of the science behind energy and the environmental and social impacts of its use, while also learning themselves about energy consumption in the school and how it could be reduced. Pupils, supported by a series of Energy Champion activities, used the tool for learning and to encourage energy saving behaviour within the school, leading – in some cases – to staff behaviour change.
The educational offer of Energy in Schools was crucial to gaining the initial interest of schools, while the induction given to the schools’ main users was pivotal to its uptake. Pupils were empowered to enact change within schools as they had the same access to energy data as the school staff. Pupils were particularly motivated by the competition with other schools, sparked by a league table comparing consumption to that of other schools. Displaying this league table and the school’s energy use in a TV screen in the school’s common areas engaged pupils beyond those participating in the Energy Champion activities and helped sustain full-school interest in energy efficient actions.
The findings from this report suggest Samsung could take forward the following points as it progresses its commercial offer, which may also be relevant for other innovators:
• Pupils were effective agents of change within schools. Energy in Schools should therefore continue to shape the programme around the needs and interests of pupils (e.g. through ongoing use of attractive visuals, promotion of the Energy Champion scheme and through the lesson plans).
• The support provided by Energy in Schools to schools on induction (face-to-face induction day) and throughout the pilot (phone and email support alongside manuals) was hugely beneficial to users and was effective at engaging a range of users. If cost-effective, Samsung should maintain this feature of its package.
• Factors motivating pupil engagement included the ‘off-peak point’ reward system and the responsibility instilled in pupils through the Energy Champion training scheme.
1 This is the conclusion reached from applying the evaluation’s strength of evidence framework (see Chapter three). This framework triangulated various quantitative and qualitative data sources to give a level of confidence that savings had been achieved in some pilot sites.
NDSEMIC evaluation case study: Energy in Schools
5
Teachers considered that further elaboration of this (with badges, etc.) might further engage them. The league table had mixed responses, as some schools found being at the bottom of the league was demotivating, so Samsung might consider adapting this, such as allowing the league table to be removed from the large TV screen.
• Whilst schools enacted a range of behaviour changes which they attributed to the tool, some had felt that the activities (e.g. switching off lights) were low impact in the long-term; clear, actionable advice on how to make bigger changes to energy use and bills might help schools take their energy use reduction to a greater level.
• The TV screen offered as part of Energy in Schools was successful in most schools at keeping energy use ‘front of mind’, engaging teachers and pupils beyond those involved in the Energy Champion scheme and stimulating discussion between users. However, not all schools used it; therefore, Samsung might consider offering this as an optional add-on rather than a standard part of the package.
NDSEMIC evaluation case study: Energy in Schools
6
1 Introduction This report describes the findings and lessons from the evaluation of Energy in Schools, an energy management and education platform designed and delivered by Samsung together with the Centre for Sustainable Energy (CSE), Lancaster University and My Utility Genius.2
The tool was developed as part of the UK Government’s Non-Domestic Smart Energy Management Innovation Competition (NDSEMIC). NDSEMIC (from here on referred to as ‘the Competition’) is an £8.8 million programme, funded by the Department for Business, Energy and Industrial Strategy (BEIS). It aims to maximise the potential for energy saving in three priority sectors (hospitality, retail and schools). To do this, it has developed energy management products and services that use smart meter data to help smaller organisations to manage their energy consumption better.
Nine projects were selected as part of the Competition to receive initial development funding. Seven of these passed through to the next ‘feasibility and initial testing’ stage. All seven project developers, including Energy in Schools, also went through to the final stage of the Competition (from February 2019 to January 2020) during which the innovations were piloted with small businesses and schools in a real-world setting.
This report is part of a package of reports published as products of the Competition, which also includes six other pilot evaluations, an overall final evaluation report, insights for innovators, user impact case studies and an evaluation technical report. These are available on www.gov.uk.
Overview of Energy in Schools
Energy in Schools is an initiative which aims to help schools reduce their energy usage and energy bills and educate pupils about energy efficiency. It comprises: an online portal through which energy data is displayed graphically, energy monitoring equipment (enabling equipment-level and temperature monitoring) and educational components. The latter included technology which could be used by pupils to learn how to code small computers to monitor energy around the school. During the feasibility and initial testing phase of the pilot, the tool also included an accredited energy supplier switching platform.3 More information on each of these features is provided below.
Energy in Schools had four key goals which were to:
• Help schools reduce energy consumption.
2 Samsung provided the technology and developed the front and back end of the platform, CSE conducted user testing, Lancaster University played a key role in recruiting schools via their networks and designed the lesson plans, and My Utility Genius developed aspects related to switching and time of use. 3 Ultimately, this latter functionality could be not implemented as intended – a lack of suitably-sized smart meters meant that actual TOU tariffs could not be tested. In earlier testing of the tool in Phase 2, off-peak usage was incentivised with energy cashback. However, in Phase 3, there was insufficient budget to incentivise schools therefore the energy cashback feature was not included.
NDSEMIC evaluation case study: Energy in Schools
7
• Help schools reduce energy costs by switching to time-of-use4 (ToU) tariffs which are tailored to the way schools use energy throughout the day and by reducing dependence on energy brokers.
• Improve pupils’ and teachers’ understanding of climate change, energy and computing.
• Empower pupils to lead the way via an ‘Energy Champions’ training programme to support whole-school behaviour change.
The anticipated effects of Energy in Schools
Energy in Schools was targeted at pupils, teachers and energy managers in schools. It was expected that, through engagement with the platform, these users would increase their awareness and understanding of how energy is used in the school. This was expected, in turn, to result in more energy-efficient behaviours, including the purchase of more energy-efficient equipment and switching to smarter tariffs. These changes were expected to generate impacts on CO2 reduction and improve the sustainability-consciousness of schools beyond pilot sites and the pilot period.
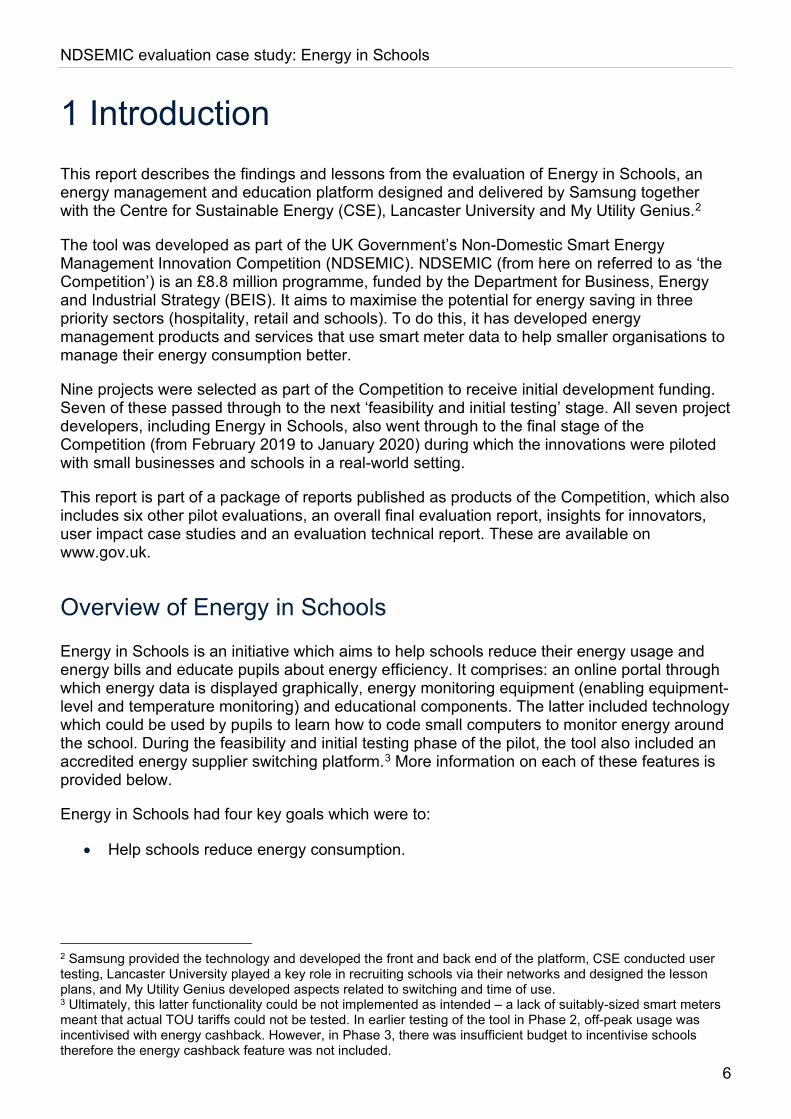
Figure 1 presents this theory of change.5 It describes: the activities that Samsung conducted to develop the tool, the direct outputs of these activities, and anticipated short-term and long-term results (‘outcomes’). By the project’s close in January 2020, the project was intended to have met, or be contributing to all of its proposed short-term outcomes, as well as showing evidence towards meeting some of the longer-term outcomes.
4 Time of use tariffs are charged at a lower rate at off-peak times, such as overnight or at weekends. This rewards consumers for using energy away from peak times, thus reducing the overall demand on the energy system at peak times. 5 A theory of change describes how change is assumed to come about through an intervention. It often shows in a diagram the connections between interventions and outcomes – these are often described as causal pathways or results chains.
NDSEMIC evaluation case study: Energy in Schools
8
Figure 1: Logic model showing Energy in Schools’ theory of change
Key features of Energy in Schools
The Energy in Schools energy management and educational package comprised various components which can be grouped as follows:
1. Energy monitoring equipment, including temperature sensors, light sensors, electricity monitoring devices and a hub collating the information.
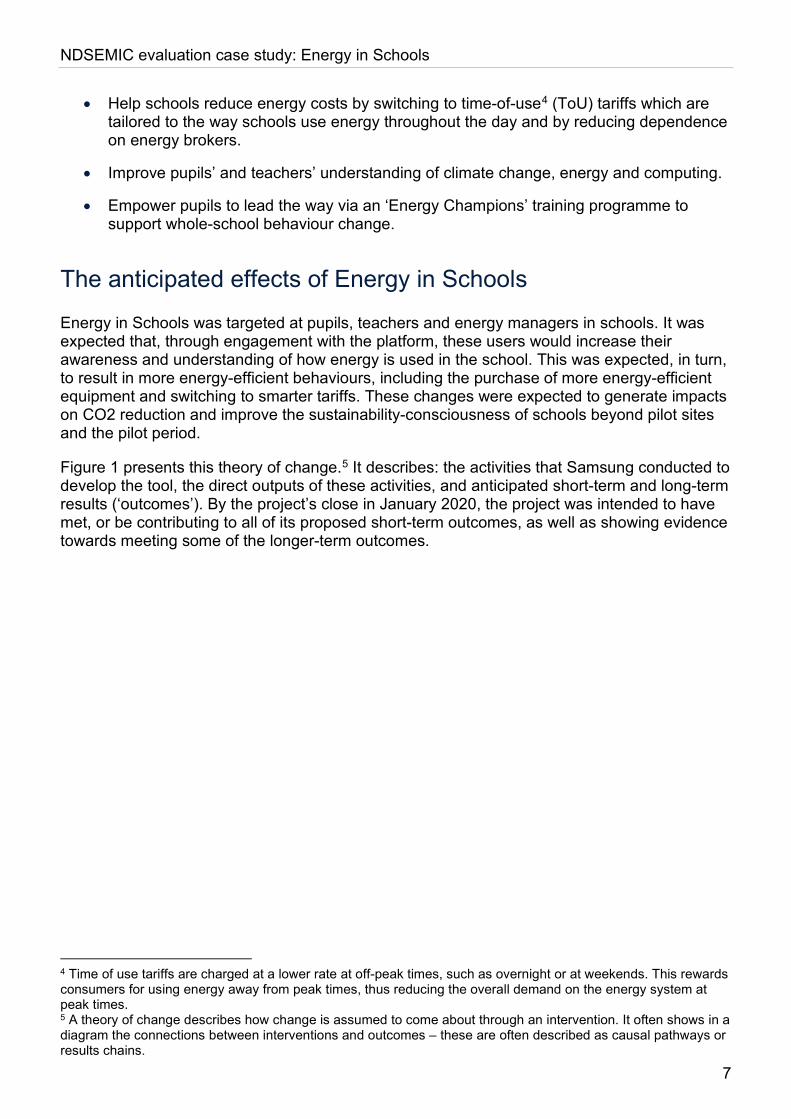
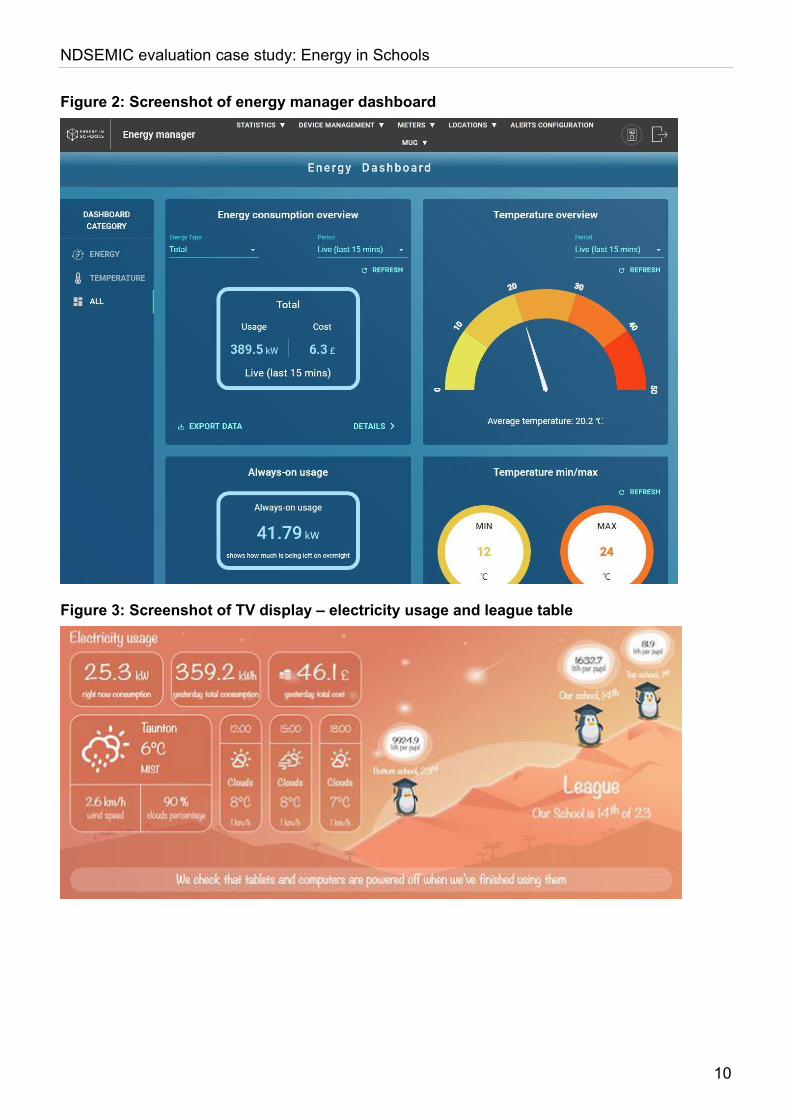
2. An online portal (see Figure 2)6 which presented all of the energy data gathered via the monitors and other sources to present information on:
a. Live7 and historical energy use in kilowatt hours (kWh) and GBP (£) and by electricity and gas (where available).
b. Temperature data (live and historic).
c. Floor maps of the school, which had to be entered manually and could be annotated to include the location of temperature and equipment sensors and (thus) display live temperature readings at different locations in the school.
d. (For energy managers only) alerts for when energy use or room temperatures surpass expected levels.
6 Annex 4 provides further screenshots of the tool. 7 Live data in the context of this Competition describes energy consumption data at half hourly (or more detailed) granularity fed to the tool or platform on an on-going basis. Non-live data may provide the same level of granularity but is not updated on an ongoing basis, for example being uploaded to the tool or platform once a day and in arrears.
Short-term Direct Outcomes Outputs Long-term Outcomes/Impacts
Micro:Bitcustomer friendly
platform that allows all
users within schools to access and
manage data leading to
switch to HH settlements Increased
number of schools adopt/
engage with the tool, follow
advices and set targets
Increased awareness/ discussion of energy
use
Increased engagement in energy market (e.g. tariff options, cleaner
energy switch)
Op. improvements in processes/behaviours &
Automated / more efficient energy mngt
Advocacy to other schools
Facilities Mangers / Procurement Officers:
Pupils:
Teachers:
Lower bills, Small scale CO2 reductions,
Pupils learn about energy
Pupils develop skills (Mainly coding)
Teachers promote peer learning
Schools:
Pupils:Next generation
becomes more energy conscious – Large scale
behaviour change
Sustainability consciousness
institutions
Savings redirected to more EE equip./
systems, or other educational activities
Switching to TOU tariffs, HH and energy
cashback
Improved monitoring & understanding of
energy use
Teachers learn about energy
Teachers learn coding and adopt energy topics in syllabus
Sample of trial sites
Technology trialling,
monitoring and updates
Activities
Recruitment of trial sites
Technology develop-
mentAdoption of more
efficient techs
Large scale reduction in CO2 and energy
consumption
Improved school learning environment
NDSEMIC evaluation case study: Energy in Schools
9
3. A tariff-switching platform which monitored the school’s energy usage during the hours of 4-7pm. (These are hours usually charged as ‘on peak’ under the day/night tariffs typically used by schools, but also hours at which schools use much lower rates of energy than other public-use buildings and businesses given the earlier closing time of schools). The platform compared energy costs at these times to a model time-of-use (ToU) tariff created by Samsung and its partners in order to demonstrate to schools the savings they could make by seeking out and switching to ToU tariffs.8 Reduced use between the hours of 4-7pm would result in ‘points’ being awarded to the school. These points were then used to incentivise further reductions, as they were fed into a ‘league table’ of participating schools.
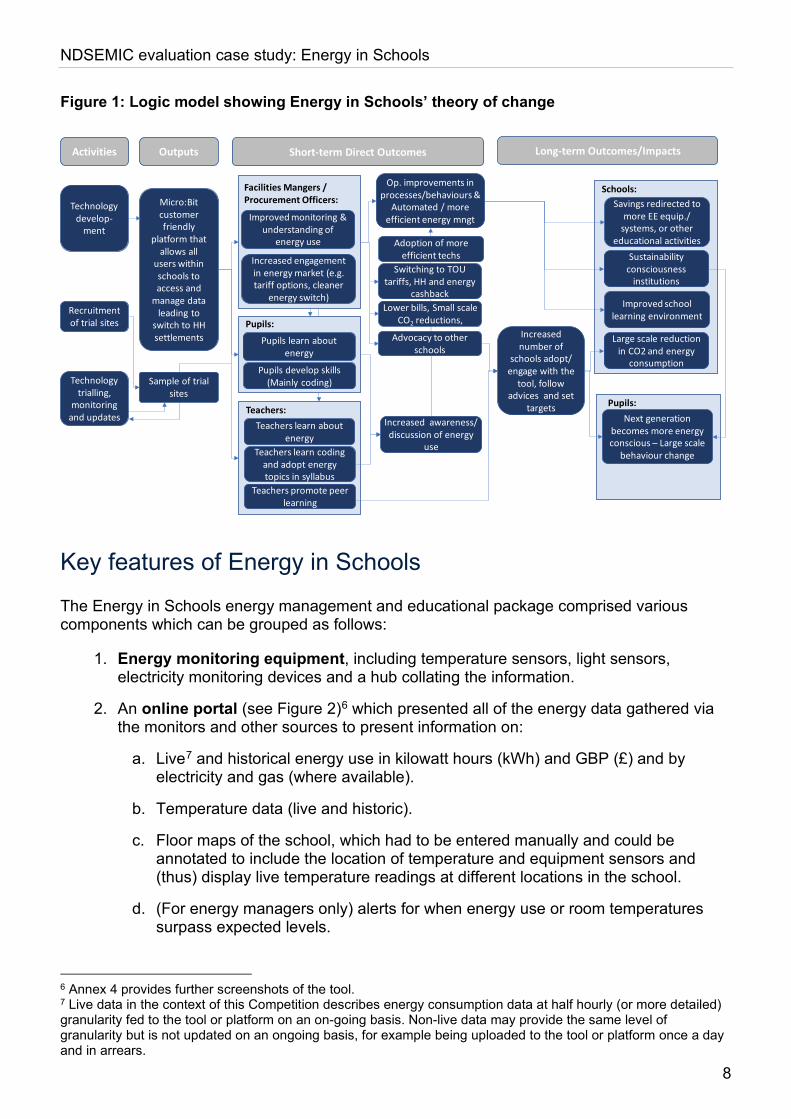
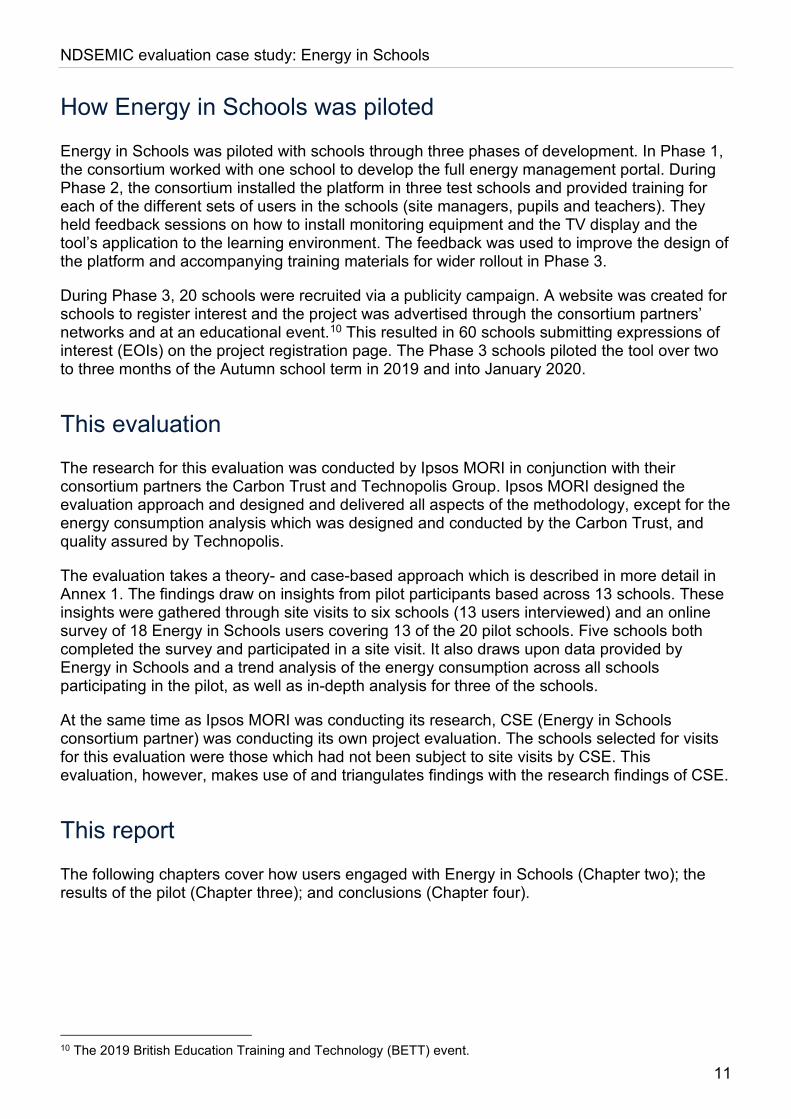
4. A TV display (to be placed in a common area, such as the school hallway or entrance lobby) which had rotating screens covering local weather, electricity and gas usage, carbon intensity, energy use between 4-7pm and top tips for saving/shifting energy use. The electricity, gas and off-peak point leagues were displayed as penguins climbing a mountain with energy use being presented as ‘kWh per pupil for yesterday’. Screenshots of some of these screens are presented overleaf (see Figure 3).
5. A pupil-focussed education and empowerment package, comprising the Energy Champions programme,9 ‘micro:bits’ (small computers that could be programmed (coded) by pupils and teachers to monitor and measure energy around the school), and curriculum-aligned lesson plans covering topics such as climate change and energy generation (and how to use micro:bits), which could be used in daily classes and/or after-school clubs.
8 It was not always possible for schools to make such tariff switches. Some schools were tied into ongoing energy supply contracts and/or contracts with energy brokers who did not offer ToU tariffs as part of their portfolio. 9 ‘Energy Champions’ were pupils who volunteered for the role and received access to Energy in Schools and its complementary energy monitoring and coding technology to monitor energy within the school. They would then be given training in how to programme the technology and use to trouble-shoot energy wastage, raise awareness through the school and encourage energy efficient behaviour.
NDSEMIC evaluation case study: Energy in Schools
10
Figure 2: Screenshot of energy manager dashboard
Figure 3: Screenshot of TV display – electricity usage and league table
NDSEMIC evaluation case study: Energy in Schools
11
How Energy in Schools was piloted
Energy in Schools was piloted with schools through three phases of development. In Phase 1, the consortium worked with one school to develop the full energy management portal. During Phase 2, the consortium installed the platform in three test schools and provided training for each of the different sets of users in the schools (site managers, pupils and teachers). They held feedback sessions on how to install monitoring equipment and the TV display and the tool’s application to the learning environment. The feedback was used to improve the design of the platform and accompanying training materials for wider rollout in Phase 3.
During Phase 3, 20 schools were recruited via a publicity campaign. A website was created for schools to register interest and the project was advertised through the consortium partners’ networks and at an educational event.10 This resulted in 60 schools submitting expressions of interest (EOIs) on the project registration page. The Phase 3 schools piloted the tool over two to three months of the Autumn school term in 2019 and into January 2020.
This evaluation
The research for this evaluation was conducted by Ipsos MORI in conjunction with their consortium partners the Carbon Trust and Technopolis Group. Ipsos MORI designed the evaluation approach and designed and delivered all aspects of the methodology, except for the energy consumption analysis which was designed and conducted by the Carbon Trust, and quality assured by Technopolis.
The evaluation takes a theory- and case-based approach which is described in more detail in Annex 1. The findings draw on insights from pilot participants based across 13 schools. These insights were gathered through site visits to six schools (13 users interviewed) and an online survey of 18 Energy in Schools users covering 13 of the 20 pilot schools. Five schools both completed the survey and participated in a site visit. It also draws upon data provided by Energy in Schools and a trend analysis of the energy consumption across all schools participating in the pilot, as well as in-depth analysis for three of the schools.
At the same time as Ipsos MORI was conducting its research, CSE (Energy in Schools consortium partner) was conducting its own project evaluation. The schools selected for visits for this evaluation were those which had not been subject to site visits by CSE. This evaluation, however, makes use of and triangulates findings with the research findings of CSE.
This report
The following chapters cover how users engaged with Energy in Schools (Chapter two); the results of the pilot (Chapter three); and conclusions (Chapter four).
10 The 2019 British Education Training and Technology (BETT) event.
NDSEMIC evaluation case study: Energy in Schools
12
2 How users engaged with Energy in Schools This chapter sets out the functionality Energy in Schools offered to different user types, then presents evidence as to who the main users were in trial sites, how often they used it, and which functions they used. These findings are key to validating the theory of change, as relevant stakeholders need to be engaging with the tool in order for outcomes to be realised.
How Energy in Schools was used
There were high levels of engagement with Energy in Schools during the pilot. Sixteen out of 18 users surveyed (covering 13 schools) had interacted with it either fortnightly (two respondents), weekly (11 respondents), or daily (three respondents).11 Daily interaction typically involved viewing the TV screen, whereas logging on to the various portals tended to be more of a weekly or fortnightly activity. Some users reported logging in more frequently when starting the trial as they got used to its functionality and learnt new information.
“Initially it was almost daily I would say because [we] were really interested to see what would happen on a daily basis. I think now, I […] would sit down and look at that on a weekly basis.” - School business manager, Primary school
Samsung’s web analytics broadly support these findings: nine of the 20 schools used the platform ten times or more over the two-month period of the pilot, and three schools used it more than 25 times.
According to the survey, the most frequently used features of Energy in Schools (overall) were the TV screen, educational resources, administrator dashboard (device manager) and energy statistics (see Table 1, overleaf).
Teachers and headteachers responding to this evaluation’s survey reported that the features “most useful for pupils” were the energy usage on the website (four respondents), micro:bits (three respondents), the motion, contact or button sensors (two respondents), the floor maps (two respondents) and the smart plugs12 (one respondent).
At site visits to schools, stakeholders reported that, overall, the educational resources, including the micro:bit coding equipment, were the most impactful alongside the TV display, though energy managers had also made used of the portal to track their energy use.
11 This data is self-reported, not independently observed 12 Pupils could code the micro:bit to switch on or off any appliance plugged into the smart plug. A smart plug is a small adapter that can be plugged into a standard wall socket and connected to a Wi-Fi network. Once connected, any appliance plugged into the adapter can be switched on and off via an internet-based app (e.g. via a mobile phone).
NDSEMIC evaluation case study: Energy in Schools
13
Table 1: Aspects of Energy in Schools that were most engaging for users
Feature Why users found this engaging
Relevance to outcomes
TV screen It was a prominent visual aid, visible to everyone - i.e. placed in communal areas.
The comparisons to other schools were an effective motivator of behaviour change.
Educational resources The lesson plans and Energy Champion activities made use of large amounts of new educational resources, which teachers found to offer new possibilities for their teaching.
Teachers’ engagement in these elements was necessary if they were to help pupils to develop coding skills and if needed, learn such skills themselves.
Administrator dashboard and ‘device manager’
Each participating school had to assign an administrator responsible for device management, therefore this was one of the most frequently used / accessed features of the tool.
While not directly related to key outcomes, working sensors allow for improved energy monitoring, as well as being a core part of delivering educational outcomes.
Energy statistics These helped teachers prompt discussions with pupils, with some logging in on a weekly or fortnightly basis to look at energy use. Web analytics also revealed these were frequently used by energy managers.
Helped to improve understanding of energy use amongst pupils and teachers which in turn provided the capability for behaviour change.
Profile of users
Energy in Schools was designed to be used by both primary and secondary schools. Six secondary schools and 14 primary schools participated in total, representing a split that roughly matched the split between primary and secondary schools in Great Britain.
The Energy in Schools online portal could be accessed by four different groups of users (energy managers, administrators, teachers and pupils) via separate logins. Administrators had responsibility for maintaining the technology and were necessarily IT technicians – often IT teachers within secondary schools and external IT support providers at primary schools. Only pupils who had been trained in how to use the tool via the Energy Champions programme would be given login access to the portal. All other school stakeholders could engage with Energy in Schools via the TV display and/or other energy data displays. The educational
NDSEMIC evaluation case study: Energy in Schools
14
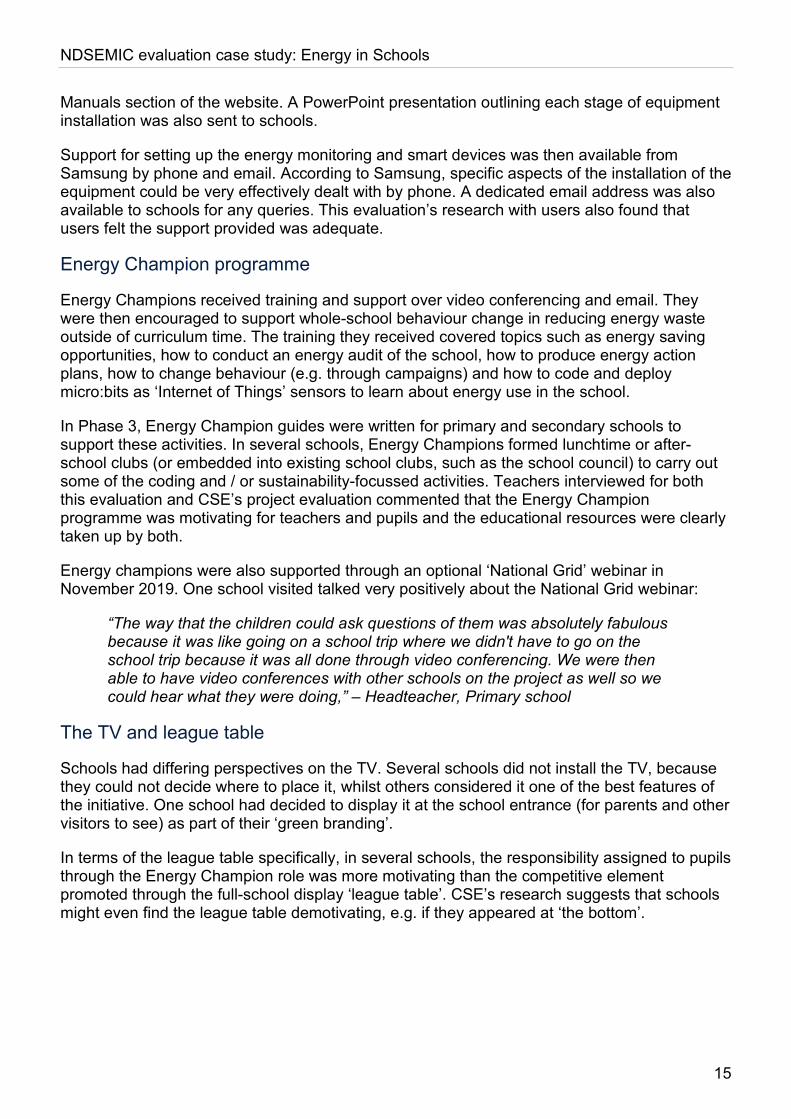
resources were designed to be used by all pupils (e.g. within classes or at after-school clubs), but in some schools it was mainly Energy Champions who made use of them.
The findings of the survey suggest that a range of user types frequently accessed Energy in Schools, from business and facilities managers, through headteachers and classroom teachers, to pupils. However, the findings from the site visits suggest that the stakeholders most engaged with the tool were classroom teachers and tool administrators. Both the research conducted for this evaluation and CSE’s project evaluation found that Energy in Schools generated the greatest benefit for schools when all users were aware of and bought into it, with engagement from users with the ability to make decisions over energy use proving an enabler of change in some instances. In a few schools, the involvement of the headteacher was limited and this affected the school’s ability to make changes to equipment.
How use of Energy in Schools was promoted and supported
Energy in Schools was embedded within schools via a series of support packages and other activities aimed at gaining and sustaining user interest. These are described below.
Induction support
Induction days were held at the beginning of Phase 3. Around half were delivered prior to the start of the autumn term so that teachers would have time to plan how to embed the Energy in Schools resources into their lesson plans, with the remainder being delivered in September / October. The purpose of the induction days was to introduce the whole school (or specific year groups in secondary schools) to the project, the platform and the equipment involved. According to Samsung, the induction day also provided Energy in Schools with an opportunity to learn more about the school’s current attitude and practices in energy efficiency, gather information about the school building and its energy-related challenges, build relationships with staff and pupils, and discuss with them ideas on how to focus project activities to achieve results. Induction days involved meetings with business and/or facilities managers, school energy managers, teachers (to introduce them to the educational resources) and Energy Champions.
Energy in Schools equipment was, in most cases, set up before the induction day, so that live data was available for each school and so that it was possible for people to experiment with coding micro:bits. However, some schools were not able to security check their networks in time for the equipment to be set up before the inductions took place. This impacted on the quality of training that could be given, as the consortium was not able to demonstrate the technology at the event.
Technology set-up support
The first four schools given access to Energy in Schools in Phases 1 and 2 received in-person visits by Samsung to pre-pair the technology and associated hubs and to create accounts for each school. The set-up process included a 1 to 2-hour session where the Samsung support team helped the school through the set-up of one of each of the devices (such as one hub, one motion sensor, one lightbulb, one micro:bit).
In Phase 3 the IT lead installed the technologies with additional support by phone, email, text and an in-person visit, if needed, by Samsung staff. The user guide created in Phase 2 was complemented by a suite of videos explaining each step in the set-up process, located in the
NDSEMIC evaluation case study: Energy in Schools
15
Manuals section of the website. A PowerPoint presentation outlining each stage of equipment installation was also sent to schools.
Support for setting up the energy monitoring and smart devices was then available from Samsung by phone and email. According to Samsung, specific aspects of the installation of the equipment could be very effectively dealt with by phone. A dedicated email address was also available to schools for any queries. This evaluation’s research with users also found that users felt the support provided was adequate.
Energy Champion programme
Energy Champions received training and support over video conferencing and email. They were then encouraged to support whole-school behaviour change in reducing energy waste outside of curriculum time. The training they received covered topics such as energy saving opportunities, how to conduct an energy audit of the school, how to produce energy action plans, how to change behaviour (e.g. through campaigns) and how to code and deploy micro:bits as ‘Internet of Things’ sensors to learn about energy use in the school.
In Phase 3, Energy Champion guides were written for primary and secondary schools to support these activities. In several schools, Energy Champions formed lunchtime or after-school clubs (or embedded into existing school clubs, such as the school council) to carry out some of the coding and / or sustainability-focussed activities. Teachers interviewed for both this evaluation and CSE’s project evaluation commented that the Energy Champion programme was motivating for teachers and pupils and the educational resources were clearly taken up by both.
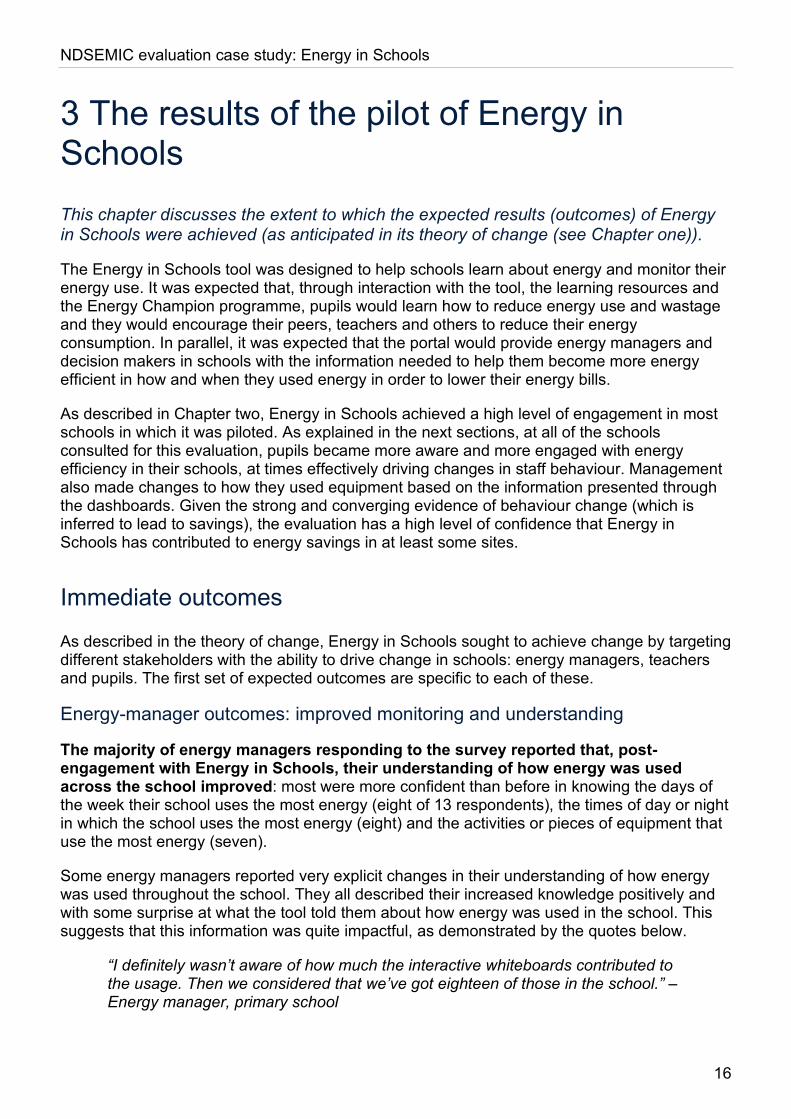
Energy champions were also supported through an optional ‘National Grid’ webinar in November 2019. One school visited talked very positively about the National Grid webinar:
“The way that the children could ask questions of them was absolutely fabulous because it was like going on a school trip where we didn't have to go on the school trip because it was all done through video conferencing. We were then able to have video conferences with other schools on the project as well so we could hear what they were doing,” – Headteacher, Primary school
The TV and league table
Schools had differing perspectives on the TV. Several schools did not install the TV, because they could not decide where to place it, whilst others considered it one of the best features of the initiative. One school had decided to display it at the school entrance (for parents and other visitors to see) as part of their ‘green branding’.
In terms of the league table specifically, in several schools, the responsibility assigned to pupils through the Energy Champion role was more motivating than the competitive element promoted through the full-school display ‘league table’. CSE’s research suggests that schools might even find the league table demotivating, e.g. if they appeared at ‘the bottom’.
NDSEMIC evaluation case study: Energy in Schools
16
3 The results of the pilot of Energy in Schools This chapter discusses the extent to which the expected results (outcomes) of Energy in Schools were achieved (as anticipated in its theory of change (see Chapter one)).
The Energy in Schools tool was designed to help schools learn about energy and monitor their energy use. It was expected that, through interaction with the tool, the learning resources and the Energy Champion programme, pupils would learn how to reduce energy use and wastage and they would encourage their peers, teachers and others to reduce their energy consumption. In parallel, it was expected that the portal would provide energy managers and decision makers in schools with the information needed to help them become more energy efficient in how and when they used energy in order to lower their energy bills.
As described in Chapter two, Energy in Schools achieved a high level of engagement in most schools in which it was piloted. As explained in the next sections, at all of the schools consulted for this evaluation, pupils became more aware and more engaged with energy efficiency in their schools, at times effectively driving changes in staff behaviour. Management also made changes to how they used equipment based on the information presented through the dashboards. Given the strong and converging evidence of behaviour change (which is inferred to lead to savings), the evaluation has a high level of confidence that Energy in Schools has contributed to energy savings in at least some sites.
Immediate outcomes
As described in the theory of change, Energy in Schools sought to achieve change by targeting different stakeholders with the ability to drive change in schools: energy managers, teachers and pupils. The first set of expected outcomes are specific to each of these.
Energy-manager outcomes: improved monitoring and understanding
The majority of energy managers responding to the survey reported that, post-engagement with Energy in Schools, their understanding of how energy was used across the school improved: most were more confident than before in knowing the days of the week their school uses the most energy (eight of 13 respondents), the times of day or night in which the school uses the most energy (eight) and the activities or pieces of equipment that use the most energy (seven).
Some energy managers reported very explicit changes in their understanding of how energy was used throughout the school. They all described their increased knowledge positively and with some surprise at what the tool told them about how energy was used in the school. This suggests that this information was quite impactful, as demonstrated by the quotes below.
“I definitely wasn’t aware of how much the interactive whiteboards contributed to the usage. Then we considered that we’ve got eighteen of those in the school.” – Energy manager, primary school
NDSEMIC evaluation case study: Energy in Schools
17
“It’s actually been really interesting to pinpoint times and places. […] It was really obviously to see when the school was closed, so say through the Christmas holidays and the half-term holidays, I expected, kind of, obviously usage to be very minimal. It was actually quite significant because we had the other people operating on site. It was also really interesting to watch the usage timing wise […] surges at, sort of, between maybe 3:00 and 4:30pm when actually all the teachers then had finished their teaching and are logging on and they’re all plugging their laptops in and charging everything.” – Senior business manager, Primary school
The fact that Energy in Schools involved the whole school in monitoring energy may also have increased the energy managers involvement in it – there are several examples across schools of children being involved in diagnosing any observed spikes. In some cases, the hands-on support provided by Samsung may also have helped improve monitoring.
“There was one strange peak that we had one night, and Samsung actually sent us an email through, 'Oh, just curious why that peak happened?', […] Weirdly enough, the kids picked it up the next day as well. We had a look and it was one of the extra security lights had come on automatically at that point.” – Headteacher, Primary school
Energy-manager outcomes: increased engagement in the market
As discussed in Chapter two, one of the aims of Energy in Schools was to increase schools’ understanding of their use of energy at different times and how different (more tailored) energy tariffs might be more appropriate to them. The tariff-switching platform which formed part of the tool aimed to give schools access to ToU tariffs on the market to further facilitate switching.13
According to both CSE’s research and this evaluation, prior to using Energy in Schools, school engagement with the energy market was low. In some cases, this was because energy was procured through the local authority or multi-academy trust (MAT), and in others because energy was procured through a broker.
“That’s all done through our MAT central team. I think all of the MAT schools-, we all have the same energy provider, and I think we’re still using the energy provider that we were set up with when we were a county school. The county schools have all got the same provider. I don’t know who that is.” – Headteacher, Primary school
CSE’s evaluation found that, even where schools engaging with Energy in Schools had made use of the tariff-switching platform, they were often still not in a position to switch because of the reasons stated above. Only one school had been able to switch to one of the Energy in School-identified tariffs. However, this evaluation found some positive indications that Energy in Schools might have enabled or encouraged schools to look into other energy procurement options. Eight survey respondents had looked into tariffs offered by other suppliers since engaging with Energy in Schools, compared with five who had done so previously. One school was looking to change provider and move away from their MAT’s
13 Switching to specific tariffs is not a primary aim of the overall Competition theory of change; however, it is a benefit which complements the anticipated direct outcomes of the Competition (greater energy efficiency) to the extent that TOU and other ‘smarter’ tariffs are expected to save customers energy and therefore are expected to attract customers and overall such tariffs support more efficient use of on-grid energy.
NDSEMIC evaluation case study: Energy in Schools
18
preferred option. Further, an energy manager at one school visited for this evaluation explained:
“Though we use a broker, I think we were guilty of just choosing the cheapest that they presented […]. I would be more mindful now in looking at different types of tariffs.” – Business manager, Primary school
Teacher and pupil outcomes: learning and developing skills
The evaluation findings strongly indicate that pupils’ understanding of energy increased following engagement with the Energy in Schools programme. Energy in Schools appears to have been effective in engaging pupils by giving them a sense of responsibility in effecting change within the school and by engaging them through several different media (energy data, lesson plans, monitoring / sensor technology). In addition, energy was successfully integrated into wider lessons and learning resources, boosting pupil engagement. Instead of offering resources on sustainability and energy efficiency alone, these topics were combined with others (e.g. coding) and were easily embedded into day-to-day lessons (maths, IT).
Survey respondents in student-facing roles (12 in total) were asked about their experience of the Energy in Schools lesson plans. All 12 had used at least one of the lesson plans and eight out of 12 respondents said that they found the lesson plans user-friendly, with only one disagreeing with this statement and three stating 'don't know'. The lesson plans which most survey respondents had used were the plans that taught children how to use the micro:bit technology as an energy saving device14 (seven out of 12 had used these) and those which explained which appliances use the most energy and where energy comes from (sources / fuels). Less popular were the lesson plans which had a broader scope (Internet of Things, energy use, carbon emissions and fuel bills). Indeed, five respondents considered that the micro:bit coding lessons were the most useful for pupils, with two considering the global warming and climate breakdown lessons most useful and another the 'what appliances use most electricity' most useful.
However, at some schools, the teaching staff had not felt they had the time or skills available to make optimal use of the plans.
“It’s been a learning curve, to be honest with you, and I think it would have been even more effective if I’d had more time to think it all through.” – Deputy head, Primary school
Beyond the lesson plans, some schools had used Energy in Schools data for their teaching:
“So, because the graphs have been brilliant to look at, I've encouraged all teachers to actually use that within their maths lessons. Why generate random things off the internet about line graphs when, actually, there's something there that's really relevant to the children in our school, and they can actually talk about the story of energy use in our school?” – Headteacher, Primary school
Through the Energy Champion scheme, pupils became active in both assessing school energy use (through the sensors and portal) and coming up with actions to reduce use. Pupils were motivated by the problem solving and learning aspects of the programme, as well as the sense
14 These included tutorials for coding micro:bit as a door open/close sensor, light sensor, temperature sensor, energy monitoring device and for changing smart light bulb colours.
NDSEMIC evaluation case study: Energy in Schools
19
of responsibility that came with the Energy Champion role. They involved themselves in full-school campaigns, putting up posters and running assemblies.
“Our Energy Champions led an assembly which we made sure all staff came to see, and within that assembly they showed a number of quite inspirational videos, the young children talking as well. […] It’s quite interesting, because obviously we’ve had the Christmas break, have they forgotten about it over the Christmas holidays? No, they haven’t, because they’ve come back still talking about it.” – Teacher, Primary school
The TV display in some schools also had an impact on pupil’s learning and understanding:
“It’s quite interesting because you get one child stop to have a look at it, and then another child will stop next to them, and then they’ll start having a little conversation about what they’re seeing on screen.” – Teacher, Primary school
Micro:bits were also very well-received and used for different purposes in different schools. In one school, the micro:bit was coded by Energy Champions to monitor and indicate fluctuations in energy use, but then it was placed in an area where all pupils could access the information:
“The Energy Champions set up the micro;bits to code a lightbulb to show how much energy we were using. So, if the lightbulb was red then it showed that we were using more energy, if it was green then it showed we were using less energy. So, as a school, when they came through the lunch hall, they could press the micro;bit and see for themselves rather than just having to go and look at the graphs, which is great for the younger children.” – Teacher, Primary school
At one school, a pupil was taking a micro:bit home for the weekend to do some coding and have a look at the website on his new laptop. This suggests that Energy Schools had an effect on pupils that might spread beyond the school to change behaviour also at home.
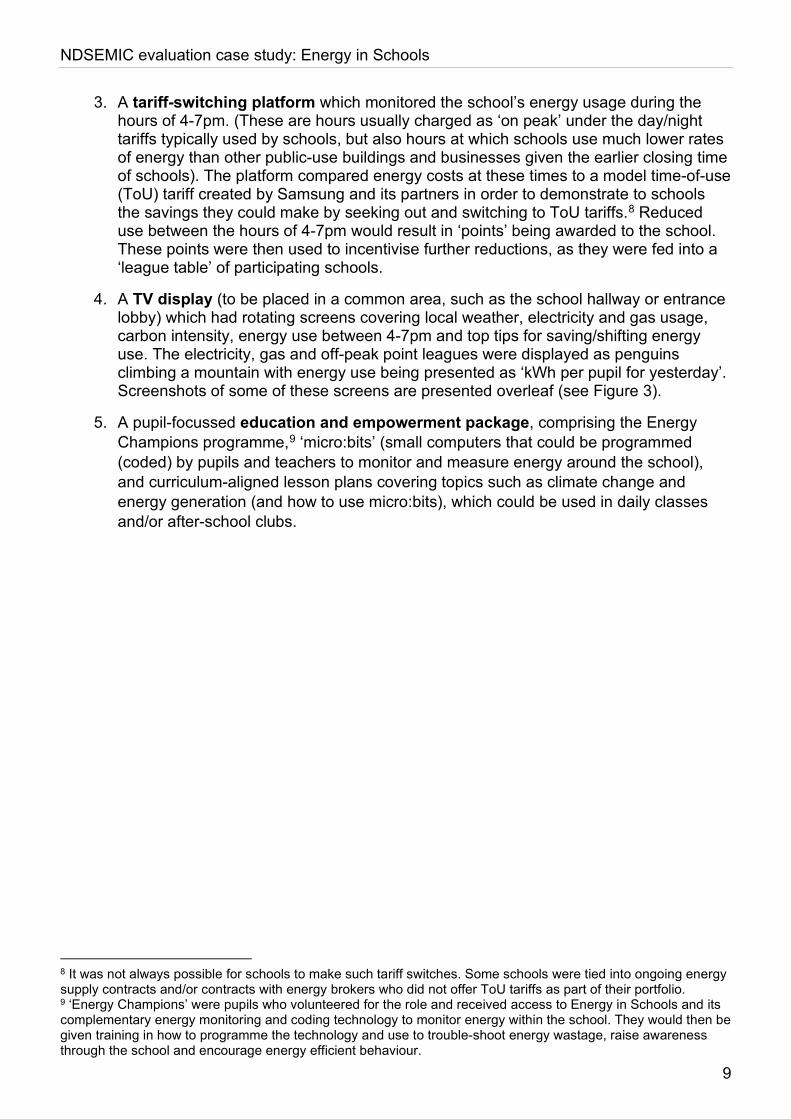
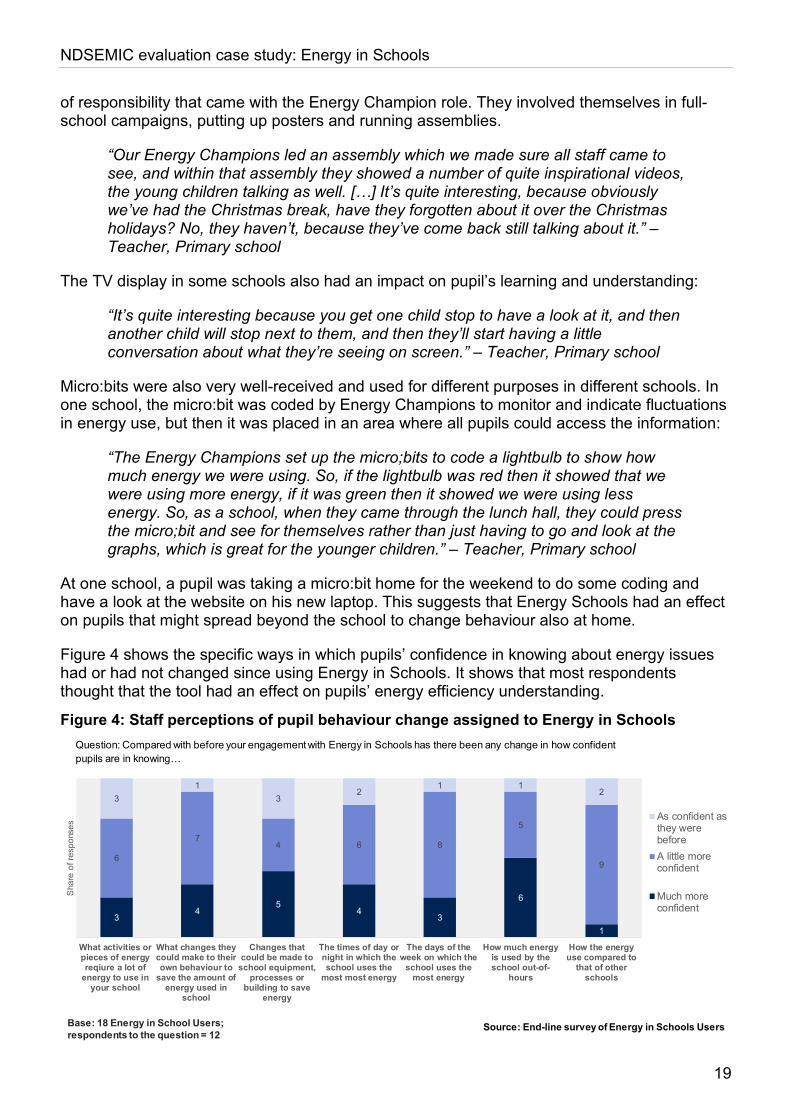
Figure 4 shows the specific ways in which pupils’ confidence in knowing about energy issues had or had not changed since using Energy in Schools. It shows that most respondents thought that the tool had an effect on pupils’ energy efficiency understanding.
Base: 18 Energy in School Users; respondents to the question = 12
34
54
3
6
1
6
74 6 8
5
9
31
32
1 12
What activities orpieces of energyreqiure a lot of
energy to use inyour school
What changes theycould make to theirown behaviour to
save the amount ofenergy used in
school
Changes thatcould be made to
school equipment,processes or
building to saveenergy
The times of day ornight in which theschool uses the
most most energy
The days of theweek on which the
school uses themost energy
How much energyis used by theschool out-of-
hours
How the energyuse compared to
that of otherschools
Sha
re o
f res
pons
es
As confident asthey werebeforeA little moreconfident
Much moreconfident
Source: End-line survey of Energy in Schools Users
Question: Compared with before your engagement with Energy in Schools has there been any change in how confident pupils are in knowing…
Figure 4: Staff perceptions of pupil behaviour change assigned to Energy in Schools
NDSEMIC evaluation case study: Energy in Schools
20
The survey also showed that, amongst 12 headteachers and teachers,15 five agreed they were much more confident in knowing what changes they could make to their own behaviour to reduce the amount of energy used in school, and a further four reported that they were a little more confident in knowing this.
Similarly, seven responded that they were much more confident in knowing what changes could be made to equipment, processes and/or the building since using Energy in Schools and three more were “a little more confident”.
Medium-term outcomes
Improved energy-management behaviours and operations
Out of 18 survey respondents, 16 agreed that their school had tried to reduce the amount of energy used since engaging with Energy in Schools.
Amongst the six schools visited, users reported behaviour change, including automating the times at which equipment was charged (through a smart plug). Several of these behaviours were directly driven either by the Energy Champion campaigns and/or the schools participation in the competitive element of Energy in Schools, which encouraged schools to use less energy between 4pm and 7pm (when the National Grid is under the most pressure and therefore more likely to draw upon and use fossil-fuel generated electricity).
Half of all respondents to the survey provided examples of energy-management changes that pupils had influenced. These included turning off lights and equipment, reminding teachers to turn off digital boards when not in use, turning down thermostat radiators (when the temperature monitors would show the building was too hot) and changing the time at which tablets would be charged (from 4pm to 4am to coincide with lower tariffs).
“As I come out of my office, there’s a poster that says ‘have you turned the lights off? Have you shut down your computer?’ It’s just that kind of mindfulness that they’ve brought into place across the school that you’d like to think you’d remember but you’re so busy. Sometimes you’re just trying to dash out, but actually, it’s been really quite effective.” – Business manager, Primary school
“Quite often if we’re all going to lunch, they’ll say, ‘Miss, do you need that on?’ so now I’m in a habit of thinking, ‘Do I need it on? No.’” – Teacher, Primary school
At one of the schools visited, Energy in Schools had very clearly helped to improve operational efficiency: the temperature sensors confirmed that the temperature in one classroom was 16 degrees, compared with 23 to 24 degrees in other classrooms. This data was shared with the company that provided the heating equipment, who as a result adjusted the heating equipment to bring the temperature in line with other classrooms. This in turn would be expected to create a better working and learning environment for both teachers and pupils using that classroom.
15 These 12 teachers and head-teachers represented 12 different schools
NDSEMIC evaluation case study: Energy in Schools
21
Adoption of energy efficient technologies
The results of the survey suggest that in a few schools the increased motivation to save energy had driven them to invest (or make plans to invest) in more energy-efficient technologies.
One school reported that they had implemented three such technologies since using the platform, one of which (in lighting) was a result of engaging with the tool. Only two further schools had planned to implement energy efficiency changes, however, one of these was planning to make four changes, all as a result of engaging with Energy in Schools.
Other schools may have had insufficient time since beginning to use Energy in Schools (four months in total) to consider energy efficient investments. For any large expenditure, schools reported they are normally required to obtain budgetary approval from the local authority, MAT or governors as relevant. Such expenditure may therefore need to be deferred to future years.
The effects of Energy in Schools on energy consumption and energy bills
The majority of schools participating in the Energy in Schools pilot had actively engaged in the programme and had gained a greater knowledge and understanding of energy use as a result, with behaviour change being widely reported across all schools consulted for this evaluation. Based upon these findings, there is a high level of confidence that Energy in Schools contributed to energy savings in at least some sites. This is based upon the following sources of evidence:
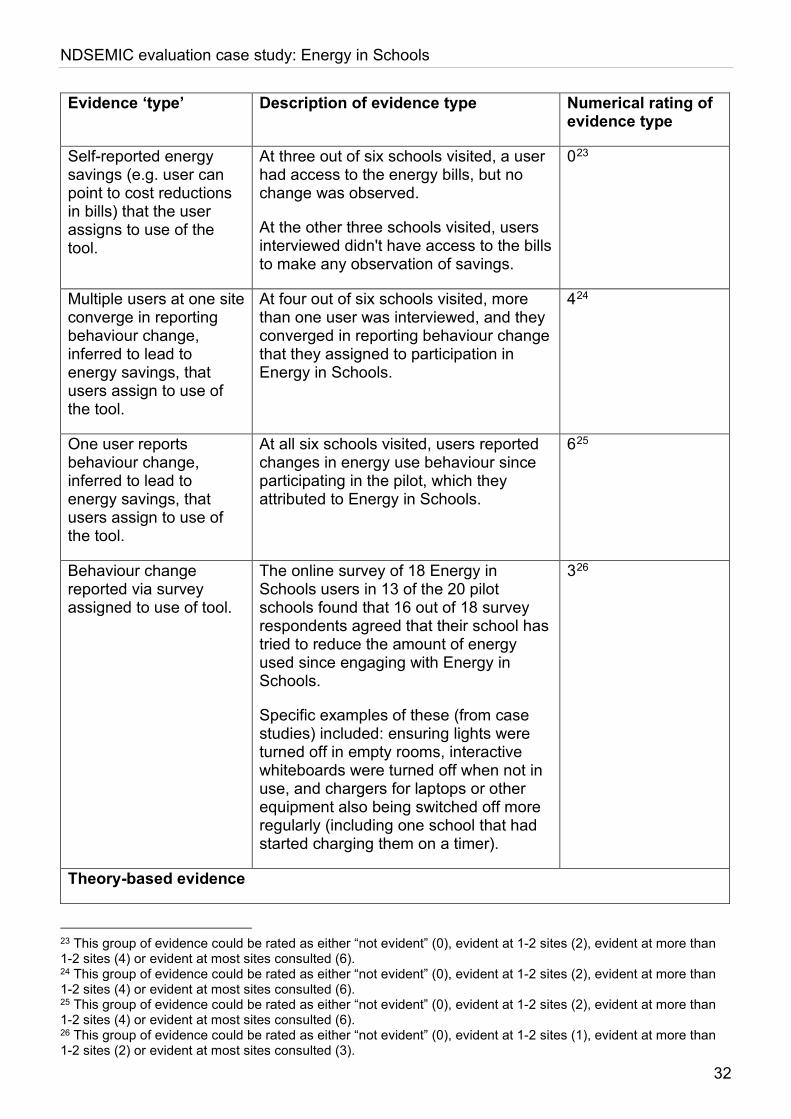
• Self-reported behaviour change: All users interviewed during site visits to six schools (13 people in total) reported changes in energy use behaviour and/or energy efficient measures that would be expected to lead to a reduction in energy use and they assigned these changes to use of the tool.
• The perspectives of multiple users at a single site: At four out of six of these sites, more than one user was consulted, and they converged in their opinion that the tool had led to behaviour change that would be expected to lead to a reduction in energy use.
• The online survey, covering 13 of the 20 pilot schools, found that 16 out of 18 survey respondents agreed that their school has tried to reduce the amount of energy used since engaging with Energy in Schools.
• At a couple of the sites visited, it was also possible to test the assumptions underpinning the overall Energy in Schools theory of change. In these cases, no evidence was identified to suggest that other factors would prevent energy savings from being achieved (assuming that behaviour change was sustained).
• Across most sites visited, the potential for other factors to be driving any changes observed (e.g. change in building/business operating hours or reduced building use) was investigated, but no evidence of this was identified.
• An analysis of energy consumption during the pilot for all 20 sites piloting the tool was conducted, alongside three in-depth analyses for specific sites. The full-pilot trend analysis and two of the in-depth analyses identified increases in consumption, but no conclusions could be drawn on the causes of this, due to the very short period of historical data and very short period of post- intervention data, as well as an absence of clear intervention dates and a relatively small sample size. One of the in-depth analyses
NDSEMIC evaluation case study: Energy in Schools
22
found modest evidence to suggest energy savings, but – again – the significant data limitations meant that no conclusions could be drawn.
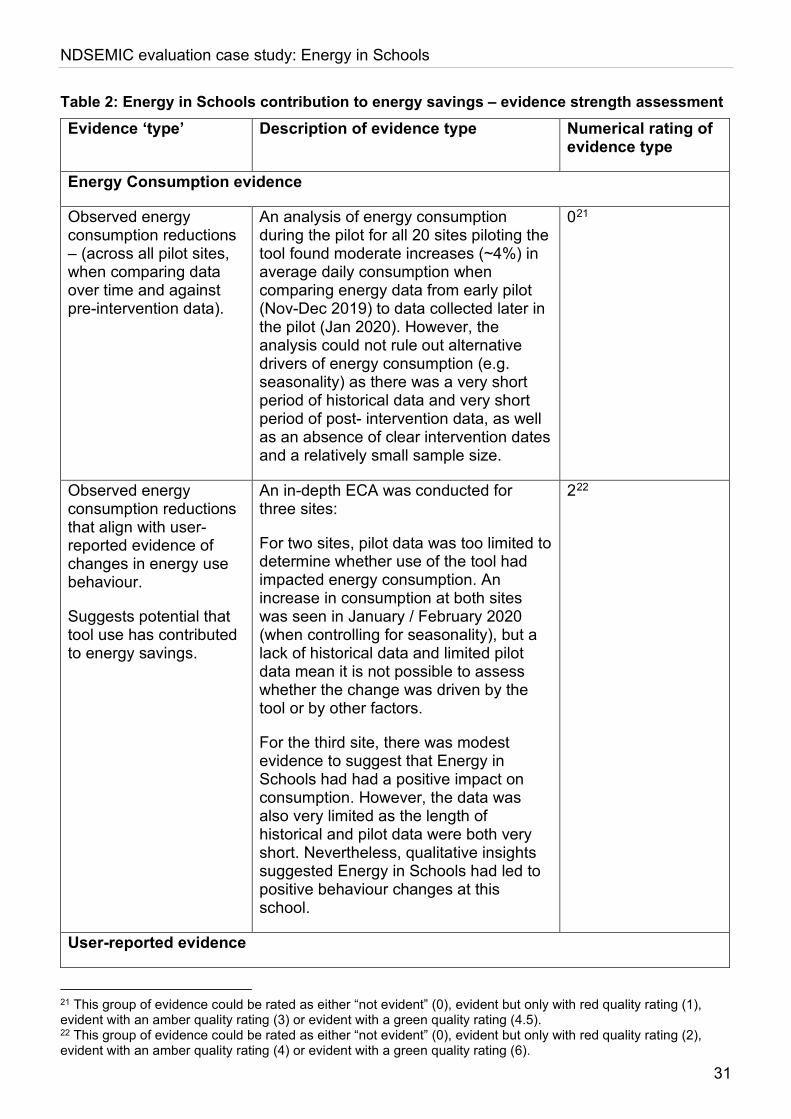
For each Competition tool, the evaluation assessed the extent to which the tool had contributed to energy savings at pilot sites, and the strength of the evidence supporting this. Eight ‘types’ of evidence were defined and scored for strength (see Table 3 in Annex 2). A higher score was given to evidence which was observed (e.g. energy consumption data) and triangulated (displaying a convergence in qualitative evidence and energy consumption data) or identified at a larger number of sites.
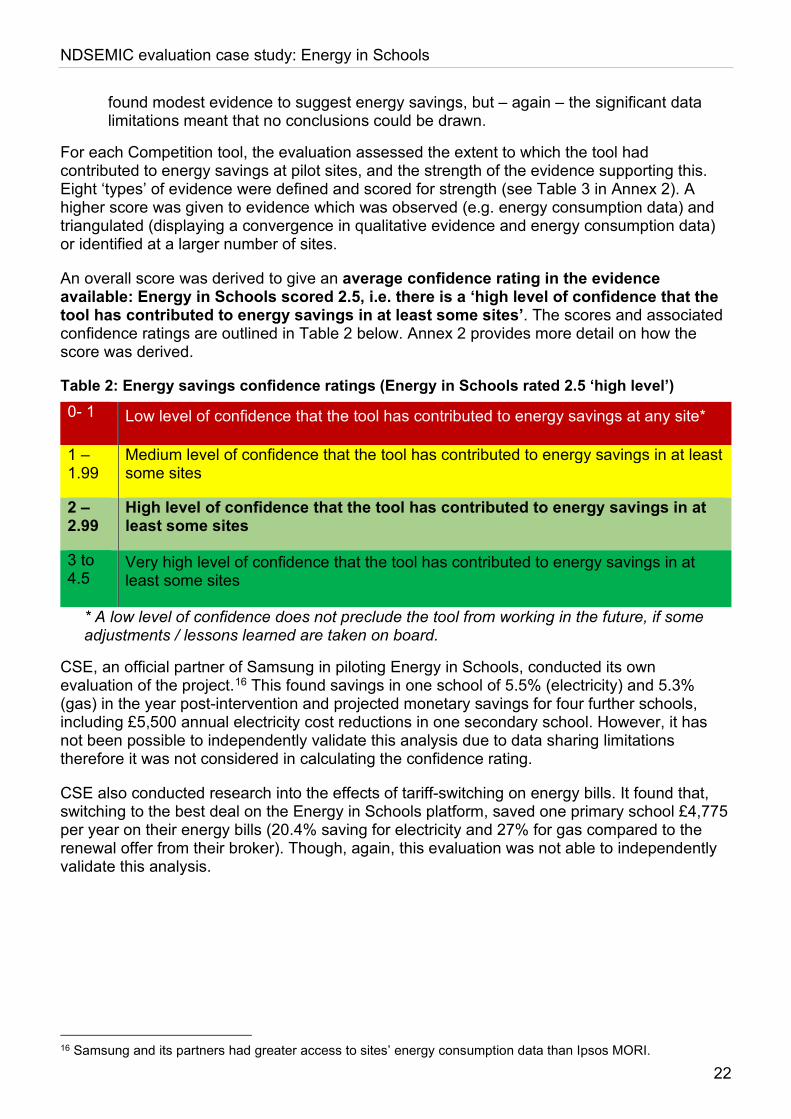
An overall score was derived to give an average confidence rating in the evidence available: Energy in Schools scored 2.5, i.e. there is a ‘high level of confidence that the tool has contributed to energy savings in at least some sites’. The scores and associated confidence ratings are outlined in Table 2 below. Annex 2 provides more detail on how the score was derived.
Table 2: Energy savings confidence ratings (Energy in Schools rated 2.5 ‘high level’) 0- 1 Low level of confidence that the tool has contributed to energy savings at any site*
1 – 1.99
Medium level of confidence that the tool has contributed to energy savings in at least some sites
2 – 2.99
High level of confidence that the tool has contributed to energy savings in at least some sites
3 to 4.5
Very high level of confidence that the tool has contributed to energy savings in at least some sites
* A low level of confidence does not preclude the tool from working in the future, if some adjustments / lessons learned are taken on board.
CSE, an official partner of Samsung in piloting Energy in Schools, conducted its own evaluation of the project.16 This found savings in one school of 5.5% (electricity) and 5.3% (gas) in the year post-intervention and projected monetary savings for four further schools, including £5,500 annual electricity cost reductions in one secondary school. However, it has not been possible to independently validate this analysis due to data sharing limitations therefore it was not considered in calculating the confidence rating.
CSE also conducted research into the effects of tariff-switching on energy bills. It found that, switching to the best deal on the Energy in Schools platform, saved one primary school £4,775 per year on their energy bills (20.4% saving for electricity and 27% for gas compared to the renewal offer from their broker). Though, again, this evaluation was not able to independently validate this analysis.
16 Samsung and its partners had greater access to sites’ energy consumption data than Ipsos MORI.
NDSEMIC evaluation case study: Energy in Schools
23
Longer-term outcomes
This section considers Energy in Schools’ progress towards the longer-term impacts outlined in its theory of change. It was not expected that such outcomes would be realised in full by the end of the Competition.
In the long-term, it was expected that Energy in Schools would:
• Have an impact on the attitudes of pupils and staff that would lead them to become more environmentally conscious and enact behaviour change beyond the school setting (i.e. applying more environmentally friendly behaviours at home).
• Achieve school cost-savings (through reduced energy consumption and tariff-switching) which would then be redirected into investment in energy efficient equipment and/or education.
• Be taken up by a wider number of schools through word-of-mouth recommendations.
Energy in Schools does already appear to have increased pupil and staff understanding of the relationship between energy use and the environment and there is some evidence that this knowledge is being applied outside of school. Interviewees made references to different children’s’ application of Energy in Schools learning at home: one child had actually borrowed a micro:bit to use at home; another had thought about the lessons over the school holidays, conducted more research and had come back suggesting the school take part in a ‘switch off day’ (when all appliances are switched off for the day).
Several users interviewed during site visits referred to the knowledge they had gained in a way that suggested this had changed their attitude towards energy use more generally. In some cases, the tool seems to be contributing to a broader cultural shift (towards greater sustainability). For example, one school had been prompted by the platform to seek external accreditation as a Bronze Eco School.
“It has made us go on to try and get the Eco Schools Bronze Award. That’s what we’re trying to do now as a whole school, because that’s obviously much more of a whole school thing, because you have eco-monitors in every class. That’s the idea.” – Headteacher, Primary school
It is very likely that the multi-modal / multi-stranded programme offered via Energy in Schools is one of the factors which has helped the schools mentioned above start to realise these longer-term outcomes intended by Energy in Schools. The fact that pupils and staff were exposed to the outputs of the programme not only in lessons, but also in communal spaces (when schools had placed the TV and/or monitoring equipment there), and through assemblies, webinars and poster campaigns, seems to have resulted in a cultural shift which has started to filter beyond the school setting:
“I think the attitude to doing it has changed, because we’ve brought it much more to the forefront.” – Teacher, Primary school
It has not been possible to assess whether any savings are being redirected to energy efficiency investments. This is likely linked to the evaluation timeframes; as discussed, the evaluation has not yet identified specific examples of ‘sums’ of money saved which interviewees have consciously redirected into other areas. In addition, such investments may require a longer ‘cycle’ available to assess than that available via this evaluation.

NDSEMIC evaluation case study: Energy in Schools
24
With regards to word-of-mouth recommendations, amongst survey respondents, five reported that they had recommended Energy in Schools without being asked, and a further seven that they had recommended the tool when asked. A couple of users interviewed during site visits also suggested that they had mentioned their experience to other schools:
“I've spoken to other schools and other teachers and that about what we've been doing and they're, like, 'Wow, that's really cool, how did you get into that? How do we start doing that?” – Teacher, primary school
“I would say you’re going to get an increased awareness of children in their environment and what they can do to improve energy usage, both in school and at home.” – Teacher, primary school
Given the positive response that Energy in Schools has received within the schools that piloted it, it seems possible that schools will continue to tell other schools about the tool, and that this outcome may be replicated amongst those using the tool in the longer-term. To further increase the likelihood of word-of-mouth recommendations, Samsung might consider further exploiting and/or developing partnerships with organisations or entities with access to multiple schools (e.g. multi-academy trusts or local authorities), which is an approach taken by other Partners piloting tools within this Competition.
NDSEMIC evaluation case study: Energy in Schools
25
4 Conclusions This report explored the extent to which Samsung’s energy management and education programme, Energy in Schools, was able to help schools become more aware of their energy use, learn about energy and the environment and make energy savings.
There is clear evidence from the evaluation that the Energy in Schools programme has helped schools to monitor their energy use, learn how to use energy more efficiently, understand the effects of using energy in certain ways / at certain times of the day, and change their behaviour and operations to become more efficient. The learning outcomes for children were, according to school staff, particularly notable. Whilst analysis of energy consumption data is inconclusive, the qualitative evidence from the surveys, site visits and the research conducted by Samsung’s consortium partner (CSE) converge to provide a high level of confidence that the Energy in Schools tool has contributed to energy savings in at least some schools.
The factors which seem to have most supported positive outcomes are:
• The amount of support provided by Samsung: in inducting schools onto the programme, in offering ongoing technical support and in training up Energy Champions.
• The multi-modal and multi-stranded nature of the programme: Energy in Schools comprised an energy management portal, energy-monitoring equipment, additional technology enabling children to programme the monitoring equipment, lesson plans and a TV display. This meant that energy management (and the other applications of Energy in Schools) remained front of mind and was accessible to all pupils, staff and visitors to the school.
• The focus on / tailoring to pupils: The fact that pupils had the same access to the energy data as the school staff and were able to manage and programme the equipment to (better) monitor energy use, meant that children really were empowered to enact change within the school. The training programme for Energy Champions led to children leading school campaigns, proposing initiatives and delivering assemblies. These findings suggest that Energy in Schools can produce added benefits beyond energy efficiency in terms of wider pupil learning and environmentally conscious behaviours. Several users interviewed reported that the Energy Champions scheme appealed to children by giving them a sense of responsibility.
• The TV screen: This was a key distinguishing feature of Energy in Schools that helped contribute to outcomes. It functioned as a prominent visual aid that people cannot avoid (rather than having to log in to a dashboard), and therefore can reach the whole school rather than only the minority of staff and pupils that have a login to the tool. It played to the competitive spirit of children and helped motivate behaviour change.
The findings from this report suggest Samsung could take forwards the following points as it progresses its commercial offer, which may also be relevant for other innovators:
• Pupils were effective agents of change within schools. Energy in Schools should therefore continue to shape the programme around the needs and interests of pupils (e.g. through ongoing use of attractive visuals, promotion of the Energy Champion scheme and through the lesson plans).
NDSEMIC evaluation case study: Energy in Schools
26
• The support provided by Energy in Schools to schools on induction (face-to-face induction day) and throughout the pilot (phone and email support alongside manuals) was hugely beneficial to users and was effective at engaging a range of users. If cost-effective, Samsung should maintain this feature of its package.
• Factors motivating pupil engagement included the ‘off-peak point’ reward system and the responsibility instilled in pupils through the Energy Champion training scheme. Teachers considered that further elaboration of this might further engage them. The league table had mixed responses, as some schools found being at the bottom of the league was demotivating, so Samsung might consider adapting this.
• Whilst schools enacted a range of behaviour changes which they attributed to the tool, some had felt that the activities (e.g. switching off lights) were low impact in the long-term; clear, actionable advice on how to make bigger changes to energy use and bills might help schools take their energy use reduction to a greater level.
• The TV screen offered as part of Energy in Schools was successful in most schools at keeping energy use ‘front of mind’, engaging teachers and pupils beyond those involved in the Energy Champion scheme and stimulating discussion between users. However, not all schools used it; therefore, Samsung might consider offering this as an optional add-on rather than a standard part of the package.
• Samsung also might consider further targeting the tool at headteachers, as key decision makers, as these might play a key role in decisions around upgrades to equipment to reduce energy further longer-term.
NDSEMIC evaluation case study: Energy in Schools
27
Annex 1 Methodology The research for this evaluation was conducted by Ipsos MORI in conjunction with their consortium partner the Carbon Trust. Ipsos MORI designed the evaluation approach and designed and delivered all aspects of the methodology, except for the energy consumption analysis which was designed and conducted by the Carbon Trust. The evaluation was led by a dedicated evaluator who followed the implementation of the tool through its design phase (Phase 1), feasibility and initial testing (Phase 2) and roll-out and further testing (Phase 3).17 The final evaluation report, and reports for the other six case studies, are available on www.gov.uk.
Evaluation approach
This evaluation aimed to assess the extent to which the Energy in Schools tool generated anticipated outcomes and impacts, as well as the circumstances in which these were achieved. A case and theory-based approach was chosen both for its appropriateness to the intervention design and total sample available for research (N=20 schools that piloted the tool) and because of its fit with the data collection options available to the team.
The theory-based approach uses the Energy in Schools theory of change as its framework. This was developed in Autumn 2018, by Ipsos MORI in consultation with Samsung through an analysis of their proposal, points discussed at the Energy in Schools inception meetings and through familiarisation interviews with the Samsung and its consortium partners.
The extent to which anticipated change (‘outcomes’ and ‘impacts’) took place as observed – and then evidence to demonstrate that the Energy in Schools tool has contributed to this change – was assessed and is described in this report.
Sources of evidence and fieldwork activities
This evaluation was developed upon the basis of the following primary and secondary evidence:
Online Survey: The survey18 included between 20-30 questions19 covering tool usage habits, attitudes to energy, energy management behaviours, actions taken following engagement with the tool and other questions to understand the context of the business or school and the user (such as the business size, user role). The survey was tailored depending on the user’s role, for example, classroom teachers were not asked about engagement with bills, but other users were not asked about use of the lesson plans.
This survey consisted of a single wave conducted post-pilot. As a baseline measurement was not available, participants were asked to self-report on any changes in attitudes or behaviours
17 The evaluation lead met regularly with the tool’s design team, liaising with them on the evaluation plan, designed the evaluation’s methodology, managed the team of data collectors and the development of this report. 18 An example survey questionnaire used across NDSEMIC projects is included in the evaluation Technical Report, available on www.gov.uk. 19 The exact questionnaire length for each respondent varied depending on the project and type of participant/organisation
NDSEMIC evaluation case study: Energy in Schools
28
in relation to energy management over the course of the pilot, and whether Energy in Schools was a factor in these changes.
All surveys were disseminated by Energy in Schools. While the survey obtained good coverage of the 20 participating schools – 18 users responded, and these covered 13 out of the 20 pilot schools – the small sample size does not allow for a statistical analysis and results are presented as absolute numbers (e.g. nine out of 18) rather than percentages (e.g. 50%). The profile of these 18 respondents is as follows:
• Two were completed by a curriculum lead at secondary schools.
• Three were completed a Key Stage Lead.
• Three were completed by a Facilities Manager.
• Five were completed by a Headteacher / Deputy Headteacher.
• Two were completed by a School Bursar / Financial Director.
• One was completed by an Administrator.
• Two were completed by non-teachers in student-facing roles such as Teaching Assistants or Counsellors.
On-site school visits: The visits covered:
• Qualitative interviews, with the intent of gauging a more complete picture of the tool’s impact on the schools. Each interview lasted between 30 and 60 minutes.
• Observational elements - to understand how users interacted with the Energy in Schools tool and their interpretation of which appliances and equipment used energy in their school.
Ipsos MORI contacted half of the schools piloting Energy in Schools and CSE contacted the other half (as part of their project evaluation). Of these ten, six schools were able to participate in on-site visits. A total of 13 qualitative interviews were completed across the six schools.
It was not always possible to schedule interviews with all tool users at every case study visit, or some interviews were curtailed by staff availability (in particular headteachers). However, at most schools, it was possible to speak to a teacher, energy manager (e.g. a business manager) and a decision maker (e.g. a headteacher).
Energy consumption analysis: The Carbon Trust analysed data on energy consumed before and after schools started using Energy in Schools (collected as part of the intervention for use within the tool) to assess Energy in Schools’ effects on energy consumption. Data from the pilot period was typically only available for 4 to 6 months between September 2019 and February 2020. An overall trend analysis for all schools participating in the pilot was conducted, as well as a more detailed analysis for three schools (which had some historical data available). However, the ability of both types of analysis to identify impacts was limited, as there was a very short period of historical data and of post- intervention data, as well as an absence of clear intervention dates and a relatively small sample size.
Project documentation and correspondence: As part of the Competition, Samsung (and the other Competition Partners) were expected to regularly update BEIS and the Ipsos MORI evaluation team on their delivery progress and learnings via milestone deliverables and project
NDSEMIC evaluation case study: Energy in Schools
29
documentation. This was reviewed by Ipsos MORI and has supported the analysis in this report. Additionally, the evaluation team had regular bi-weekly updates with the Competition Partner to establish progress with the project and collate necessary information (e.g. recruitment challenges, partnership relationships etc.). Further documentation was made available to the Ipsos MORI evaluation team through Energy in Schools’ end-of-Competition report and in most cases provided useful supplementary information directly to the evaluation team.
Samsung’s consortium partners, CSE, also conducted their own project evaluation, which was made available to Ipsos MORI. Insights from this evaluation have been triangulated with Ipsos MORI’s findings within this report. CSE’s evaluation included an ECA which was able to draw upon data additional to that made available to the Carbon Trust.20 However, CSE faced similar issues of a lack of historical data and data quality issues, which limited their confidence in the ECA.
Limitations of the methodology
The limitations of the methodology were primarily as follows:
• Limitations of the ECA: As discussed above, the ability for the ECA to infer impacts was limited by a lack of historical energy consumption data and, in some cases, other data quality issues. This meant that it was not possible to quantitatively validate whether the behaviour reported and observed had led to energy savings.
• Lack of energy savings reported: Similarly, energy users in schools often did not have access to information about their energy use over time. This meant that they were not well-placed to comment on energy savings.
20 Samsung and its partners had greater access to sites’ energy consumption data than Ipsos MORI.
NDSEMIC evaluation case study: Energy in Schools
30
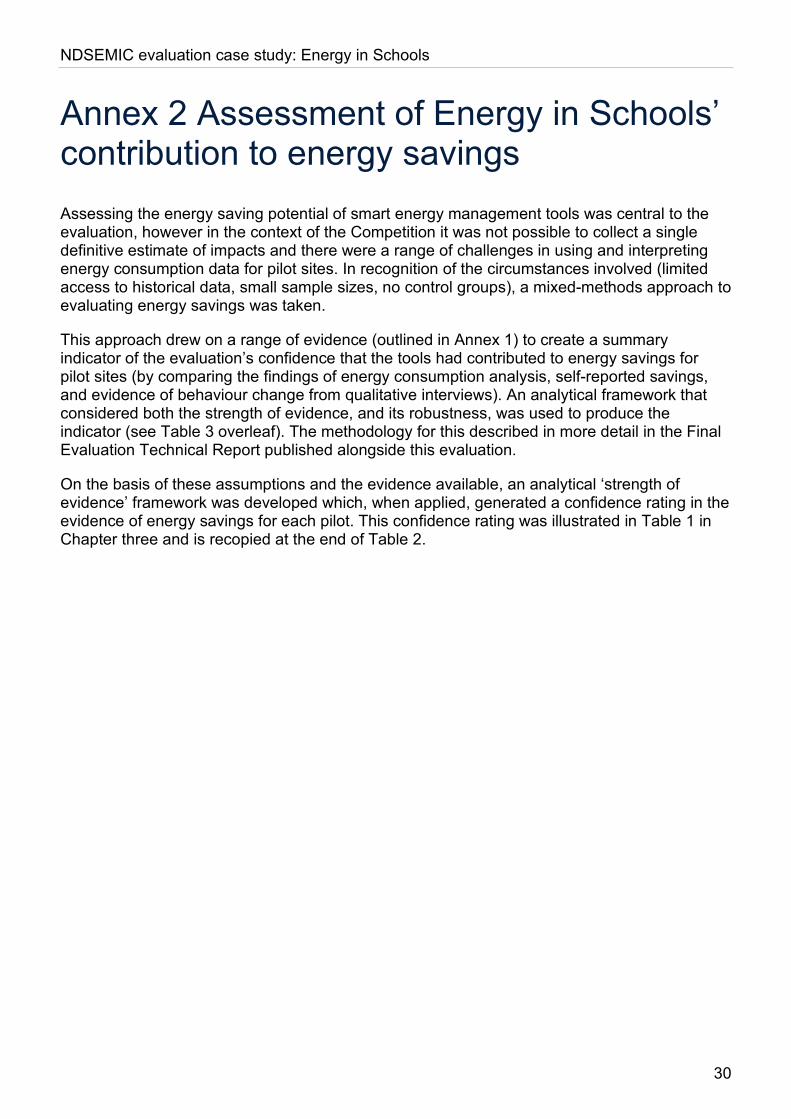
Annex 2 Assessment of Energy in Schools’ contribution to energy savings Assessing the energy saving potential of smart energy management tools was central to the evaluation, however in the context of the Competition it was not possible to collect a single definitive estimate of impacts and there were a range of challenges in using and interpreting energy consumption data for pilot sites. In recognition of the circumstances involved (limited access to historical data, small sample sizes, no control groups), a mixed-methods approach to evaluating energy savings was taken.
This approach drew on a range of evidence (outlined in Annex 1) to create a summary indicator of the evaluation’s confidence that the tools had contributed to energy savings for pilot sites (by comparing the findings of energy consumption analysis, self-reported savings, and evidence of behaviour change from qualitative interviews). An analytical framework that considered both the strength of evidence, and its robustness, was used to produce the indicator (see Table 3 overleaf). The methodology for this described in more detail in the Final Evaluation Technical Report published alongside this evaluation.
On the basis of these assumptions and the evidence available, an analytical ‘strength of evidence’ framework was developed which, when applied, generated a confidence rating in the evidence of energy savings for each pilot. This confidence rating was illustrated in Table 1 in Chapter three and is recopied at the end of Table 2.
NDSEMIC evaluation case study: Energy in Schools
31
Table 2: Energy in Schools contribution to energy savings – evidence strength assessment Evidence ‘type’ Description of evidence type Numerical rating of
evidence type
Energy Consumption evidence
Observed energy consumption reductions – (across all pilot sites, when comparing data over time and against pre-intervention data).
An analysis of energy consumption during the pilot for all 20 sites piloting the tool found moderate increases (~4%) in average daily consumption when comparing energy data from early pilot (Nov-Dec 2019) to data collected later in the pilot (Jan 2020). However, the analysis could not rule out alternative drivers of energy consumption (e.g. seasonality) as there was a very short period of historical data and very short period of post- intervention data, as well as an absence of clear intervention dates and a relatively small sample size.
021
Observed energy consumption reductions that align with user-reported evidence of changes in energy use behaviour.
Suggests potential that tool use has contributed to energy savings.
An in-depth ECA was conducted for three sites:
For two sites, pilot data was too limited to determine whether use of the tool had impacted energy consumption. An increase in consumption at both sites was seen in January / February 2020 (when controlling for seasonality), but a lack of historical data and limited pilot data mean it is not possible to assess whether the change was driven by the tool or by other factors.
For the third site, there was modest evidence to suggest that Energy in Schools had had a positive impact on consumption. However, the data was also very limited as the length of historical and pilot data were both very short. Nevertheless, qualitative insights suggested Energy in Schools had led to positive behaviour changes at this school.
222
User-reported evidence
21 This group of evidence could be rated as either “not evident” (0), evident but only with red quality rating (1), evident with an amber quality rating (3) or evident with a green quality rating (4.5). 22 This group of evidence could be rated as either “not evident” (0), evident but only with red quality rating (2), evident with an amber quality rating (4) or evident with a green quality rating (6).
NDSEMIC evaluation case study: Energy in Schools
32
Evidence ‘type’ Description of evidence type Numerical rating of evidence type
Self-reported energy savings (e.g. user can point to cost reductions in bills) that the user assigns to use of the tool.
At three out of six schools visited, a user had access to the energy bills, but no change was observed.
At the other three schools visited, users interviewed didn't have access to the bills to make any observation of savings.
023
Multiple users at one site converge in reporting behaviour change, inferred to lead to energy savings, that users assign to use of the tool.
At four out of six schools visited, more than one user was interviewed, and they converged in reporting behaviour change that they assigned to participation in Energy in Schools.
424
One user reports behaviour change, inferred to lead to energy savings, that users assign to use of the tool.
At all six schools visited, users reported changes in energy use behaviour since participating in the pilot, which they attributed to Energy in Schools.
625
Behaviour change reported via survey assigned to use of tool.
The online survey of 18 Energy in Schools users in 13 of the 20 pilot schools found that 16 out of 18 survey respondents agreed that their school has tried to reduce the amount of energy used since engaging with Energy in Schools.
Specific examples of these (from case studies) included: ensuring lights were turned off in empty rooms, interactive whiteboards were turned off when not in use, and chargers for laptops or other equipment also being switched off more regularly (including one school that had started charging them on a timer).
326
Theory-based evidence
23 This group of evidence could be rated as either “not evident” (0), evident at 1-2 sites (2), evident at more than 1-2 sites (4) or evident at most sites consulted (6). 24 This group of evidence could be rated as either “not evident” (0), evident at 1-2 sites (2), evident at more than 1-2 sites (4) or evident at most sites consulted (6). 25 This group of evidence could be rated as either “not evident” (0), evident at 1-2 sites (2), evident at more than 1-2 sites (4) or evident at most sites consulted (6). 26 This group of evidence could be rated as either “not evident” (0), evident at 1-2 sites (1), evident at more than 1-2 sites (2) or evident at most sites consulted (3).
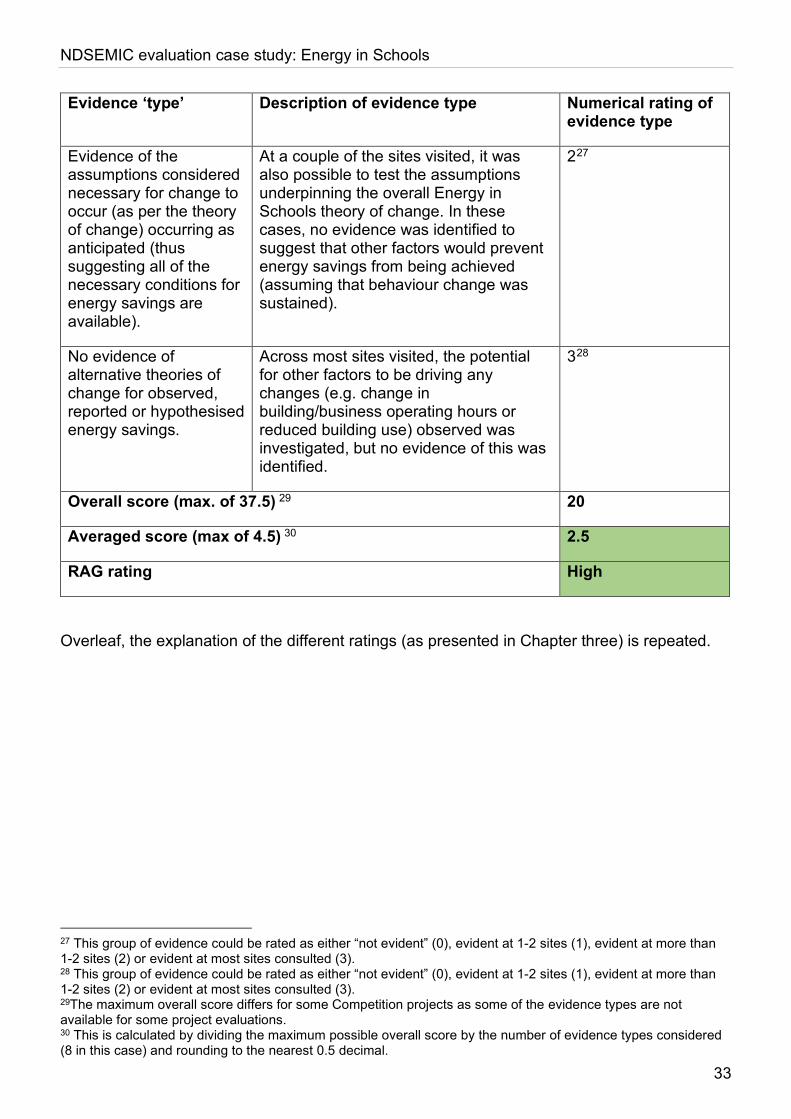
NDSEMIC evaluation case study: Energy in Schools
33
Evidence ‘type’ Description of evidence type Numerical rating of evidence type
Evidence of the assumptions considered necessary for change to occur (as per the theory of change) occurring as anticipated (thus suggesting all of the necessary conditions for energy savings are available).
At a couple of the sites visited, it was also possible to test the assumptions underpinning the overall Energy in Schools theory of change. In these cases, no evidence was identified to suggest that other factors would prevent energy savings from being achieved (assuming that behaviour change was sustained).
227
No evidence of alternative theories of change for observed, reported or hypothesised energy savings.
Across most sites visited, the potential for other factors to be driving any changes (e.g. change in building/business operating hours or reduced building use) observed was investigated, but no evidence of this was identified.
328
Overall score (max. of 37.5) 29 20
Averaged score (max of 4.5) 30 2.5
RAG rating High
Overleaf, the explanation of the different ratings (as presented in Chapter three) is repeated.
27 This group of evidence could be rated as either “not evident” (0), evident at 1-2 sites (1), evident at more than 1-2 sites (2) or evident at most sites consulted (3). 28 This group of evidence could be rated as either “not evident” (0), evident at 1-2 sites (1), evident at more than 1-2 sites (2) or evident at most sites consulted (3). 29The maximum overall score differs for some Competition projects as some of the evidence types are not available for some project evaluations. 30 This is calculated by dividing the maximum possible overall score by the number of evidence types considered (8 in this case) and rounding to the nearest 0.5 decimal.
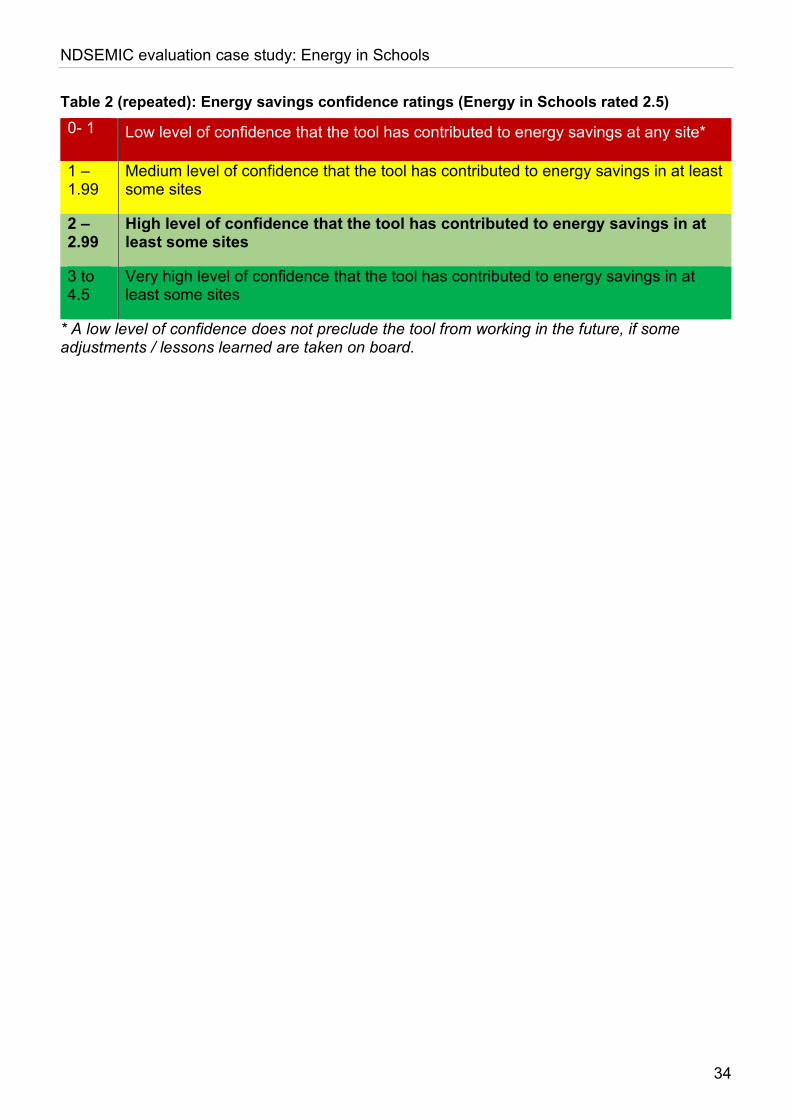
NDSEMIC evaluation case study: Energy in Schools
34
Table 2 (repeated): Energy savings confidence ratings (Energy in Schools rated 2.5) 0- 1 Low level of confidence that the tool has contributed to energy savings at any site*
1 – 1.99
Medium level of confidence that the tool has contributed to energy savings in at least some sites
2 – 2.99
High level of confidence that the tool has contributed to energy savings in at least some sites
3 to 4.5
Very high level of confidence that the tool has contributed to energy savings in at least some sites
* A low level of confidence does not preclude the tool from working in the future, if some adjustments / lessons learned are taken on board.
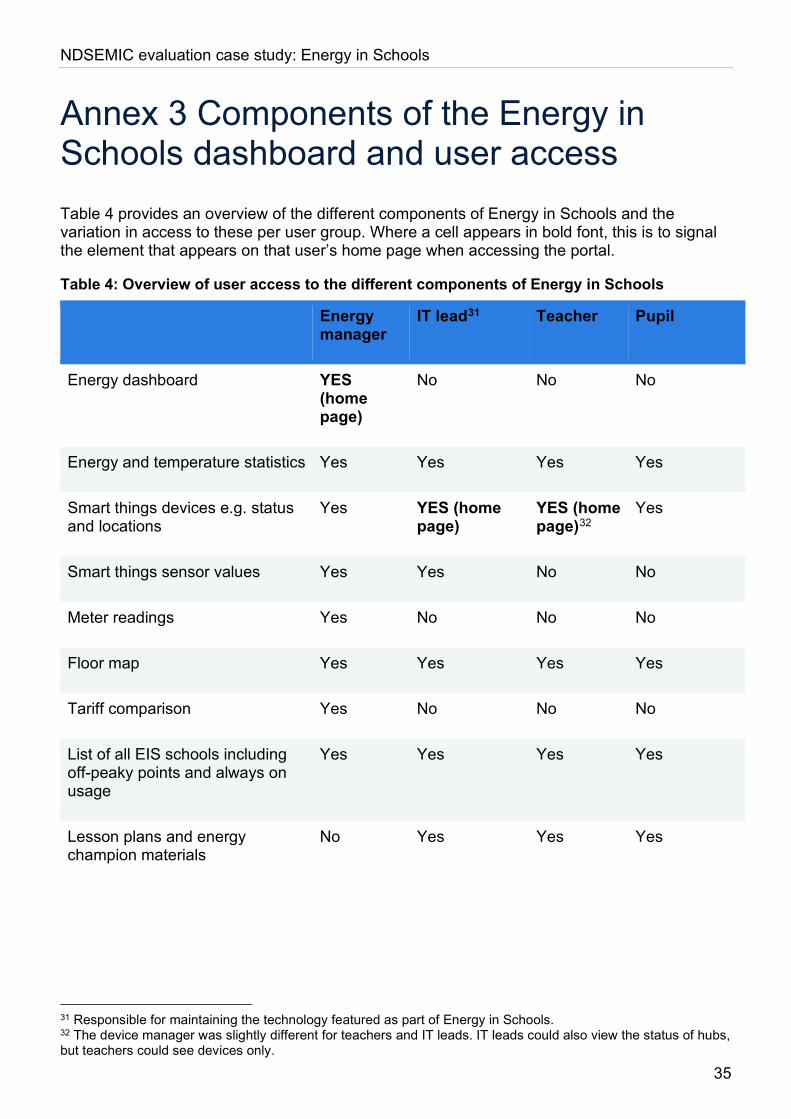
NDSEMIC evaluation case study: Energy in Schools
35
Annex 3 Components of the Energy in Schools dashboard and user access Table 4 provides an overview of the different components of Energy in Schools and the variation in access to these per user group. Where a cell appears in bold font, this is to signal the element that appears on that user’s home page when accessing the portal.
Table 4: Overview of user access to the different components of Energy in Schools
Energy manager
IT lead31 Teacher Pupil
Energy dashboard YES (home page)
No No No
Energy and temperature statistics Yes Yes Yes Yes
Smart things devices e.g. status and locations
Yes YES (home page)
YES (home page)32
Yes
Smart things sensor values Yes Yes No No
Meter readings Yes No No No
Floor map Yes Yes Yes Yes
Tariff comparison Yes No No No
List of all EIS schools including off-peaky points and always on usage
Yes Yes Yes Yes
Lesson plans and energy champion materials
No Yes Yes Yes
31 Responsible for maintaining the technology featured as part of Energy in Schools. 32 The device manager was slightly different for teachers and IT leads. IT leads could also view the status of hubs, but teachers could see devices only.
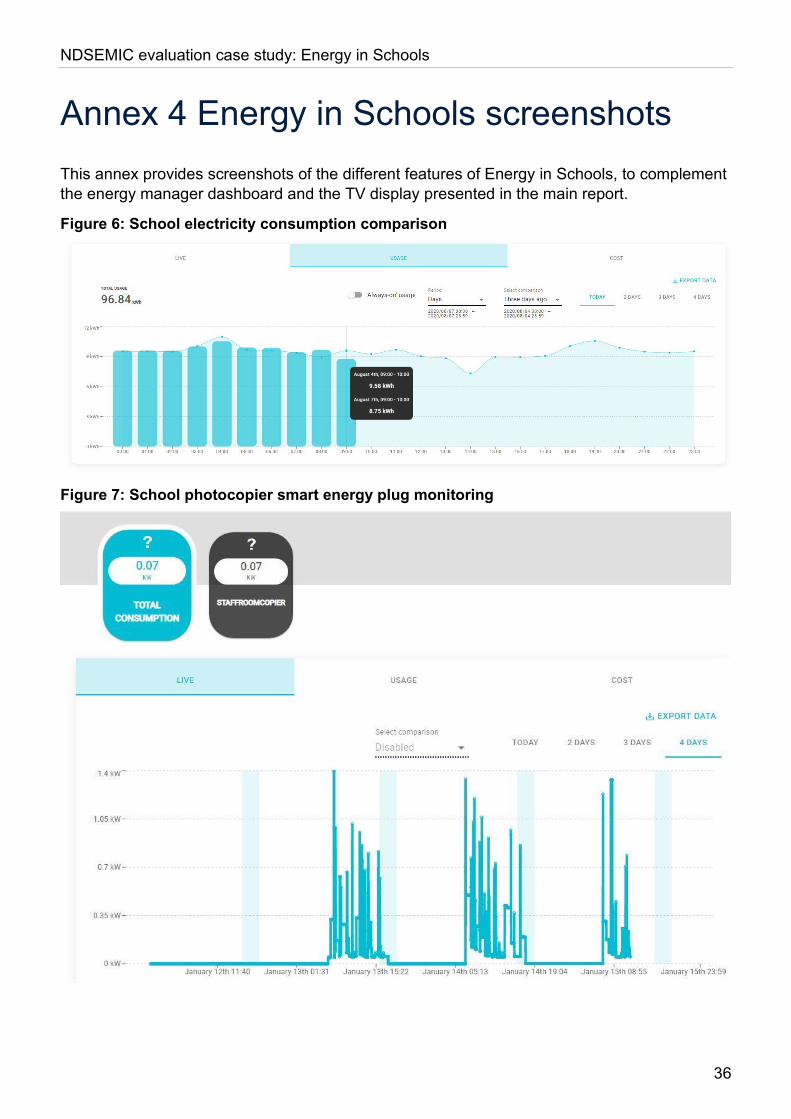
NDSEMIC evaluation case study: Energy in Schools
36
Annex 4 Energy in Schools screenshots This annex provides screenshots of the different features of Energy in Schools, to complement the energy manager dashboard and the TV display presented in the main report.
Figure 6: School electricity consumption comparison
Figure 7: School photocopier smart energy plug monitoring

NDSEMIC evaluation case study: Energy in Schools
37
Figure 8: Classroom temperature (winter)

NDSEMIC evaluation case study: Energy in Schools
This publication is available from: www.gov.uk/beis [replace with direct URL if known]
If you need a version of this document in a more accessible format, please email [email protected]. Please tell us what format you need. It will help us if you say what assistive technology you use.


