This document is for the use of the recipient only and should not be copied or distributed to any other person or entity. Please refer to important disclosures at the end of this presentation. Credit report Credit Research Norske Skog 25 November 2019 Analyst: Glenn Kringhaug +47 22 01 61 62 27 November 2019
Transcript
This document is for the use of the recipient only and should not be copied or distributed to
any other person or entity.
Please refer to important disclosures at the end of this presentation.
Credit report
Credit Research
Norske Skog
25 November 2019
Analyst: Glenn Kringhaug +47 22 01 61 62
27 November 2019
Key Terms
2
Source: ABG Sundal Collier
Issuer Norske Skog AS
GuarantorsMaterial group companies Norske Skog (Australasia) Pty Ltd, Norske Skog Bruck GmbH, Norske Skog Skogn AS, Norske Skog Saugbrugs AS, Norske Skog Golbey SAS,
Norske Skog Industries Australia Ltd., Norske Skog Tasman Ltd., Norske Skog Paper Mills (Australia) Ltd., Norske Skog Paper Mills (Albury) Pty Ltd., and Nornews A/S
Issue amount EUR 125m
Tenor 3 years, maturity 14 June 2022
Amortization 100% repayment at final maturity (bullet)
Status Senior secured (subject to the super-senior status of the RCF, guarantee facility and permitted hedging sharing security with the bonds)
Security(i) Share pledges over the Guarantors, (ii) fixed and floating charge security over (a) Saugbrugs mill, (b) the Skogn mill, the (c) the Tasman mill, the (d) Albury mill and (e) the
Boyer mill, (iii) assignment of shareholder loans and assignment of intercompany loans
Call options Make-whole first 18 months, callable thereafter (all or nothing) at par plus 50%/30%/10% of the initial Coupon after 18/24/30 months, respectively
Equity claw-back Up to 35% of issue amount may be repaid at first call price by primary proceeds raised through an IPO
Special covenants Special covenants include restrictions on shareholder distributions, negative pledge, financial support, financial indebtedness, subsidiaries distributions
Maintenance
covenants
• NIBD/EBITDA shall not exceed 2.75x
• Liquidity (free cash) shall exceed NOK 100,000,000
Incurrence tests With respect to dividend payments, NIBD / EBITDA shall not exceed 2.00x
Dividend restrictions Up to 75% of last years adjusted net profit, subject to the incurrence test being met
Permitted additional
debt
(i) RCF of maximum EUR 31m (annual clean down provisions), (ii) permitted hedging, (iii) guarantee facility, (iv) factoring facility of maximum EUR 40m, (v) financial leasing of
maximum EUR 12m, (vi) leasing in the ordinary course of business that would have been classified as an operational lease prior to the implementation of IFRS 16, (vii) Saugbrug
project facility (NOK 94m), (viii) Golbey loans of maximum EUR 8m, (ix) Bruck boiler facility of maximum EUR 58m (which is subject to the incurrence test being met at
commitment), (x) any credit facility provided by any governmental institution of maximum EUR 10m, (xi) intra-company loans, (xii) subordinated shareholder loans, (xiii) debt in
acquired entities if refinanced within 3 months and (xiv) a general basket of EUR 5m
Permitted disposal The group may freely sell or dispose (i) the Albury mill, (ii) the forest estates in Tasmania, (iii) the Bruck hydro plant, (iv) the Saugbrugs development properties
Change of control Bondholder’s put option at 101% of par value
Documentation /
TrusteeNorwegian law documentation (relevant jurisdictions for security documents) / Nordic Trustee
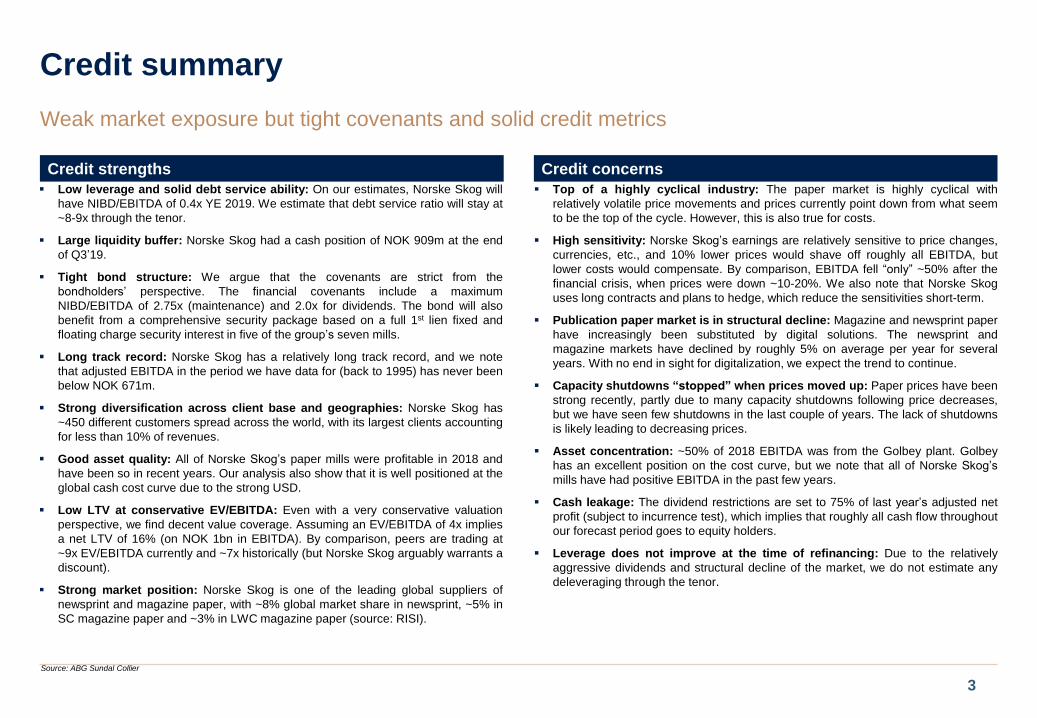
Credit summary
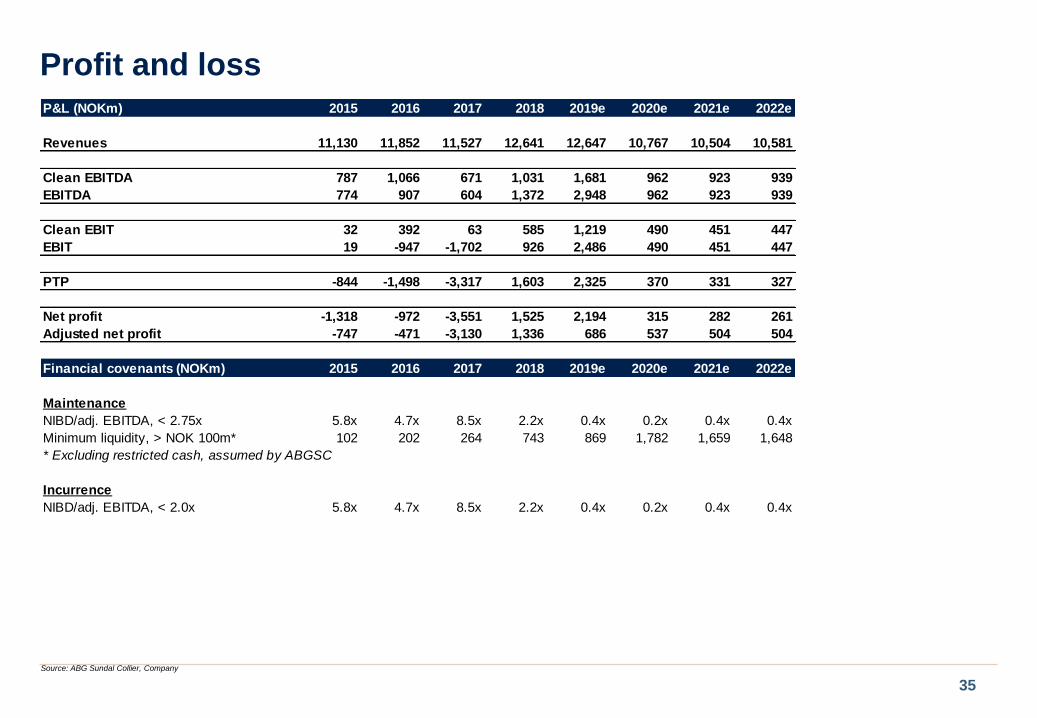
Low leverage and solid debt service ability: On our estimates, Norske Skog will
have NIBD/EBITDA of 0.4x YE 2019. We estimate that debt service ratio will stay at
~8-9x through the tenor.
Large liquidity buffer: Norske Skog had a cash position of NOK 909m at the end
of Q3’19.
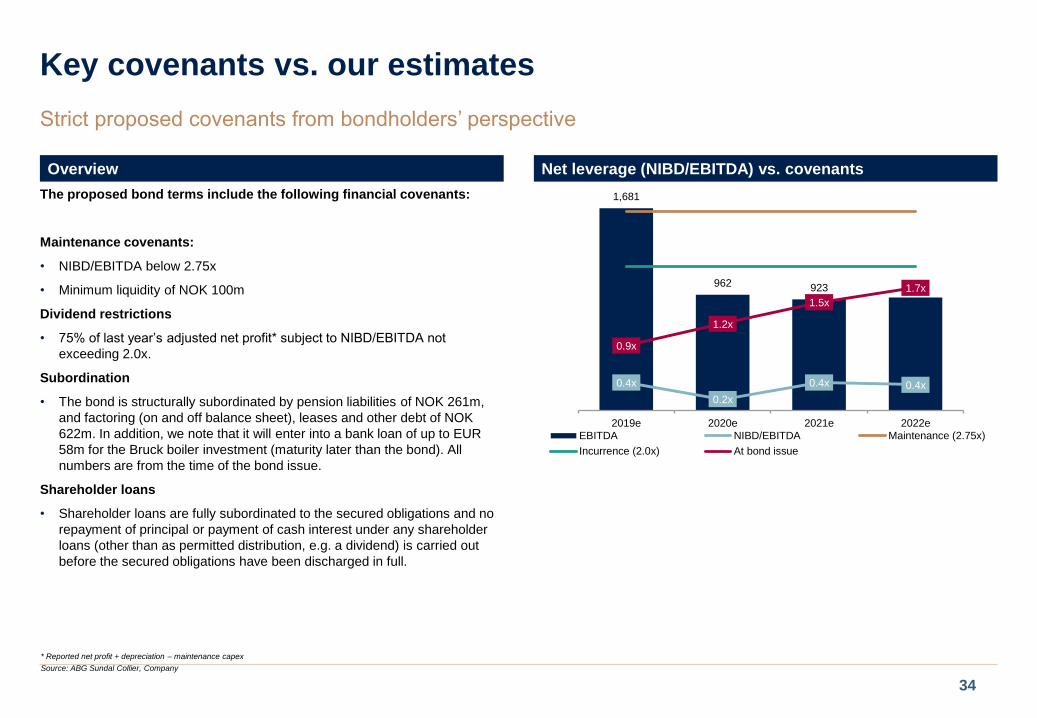
Tight bond structure: We argue that the covenants are strict from the
bondholders’ perspective. The financial covenants include a maximum
NIBD/EBITDA of 2.75x (maintenance) and 2.0x for dividends. The bond will also
benefit from a comprehensive security package based on a full 1st lien fixed and
floating charge security interest in five of the group’s seven mills.
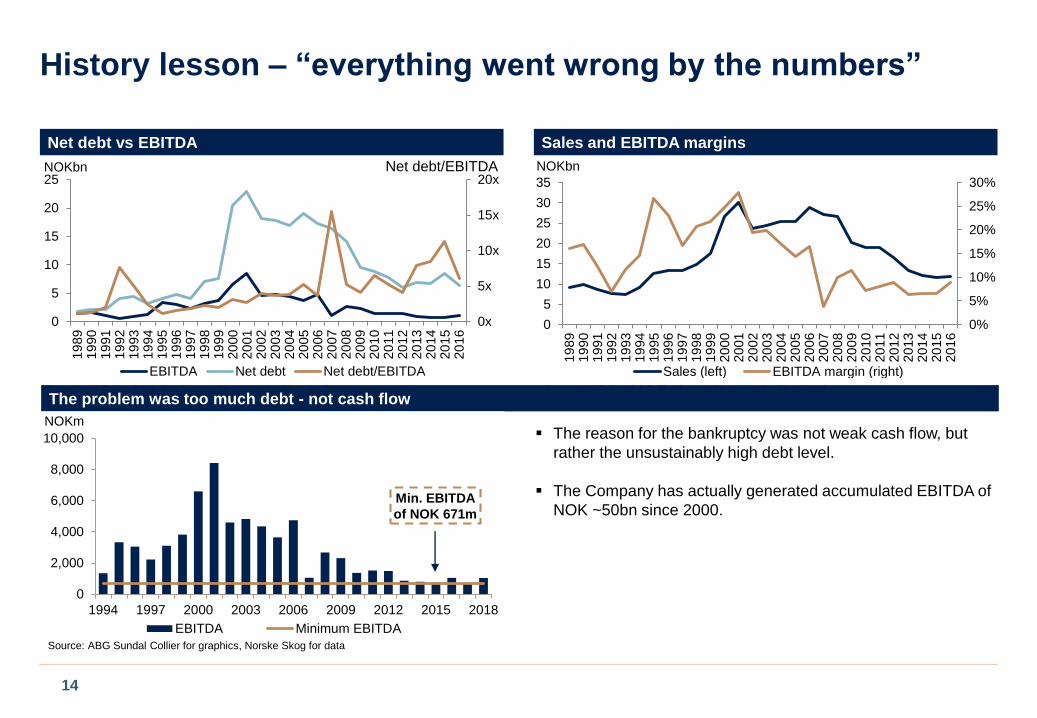
Long track record: Norske Skog has a relatively long track record, and we note
that adjusted EBITDA in the period we have data for (back to 1995) has never been
below NOK 671m.
Strong diversification across client base and geographies: Norske Skog has
~450 different customers spread across the world, with its largest clients accounting
for less than 10% of revenues.
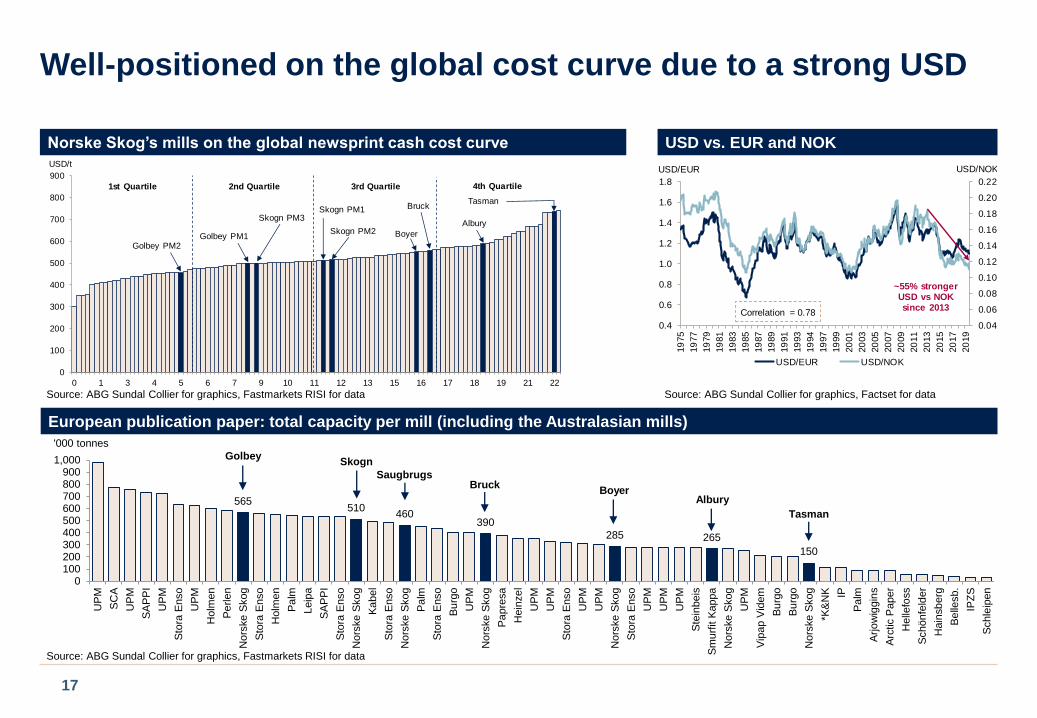
Good asset quality: All of Norske Skog’s paper mills were profitable in 2018 and
have been so in recent years. Our analysis also show that it is well positioned at the
global cash cost curve due to the strong USD.
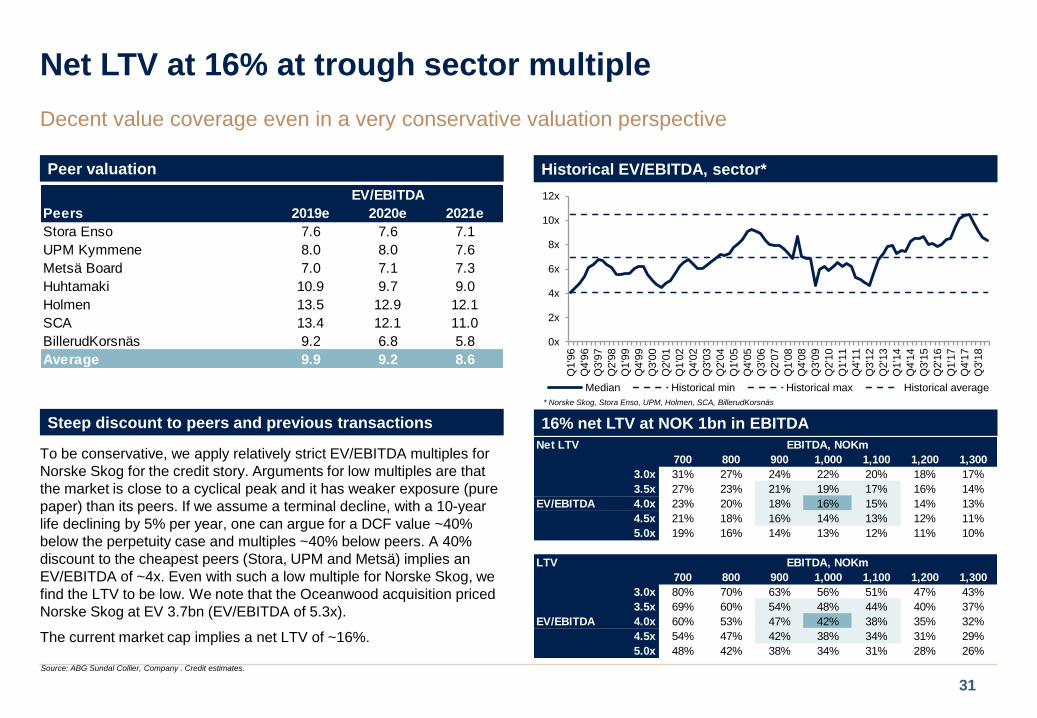
Low LTV at conservative EV/EBITDA: Even with a very conservative valuation
perspective, we find decent value coverage. Assuming an EV/EBITDA of 4x implies
a net LTV of 16% (on NOK 1bn in EBITDA). By comparison, peers are trading at
~9x EV/EBITDA currently and ~7x historically (but Norske Skog arguably warrants a
discount).
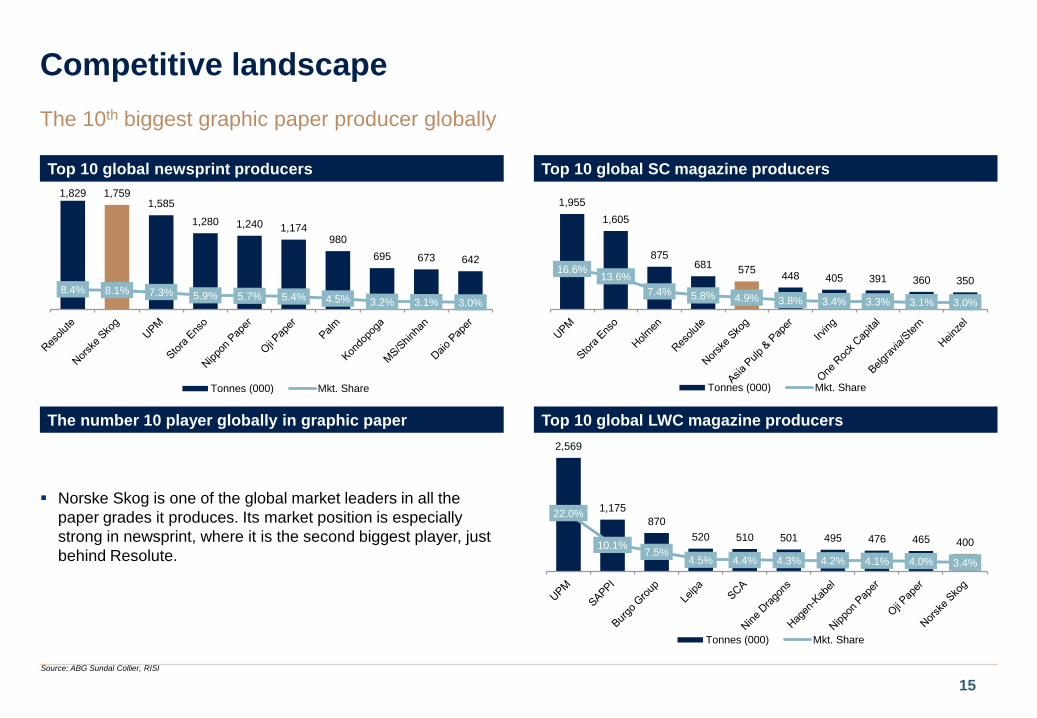
Strong market position: Norske Skog is one of the leading global suppliers of
newsprint and magazine paper, with ~8% global market share in newsprint, ~5% in
SC magazine paper and ~3% in LWC magazine paper (source: RISI).
3
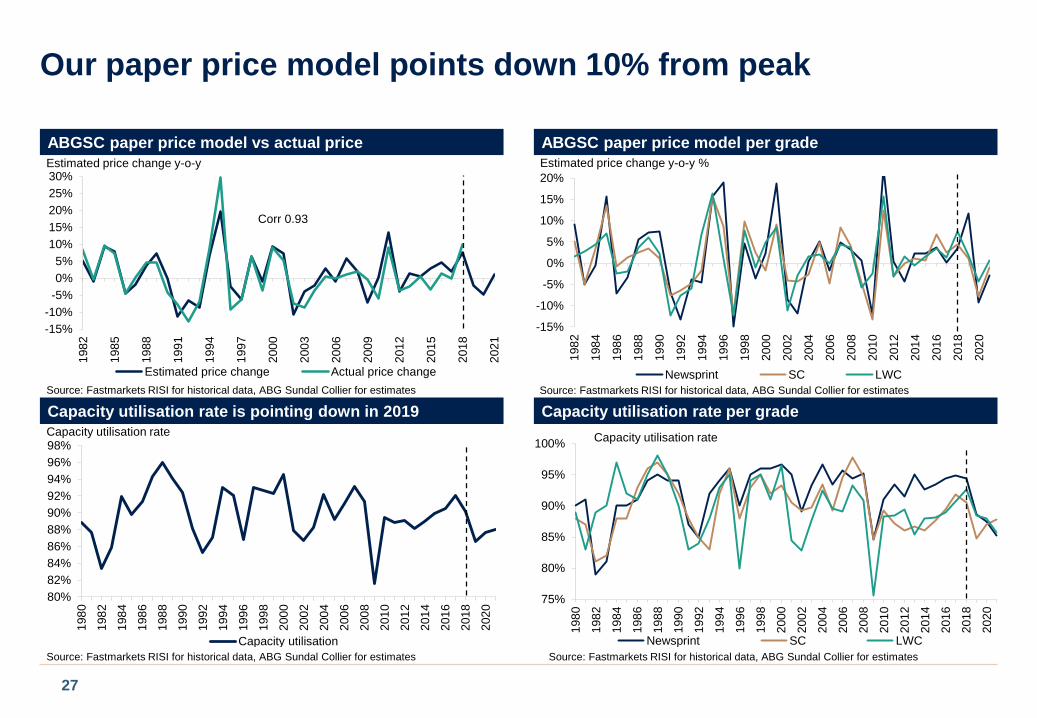
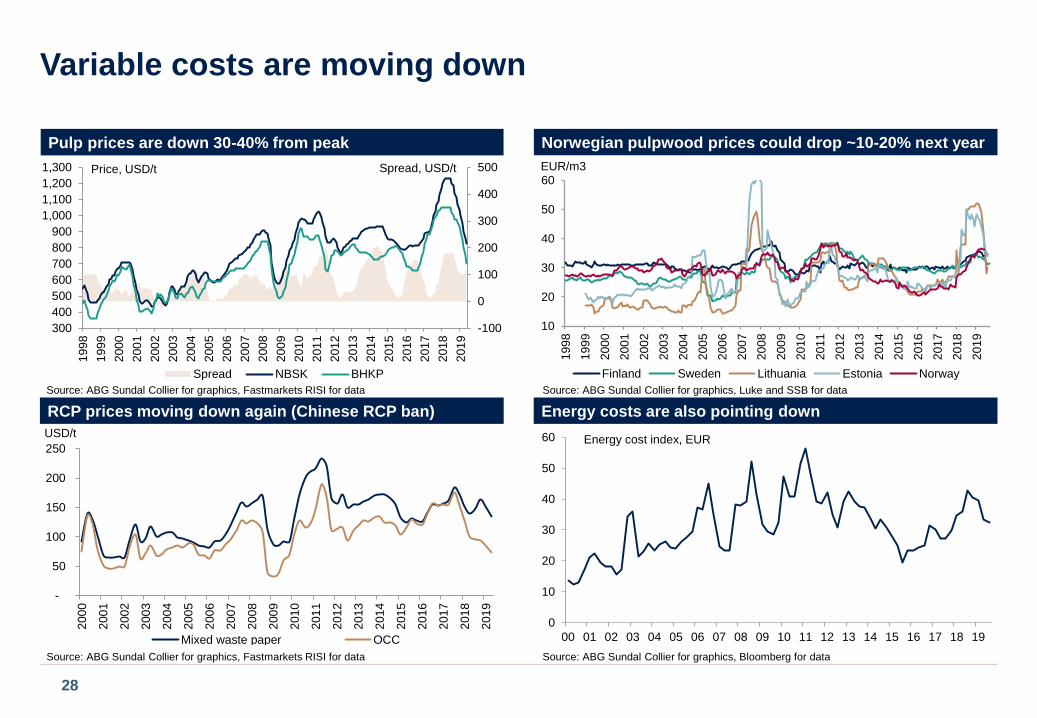
Top of a highly cyclical industry: The paper market is highly cyclical with
relatively volatile price movements and prices currently point down from what seem
to be the top of the cycle. However, this is also true for costs.
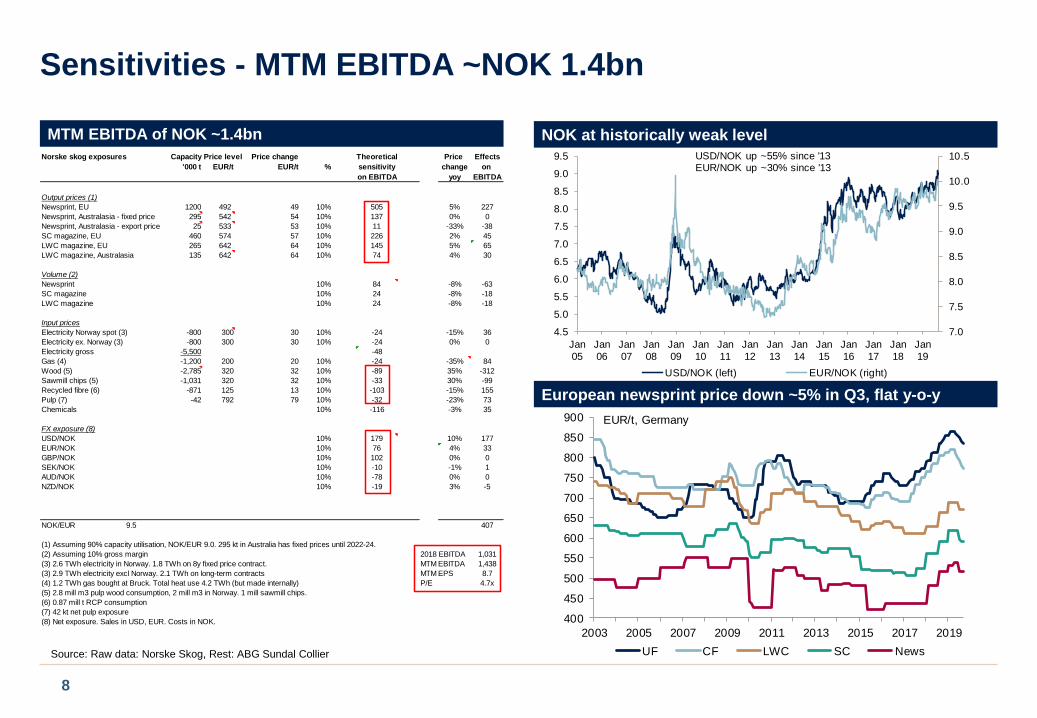
High sensitivity: Norske Skog’s earnings are relatively sensitive to price changes,
currencies, etc., and 10% lower prices would shave off roughly all EBITDA, but
lower costs would compensate. By comparison, EBITDA fell “only” ~50% after the
financial crisis, when prices were down ~10-20%. We also note that Norske Skog
uses long contracts and plans to hedge, which reduce the sensitivities short-term.
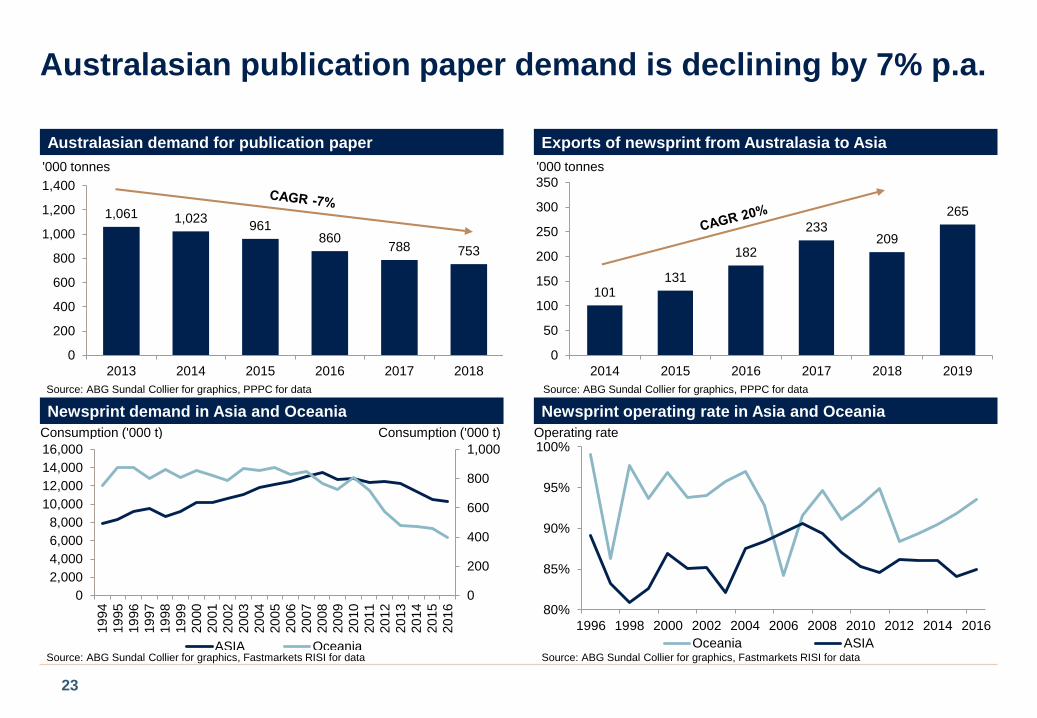
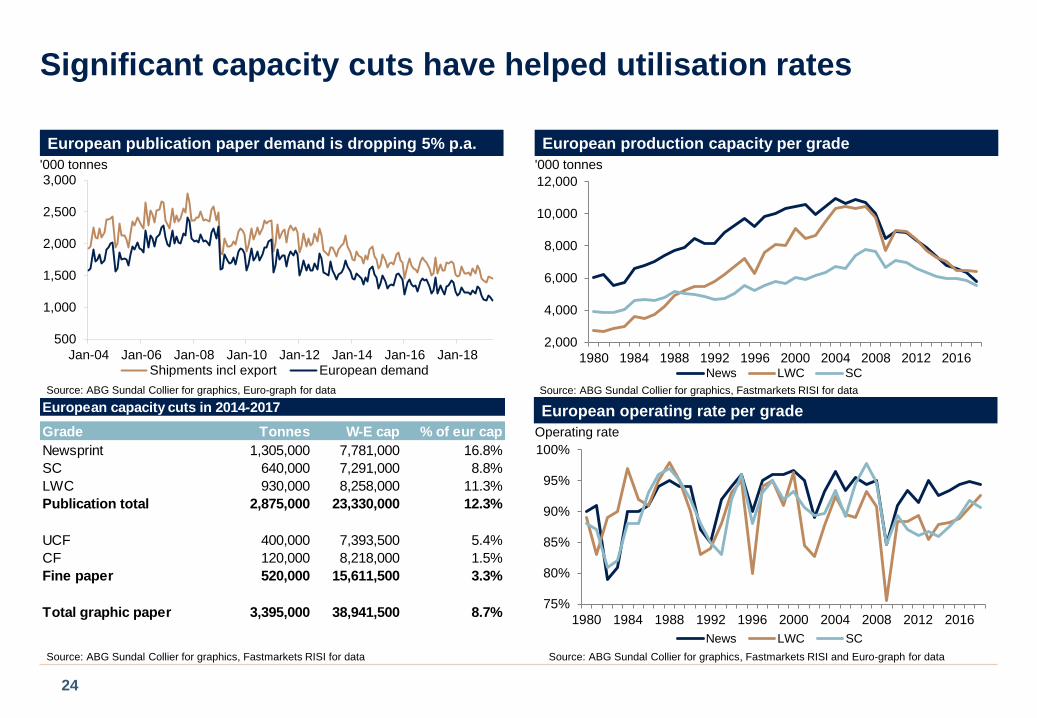
Publication paper market is in structural decline: Magazine and newsprint paper
have increasingly been substituted by digital solutions. The newsprint and
magazine markets have declined by roughly 5% on average per year for several
years. With no end in sight for digitalization, we expect the trend to continue.
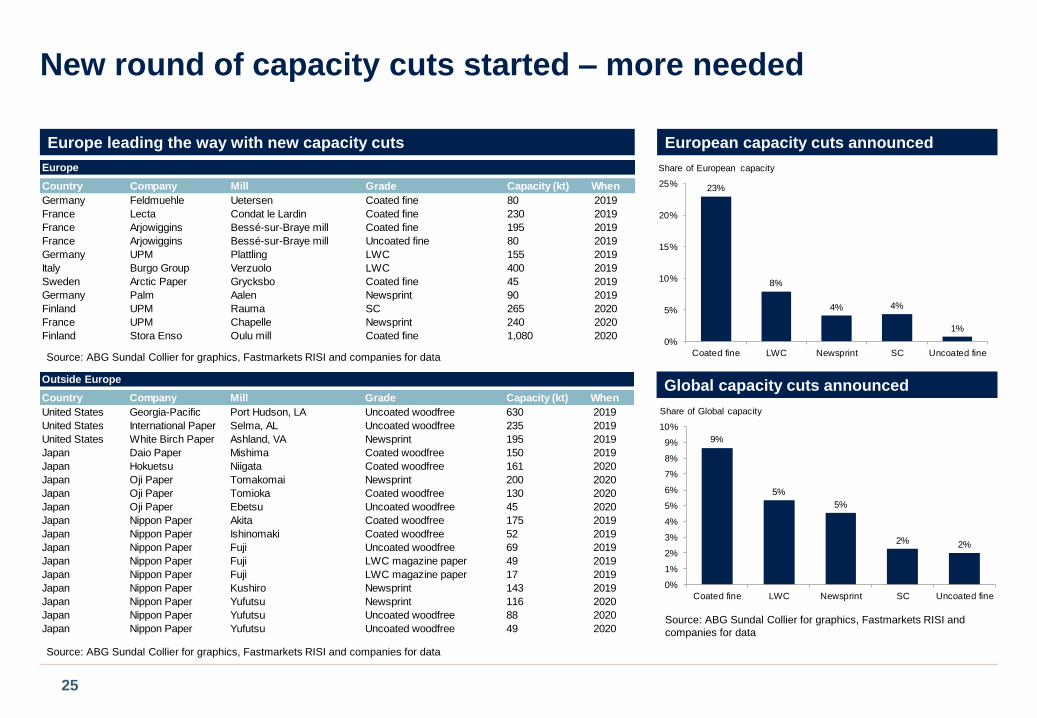
Capacity shutdowns “stopped” when prices moved up: Paper prices have been
strong recently, partly due to many capacity shutdowns following price decreases,
but we have seen few shutdowns in the last couple of years. The lack of shutdowns
is likely leading to decreasing prices.
Asset concentration: ~50% of 2018 EBITDA was from the Golbey plant. Golbey
has an excellent position on the cost curve, but we note that all of Norske Skog’s
mills have had positive EBITDA in the past few years.
Cash leakage: The dividend restrictions are set to 75% of last year’s adjusted net
profit (subject to incurrence test), which implies that roughly all cash flow throughout
our forecast period goes to equity holders.
Leverage does not improve at the time of refinancing: Due to the relatively
aggressive dividends and structural decline of the market, we do not estimate any
deleveraging through the tenor.
Credit strengths Credit concerns
Source: ABG Sundal Collier
Weak market exposure but tight covenants and solid credit metrics
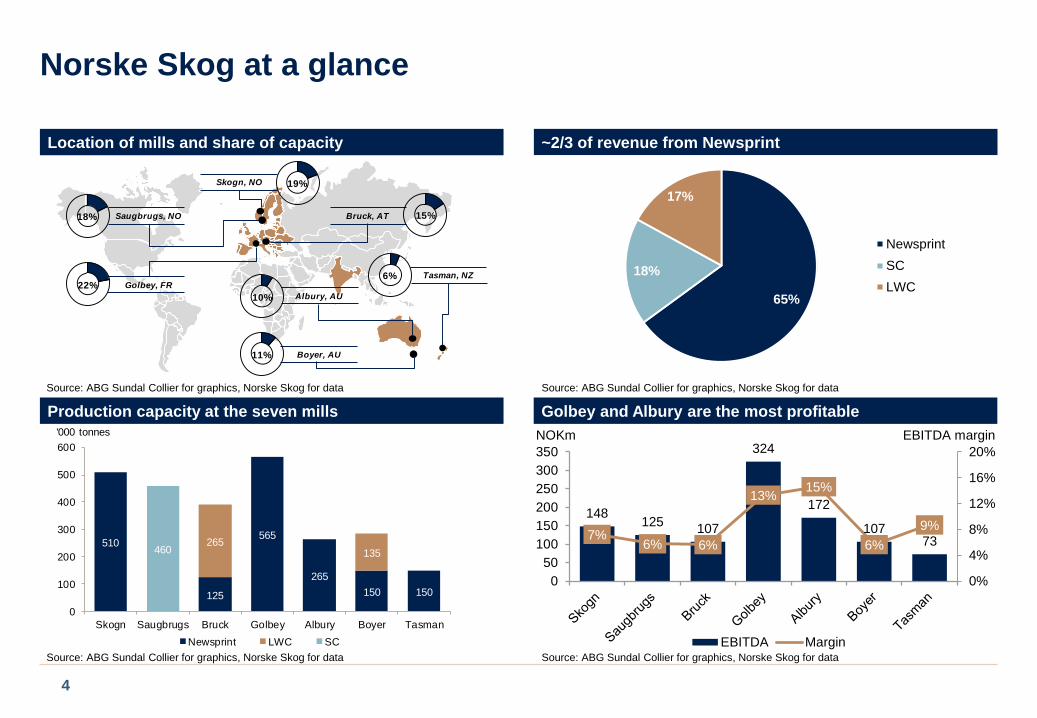
Albury, AU
Tasman, NZ
Boyer, AU
Golbey, FR
Bruck, AT
Skogn, NO
Saugbrugs, NO18%
22%
10%
15%
11%
6%
19%
510
125
565
265
150 150
265135460
0
100
200
300
400
500
600
Skogn Saugbrugs Bruck Golbey Albury Boyer Tasman
Newsprint LWC SC
'000 tonnes
Norske Skog at a glance
4
Location of mills and share of capacity ~2/3 of revenue from Newsprint
Golbey and Albury are the most profitable
148125
107
324
172
10773
7%6% 6%
13%15%
6%
9%
0%
4%
8%
12%
16%
20%
0
50
100
150
200
250
300
350
EBITDA Margin
NOKm EBITDA margin
Source: ABG Sundal Collier for graphics, Norske Skog for data
Production capacity at the seven mills
65%
18%
17%
Newsprint
SC
LWC
Source: ABG Sundal Collier for graphics, Norske Skog for data
Source: ABG Sundal Collier for graphics, Norske Skog for dataSource: ABG Sundal Collier for graphics, Norske Skog for data
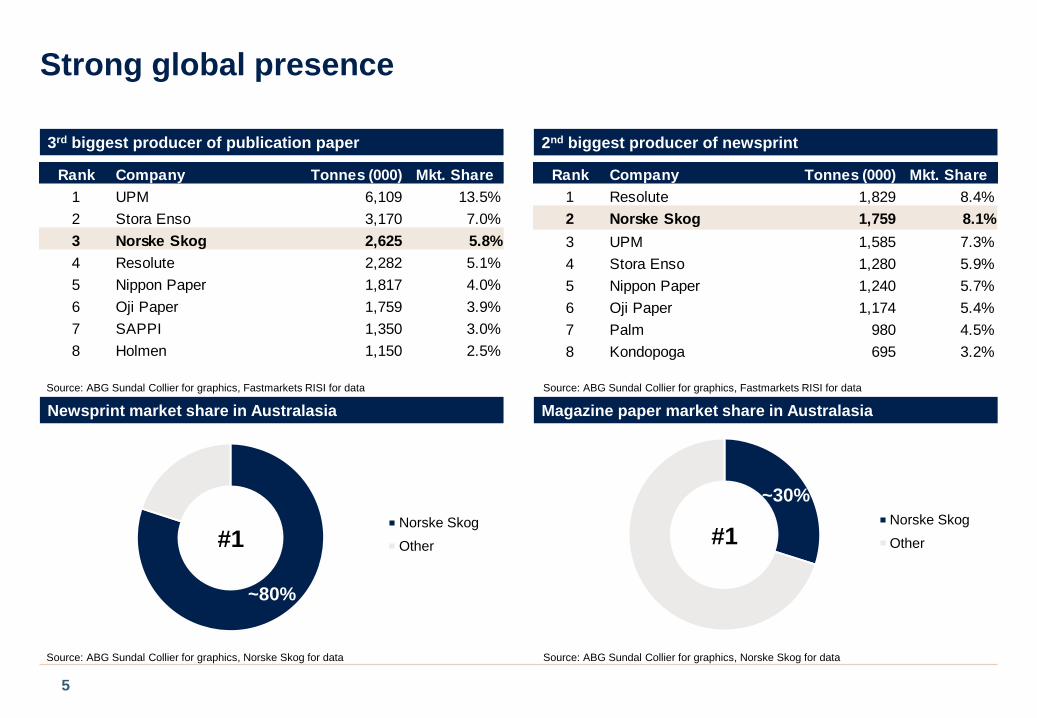
Norske Skog
Other#1
~80%
Norske Skog
Other#1
~30%
Strong global presence
5
3rd biggest producer of publication paper 2nd biggest producer of newsprint
Newsprint market share in Australasia Magazine paper market share in Australasia
Source: ABG Sundal Collier for graphics, Norske Skog for dataSource: ABG Sundal Collier for graphics, Norske Skog for data
Source: ABG Sundal Collier for graphics, Fastmarkets RISI for dataSource: ABG Sundal Collier for graphics, Fastmarkets RISI for data
Rank Company Tonnes (000) Mkt. Share
1 UPM 6,109 13.5%
2 Stora Enso 3,170 7.0%
3 Norske Skog 2,625 5.8%
4 Resolute 2,282 5.1%
5 Nippon Paper 1,817 4.0%
6 Oji Paper 1,759 3.9%
7 SAPPI 1,350 3.0%
8 Holmen 1,150 2.5%
Rank Company Tonnes (000) Mkt. Share
1 Resolute 1,829 8.4%
2 Norske Skog 1,759 8.1%
3 UPM 1,585 7.3%
4 Stora Enso 1,280 5.9%
5 Nippon Paper 1,240 5.7%
6 Oji Paper 1,174 5.4%
7 Palm 980 4.5%
8 Kondopoga 695 3.2%
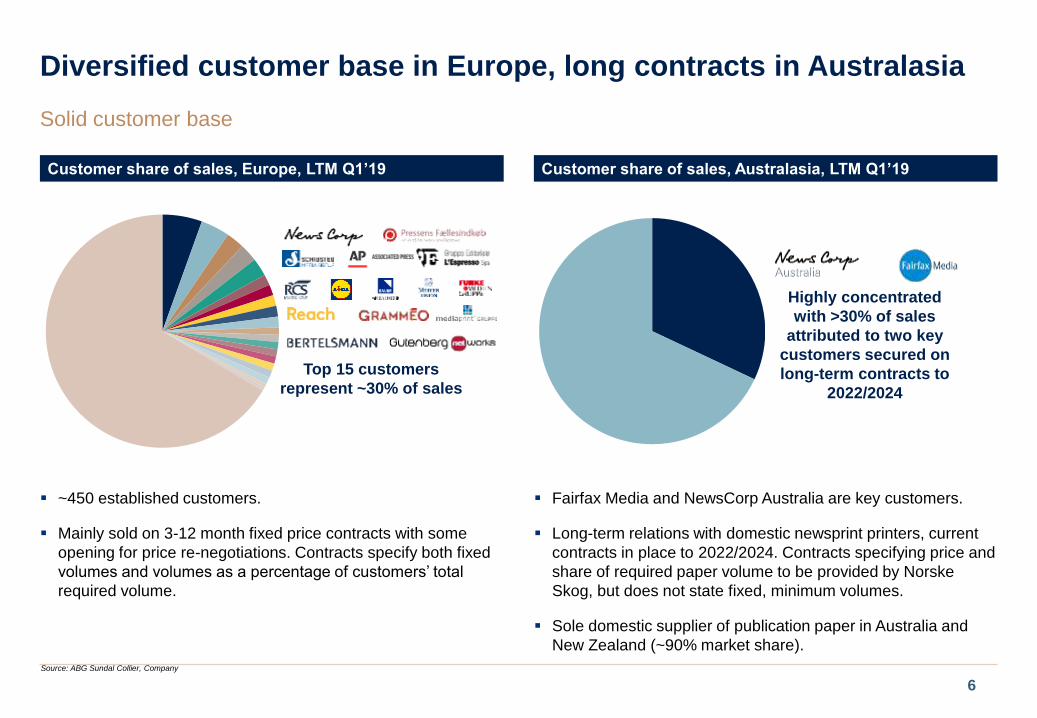
~450 established customers.
Mainly sold on 3-12 month fixed price contracts with some
opening for price re-negotiations. Contracts specify both fixed
volumes and volumes as a percentage of customers’ total
required volume.
Diversified customer base in Europe, long contracts in Australasia
Customer share of sales, Europe, LTM Q1’19 Customer share of sales, Australasia, LTM Q1’19
Solid customer base
6
Source: ABG Sundal Collier, Company
Top 15 customers
represent ~30% of sales
Highly concentrated
with >30% of sales
attributed to two key
customers secured on
long-term contracts to
2022/2024
Fairfax Media and NewsCorp Australia are key customers.
Long-term relations with domestic newsprint printers, current
contracts in place to 2022/2024. Contracts specifying price and
share of required paper volume to be provided by Norske
Skog, but does not state fixed, minimum volumes.
Sole domestic supplier of publication paper in Australia and
New Zealand (~90% market share).
Complex business model made simple: all about prices and FX
7
Estimated EBITDA using regression model …and estimated EBITDA margin
0
500
1,000
1,500
2,000
2,500
Q1
'96
Q1
'97
Q1
'98
Q1
'99
Q1
'00
Q1
'01
Q1
'02
Q1
'03
Q1
'04
Q1
'05
Q1
'06
Q1
'07
Q1
'08
Q1
'09
Q1
'10
Q1
'11
Q1
'12
Q1
'13
Q1
'14
Q1
'15
Q1
'16
Q1
'17
Q1
'18
Q1
'19
Reported clean EBITDA Estimated EBITDA
NOKm
Correlation = 0.91
Complex business model broken down to four parameters to
estimate EBITDA.
The parameters:
Publication paper prices
Delivery volumes
Cost of fibre (pulpwood)
FX (USD/NOK)
Looking at EBITDA margins instead, we can reduce the
model to two parameters
The parameters:
Publication paper prices
FX (USD/EUR)
Source: Norske Skog, Fastmarkets RISI, LUKE and Bloomberg for historical data, ABG Sundal Collier for estimates
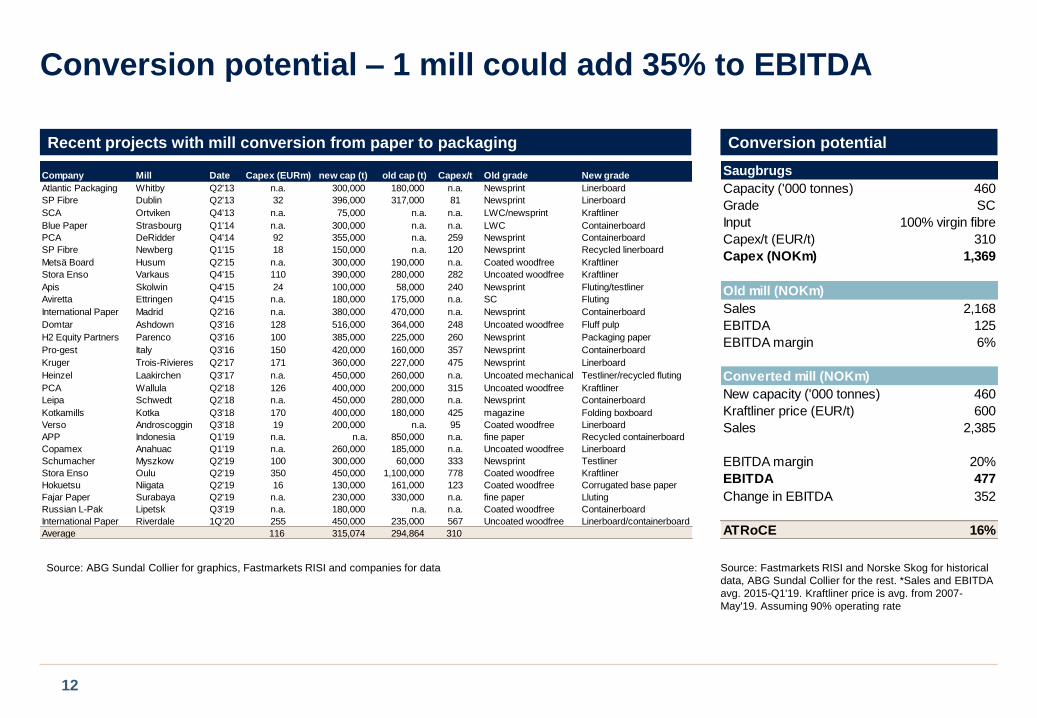
International Paper Riverdale 1Q'20 255 450,000 235,000 567 Uncoated woodfree Linerboard/containerboard
Average 116 315,074 294,864 310
Saugbrugs
Capacity ('000 tonnes) 460
Grade SC
Input 100% virgin fibre
Capex/t (EUR/t) 310
Capex (NOKm) 1,369
Old mill (NOKm)
Sales 2,168
EBITDA 125
EBITDA margin 6%
Converted mill (NOKm)
New capacity ('000 tonnes) 460
Kraftliner price (EUR/t) 600
Sales 2,385
EBITDA margin 20%
EBITDA 477
Change in EBITDA 352
ATRoCE 16%
Source: Fastmarkets RISI and Norske Skog for historical
data, ABG Sundal Collier for the rest. *Sales and EBITDA
avg. 2015-Q1'19. Kraftliner price is avg. from 2007-
May'19. Assuming 90% operating rate
Source: ABG Sundal Collier for graphics, Fastmarkets RISI and companies for data
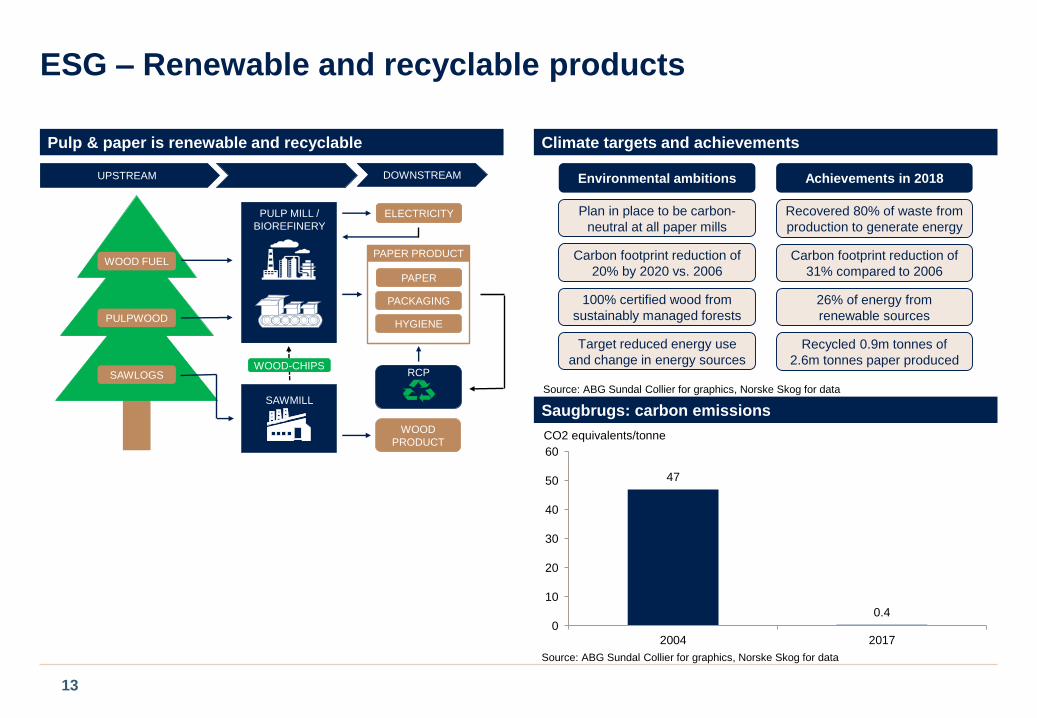
ESG – Renewable and recyclable products
13
Pulp & paper is renewable and recyclable Climate targets and achievements
PAPER PRODUCT
PAPER
PACKAGING
HYGIENE
SAWMILL
WOOD-CHIPS
ELECTRICITYPULP MILL /
BIOREFINERY
RCPSAWLOGS
PULPWOOD
WOOD FUEL
UPSTREAM DOWNSTREAM
WOOD
PRODUCT
Saugbrugs: carbon emissions
47
0.40
10
20
30
40
50
60
2004 2017
CO2 equivalents/tonne
Source: ABG Sundal Collier for graphics, Norske Skog for data
Source: ABG Sundal Collier for graphics, Norske Skog for data
26% of energy from
renewable sources
Environmental ambitions
Recovered 80% of waste from
production to generate energy
Plan in place to be carbon-
neutral at all paper mills
Recycled 0.9m tonnes of
2.6m tonnes paper produced
Achievements in 2018
Carbon footprint reduction of
20% by 2020 vs. 2006
100% certified wood from
sustainably managed forests
Carbon footprint reduction of
31% compared to 2006
Target reduced energy use
and change in energy sources
History lesson – “everything went wrong by the numbers”
14
Net debt vs EBITDA Sales and EBITDA margins
0x
5x
10x
15x
20x
0
5
10
15
20
25
19
89
19
90
19
91
19
92
19
93
19
94
19
95
19
96
19
97
19
98
19
99
20
00
20
01
20
02
20
03
20
04
20
05
20
06
20
07
20
08
20
09
20
10
20
11
20
12
20
13
20
14
20
15
20
16
NOKbn
EBITDA Net debt Net debt/EBITDA
Net debt/EBITDA
0%
5%
10%
15%
20%
25%
30%
0
5
10
15
20
25
30
35
19
89
19
90
19
91
19
92
19
93
19
94
19
95
19
96
19
97
19
98
19
99
20
00
20
01
20
02
20
03
20
04
20
05
20
06
20
07
20
08
20
09
20
10
20
11
20
12
20
13
20
14
20
15
20
16
Sales (left) EBITDA margin (right)
NOKbn
Source: ABG Sundal Collier for graphics, Norske Skog for dataSource: ABG Sundal Collier for graphics, Norske Skog for dataThe problem was too much debt - not cash flow
0
2,000
4,000
6,000
8,000
10,000
1994 1997 2000 2003 2006 2009 2012 2015 2018
EBITDA Minimum EBITDA
NOKm
Min. EBITDA
of NOK 671m
The reason for the bankruptcy was not weak cash flow, but
rather the unsustainably high debt level.
The Company has actually generated accumulated EBITDA of
NOK ~50bn since 2000.
Source: ABG Sundal Collier for graphics, Norske Skog for data
Competitive landscape
Top 10 global newsprint producers Top 10 global SC magazine producers
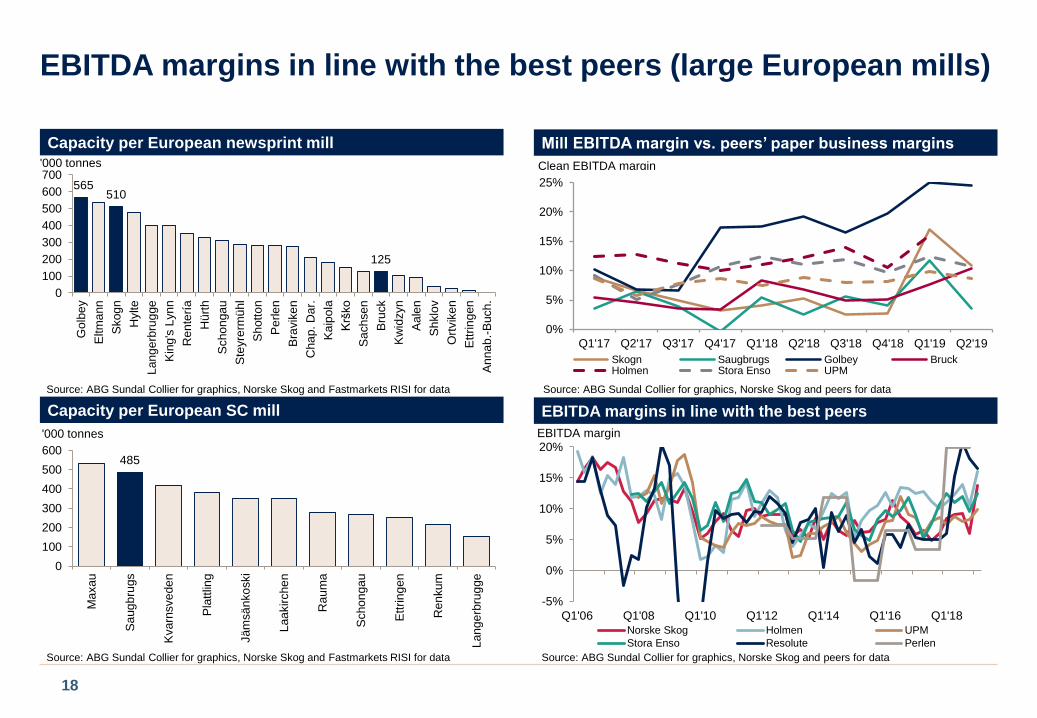
EBITDA margins in line with the best peers (large European mills)
18
Capacity per European newsprint mill
Capacity per European SC mill
Mill EBITDA margin vs. peers’ paper business margins
Source: ABG Sundal Collier for graphics, Norske Skog and peers for dataSource: ABG Sundal Collier for graphics, Norske Skog and Fastmarkets RISI for data
Source: ABG Sundal Collier for graphics, Norske Skog and peers for dataSource: ABG Sundal Collier for graphics, Norske Skog and Fastmarkets RISI for data
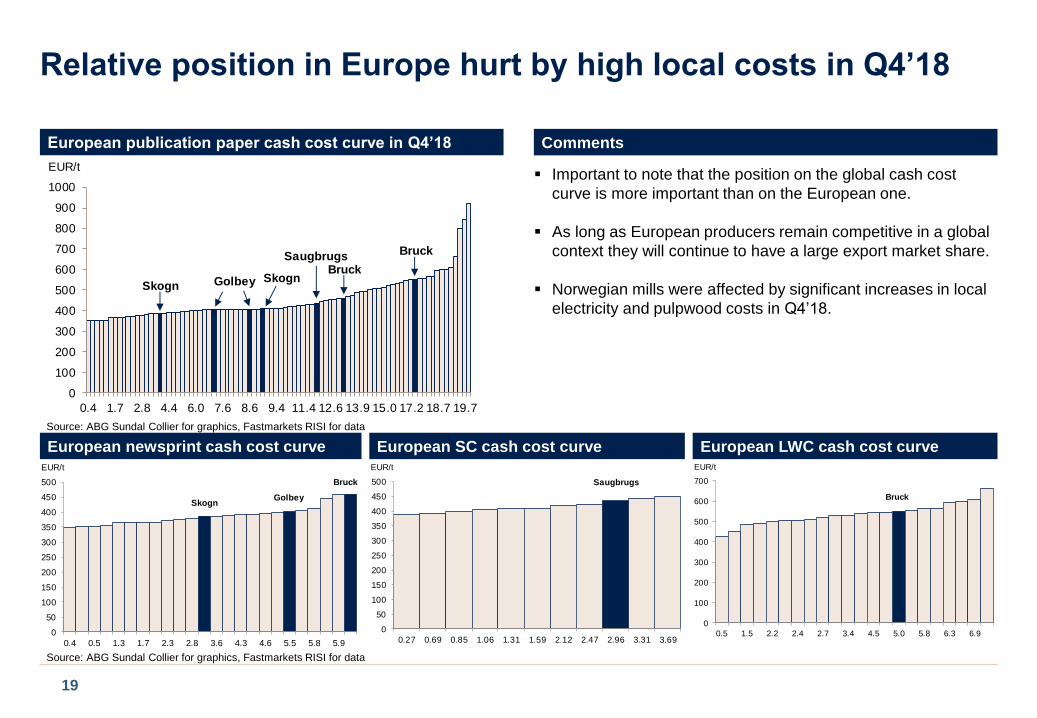
Relative position in Europe hurt by high local costs in Q4’18
19
European publication paper cash cost curve in Q4’18 Comments
European newsprint cash cost curve European SC cash cost curve European LWC cash cost curve
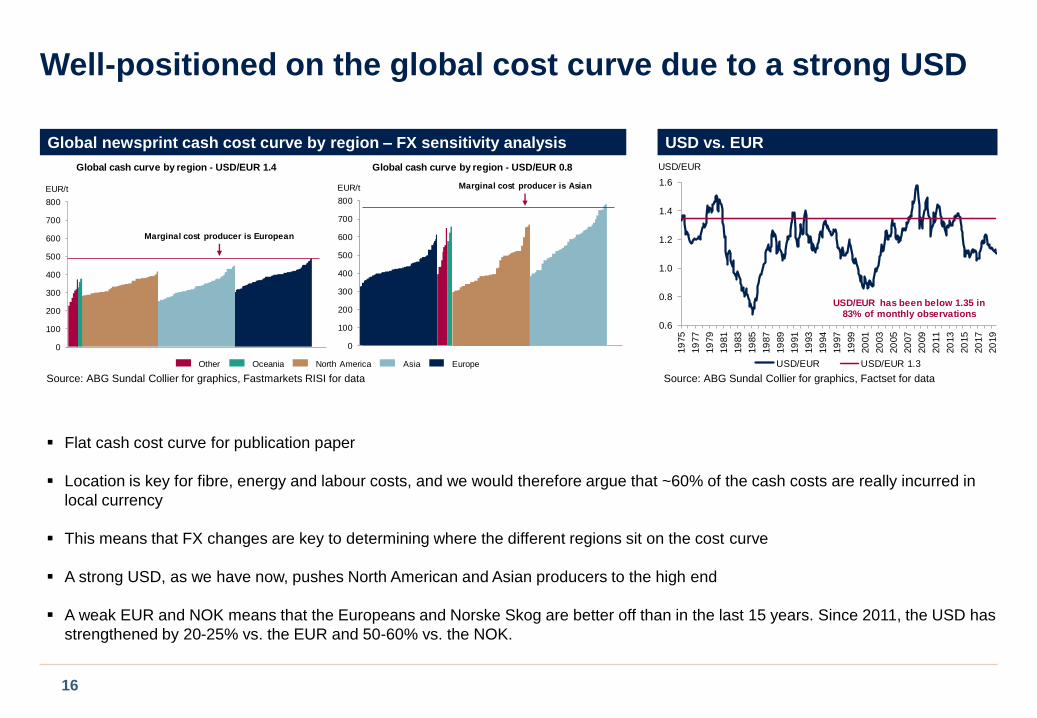
Important to note that the position on the global cash cost
curve is more important than on the European one.
As long as European producers remain competitive in a global
context they will continue to have a large export market share.
Norwegian mills were affected by significant increases in local
electricity and pulpwood costs in Q4’18.
Source: ABG Sundal Collier for graphics, Fastmarkets RISI for data
Source: ABG Sundal Collier for graphics, Fastmarkets RISI for data
23
0
10
20
30
40
50
60
70
80
90
Mill
#1
Mill
#2
Go
lbe
y
Mill
#3
Mill
#4
Mill
#5
Mill
#6
Mill
#7
Mill
#8
Mill
#9
Mill
#1
0
Mill
#1
1
Mill
#1
2
Mill
#1
3
Mill
#1
4
Mill
#1
5
Mill
#1
6
Mill
#1
7
Mill
#1
8
Mill
#1
9
Mill
#2
0
Mill
#2
1
Mill
#2
2
Mill
#2
3
EUR/t
Average delivery cost of EUR 39/t
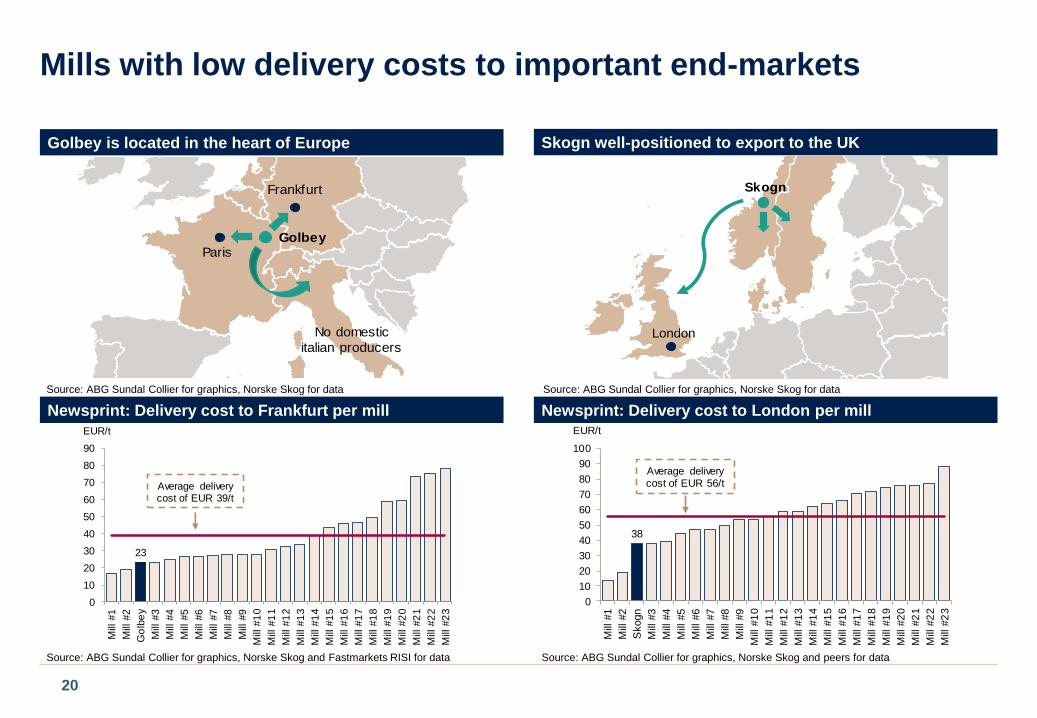
38
0
10
20
30
40
50
60
70
80
90
100
Mill
#1
Mill
#2
Skogn
Mill
#3
Mill
#4
Mill
#5
Mill
#6
Mill
#7
Mill
#8
Mill
#9
Mill
#1
0
Mill
#1
1
Mill
#1
2
Mill
#1
3
Mill
#1
4
Mill
#1
5
Mill
#1
6
Mill
#1
7
Mill
#1
8
Mill
#1
9
Mill
#2
0
Mill
#2
1
Mill
#2
2
Mill
#2
3
EUR/t
Average delivery cost of EUR 56/t
Mills with low delivery costs to important end-markets
20
Skogn well-positioned to export to the UKGolbey is located in the heart of Europe
Paris
Frankfurt
Golbey
No domestic
italian producers
Newsprint: Delivery cost to Frankfurt per mill
Source: ABG Sundal Collier for graphics, Norske Skog for dataSource: ABG Sundal Collier for graphics, Norske Skog for data
Source: ABG Sundal Collier for graphics, Norske Skog and peers for dataSource: ABG Sundal Collier for graphics, Norske Skog and Fastmarkets RISI for data
This material has been prepared by ABG Sundal Collier ASA, or an affiliate thereof ("ABGSC").
This material is for distribution only under such circumstances as may be permitted by applicable law. It has no regard to the specific investment objectives, financial
situation or particular needs of any recipient. It is published solely for informational purposes and is not to be construed as a solicitation or an offer to buy or sell any
securities or related financial instruments. No representation or warranty, either expressed or implied, is provided in relat ion to the accuracy, completeness or
reliability of the information contained herein, nor is it intended to be a complete statement or summary of the securities, markets or developments referred to in the
materials. It should not be regarded by recipients as a substitute for the exercise of their own judgement. Any opinions expressed in this material are subject to
change without notice and may differ or be contrary to opinions expressed by other business areas or groups of ABGSC as a result of using different assumptions
and criteria. ABGSC is under no obligation to update or keep current the information contained herein. ABGSC, its directors, officers and employees' or clients may
have or have had interests or long or short positions in the securities or other financial instruments referred to herein and may at any time make purchases and/or
sales in them as principal or agent. ABGSC may act or have acted as market-maker in the securities or other financial instruments discussed in this material.
Furthermore, ABGSC may have or have had a relationship with or may provide or has provided investment banking, capital markets and/or other financial services to
the relevant companies. Neither ABGSC nor any of its affiliates, nor any of ABGSC' or any of its affiliates, directors, employees or agents accepts any liability for any
loss or damage arising out of the use of all or any part of this material.