Abstract—Geometrical changes can improve stiffness substantially. The project S3 – Safety Slim Shoe presents the potential to reduce the weight in safety toe cap components combining a new geometric redesign deeply associated to local stiffeners to realize the full potential of AHSS – Advanced High Strength Steels. The investigation aimed to examine the potential energy absorption capacity for a substantial thickness reduction of slim toe cap models. In this paper the normative quasi-static compression test in the context of the experimental validation of the two last and approved prototype models were focused. A non-linear FEA - Finite Element Analysis of the elasto-plastic deformation mode was performed, and several numerical parameters such as: hardening effects of extrapolated True-Stress-Strain material curves and simulation convergence conditions were carried out. Experimental results of the toe cap deformation behavior confront a weight saving range of over 40%, compared with the original steel toe cap. Index Terms—AHSS, FEA, local stiffening, toe cap. I. INTRODUCTION The safety footwear, in the context of the global evolution of footwear, has adopted creative and different orientations. Particularly, as an active element in the prevention of accidents fitted in PPE - Personal Protective Equipment, it is appropriate that its optimization solutions amplify the market targets, mainly combining ergonomic aspects, biological and mechanical features since its conception. The toe cap is the main component for its weight contribution, approx. 35% of total weight for each safety footwear model, and due normative context demands with high deformation resistance and impact loading [1]. Currently the toe cap protection takes a subdivided position on design selection and materials, with a clear definition of two distinctive conception trends: metallic and non-metallic models. If on one hand the metallic models, especially high carbon steels with Heat Treatment processes, emphasize the security concept by the implicit mechanical strength performance, on the other hand, the weight of these solutions is a disadvantage compared to the metal-free solutions, and relegates the first one for outdated and heavier footwear concept. The non-metallic solutions with higher trend effects in the global market call on low density materials such as: reinforced Polyester composites with glass fiber, HDPE - High Strength Polyethylene, and several advanced developments in the optimization of energy Manuscript received September 25, 2013; revised January 2, 2014. The authors are with the Centre for Mechanical and Materials Technologies – CT2M, Department of Mechanical Engineering, University of Minho, 4800 – 058, Guimarães, Portugal (e-mail: {sergio.costa, jpmas, peixinho}@dem.uminho.pt). absorption properties [2]-[9]. These preceding solutions are currently lighter than referenced steel toe caps, achieving approx. 40% of weight decrease [10]-[13]. Despite of these composite and hybrid material solutions, its main disadvantage is still committed to the mechanical strength performance, when compared to the steel toe caps, requiring a larger volume concept (to counterpoise higher rates of deformation) and in several ways that affects the conception of the main integrant parts. Both distinguished models and the ultimate S3 prototype are shown in Fig. 1. Fig. 1. Toe cap models with equivalent size: original steel toe cap, composite toe cap and S3 Final model prototype. The research Project S3 – Safety Slim Shoe aims to complement the properties of the two referenced solutions, promoting the industrial development of a brand new ultimate toe cap solution. A substantial reduction of weight due the thickness optimization, and lower volume rates compared with the polymeric solutions are goals for the framework. In this paper, the contribution of the parameters under study for the energy absorption optimization was focused on the elasto-plastic behavior to quasi-static compression tests. In this context, the current progress of the project S3 brought here the two latest and approved toe cap prototype models, the S3 Stage II model and the Final model (with specific corrections for the complementary dynamic normative test), with thickness combinations of 1.2 and 1.1mm. This study presents a FEA to compare among the performance achieved with these models and the original reference with 1.9mm thickness, concerning static stiffness values duly calculated in plastic domain. The opportunity to evaluate some critical parameters related to the numerical simulation of a particular case study with complex geometric design was also covered. Experimental results were briefly attempt. II. QUASI-STATIC COMPRESSION TEST The European Standard requires the high performance level of the toe cap components before being placed into the footwear product in the normative context of EN 12568:2010 [1]. Fig. 2a) represents the normative test used in this study with the schematic configurations and the relative position of the test specimen. The deformation mode of a steel alloy, Numerical Simulation of Quasi-Static Compression Behavior of the Toe Cap Component for Safety Footwear Sé rgio L. Costa, João P. Mendonça, and Nuno Peixinho International Journal of Computer Theory and Engineering, Vol. 6, No. 4, August 2014 285 DOI: 10.7763/IJCTE.2014.V6.876
Transcript
Abstract—Geometrical changes can improve stiffness
substantially. The project S3 – Safety Slim Shoe presents the
potential to reduce the weight in safety toe cap components
combining a new geometric redesign deeply associated to local
stiffeners to realize the full potential of AHSS – Advanced High
Strength Steels. The investigation aimed to examine the
potential energy absorption capacity for a substantial thickness
reduction of slim toe cap models. In this paper the normative
quasi-static compression test in the context of the experimental
validation of the two last and approved prototype models were
focused. A non-linear FEA - Finite Element Analysis of the
elasto-plastic deformation mode was performed, and several
numerical parameters such as: hardening effects of
extrapolated True-Stress-Strain material curves and simulation
convergence conditions were carried out. Experimental results
of the toe cap deformation behavior confront a weight saving
range of over 40%, compared with the original steel toe cap.
Index Terms—AHSS, FEA, local stiffening, toe cap.
I. INTRODUCTION
The safety footwear, in the context of the global evolution
of footwear, has adopted creative and different orientations.
Particularly, as an active element in the prevention of
accidents fitted in PPE - Personal Protective Equipment, it is
appropriate that its optimization solutions amplify the market
targets, mainly combining ergonomic aspects, biological and
mechanical features since its conception. The toe cap is the
main component for its weight contribution, approx. 35% of
total weight for each safety footwear model, and due
normative context demands with high deformation resistance
and impact loading [1]. Currently the toe cap protection takes
a subdivided position on design selection and materials, with
a clear definition of two distinctive conception trends:
metallic and non-metallic models. If on one hand the metallic
models, especially high carbon steels with Heat Treatment
processes, emphasize the security concept by the implicit
mechanical strength performance, on the other hand, the
weight of these solutions is a disadvantage compared to the
metal-free solutions, and relegates the first one for outdated
and heavier footwear concept. The non-metallic solutions
with higher trend effects in the global market call on low
density materials such as: reinforced Polyester composites
with glass fiber, HDPE - High Strength Polyethylene, and
several advanced developments in the optimization of energy
Manuscript received September 25, 2013; revised January 2, 2014. The authors are with the Centre for Mechanical and Materials
Technologies – CT2M, Department of Mechanical Engineering, University
of Minho, 4800 – 058, Guimarães, Portugal (e-mail: {sergio.costa, jpmas, peixinho}@dem.uminho.pt).
absorption properties [2]-[9]. These preceding solutions are
currently lighter than referenced steel toe caps, achieving
approx. 40% of weight decrease [10]-[13]. Despite of these
composite and hybrid material solutions, its main
disadvantage is still committed to the mechanical strength
performance, when compared to the steel toe caps, requiring
a larger volume concept (to counterpoise higher rates of
deformation) and in several ways that affects the conception
of the main integrant parts. Both distinguished models and
the ultimate S3 prototype are shown in Fig. 1.
Fig. 1. Toe cap models with equivalent size: original steel toe cap, composite
toe cap and S3 Final model prototype.
The research Project S3 – Safety Slim Shoe aims to
complement the properties of the two referenced solutions,
promoting the industrial development of a brand new
ultimate toe cap solution. A substantial reduction of weight
due the thickness optimization, and lower volume rates
compared with the polymeric solutions are goals for the
framework.
In this paper, the contribution of the parameters under
study for the energy absorption optimization was focused on
the elasto-plastic behavior to quasi-static compression tests.
In this context, the current progress of the project S3 brought
here the two latest and approved toe cap prototype models,
the S3 Stage II model and the Final model (with specific
corrections for the complementary dynamic normative test),
with thickness combinations of 1.2 and 1.1mm. This study
presents a FEA to compare among the performance achieved
with these models and the original reference with 1.9mm
in plastic domain. The opportunity to evaluate some critical
parameters related to the numerical simulation of a particular
case study with complex geometric design was also covered.
Experimental results were briefly attempt.
II. QUASI-STATIC COMPRESSION TEST
The European Standard requires the high performance
level of the toe cap components before being placed into the
footwear product in the normative context of EN 12568:2010
[1]. Fig. 2a) represents the normative test used in this study
with the schematic configurations and the relative position of
the test specimen. The deformation mode of a steel alloy,
Numerical Simulation of Quasi-Static Compression
Behavior of the Toe Cap Component for Safety Footwear
Sérgio L. Costa, João P. Mendonça, and Nuno Peixinho
International Journal of Computer Theory and Engineering, Vol. 6, No. 4, August 2014
285DOI: 10.7763/IJCTE.2014.V6.876
resulting from the normative quasi-static compression test,
reveals a standard curve shown in Fig. 2b).
Fig. 2. Normative context: a) Apparatus for compression test. Key: (1) Upper platen, (2) Toe cap, (3) Modelling clay cylinder, (4) Lower platen [1]; b)
Load vs. displacement typical curve for steel toe cap under static
compression test [1].
The test method consists in the compression of the test
specimen by a controlled computed dynamometer to a load of
either (15 ± 0.1) kN for toe caps to be used for safety
footwear class, by moving the upper platen at a speed of (5 ±
2) mm/min [1]. When toe caps are tested in accordance with
the method described, the final clearance under the toe cap
shall not be less than the appropriate value for the size of the
model [1].
The straight line (1) shown in Fig. 2b) matches to the
elastic deformation domain of the material, and can be
defined by a stiffness constant, equal to the slope of the
respective line. The straight line (2) corresponds to the plastic
deformation, after forming the 1st plastic hinge. This line can
also be defined by a constant stiffness equivalent to its slope.
This means that the formation of the second and last plastic
hinge occurs to the higher load value when the test ends at 15
kN. The large reduction of thickness by upgrading the toe cap
model and consequent static stiffness loss, an important
phenomenon into the continuous loading application, may
lead to intermediate hinges occurring in the elasto-plastic
deformation and cause a collapse mode. In this case, the
performance of the deformation resistance is compromised.
III. DESIGN PARAMETERS
A. Local Stiffening
From a design point of view, the high stresses and low
thickness put emphasis on finding a solution that uses the full
potential of the material. Design challenges for a new toe cap
model have included some complex phenomena’s such as
structural stiffness and, in this case, the quasi-static
deformation resistance. Thus, local buckling may occur when
reducing thickness during an upgrading process. This is
initially an elastic instability phenomenon, where local
buckles form at stresses below the plastic limit and in doing
so, do not use the full potential of the material (further, it can
be observed in the quasi-static compression test at the first
plastic hinge formation). Introducing local stiffeners to
reduce the increased slenderness and improve the constraint
of the edges helped to converge the potential of AHSS
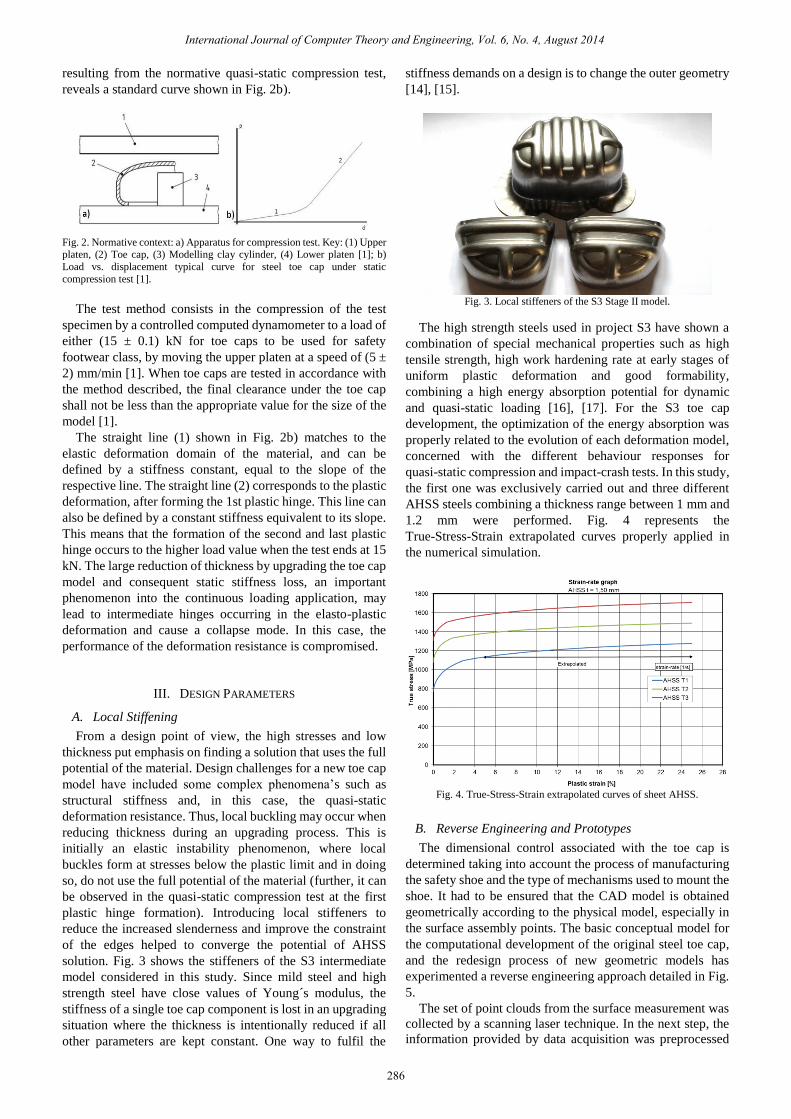
solution. Fig. 3 shows the stiffeners of the S3 intermediate
model considered in this study. Since mild steel and high
strength steel have close values of Young s modulus, the
stiffness of a single toe cap component is lost in an upgrading
situation where the thickness is intentionally reduced if all
other parameters are kept constant. One way to fulfil the
stiffness demands on a design is to change the outer geometry
[14], [15].
Fig. 3. Local stiffeners of the S3 Stage II model.
The high strength steels used in project S3 have shown a
combination of special mechanical properties such as high
tensile strength, high work hardening rate at early stages of
uniform plastic deformation and good formability,
combining a high energy absorption potential for dynamic
and quasi-static loading [16], [17]. For the S3 toe cap
development, the optimization of the energy absorption was
properly related to the evolution of each deformation model,
concerned with the different behaviour responses for
quasi-static compression and impact-crash tests. In this study,
the first one was exclusively carried out and three different
AHSS steels combining a thickness range between 1 mm and
1.2 mm were performed. Fig. 4 represents the
True-Stress-Strain extrapolated curves properly applied in
the numerical simulation.
Fig. 4. True-Stress-Strain extrapolated curves of sheet AHSS.
B. Reverse Engineering and Prototypes
The dimensional control associated with the toe cap is
determined taking into account the process of manufacturing
the safety shoe and the type of mechanisms used to mount the
shoe. It had to be ensured that the CAD model is obtained
geometrically according to the physical model, especially in
the surface assembly points. The basic conceptual model for
the computational development of the original steel toe cap,
and the redesign process of new geometric models has
experimented a reverse engineering approach detailed in Fig.
5.
The set of point clouds from the surface measurement was
collected by a scanning laser technique. In the next step, the
information provided by data acquisition was preprocessed
International Journal of Computer Theory and Engineering, Vol. 6, No. 4, August 2014
286
with an auxiliary advanced algorithm in Matlab® to improve
native geometrical entities for the basis surface construction.
Then, the optimization has passed through the re-design
process with the development of several geometrical changes.
Local stiffeners and other features were implemented into
powerful surface modeling tools in CATIA® [18]. Fig. 6
shows the original steel toe cap and the S3 Final model
prototype taken in this study.
Fig. 5. Reverse engineering methodology for Project S3 [18].
Fig. 6. Toe cap models: a) original steel toe cap and b) S3 Final prototype.
IV. NUMERICAL SIMULATION
The FEA - Finite Element Analysis of toe cap models on
non-linear study made for static load conditions was
performed with an implicit FE code, ANSYS (Workbench).
Static compression tests were simulated for each respective
combination of study parameters: thickness, material and
geometric model. Fig. 7 shows the finite element
environment with the upper platen of the load cell test in
accordance with the normative method previously described.
The boundary conditions were defined with axial loading
application on the upper platen, and the fixed support in the
tab region was reproduced. An average load value of 4kN to
cover the elastic domain behavior of the toe cap models
response was applied. The force application body was
considered rigid and without analysis settings in order to
transfer the entire energy recording to the toe cap component.
Remote displacements of the upper platen and other
dependent surfaces were added with the purpose of
constraining the load body, in rotation and other directional
components, to promote a guided displacement evolution.
The level of plastic deformation had increased following the
first plastic hinge formation and brought some simulation
challenges. Higher deformation rates leads to force
convergence errors in the increment model of the
deformation analysis and consequently the interruption of the
numerical progress [19].
Fig. 7. FEM of the quasi-static analysis for the S3 Final model. ANSYS ®.
A prior attention target in the numerical simulation was the
body’s connection with the contact part, between the virtual
toe cap model and the pressure plate above. The area of
contact, ideally converged to a contact point border between
the bodies according to the normative test method, brought
here some simulation improvement needs. In this context,
small contact extensions were attempt and the friction
coefficient was also an influent parameter. For a range value
between 0.32 and 0.74 the evaluation was 0.54 [19]. The
mesh element generation and the type of contact were applied
differentially and have been under convergence studies.
Nonlinear solution is sensitive to mesh by the number of
elements and the respective method (shape of elements).
Mesh quality has shown not only a matter of accuracy and
runtime for the solution but also a matter of success or failure.
In general, hexahedra are more efficient than tetrahedra
elements [19]. In this case, simulation models had considered
hexahedra as many as possible, by the geometric complexity,
performing the Hex-Dominant method. Fig. 8 shows the
comparison of the mesh parameters. As expected, the
Higher-Order Hexahedra elements (element midside nodes
kept) performed better results for a fine mesh resulting on
higher values of directional deformation. Thus, this method
and an element size control stabilized between 2 and 2.3 mm
were selected to the main bodies (56.149 nodes).
Nevertheless, the inevitable progress of the complex plastic
deformation under harder and continuous loading conditions
with micro cracks initiation and fracture phenomenon
promoted at the end of the material behavior has been
succeed up to 10 kN. Although the interruption of the implicit
numerical simulation ocurred, it was important to perform the
evaluative static deformation response to confront different
combinations of geometric models and AHSS materials
International Journal of Computer Theory and Engineering, Vol. 6, No. 4, August 2014
287
converging on the best design changes. The plastic hinges
associated to the static stiffness and deformation models were
rated.
Fig. 8. Mesh convergence analysis for the S3 Stage II model performance.
Fig. 9. Stress distributions – elastic deformation of AHSS T2 1.2mm thick models from FEA for 2500 N: a) original steel toe cap, c) S3 Stage II and e)
S3 Final. Stress distributions – plastic deformation for 10kN: b) original steel
toe cap, d) S3 Stage II and f) S3 Final. ANSYS® Environment.
The numerical simulation program was applied to the new
geometric models with the three abovementioned AHSS and
conjugating in thicknesses between 1.0 mm and 1.2 mm.
Isotropic elasticity and multi-linear isotropic hardening
parameters were defined. Potential solution models were
compared with the original steel toe cap model. Fig. 9 shows
representative results of the quasi-static FEA analysis for the
new S3 models with the combination of 1.2 mm thickness
and AHSS T2 material, and the original steel toe cap model
of 1.9 mm thickness for the C65 Heat Treated alloy.
Compressive loading conditions of 10 kN were performed for
the S3 Stage II, S3 Final and the original steel toe cap model.
Stress concentrations occurred in the contact region with the
upper platen point inducing higher force moments on the top
toe cap surface, which affected much the overall deflection
and damage of toe cap. For these load values it can be
observed a slightly different mode of deformation for the
proposed models. The S3 Stage II and the Final geometries
provided more transversal deformation characteristics
instead of the original steel toe cap that promoted a larger
deflection. The results of the static deformation behavior are
plotted in Fig. 10a to compare performances of the S3 Stage
II with the original model, and the comparison between S3
models in Fig 10b).
Table I brings together the first plastic hinge, where the
plastic deformation begun after springback effects that is
much associated to the elastic deformation field, and the last
plastic hinge that the FEA analysis had performed with the
reaction force and the resulting displacement values for each
model. The equivalent stiffness constants of the plastic
deformation behavior were calculated for these points.
Consequently, the performance of the energy absorption was
analyzed.
The numerical simulation was not completed up to 15 kN
as demanded by the normative and experimental context for
any toe cap model, because models required to higher strain
rates have revealed earlier problems associated with the
interruption of the FEA as explained above.
Fig. 10. Numerical results of quasi-static compression tests: a) comparison of S3 Stage II models and the original steel toe cap, b) comparison between
the two S3 models and the original steel toe cap.
From the global numerical results it was found that the S3
Stage II model performed the higher capacity for energy
absorption in the plastic deformation range, reflecting to the
higher value of stiffness constant (Table I). The effect of the
structural shoulder on the toe cap side walls, due to the
increased extension of the lateral ribs, contributes to