87
NUTRITION AND NUTRITION AND CARDIOVASCULAR CARDIOVASCULAR DISEASE DISEASE FRANCES DOOLEY MSN,ANP-C, CDE ADULT NURSE PRACTITIONER CERTIFIED DIABETES EDUCATOR
| Date post: | 25-Dec-2015 |
| Category: |
Documents |
| Upload: | anthony-gallagher |
| View: | 215 times |
| Download: | 1 times |
NUTRITION AND NUTRITION AND CARDIOVASCULAR CARDIOVASCULAR
DISEASEDISEASEFRANCES DOOLEY MSN,ANP-C, CDE
ADULT NURSE PRACTITIONER
CERTIFIED DIABETES EDUCATOR

OBJECTIVESOBJECTIVES
Discuss the Epidemic of Obesity and It’s link to CVD and Diabetes.
Define the Metabolic Syndrome
Review current NCEPIII guidelines for LIPID Management in primary and secondary prevention
Discuss Therapeutic Lifestyle changes and current AHA guidelines for decreasing CVD risk
OBJECTIVESOBJECTIVES
Identify the Role of Essential Fatty Acids-Omega 3 and Omega 6
Review alternative dietary recommendationsLowfat Diets
Low Carbohydrate DietsSouth Beach Atkins Diet
Identify emerging markers linked to the development of CHD.
OBESTIY STATISTICS
Prevalence rates of overweight people have increased 50% in all populations since 1960.
Today 1 in 2 adults and 1 in 4 children are overweight.
Large clinical trials such as Framingham and the Nurses Health study have linked obesity and high fat diets with Cardiovascular risk.
Low-Fat diets became the major emphasis for decreasing CVD risk around the 1960’s.
OBESITY STATISITICS
Americans have decreased fat intake from 42 to 32% of total caloric intake since the 1960’s.
Sugar and refined starches and grains have become the primary source of carbohydrates in the American diet.
Consequently there has been a tremendous increase in type 2 diabetes related to central obesity and insulin resistance.
Health Risks With Morbid Obesity
Diabetes
Heart Disease
Stroke
High Blood Pressure
Gallbladder Disease
Reproductive disorders (obese women have trouble
having children and obese men have reduced sperm
counts)
CONSEQUENCES OF OBESITY ON OUR CONSEQUENCES OF OBESITY ON OUR YOUTHYOUTH
Ten fold increase in Type 2 Diabetes among children and teens since the 1980’s A disease once so rare in youngsters it was previously called adult onset diabetes.
ASSESSING OBESITY IN CLINICAL ASSESSING OBESITY IN CLINICAL PRACTICEPRACTICE
Body Mass Index (BMI) Overweight BMI 25-29.9 Obesity BMI>30 Correlated with Health Risks
Waist Circumference Men >40 IN. Or 1> Waist to Hip Ratio Women>35 IN. Or .8 > Waist to Hip Ratio
Excess fat in the abdomen is an independent predictor of CVD risk
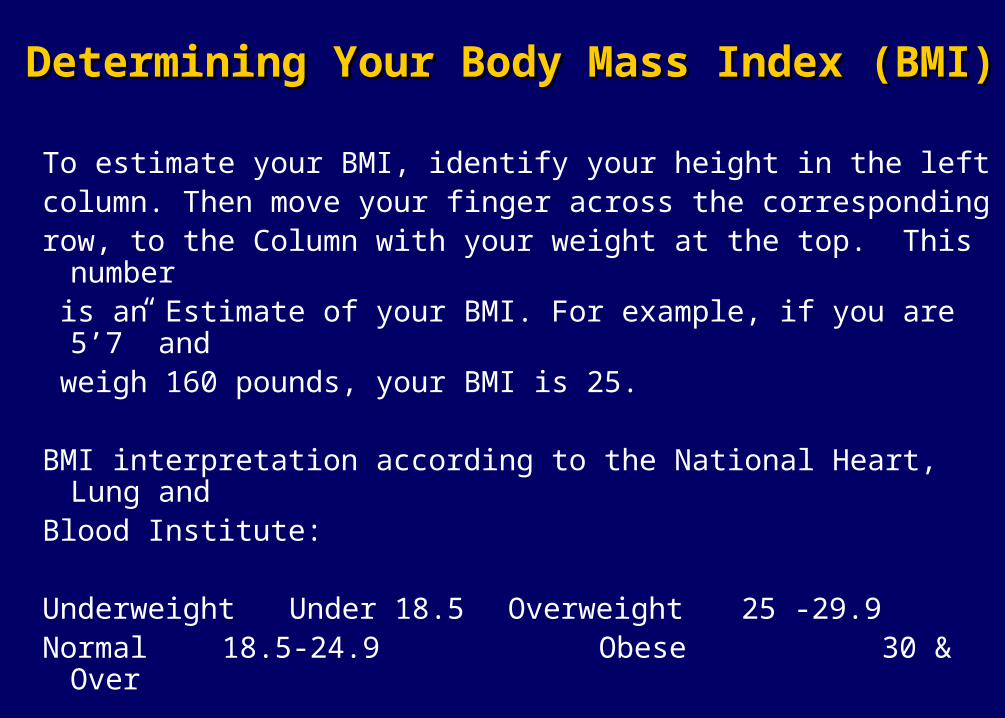
Determining Your Body Mass Index (BMI)Determining Your Body Mass Index (BMI)
To estimate your BMI, identify your height in the left column. Then move your finger across the corresponding row, to the Column with your weight at the top. This number is an Estimate of your BMI. For example, if you are 5’7” and weigh 160 pounds, your BMI is 25.
BMI interpretation according to the National Heart, Lung and Blood Institute:
Underweight Under 18.5 Overweight 25 -29.9Normal 18.5-24.9 Obese 30 & Over

W100 110 120 130 140150 160 170 180 190 200 210
220 230 240 250
H
5'0" 20 21 23 25 27 29 31 33 35 37 39 41 43 45 47 49
5'1" 19 21 23 25 26 28 30 32 34 36 38 40 42 43 45 47
5'2" 18 20 22 24 26 27 29 31 33 35 37 38 40 42 44 46
5'3" 18 19 21 23 25 27 28 30 32 34 35 37 39 40 43 44
5'4" 17 19 21 22 24 26 27 29 31 33 34 36 38 39 41 43
5'5" 17 18 20 22 23 25 27 28 30 32 33 35 37 38 40 42
5'6" 16 18 19 21 23 24 26 27 29 31 32 34 36 37 39 40
5'7" 16 17 19 20 22 23 25 27 28 30 31 33 34 36 38 39
5'8" 15 17 18 20 21 23 24 26 27 29 30 32 33 35 36 38
5'9" 15 16 18 19 21 22 24 25 27 28 30 31 32 34 35 37
5'10" 14 16 17 19 20 22 23 24 26 27 29 30 32 33 34 36
5'11" 14 15 17 18 20 21 22 24 25 26 28 29 31 32 33 35
6'0" 14 15 16 18 19 20 22 23 24 26 27 28 30 31 33 34
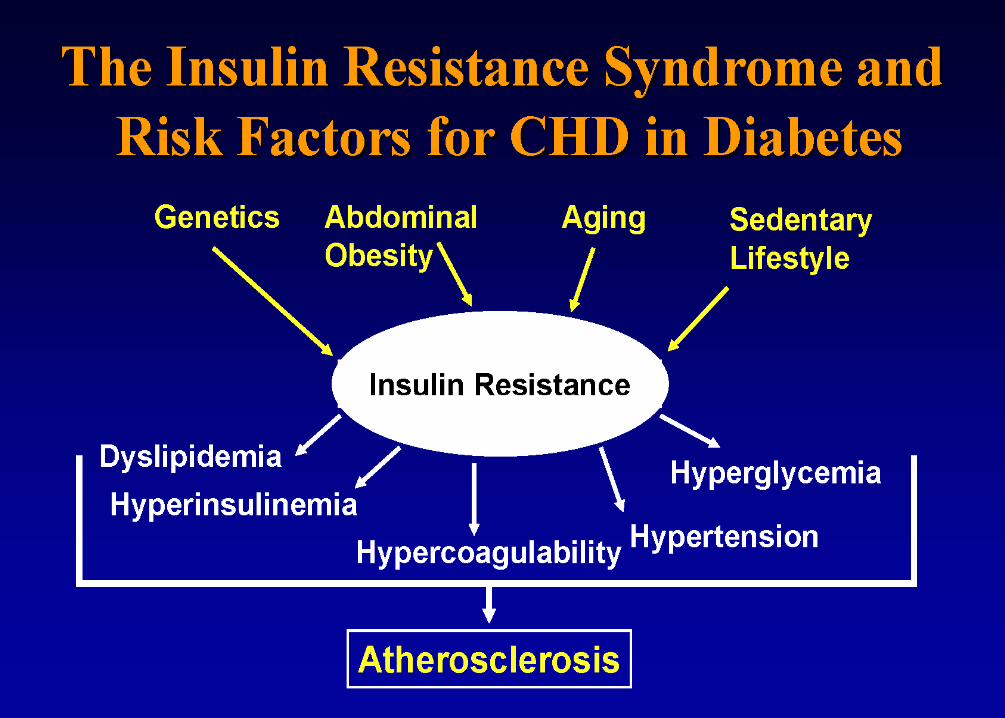
Insulin ResistanceInsulin Resistance
Visceral or Central Obesity is the most prominent
symptom of Insulin Resistance Syndrome – an important
abnormal metabolic process highly associated with
development of CVD
What is Insulin Resistance?What is Insulin Resistance?
“An impaired response of the body to the effects of insulin, including glucose, lipid and protein metabolism”.
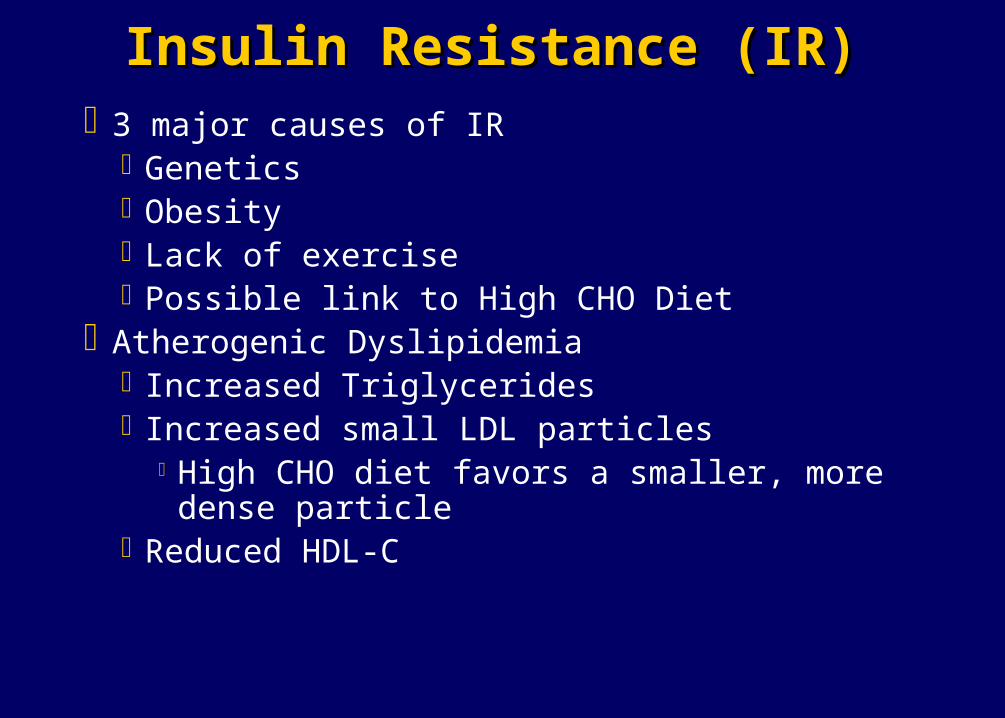
Insulin Resistance (IR)Insulin Resistance (IR)3 major causes of IR
GeneticsObesityLack of exercise Possible link to High CHO Diet
Atherogenic Dyslipidemia Increased Triglycerides Increased small LDL particles
High CHO diet favors a smaller, more dense particleReduced HDL-C
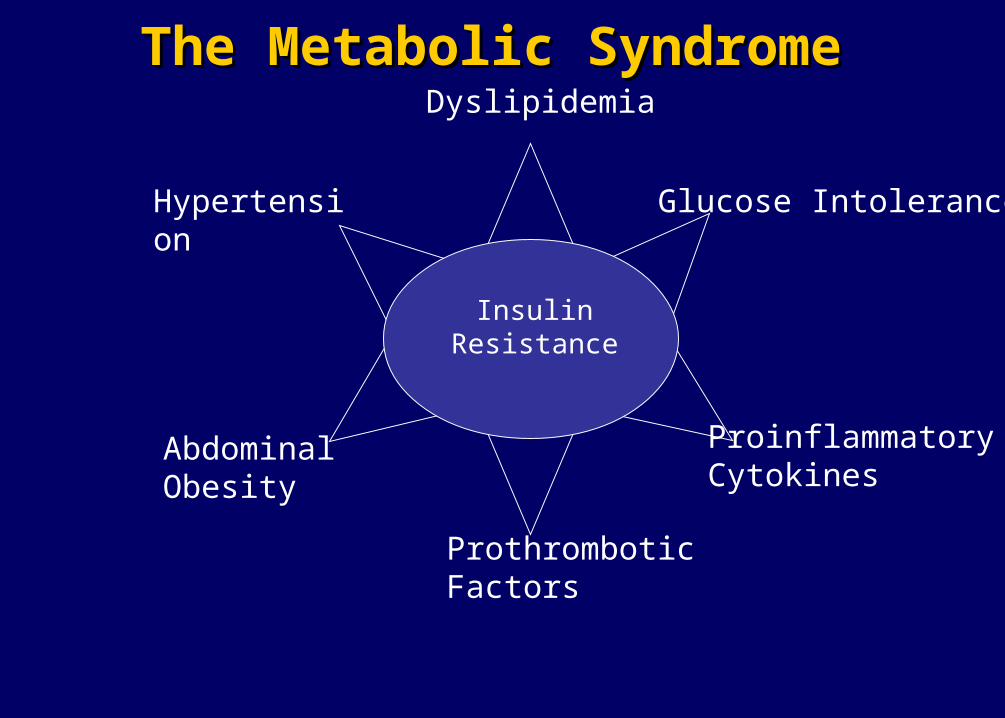
The Metabolic SyndromeThe Metabolic Syndrome
Insulin Resistance
Hypertension
AbdominalObesity
ProthromboticFactors
ProinflammatoryCytokines
Glucose Intolerance
Dyslipidemia

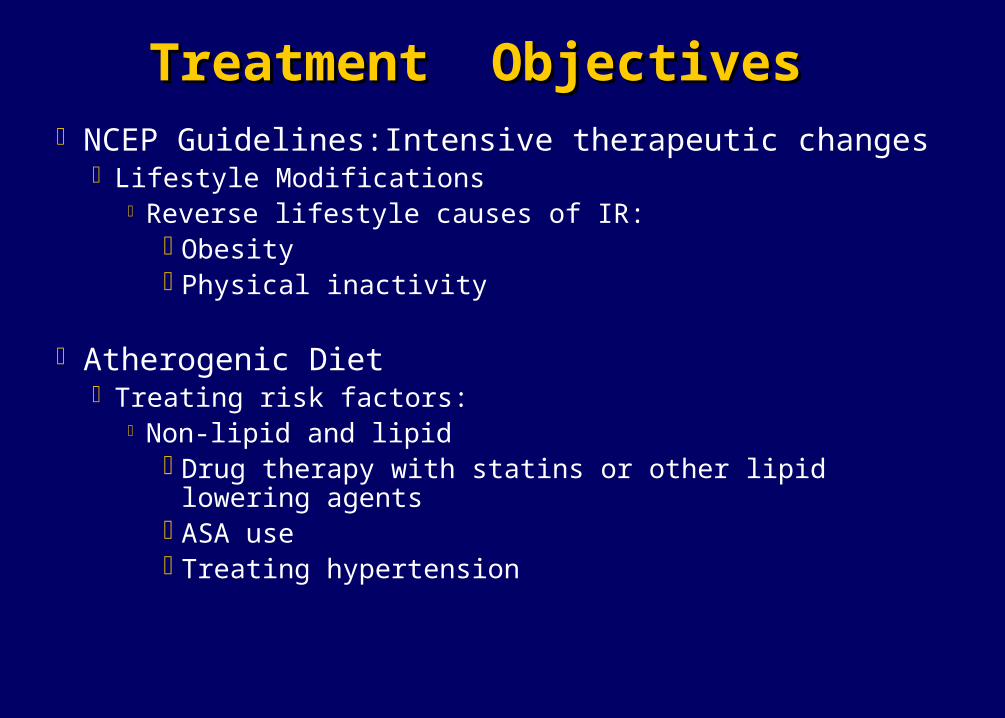
Treatment Objectives Treatment Objectives NCEP Guidelines:Intensive therapeutic changes
Lifestyle Modifications Reverse lifestyle causes of IR:
ObesityPhysical inactivity
Atherogenic Diet Treating risk factors:
Non-lipid and lipidDrug therapy with statins or other lipid lowering agentsASA useTreating hypertension
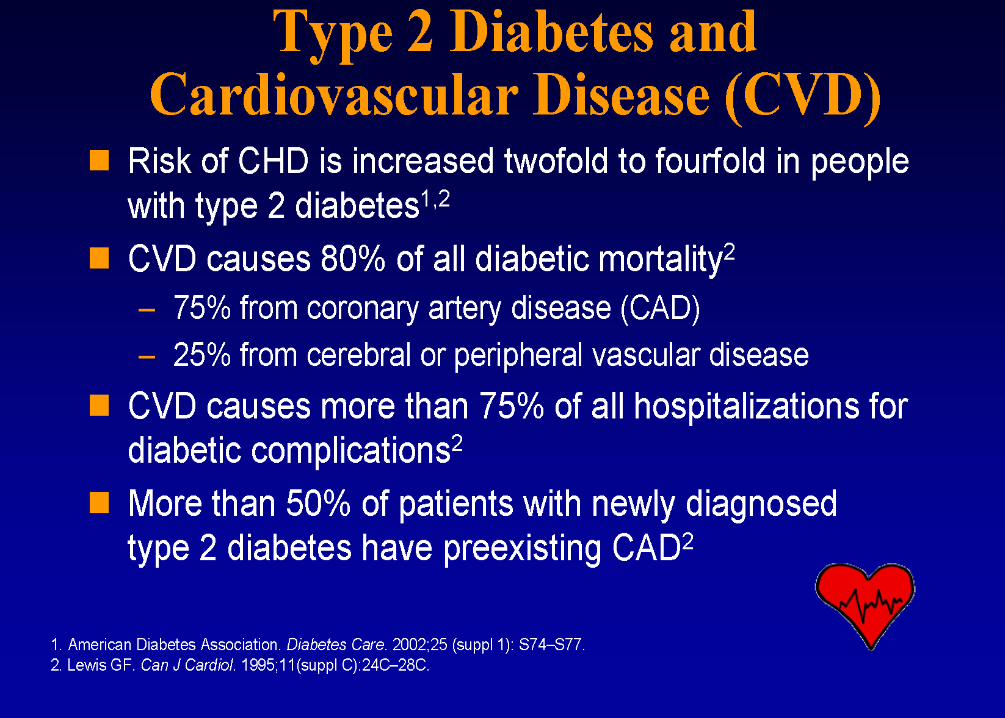
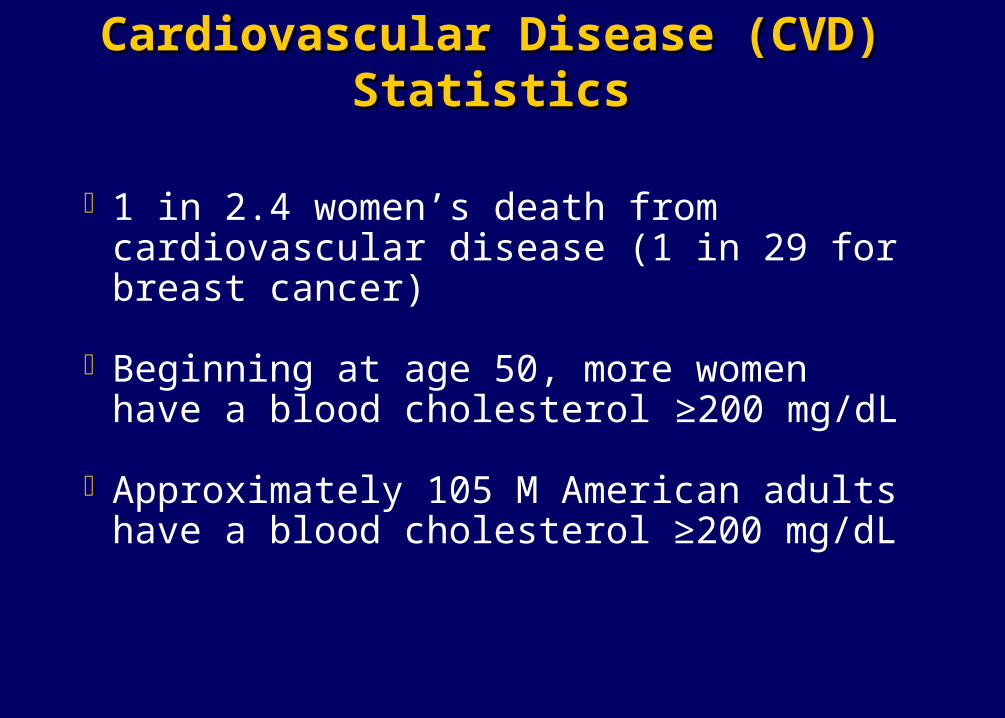
Cardiovascular Disease (CVD) StatisticsCardiovascular Disease (CVD) Statistics
1 in 2.4 women’s death from cardiovascular disease (1 in 29 for breast cancer)
Beginning at age 50, more women have a blood cholesterol ≥200 mg/dL
Approximately 105 M American adults have a blood cholesterol ≥200 mg/dL

NATIONAL CHOLESTEROL NATIONAL CHOLESTEROL EDUCATION PROGRAM (NCEP)EDUCATION PROGRAM (NCEP)
Developed in the 80”s – to develop recommendations for clinical management of lipids
Recommendations have shown definite reductions of 2-3% coronary heart disease for each 1% reduction in LDL cholesterol
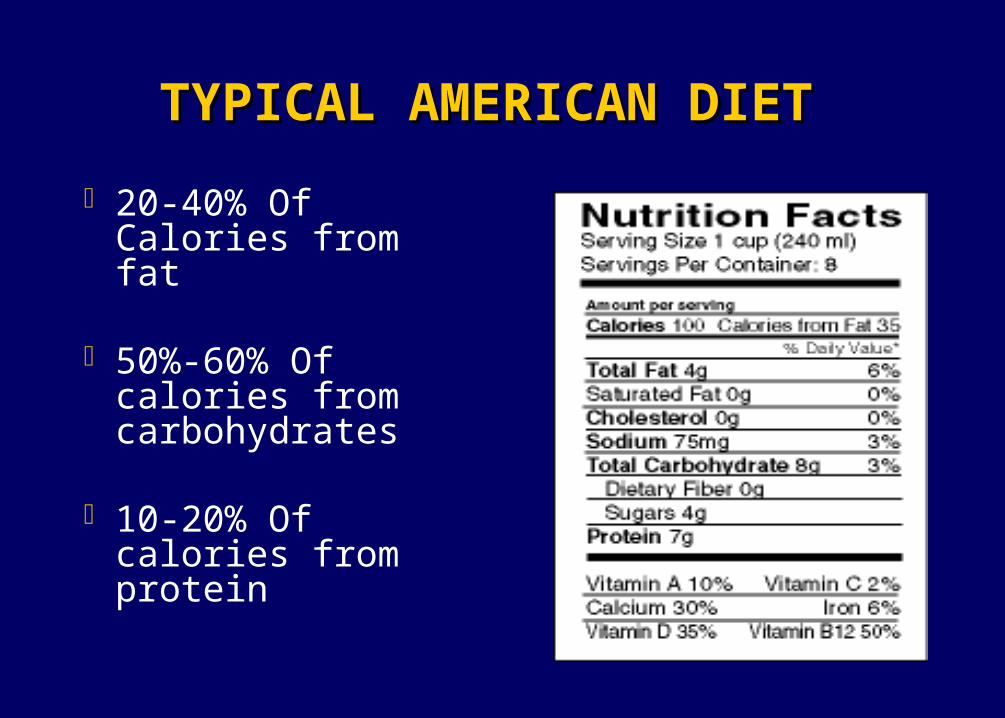
TYPICAL AMERICAN DIETTYPICAL AMERICAN DIET
20-40% Of Calories from fat
50%-60% Of calories from carbohydrates
10-20% Of calories from protein
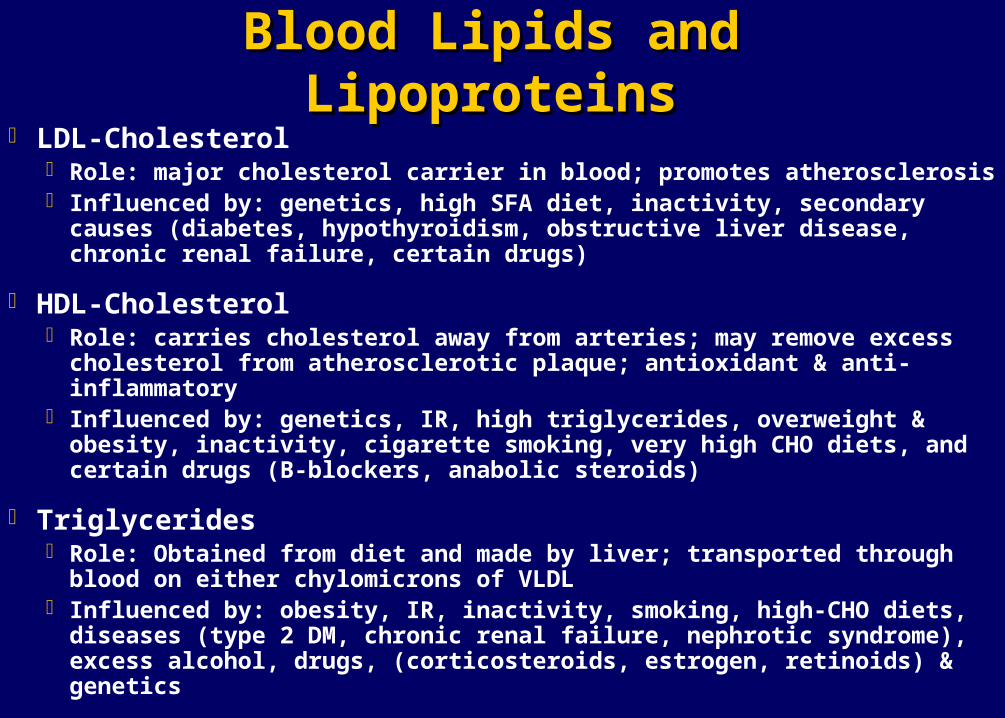
Blood Lipids and LipoproteinsBlood Lipids and Lipoproteins LDL-Cholesterol
Role: major cholesterol carrier in blood; promotes atherosclerosis Influenced by: genetics, high SFA diet, inactivity, secondary causes (diabetes,
hypothyroidism, obstructive liver disease, chronic renal failure, certain drugs)
HDL-Cholesterol Role: carries cholesterol away from arteries; may remove excess cholesterol
from atherosclerotic plaque; antioxidant & anti-inflammatory Influenced by: genetics, IR, high triglycerides, overweight & obesity, inactivity,
cigarette smoking, very high CHO diets, and certain drugs (B-blockers, anabolic steroids)
Triglycerides Role: Obtained from diet and made by liver; transported through blood on
either chylomicrons of VLDL Influenced by: obesity, IR, inactivity, smoking, high-CHO diets, diseases (type 2
DM, chronic renal failure, nephrotic syndrome), excess alcohol, drugs, (corticosteroids, estrogen, retinoids) & genetics
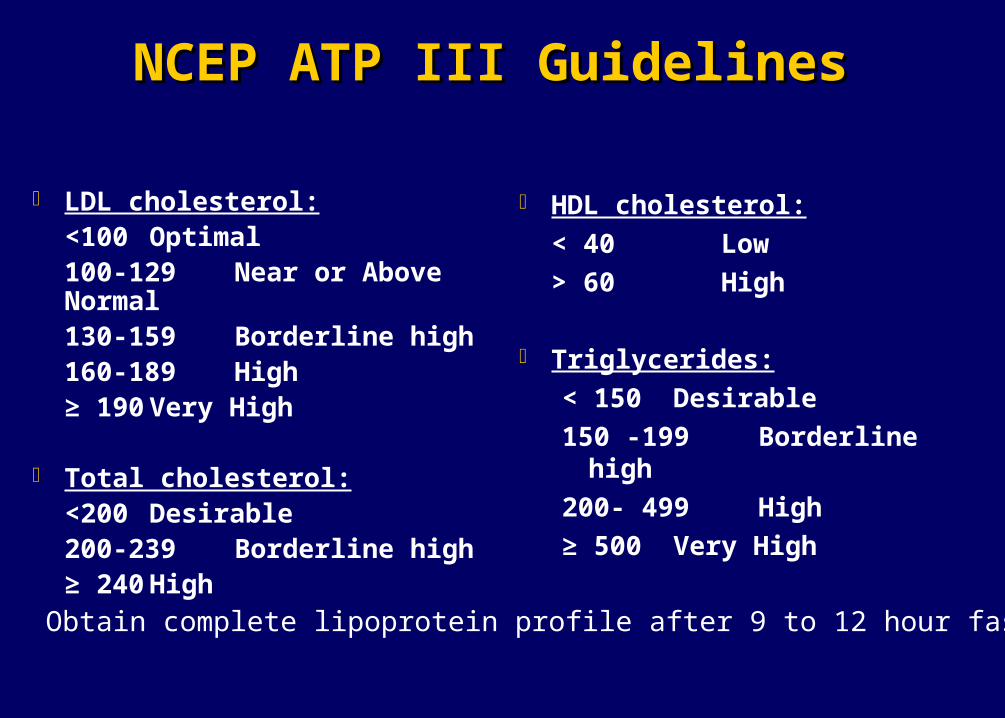
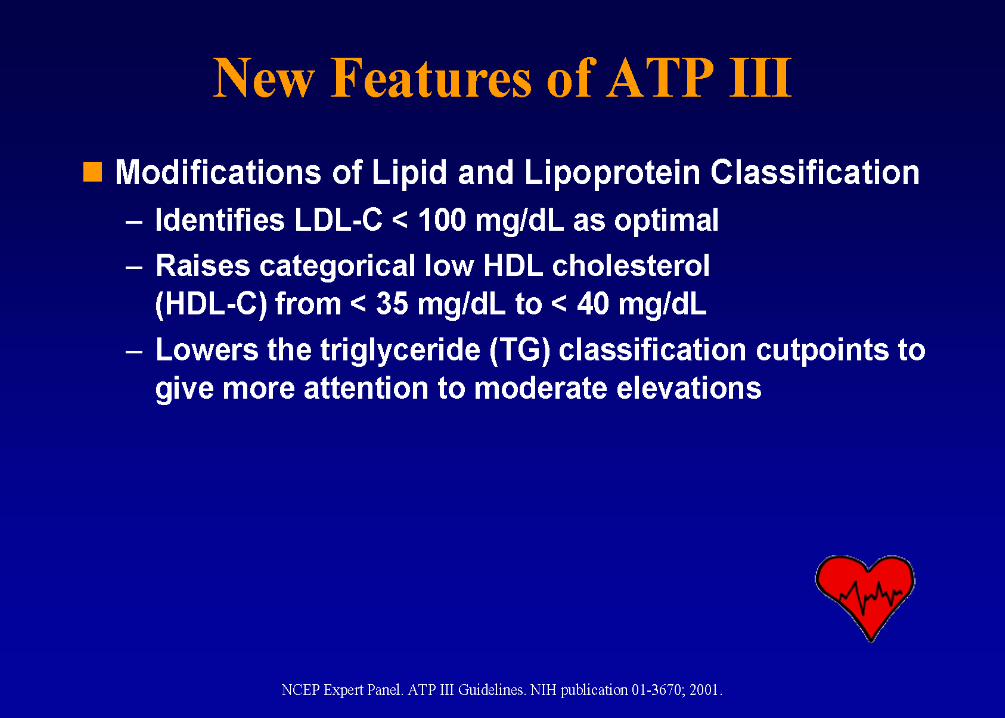
NCEP ATP III GuidelinesNCEP ATP III Guidelines
LDL cholesterol:<100 Optimal100-129 Near or Above Normal130-159 Borderline high160-189 High≥ 190 Very High
Total cholesterol:<200 Desirable200-239 Borderline high≥ 240 High
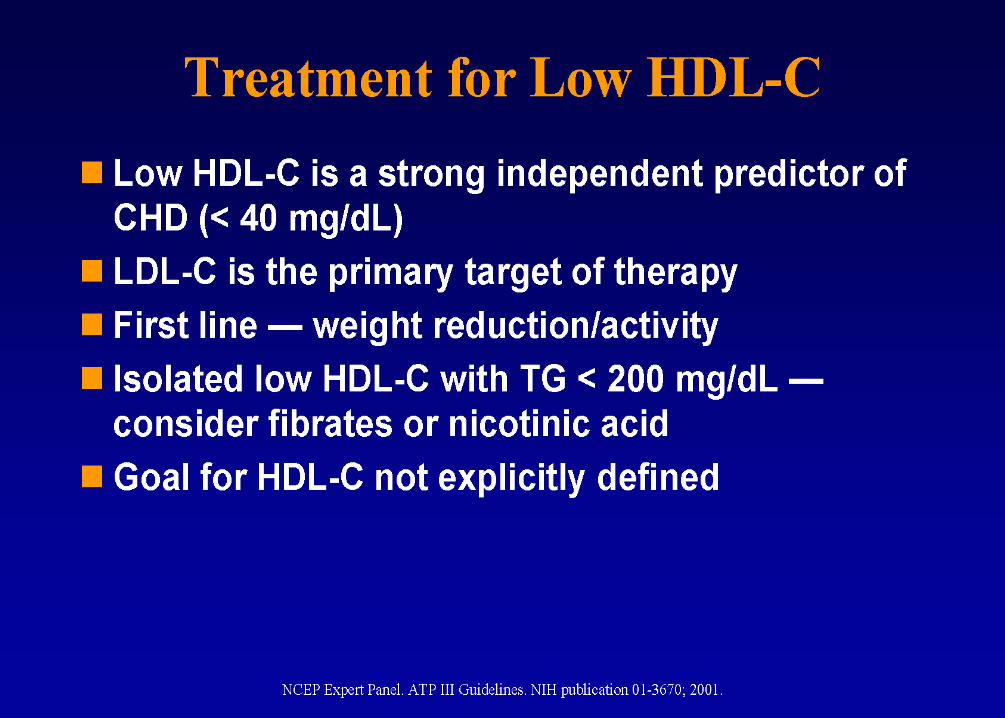
HDL cholesterol:
< 40 Low
> 60 High
Triglycerides:
< 150 Desirable
150 -199 Borderline high
200- 499 High
≥ 500 Very High
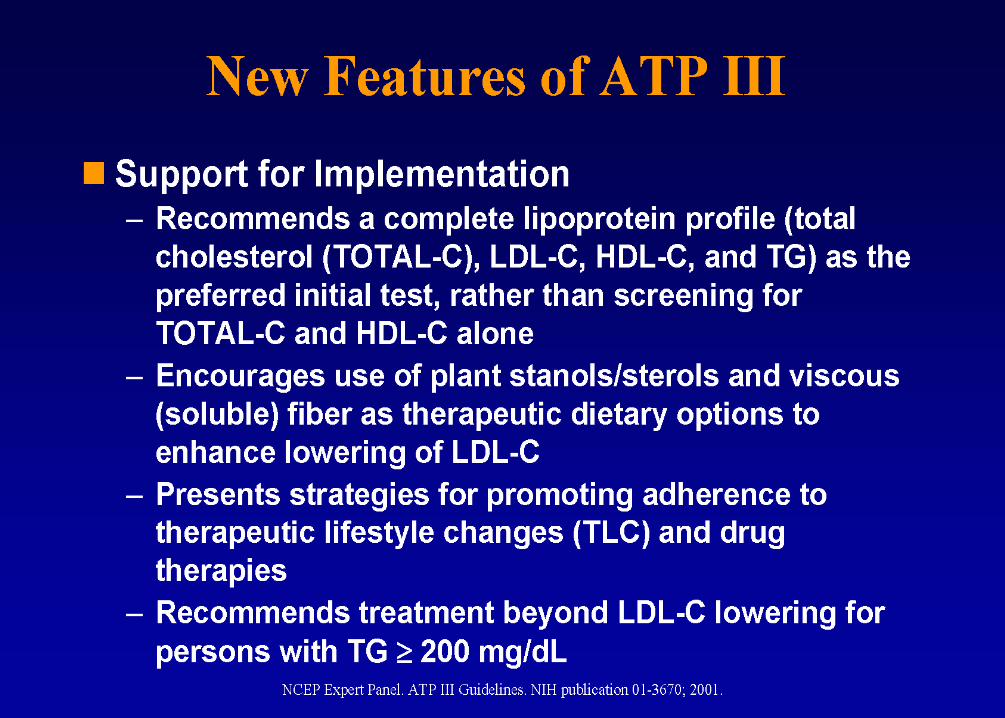
Obtain complete lipoprotein profile after 9 to 12 hour fast
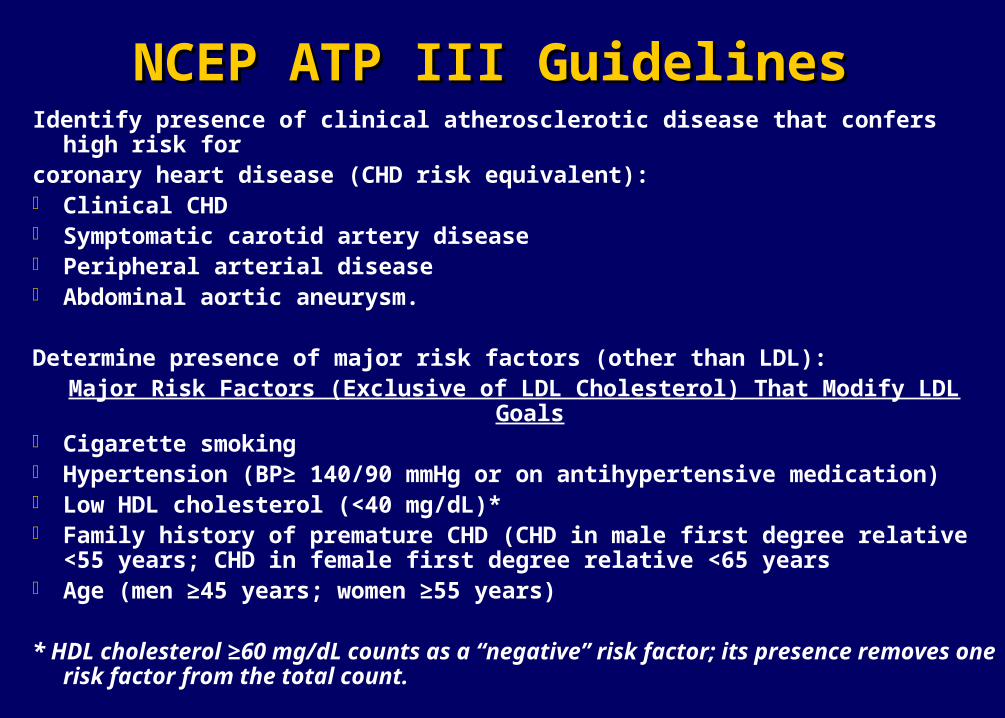
NCEP ATP III GuidelinesNCEP ATP III GuidelinesIdentify presence of clinical atherosclerotic disease that confers high risk for coronary heart disease (CHD risk equivalent): Clinical CHD Symptomatic carotid artery disease Peripheral arterial disease Abdominal aortic aneurysm.
Determine presence of major risk factors (other than LDL):Major Risk Factors (Exclusive of LDL Cholesterol) That Modify LDL Goals
Cigarette smoking Hypertension (BP≥ 140/90 mmHg or on antihypertensive medication) Low HDL cholesterol (<40 mg/dL)* Family history of premature CHD (CHD in male first degree relative <55 years; CHD in
female first degree relative <65 years Age (men ≥45 years; women ≥55 years)
* HDL cholesterol ≥60 mg/dL counts as a “negative” risk factor; its presence removes one risk factor from the total count.
NCEP ATP III GuidelinesNCEP ATP III Guidelines
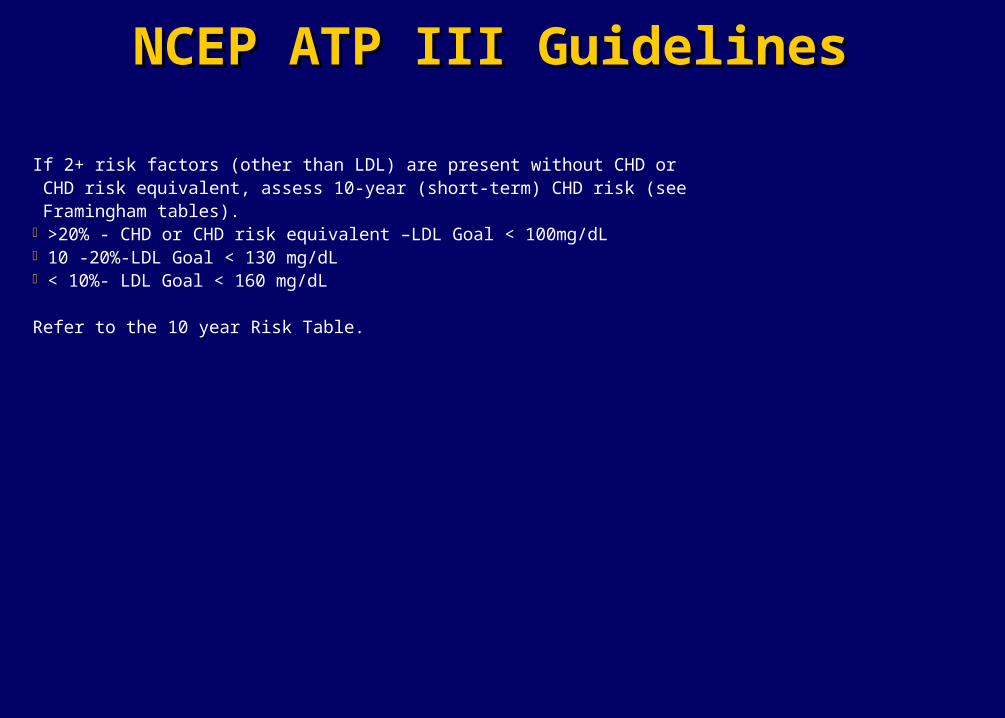
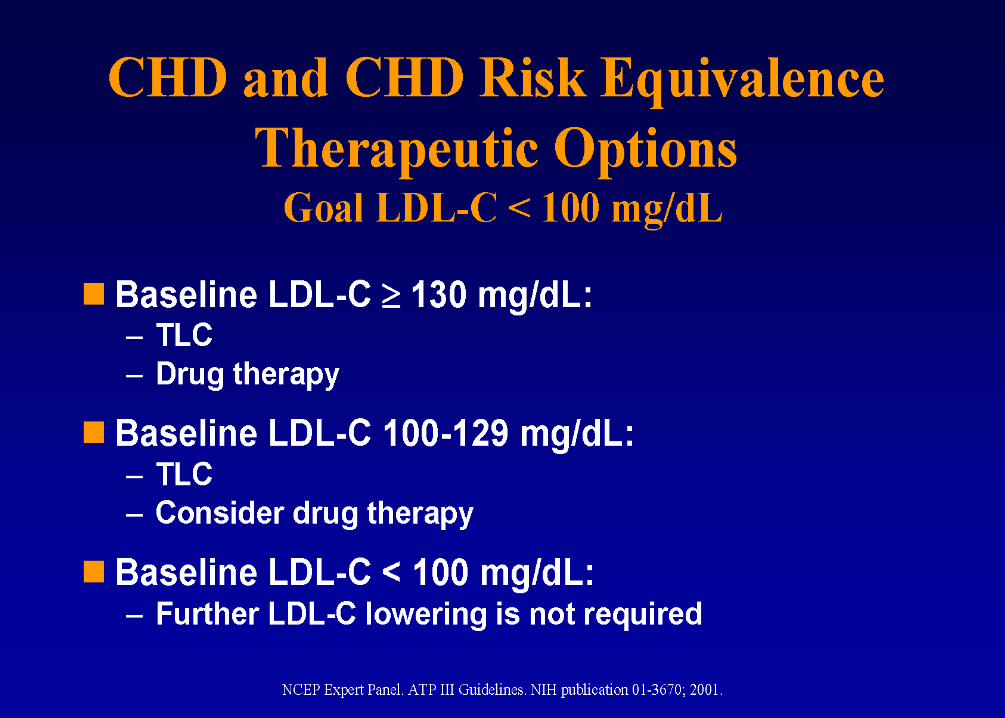
If 2+ risk factors (other than LDL) are present without CHD or CHD risk equivalent, assess 10-year (short-term) CHD risk (see Framingham tables). >20% - CHD or CHD risk equivalent –LDL Goal < 100mg/dL 10 -20%-LDL Goal < 130 mg/dL < 10%- LDL Goal < 160 mg/dL
Refer to the 10 year Risk Table.

Diet vs StatinsDiet vs Statins
Combining currently recommended cholesterol-lowering dietary components reduces LDL-C up to 35%
Meta-analyses have suggested the following reductions in serum LDL-C 12.5 % for 45 g soy protein 6 – 7% for 9 -10 g/d psyllium (smaller reductions for other viscous fibers) 10% for 1-2 g plant sterol/d 1% for 10 g almonds/d
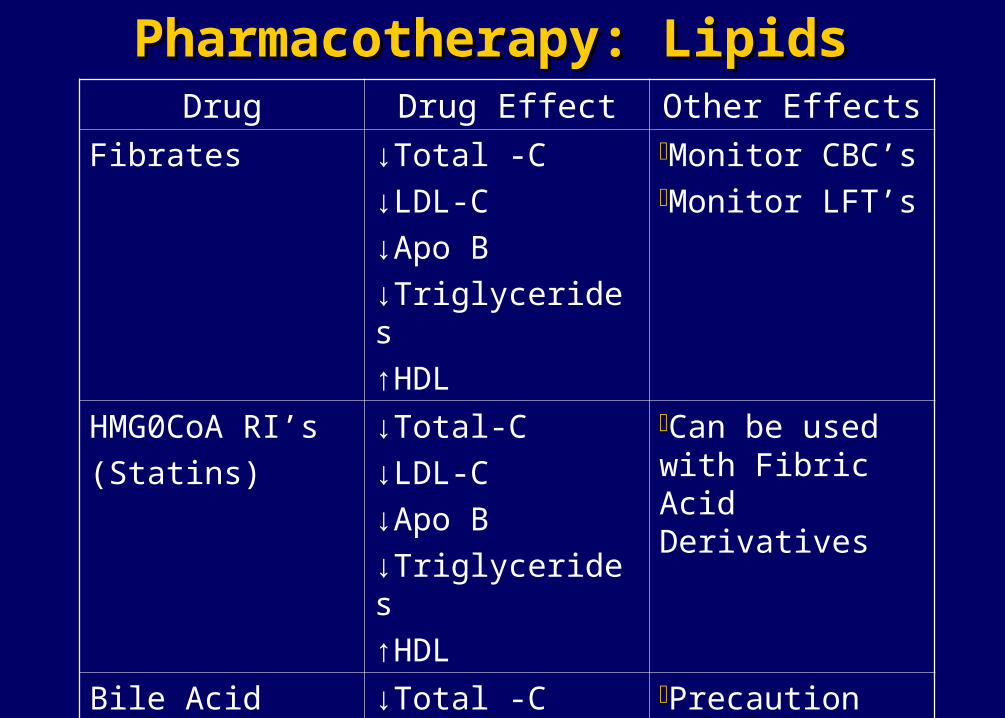
Pharmacotherapy: LipidsPharmacotherapy: LipidsDrug Drug Effect Other Effects
Fibrates ↓Total -C
↓LDL-C
↓Apo B
↓Triglycerides
↑HDL
Monitor CBC’sMonitor LFT’s
HMG0CoA RI’s
(Statins)
↓Total-C
↓LDL-C
↓Apo B
↓Triglycerides
↑HDL
Can be used with Fibric Acid Derivatives
Bile Acid
Sequestrants
↓Total -C
↓LDL-C
Precaution TG>300
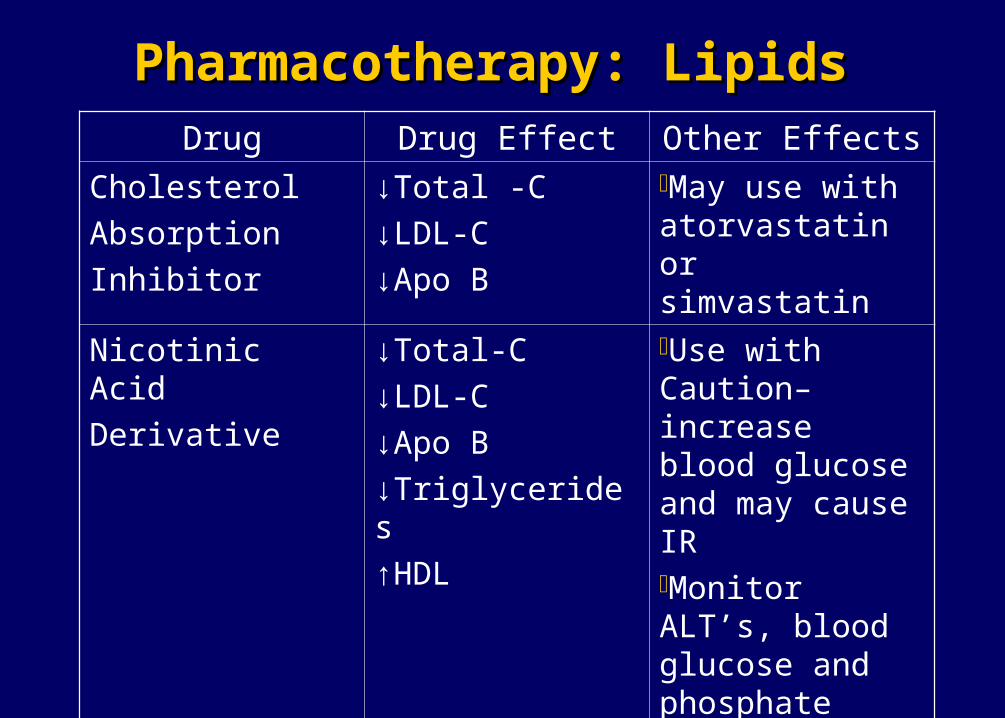
Pharmacotherapy: LipidsPharmacotherapy: LipidsDrug Drug Effect Other Effects
Cholesterol
Absorption
Inhibitor
↓Total -C
↓LDL-C
↓Apo B
May use with atorvastatin or simvastatin
Nicotinic Acid
Derivative
↓Total-C
↓LDL-C
↓Apo B
↓Triglycerides
↑HDL
Use with Caution– increase blood glucose and may cause IRMonitor ALT’s, blood glucose and phosphate
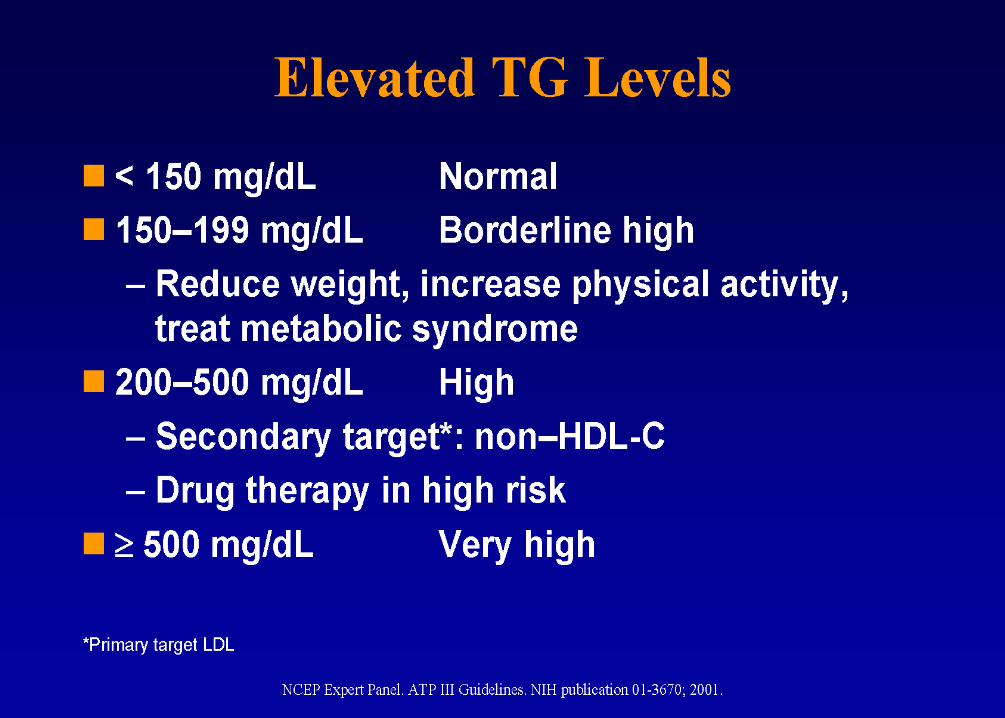
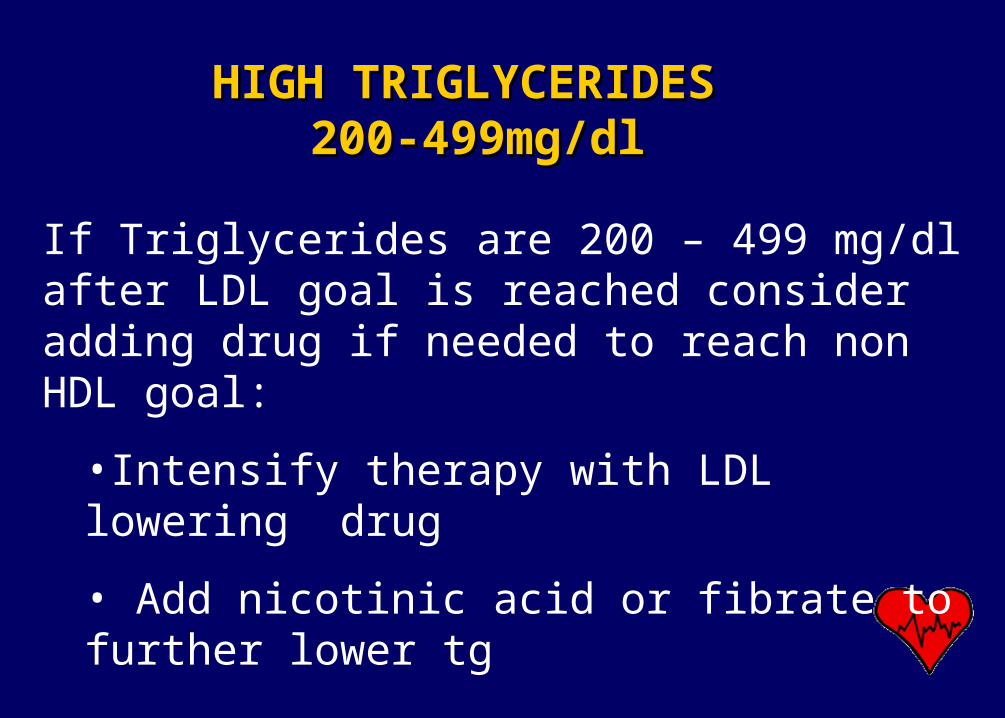
HIGH TRIGLYCERIDES HIGH TRIGLYCERIDES 200-499mg/dl200-499mg/dl
If Triglycerides are 200 – 499 mg/dl after LDL goal is reached consider adding drug if needed to reach non HDL goal:
•Intensify therapy with LDL lowering drug
• Add nicotinic acid or fibrate to further lower tg
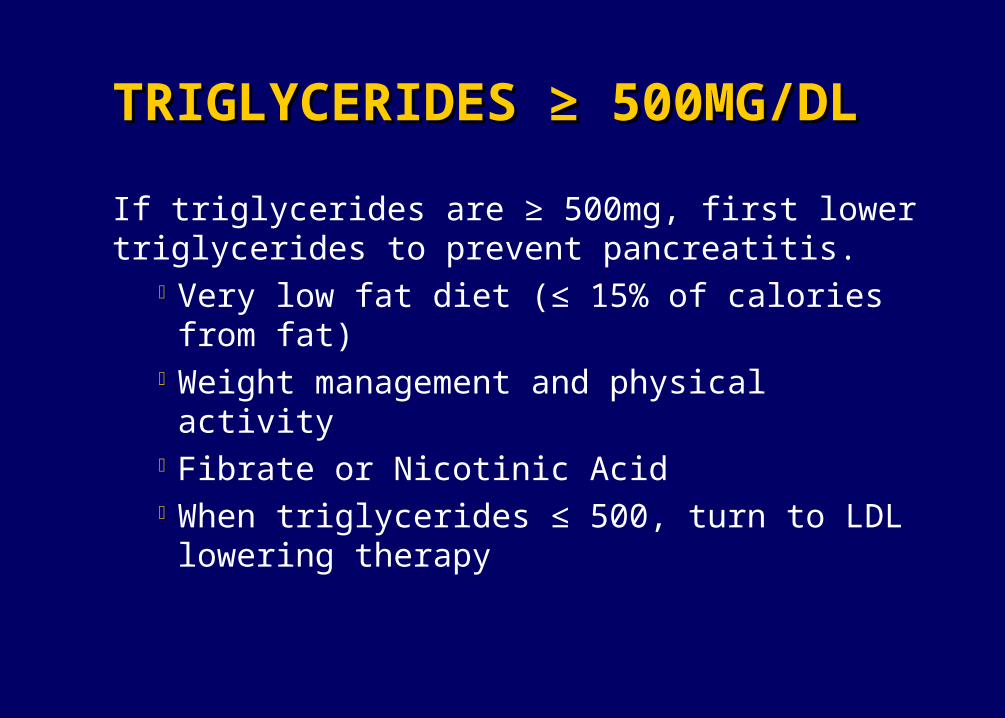
TRIGLYCERIDES TRIGLYCERIDES ≥ 500MG/DL≥ 500MG/DL
If triglycerides are ≥ 500mg, first lower triglycerides to prevent pancreatitis.
Very low fat diet (≤ 15% of calories from fat) Weight management and physical activity Fibrate or Nicotinic Acid When triglycerides ≤ 500, turn to LDL lowering
therapy
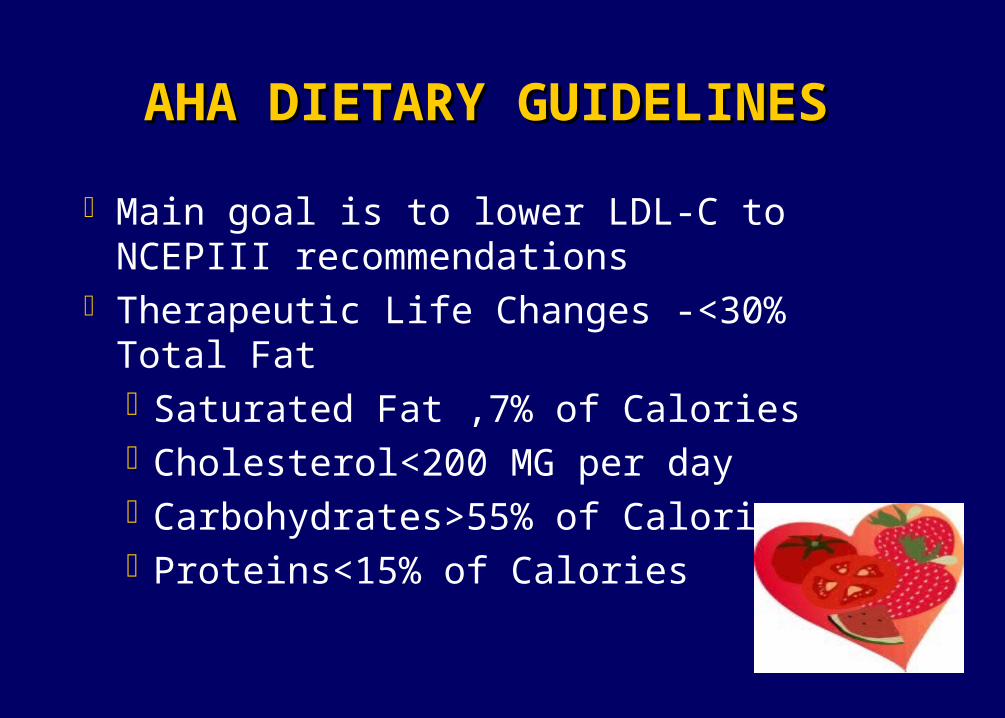
AHA DIETARY GUIDELINESAHA DIETARY GUIDELINES
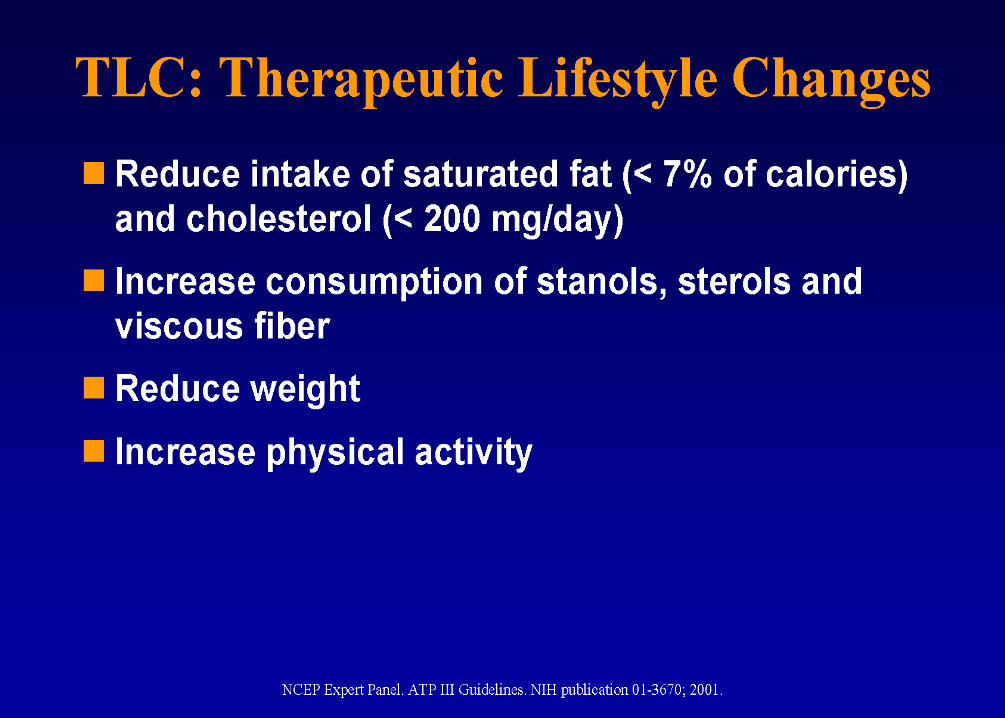
Main goal is to lower LDL-C to NCEPIII recommendations
Therapeutic Life Changes -<30% Total FatSaturated Fat ,7% of CaloriesCholesterol<200 MG per dayCarbohydrates>55% of CaloriesProteins<15% of Calories
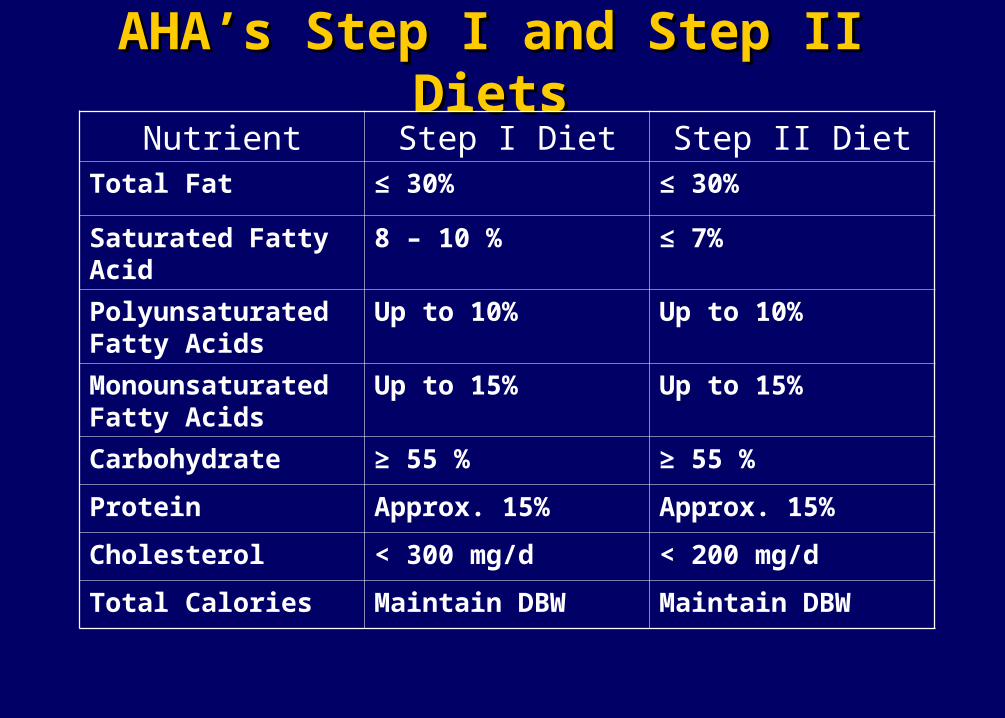
AHA’s Step I and Step II DietsAHA’s Step I and Step II DietsNutrient Step I Diet Step II Diet
Total Fat ≤ 30% ≤ 30%
Saturated Fatty Acid 8 – 10 % ≤ 7%
Polyunsaturated Fatty Acids
Up to 10% Up to 10%
Monounsaturated Fatty Acids
Up to 15% Up to 15%
Carbohydrate ≥ 55 % ≥ 55 %
Protein Approx. 15% Approx. 15%
Cholesterol < 300 mg/d < 200 mg/d
Total Calories Maintain DBW Maintain DBW
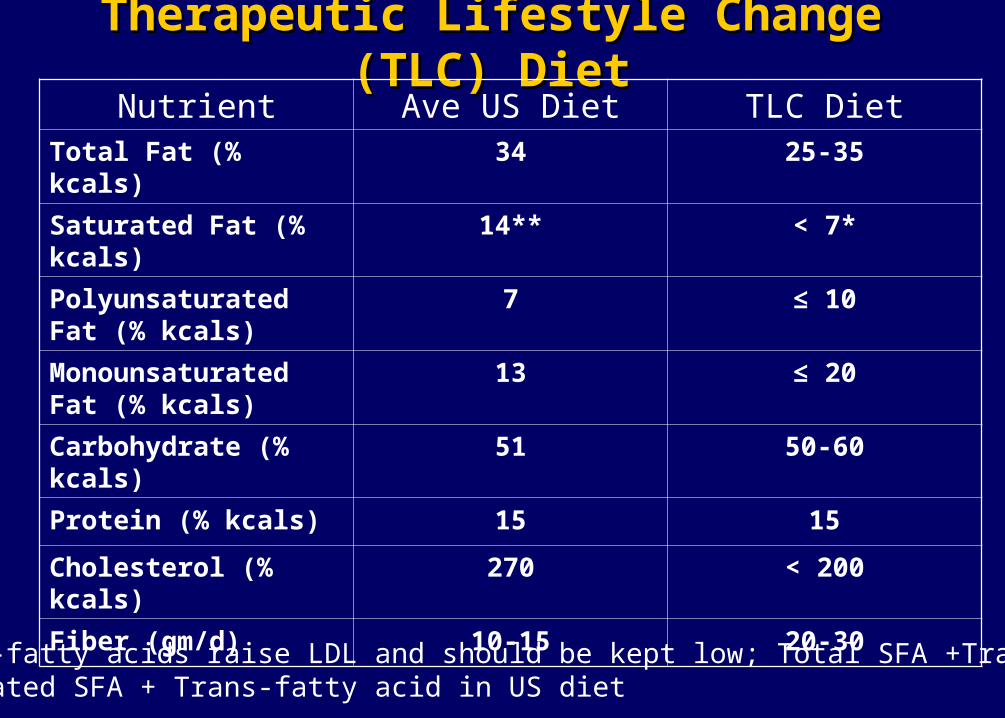
Therapeutic Lifestyle Change (TLC) DietTherapeutic Lifestyle Change (TLC) DietNutrient Ave US Diet TLC Diet
Total Fat (% kcals) 34 25-35
Saturated Fat (% kcals) 14** < 7*
Polyunsaturated Fat (% kcals)
7 ≤ 10
Monounsaturated Fat (% kcals)
13 ≤ 20
Carbohydrate (% kcals) 51 50-60
Protein (% kcals) 15 15
Cholesterol (% kcals) 270 < 200
Fiber (gm/d) 10-15 20-30
Trans-fatty acids raise LDL and should be kept low; Total SFA +Trans = <10%Estimated SFA + Trans-fatty acid in US diet
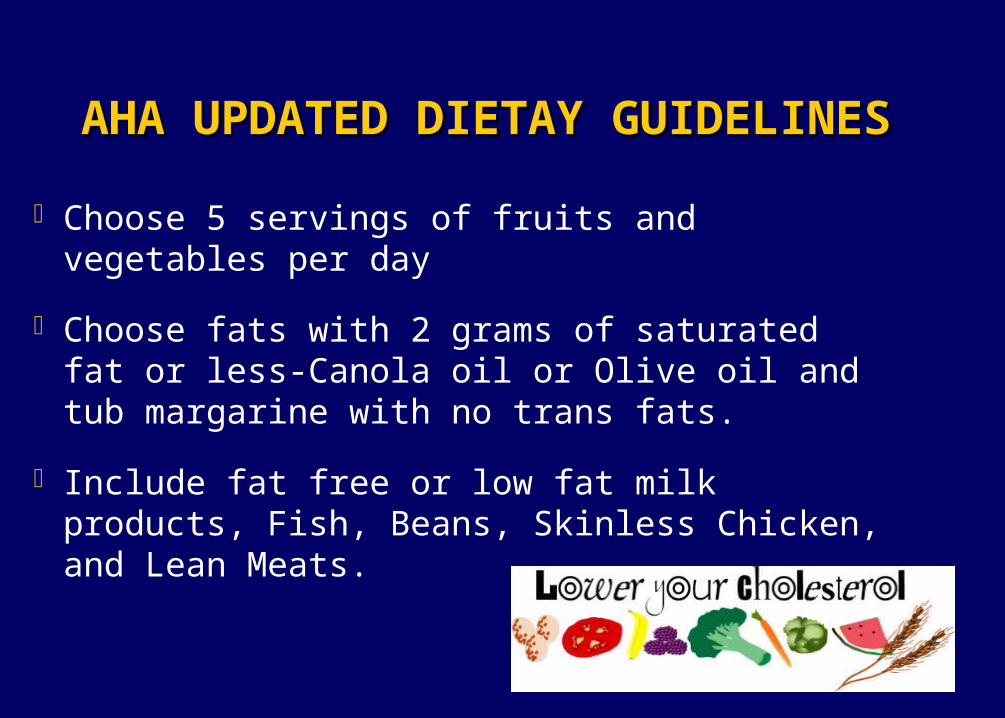
AHA UPDATED DIETAY GUIDELINESAHA UPDATED DIETAY GUIDELINES
Choose 5 servings of fruits and vegetables per day
Choose fats with 2 grams of saturated fat or less-Canola oil or Olive oil and tub margarine with no trans fats.
Include fat free or low fat milk products, Fish, Beans, Skinless Chicken, and Lean Meats.
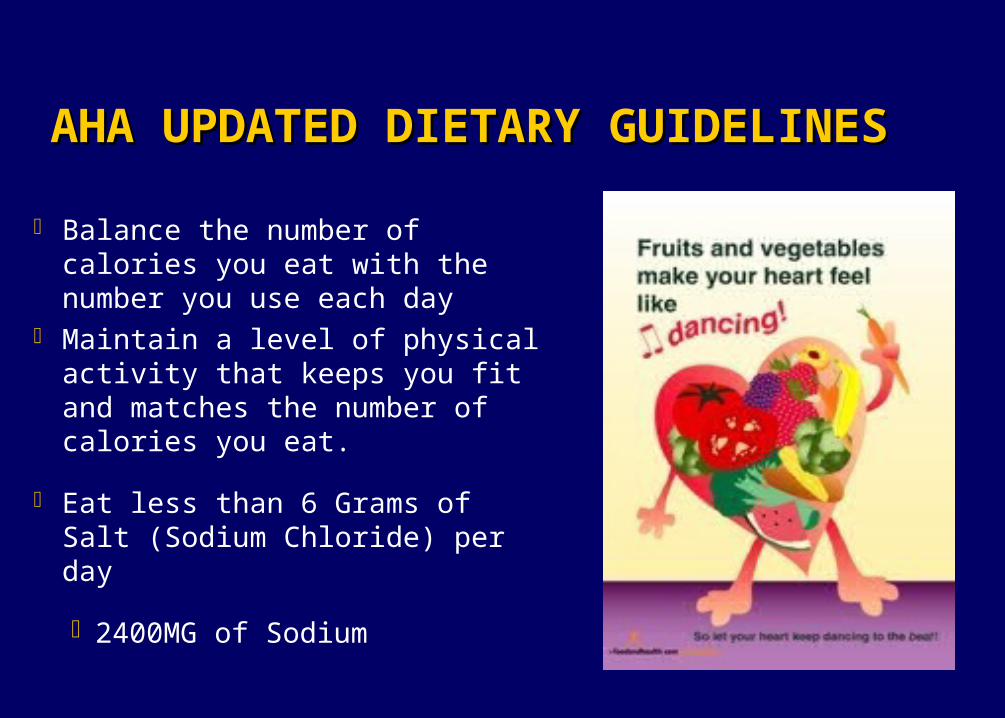
AHA UPDATED DIETARY GUIDELINESAHA UPDATED DIETARY GUIDELINES
Balance the number of calories you eat with the number you use each day
Maintain a level of physical activity that keeps you fit and matches the number of calories you eat.
Eat less than 6 Grams of Salt (Sodium Chloride) per day
2400MG of Sodium
AHA UPDATED DIETARY GUIDELINESAHA UPDATED DIETARY GUIDELINES
Limit foods high in Saturated fat, Trans fat or Cholesterol such as whole milk products, Fatty or Organ meats, partially hydrogenated oils and egg yolks.
Limit Alcohol- one drink per day for women – two drinks for men
Eat a variety of whole grains-choose 6 servings a dayGOAL>25GRAMS of fiber per day
AHA UPDATED DIETARY GUIDELINESAHA UPDATED DIETARY GUIDELINES
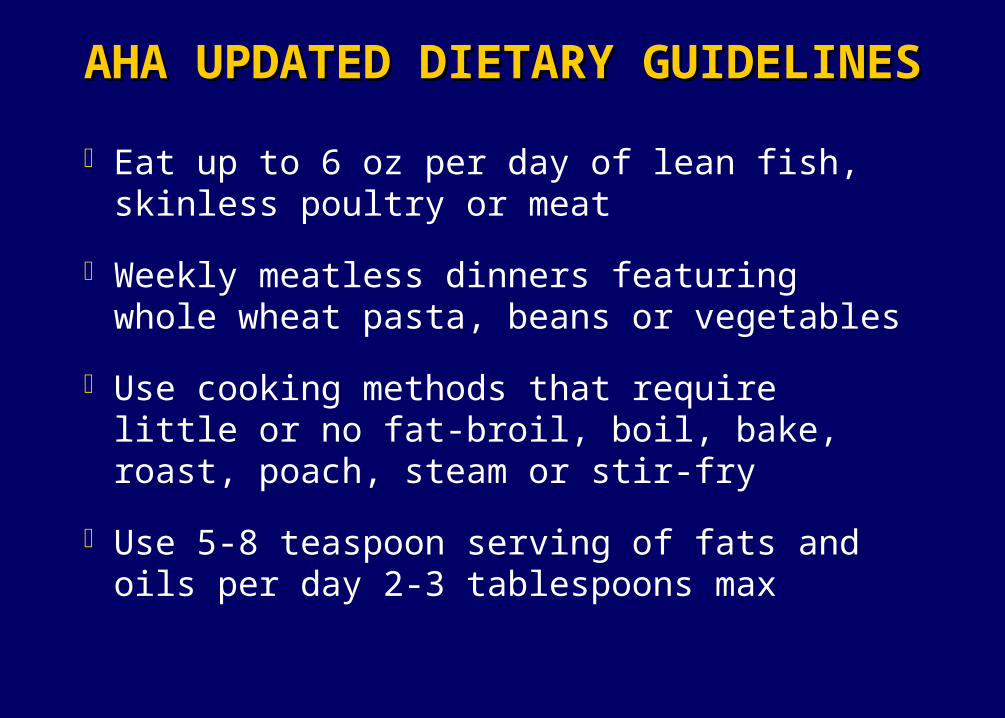
Eat up to 6 oz per day of lean fish, skinless poultry or meat
Weekly meatless dinners featuring whole wheat pasta, beans or vegetables
Use cooking methods that require little or no fat-broil, boil, bake, roast, poach, steam or stir-fry
Use 5-8 teaspoon serving of fats and oils per day 2-3 tablespoons max
AHA UPDATED DIETARY GUIDELINESAHA UPDATED DIETARY GUIDELINES
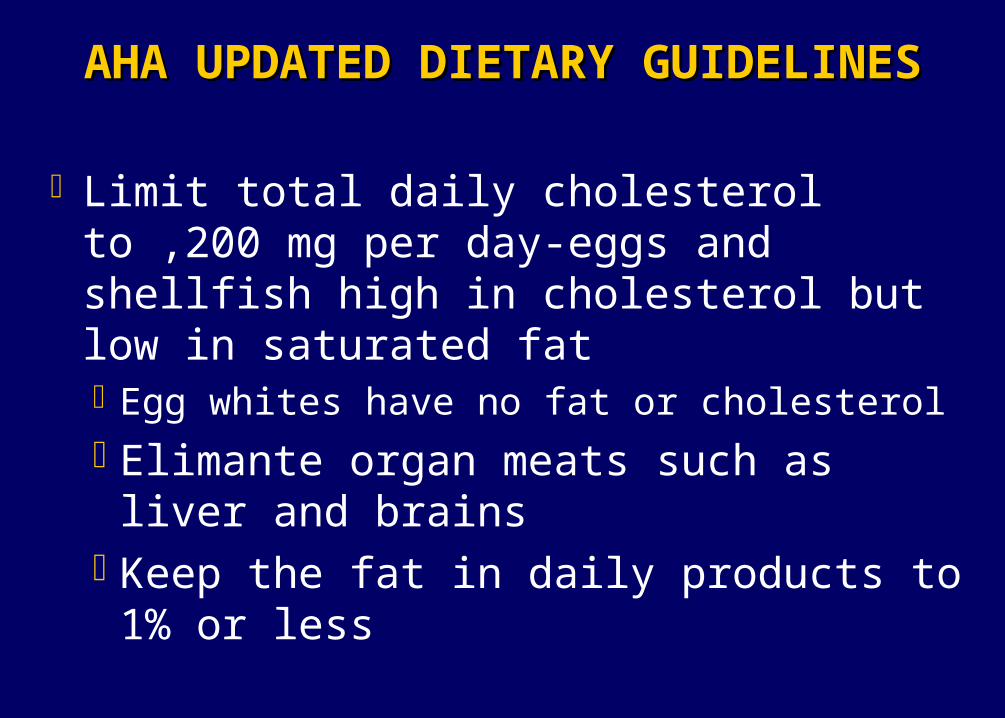
Limit total daily cholesterol to ,200 mg per day-eggs and shellfish high in cholesterol but low in saturated fatEgg whites have no fat or cholesterol
Elimante organ meats such as liver and brainsKeep the fat in daily products to 1% or less
Dietary FiberDietary Fiber
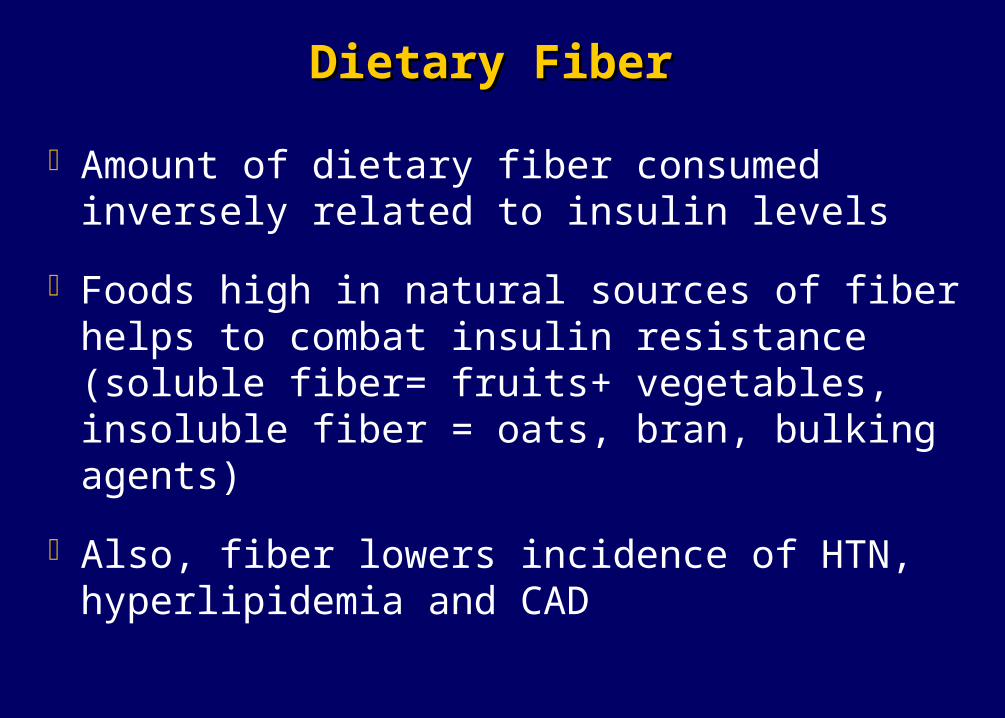
Amount of dietary fiber consumed inversely related to insulin levels
Foods high in natural sources of fiber helps to combat insulin resistance (soluble fiber= fruits+ vegetables, insoluble fiber = oats, bran, bulking agents)
Also, fiber lowers incidence of HTN, hyperlipidemia and CAD

Benefits of An Adequate Fiber Intake Benefits of An Adequate Fiber Intake
Blood cholesterol-lowers LDLApples, barley, beans, and other legumes, fruits and
vegetables, oatmeal, oat bran and psyllium seed husk*, soy polysaccharide and xanthan gum
Normal Laxation
Digestion and satiety Benefits insulin and glucose levels
How Much Physical Activity? How Much Physical Activity?
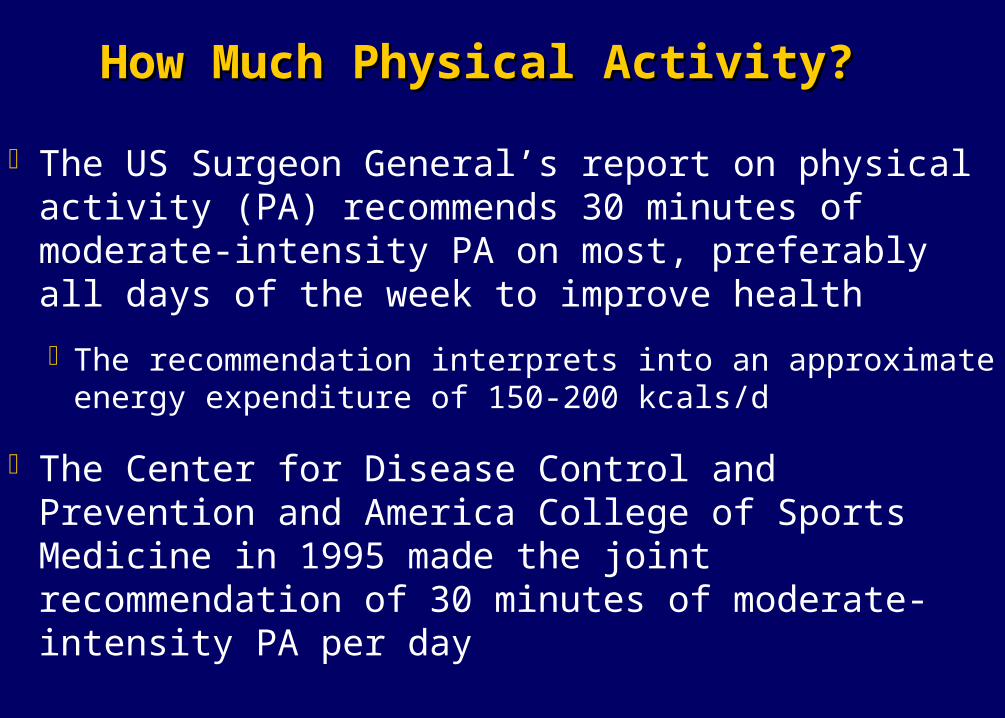
The US Surgeon General’s report on physical activity (PA) recommends 30 minutes of moderate-intensity PA on most, preferably all days of the week to improve health
The recommendation interprets into an approximate energy expenditure of 150-200 kcals/d
The Center for Disease Control and Prevention and America College of Sports Medicine in 1995 made the joint recommendation of 30 minutes of moderate-intensity PA per day
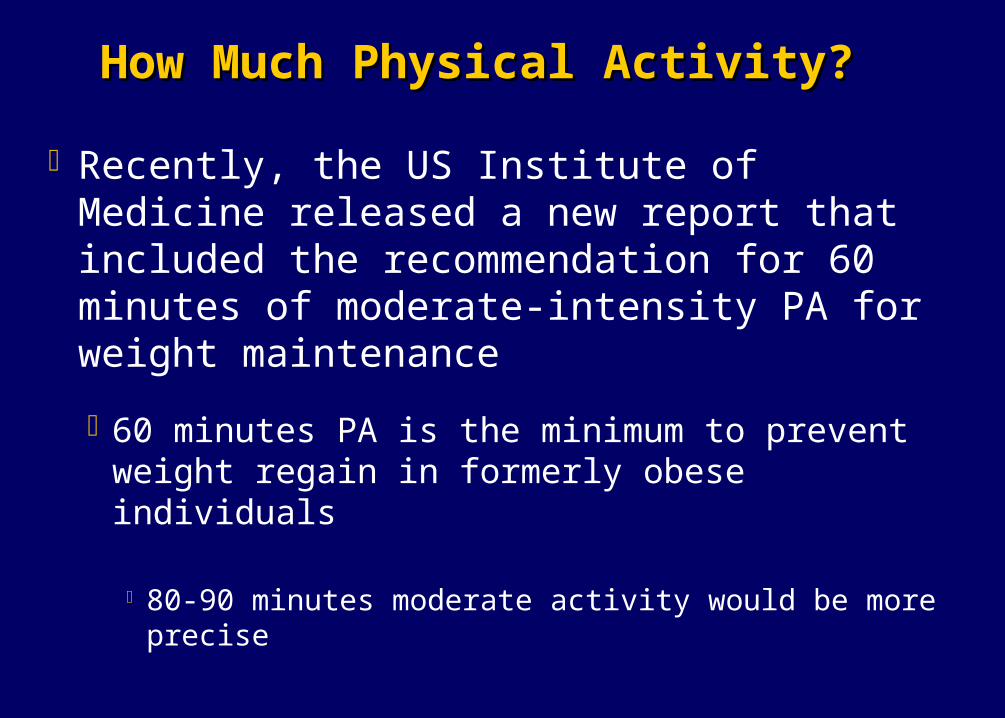
How Much Physical Activity? How Much Physical Activity?
Recently, the US Institute of Medicine released a new report that included the recommendation for 60 minutes of moderate-intensity PA for weight maintenance
60 minutes PA is the minimum to prevent weight regain in formerly obese individuals
80-90 minutes moderate activity would be more precise

How Many Calories Do I Need? How Many Calories Do I Need?
Step 1: Calculate you BMR by multiplying your current weight by 10 for women and 11 for men.
example: A 64-in, moderately active, 130 lb women’s basal energy requirements is estimated to be 1300 kcal/d.
Step 2: Add in energy calories for physical activity * Light activity = basal needs + 30%
* Moderate activity = basal needs +40%
* Very active = basal needs +50%
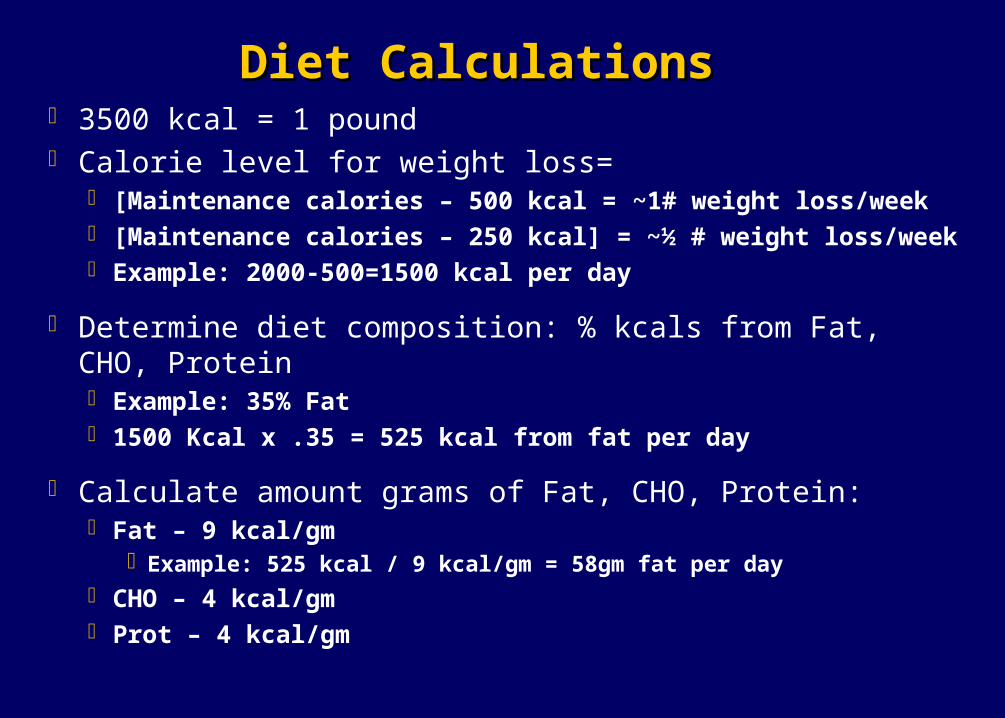
Diet Calculations Diet Calculations 3500 kcal = 1 pound Calorie level for weight loss=
[Maintenance calories – 500 kcal = ~1# weight loss/week [Maintenance calories – 250 kcal] = ~½ # weight loss/week Example: 2000-500=1500 kcal per day
Determine diet composition: % kcals from Fat, CHO, Protein Example: 35% Fat 1500 Kcal x .35 = 525 kcal from fat per day
Calculate amount grams of Fat, CHO, Protein: Fat – 9 kcal/gm
Example: 525 kcal / 9 kcal/gm = 58gm fat per day CHO – 4 kcal/gm Prot – 4 kcal/gm

The National Weight Control Registry The National Weight Control Registry
The National Weight Control Registry is a research study that seeks to gather information from people who have successfully lost weight and kept it off
Successful weight loss is associated with lifetime changes and exercise
The longer weight loss is maintained the greater the likelihood of long term success.
DIETARY FAT AND OBESITYDIETARY FAT AND OBESITY
Calorically Dense-9kcal /gram Highly Palatable
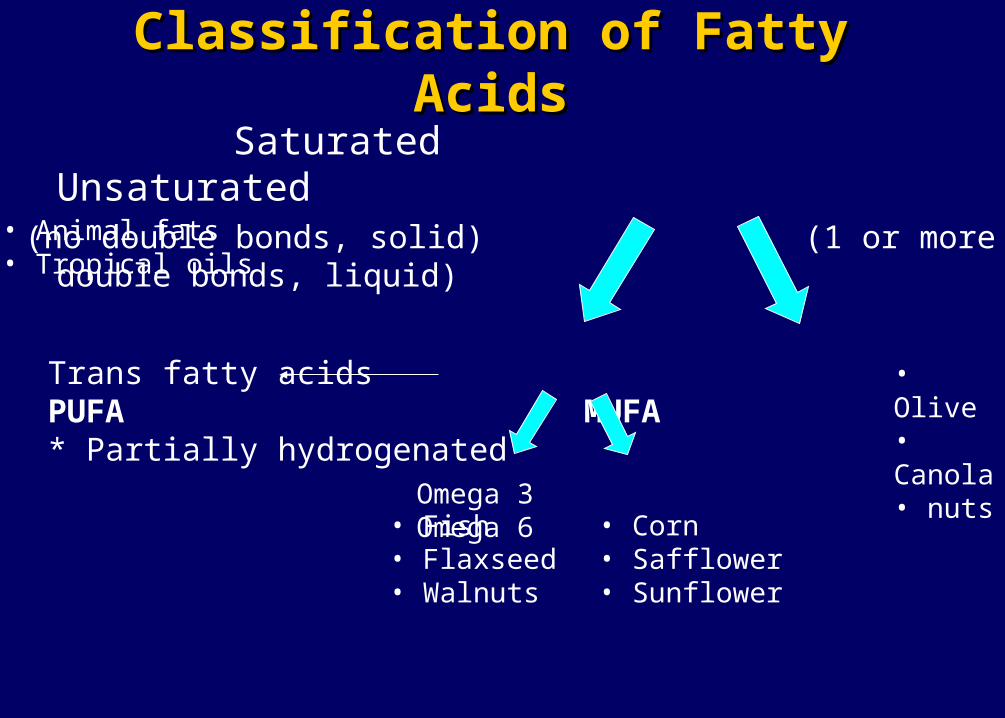
Classification of Fatty AcidsClassification of Fatty Acids
Saturated Unsaturated(no double bonds, solid) (1 or more double bonds, liquid)
• Animal fats• Tropical oils
Trans fatty acids PUFA MUFA* Partially hydrogenated
• Olive• Canola• nuts
Omega 3 Omega 6• Fish• Flaxseed• Walnuts
• Corn• Safflower• Sunflower

Monounsaturated FatsMonounsaturated Fats
The following have 45 calories and 5 grams of fat Avocado, medium 2 tbsp or 1 oz Oil (canola, olive, peanut) 1 tsp Olives: ripe (black) 8 large Green, stuffed 10 large Nuts: almonds, cashews 6 nuts Mixed (50% peanuts) 6 nuts Peanuts 10 nuts Pecans 4 halves Peanut butter ½ Tbsp Tahini or sesame paste 2 tsp

High MUFA DietsHigh MUFA Diets
Protective against CHDReduces TC and LDL-CNo change in HDL-C or TG (↓ HDL-C, ↑TG possible with
high CHO)Favorably impacts glycemic control in some diabetes ptsMay decrease BPMay protect against thrombogenesis (↑ fibrinolysis)
Mediterranean diet is plant-based and low in SFAOlive oil is the principle fat (oleic acid content: 56 – 84%)
Also contains numerous flavonoids, phenols and antioxidants
ESSENTIAL FATTY ACIDSESSENTIAL FATTY ACIDS
The good fats are the essential fatty acids (EFA) from the Omega 3 and Omega 6 family
They must be obtained from the diet They are essential for health The significance in the diet is based on their
balance

PRIMARY SOURCES OFPRIMARY SOURCES OF OMEGA 3 OMEGA 3
Fatty fish-salmon, Tuna, Sardines Mackeral Flaxseeds Walnuts Canola and Soybean oils Fish oils Omega 3 Enriched Eggs and Milk
OMEGA 3 RECOMMENDATIONSOMEGA 3 RECOMMENDATIONS
Primary Prevention >2 Fatty fish meals per week 1GM of total Omega 3 daily
Secondary Prevention 1 fatty fish meal per day 2GMS of Omega 3 daily
LIMIT OMEGA 6 TO < 2 GRAMS DAILY
OMEGA 3 BENEFITSOMEGA 3 BENEFITS
Cardioprotective Linked to reduced incidence in CHD and Sudden Death Antinflammartory Antithrombotic Properties Antiarrhythmic Properties Lipid Lowering
Triglycerides -20-60%(2-25 grams Omega 3) HDL-1-3%
OMEGA 3OMEGA 3
Safety Profile -Excellent Doses as high as 3-8 gram of Omega 3 (EPA &
DHA) per day show no adverse effects. Side effects-fish aftertaste & at high does loose
stools Increased bleeding tendency with high doses
FDA Health ClaimsFDA Health Claims
Proposed health claim:Diets containing 1 oz of nuts per day can reduce
the risk of heart disease
Foods currently approved for health claims:Plant sterolsViscous fibers (oat ß-glucan and pysllium)Soy protein

RedMeatButter
WhiteRice,BreadPastaSweets
Dairy or CalciumSupplement, 1-2 x day
Fish, Poultry, Eggs0-2 x /day
Nuts, Legumes, 1 – 3 times /day
Vegetables(in abundance)
Fruits, 2 -3 times/day
Whole Grain Foods(at most meals)
Plant oils, including olive, peanut, Canaola, soy, corn, sunflower, and other vegetable oils
Daily Exercise and Weight Control
Use Sparingly
Multiple VitaminsFor most
Alcohol in Moderation
The Great Nutrition DebateThe Great Nutrition Debate
The medical profession has long advocated low fat diets without paying attention to the role of carbohydrates in weight gain.
Refined carbohydrates may be the chief dietary culprit leading to the growing epidemic of obesity, insulin resistance and a link to CVD.

The Glycemic IndexThe Glycemic Index
The integrated increase in blood glucose level in a
2 hour Period after ingestion of a known quantity
of a test food (50g CHO) – How fast insulin
released (hyperinsulinemia)
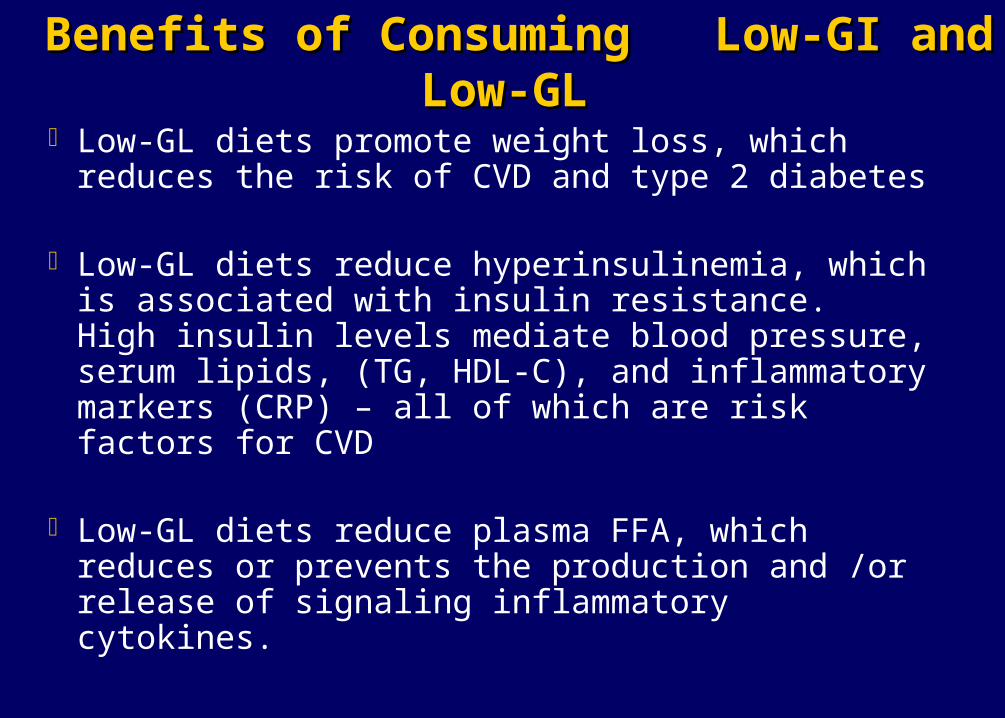
Benefits of Consuming Low-GI and Low-GL Benefits of Consuming Low-GI and Low-GL
Low-GL diets promote weight loss, which reduces the risk of CVD and type 2 diabetes
Low-GL diets reduce hyperinsulinemia, which is associated with insulin resistance. High insulin levels mediate blood pressure, serum lipids, (TG, HDL-C), and inflammatory markers (CRP) – all of which are risk factors for CVD
Low-GL diets reduce plasma FFA, which reduces or prevents the production and /or release of signaling inflammatory cytokines.
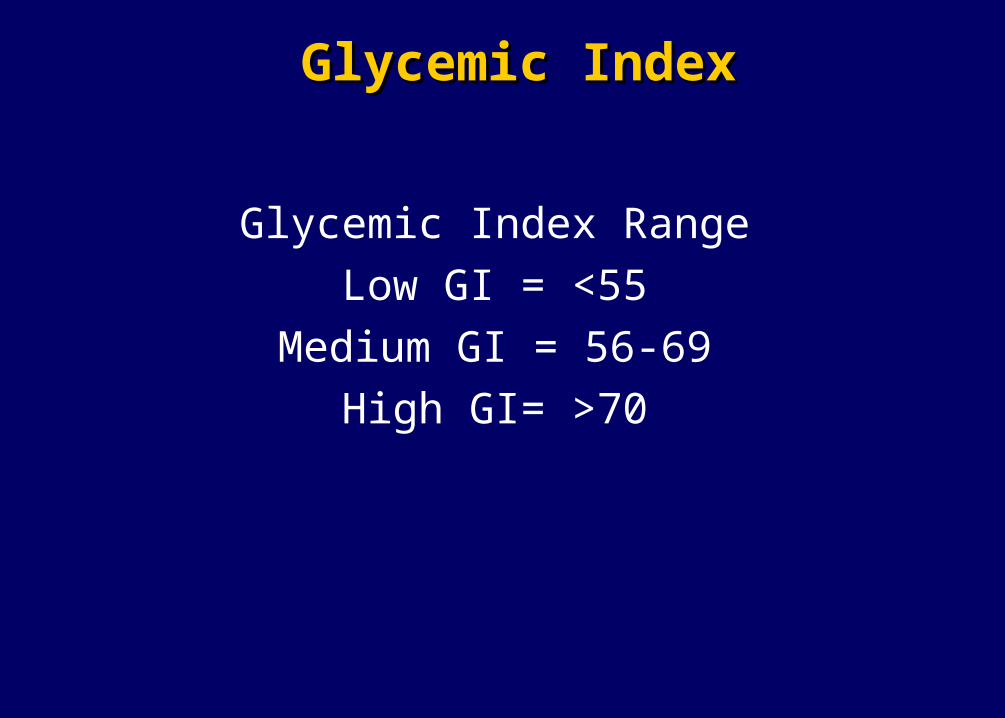
Glycemic IndexGlycemic Index
Glycemic Index Range
Low GI = <55
Medium GI = 56-69
High GI= >70
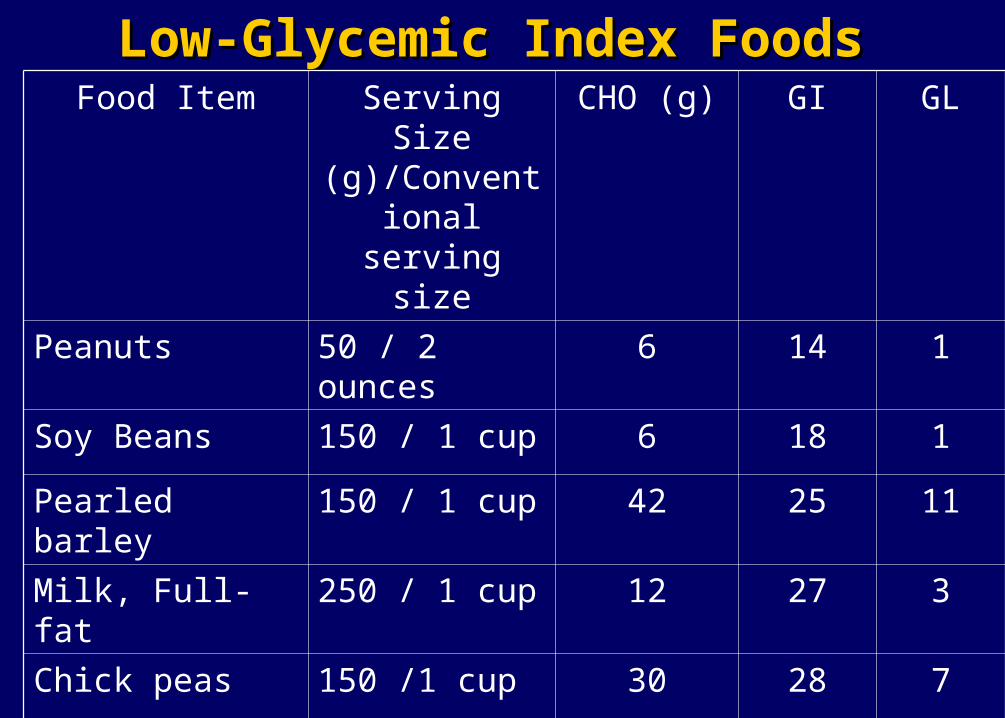
Low-Glycemic Index FoodsLow-Glycemic Index FoodsFood Item Serving Size
(g)/Conventional serving size
CHO (g) GI GL
Peanuts 50 / 2 ounces 6 14 1
Soy Beans 150 / 1 cup 6 18 1
Pearled barley 150 / 1 cup 42 25 11
Milk, Full-fat 250 / 1 cup 12 27 3
Chick peas 150 /1 cup 30 28 7
Kidney beans 150 /1 cup 25 28 7
Lentils 150 / 1 cup 18 29 5
All-Bran cereal 30 / ½ cup 23 38 9
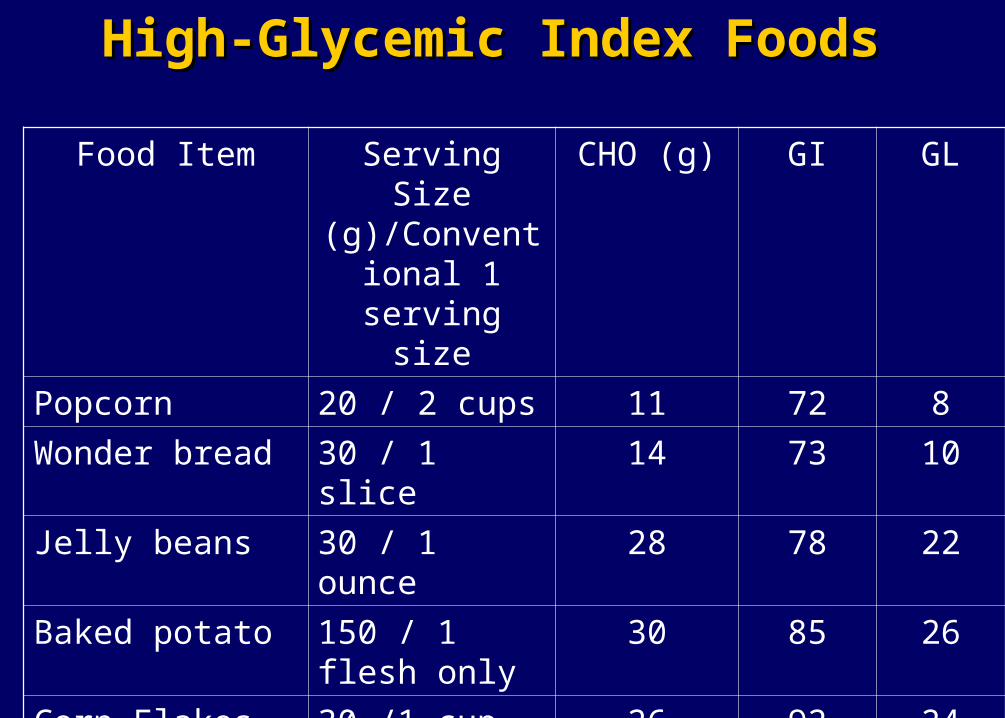
High-Glycemic Index FoodsHigh-Glycemic Index Foods
Food Item Serving Size (g)/Conventional
1 serving size
CHO (g) GI GL
Popcorn 20 / 2 cups 11 72 8
Wonder bread 30 / 1 slice 14 73 10
Jelly beans 30 / 1 ounce 28 78 22
Baked potato 150 / 1 flesh only
30 85 26
Corn Flakes
(Kellogg’s)
30 /1 cup 26 92 24
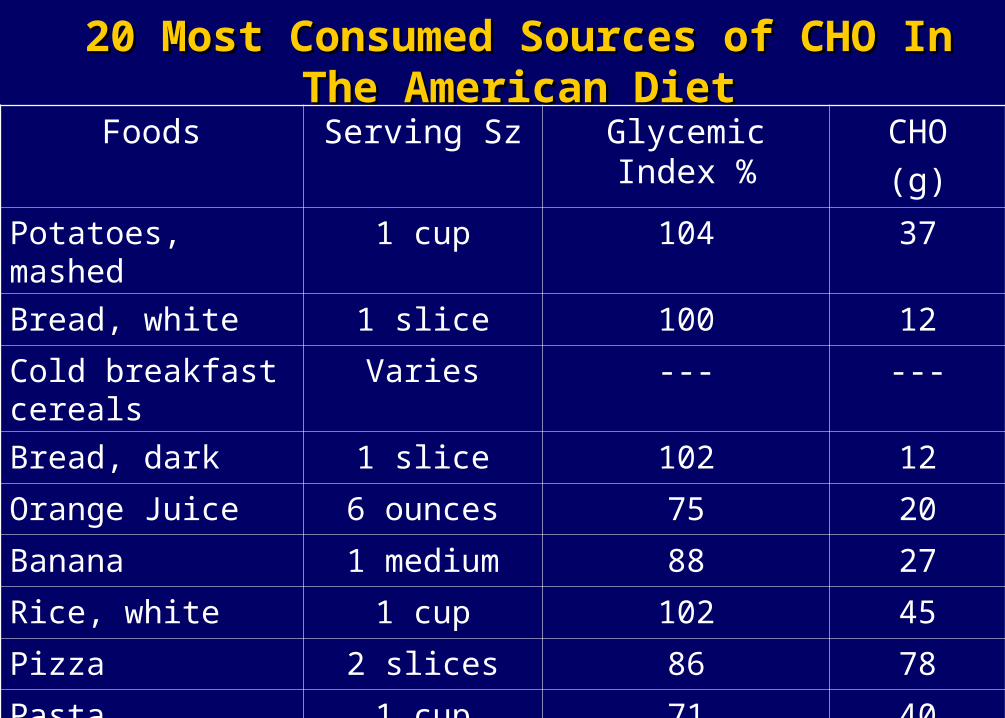
20 Most Consumed Sources of CHO In The 20 Most Consumed Sources of CHO In The American DietAmerican Diet
Foods Serving Sz Glycemic Index % CHO
(g)
Potatoes, mashed 1 cup 104 37
Bread, white 1 slice 100 12
Cold breakfast cereals Varies --- ---
Bread, dark 1 slice 102 12
Orange Juice 6 ounces 75 20
Banana 1 medium 88 27
Rice, white 1 cup 102 45
Pizza 2 slices 86 78
Pasta 1 cup 71 40
English Muffin 1 muffin 86 26
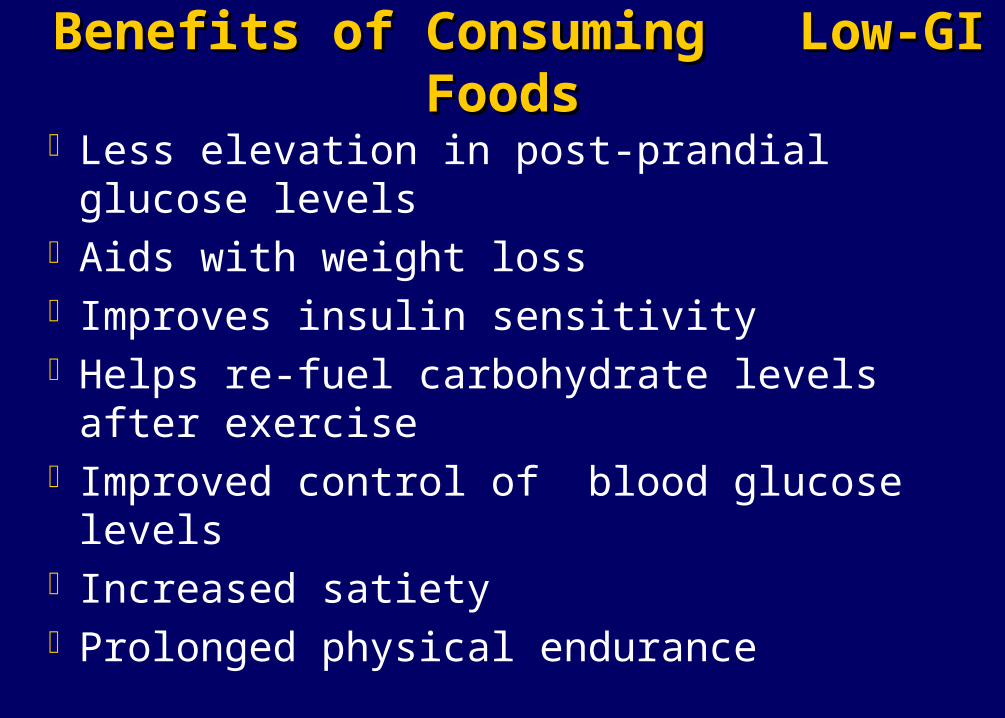
Benefits of Consuming Low-GI Foods Benefits of Consuming Low-GI Foods
Less elevation in post-prandial glucose levels Aids with weight loss Improves insulin sensitivity Helps re-fuel carbohydrate levels after exercise Improved control of blood glucose levels Increased satiety Prolonged physical endurance
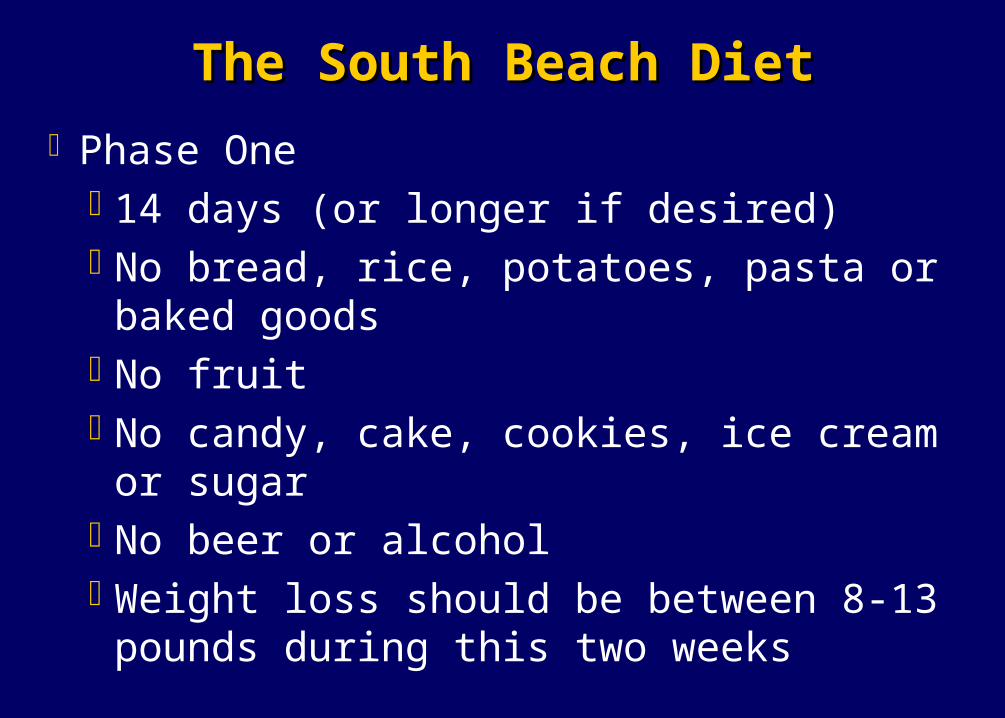
The South Beach Diet The South Beach Diet
Phase One14 days (or longer if desired)No bread, rice, potatoes, pasta or baked goodsNo fruitNo candy, cake, cookies, ice cream or sugarNo beer or alcoholWeight loss should be between 8-13 pounds
during this two weeks

The South Beach Diet The South Beach Diet
Phase TwoReintroduce certain healthy carbohydrates
Fruit, whole grain bread, whole grain rice, whole wheat pasta, sweet potatoes
Stay on phase 2 until desired weight loss is achieved
If needed, switch back to phase 1 to lose weight if you fell off of phase 2
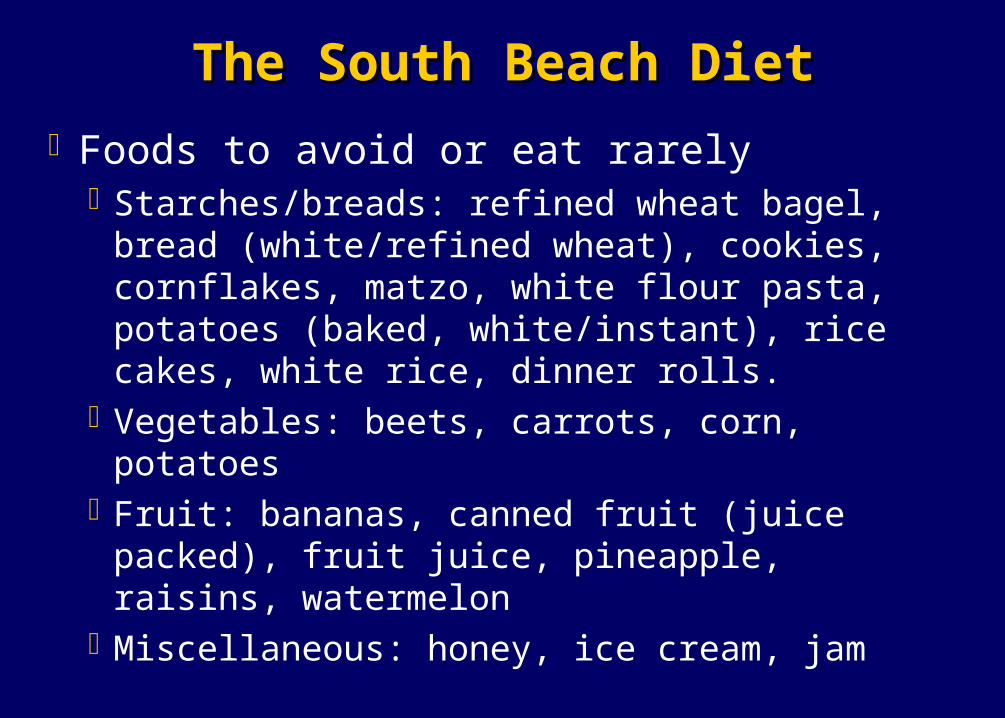
The South Beach Diet The South Beach Diet
Foods to avoid or eat rarelyStarches/breads: refined wheat bagel, bread
(white/refined wheat), cookies, cornflakes, matzo, white flour pasta, potatoes (baked, white/instant), rice cakes, white rice, dinner rolls.
Vegetables: beets, carrots, corn, potatoesFruit: bananas, canned fruit (juice packed), fruit juice,
pineapple, raisins, watermelonMiscellaneous: honey, ice cream, jam
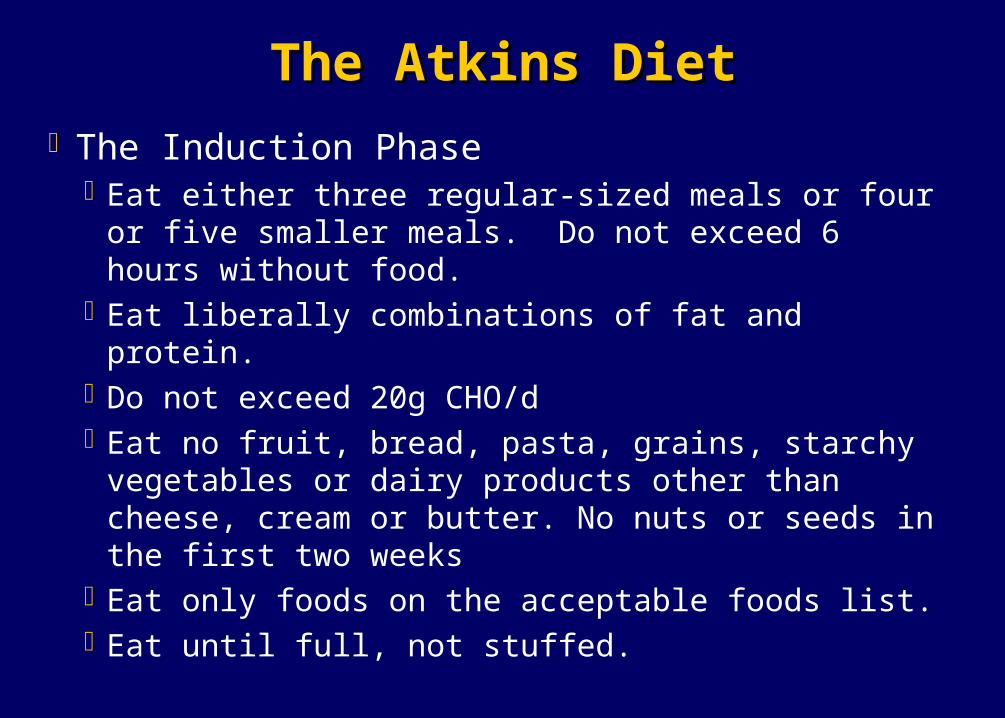
The Atkins Diet The Atkins Diet
The Induction PhaseEat either three regular-sized meals or four or five
smaller meals. Do not exceed 6 hours without food.Eat liberally combinations of fat and protein.Do not exceed 20g CHO/dEat no fruit, bread, pasta, grains, starchy vegetables or
dairy products other than cheese, cream or butter. No nuts or seeds in the first two weeks
Eat only foods on the acceptable foods list.Eat until full, not stuffed.
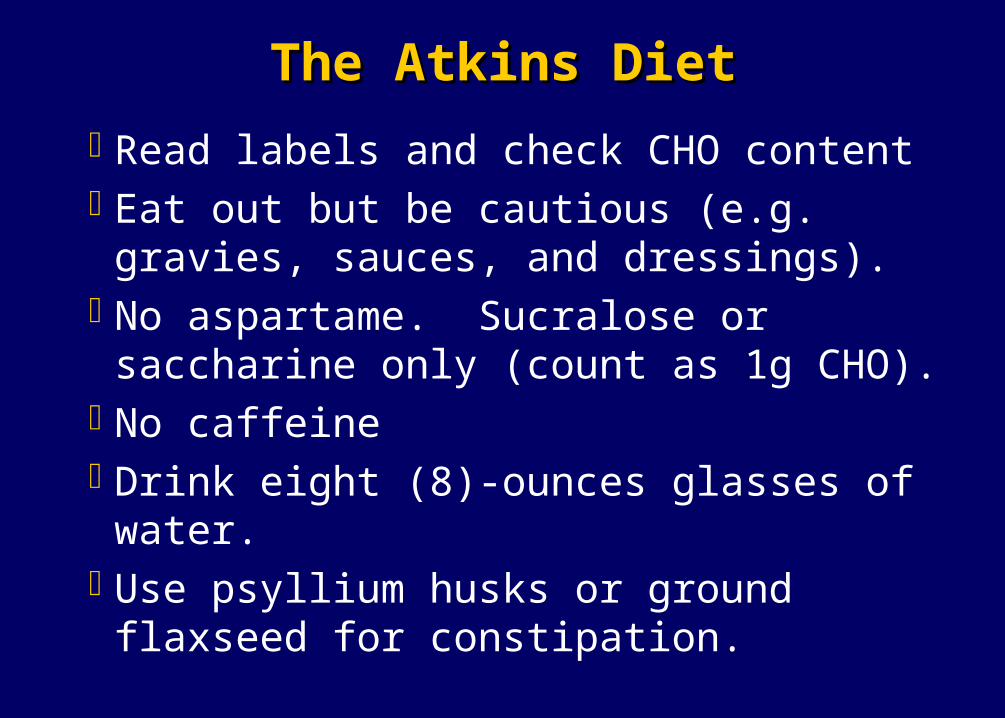
The Atkins Diet The Atkins Diet
Read labels and check CHO contentEat out but be cautious (e.g. gravies, sauces,
and dressings).No aspartame. Sucralose or saccharine only
(count as 1g CHO).No caffeineDrink eight (8)-ounces glasses of water.Use psyllium husks or ground flaxseed for
constipation.
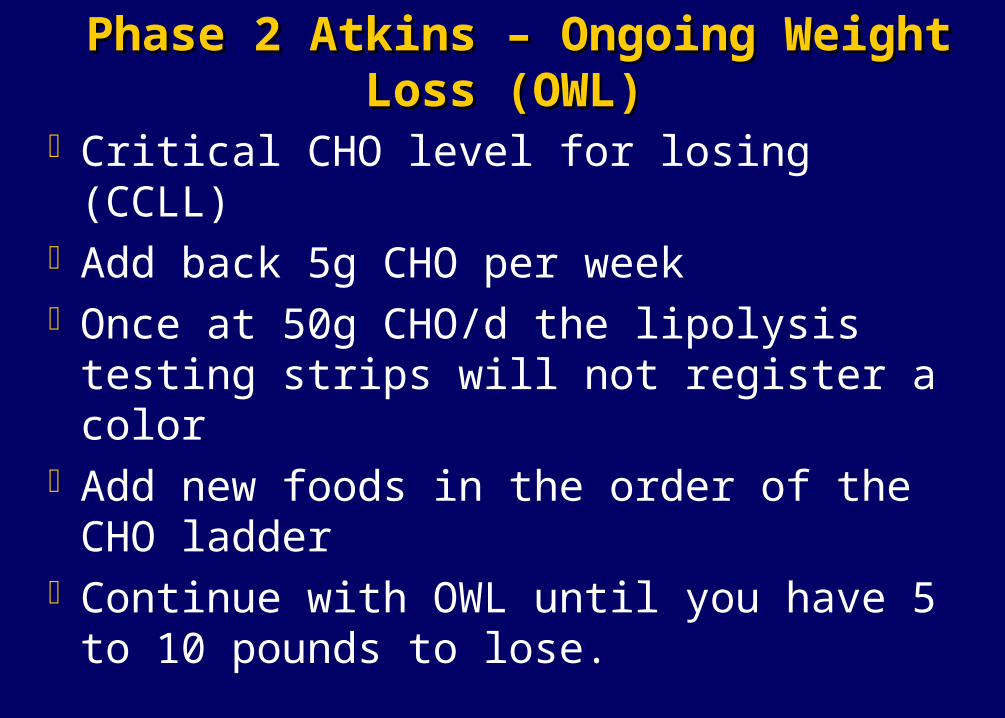
Phase 2 Atkins – Ongoing Weight Loss (OWL) Phase 2 Atkins – Ongoing Weight Loss (OWL)
Critical CHO level for losing (CCLL) Add back 5g CHO per week Once at 50g CHO/d the lipolysis testing strips
will not register a color Add new foods in the order of the CHO ladder Continue with OWL until you have 5 to 10
pounds to lose.
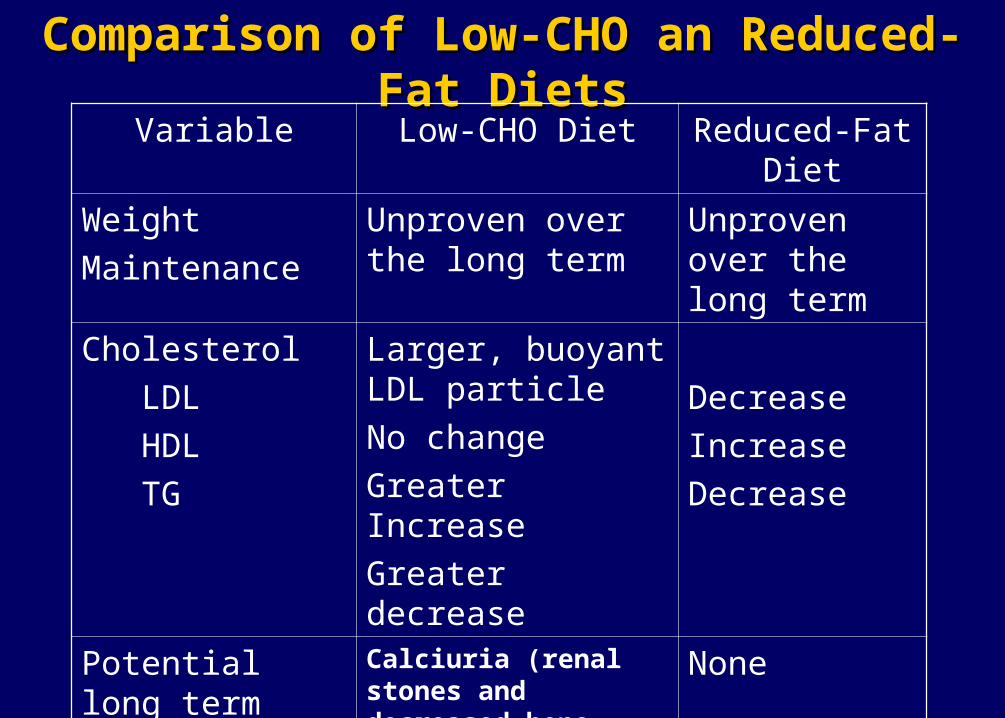
Comparison of Low-CHO an Reduced-Fat DietsComparison of Low-CHO an Reduced-Fat DietsVariable Low-CHO Diet Reduced-Fat
Diet
Weight
Maintenance
Unproven over the long term
Unproven over the long term
Cholesterol
LDL
HDL
TG
Larger, buoyant LDL particle
No change
Greater Increase
Greater decrease
Decrease
Increase
Decrease
Potential long term concerns
Calciuria (renal stones and decreased bone mass)
Relatively high protein content
None

Final Nutritional RemarksFinal Nutritional Remarks
Decrease Fat to 35% of total calories Very little saturated and trans fats Decrease overall polyunsaturated (processed) snack foods) Daily intake of monounsaturated fats olive oil & nuts Daily intake of omega 3 essential fatty acids 2-4 gms daily
Maintain CHO around 50% of total calories Eliminate refined sugars & white flour starch Focus on low to moderate glycemic foods Strive for high fiber CHO (20-40 gms day)
Maintain Protein around 15% of total calories Choose lean sources of protein (fish, chicken) Add soy protein (45 gms daily)
EMERGING RISK FACTORSEMERGING RISK FACTORS
Inflammation-recent research has linked levels of C-Reactive protein, a marker of inflammation, with increased risk of CHD
Inflammation is thought not only to influence the buildup of plaque but more importantly whether plaques are prone to rupture.
REDUCING INFLAMMATIONREDUCING INFLAMMATIONSteer clear of Trans Fatty Acids and Polyunsaturated oils.Dietary sources of Omega 3To protect against Oxidative stress-Antioxidant regimen200mg of Vitamin C400-800mg of Vitamin E200 mcg of Selenium25,000 IU of mixed carotenes
Relaxation and meditation techniques to reduce stressDaily Aspirin
EMERGING RISK FACTORSEMERGING RISK FACTORS
Homocysteine-an Amino Acid formed in the breakdown of dietary protein-may significantly increase the risk of heart disease and stroke.Blood levels of Homocysteine damage
aterial walls Platelet Aggregation Thrombosis
HOMOCYSTEINE REGIMENHOMOCYSTEINE REGIMEN
B6 (Pyridoxine Hydrchloride)100mg
B12 (Cyanocobalamin)100mcg
Folic Acid400mcg


