Optimal Model Complexity in Geological Carbon Sequestration: A Design of Experiment (DoE) & Response Surface (RS) Uncertainty Analysis Project Number: DE-FE-0009238 Mingkan Zhang 1 , Ye Zhang 1 , Peter Lichtner 2 1. Dept. of Geology & Geophysics, University of Wyoming, Laramie, Wyoming 2. OFM Research, Inc., Santa Fe, New Mexico U.S. Department of Energy National Energy Technology Laboratory Carbon Storage R&D Project Review Meeting Developing the Technologies and Infrastructure for CCS August 20-22, 2013
Transcript
Optimal Model Complexity in Geological Carbon Sequestration: A Design of Experiment (DoE) &
Response Surface (RS) Uncertainty Analysis
Project Number: DE-FE-0009238
Mingkan Zhang1, Ye Zhang1, Peter Lichtner2
1. Dept. of Geology & Geophysics, University of Wyoming, Laramie, Wyoming 2. OFM Research, Inc., Santa Fe, New Mexico
U.S. Department of Energy National Energy Technology Laboratory
Carbon Storage R&D Project Review Meeting Developing the Technologies and
Dept. of Geology & Geophysics, University of Wyoming
3
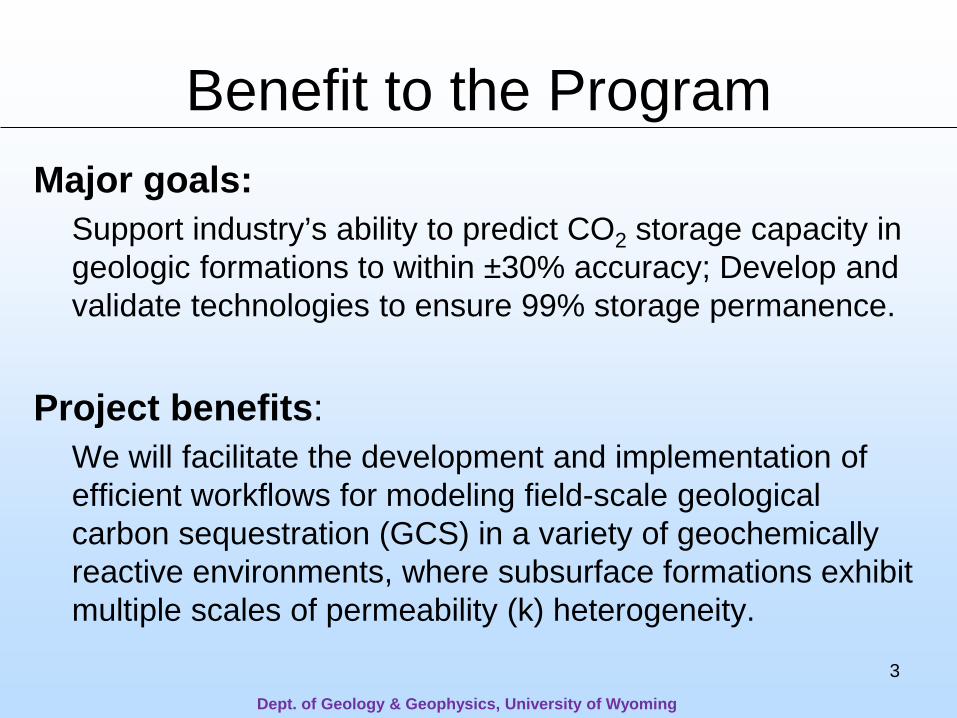
Benefit to the Program Major goals:
Support industry’s ability to predict CO2 storage capacity in geologic formations to within ±30% accuracy; Develop and validate technologies to ensure 99% storage permanence.
Project benefits: We will facilitate the development and implementation of efficient workflows for modeling field-scale geological carbon sequestration (GCS) in a variety of geochemically reactive environments, where subsurface formations exhibit multiple scales of permeability (k) heterogeneity.
Dept. of Geology & Geophysics, University of Wyoming
4
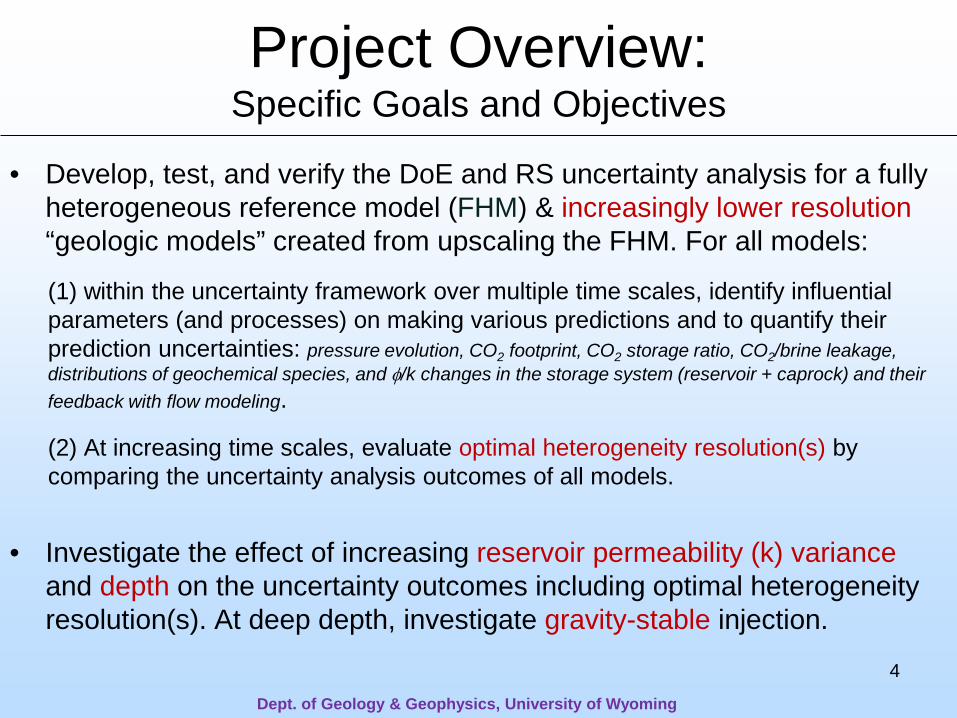
Project Overview: Specific Goals and Objectives
• Develop, test, and verify the DoE and RS uncertainty analysis for a fully heterogeneous reference model (FHM) & increasingly lower resolution “geologic models” created from upscaling the FHM. For all models:
(1) within the uncertainty framework over multiple time scales, identify influential parameters (and processes) on making various predictions and to quantify their prediction uncertainties: pressure evolution, CO2 footprint, CO2 storage ratio, CO2/brine leakage, distributions of geochemical species, and φ/k changes in the storage system (reservoir + caprock) and their feedback with flow modeling.
(2) At increasing time scales, evaluate optimal heterogeneity resolution(s) by comparing the uncertainty analysis outcomes of all models.
• Investigate the effect of increasing reservoir permeability (k) variance and depth on the uncertainty outcomes including optimal heterogeneity resolution(s). At deep depth, investigate gravity-stable injection.
Dept. of Geology & Geophysics, University of Wyoming
5
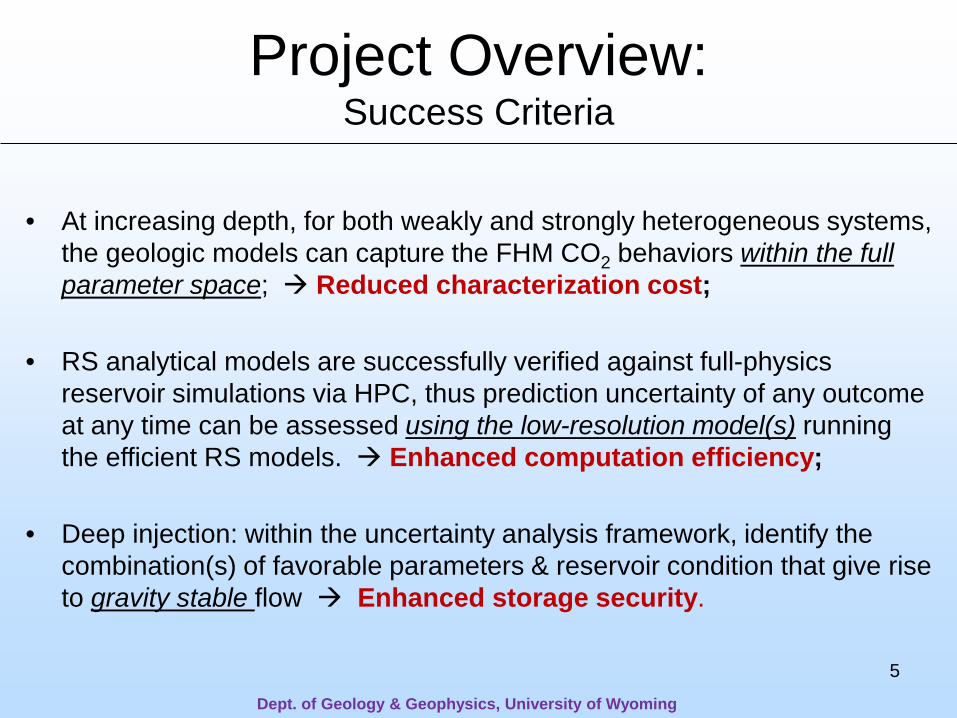
Project Overview: Success Criteria
• At increasing depth, for both weakly and strongly heterogeneous systems, the geologic models can capture the FHM CO2 behaviors within the full parameter space; Reduced characterization cost;
• RS analytical models are successfully verified against full-physics reservoir simulations via HPC, thus prediction uncertainty of any outcome at any time can be assessed using the low-resolution model(s) running the efficient RS models. Enhanced computation efficiency;
• Deep injection: within the uncertainty analysis framework, identify the combination(s) of favorable parameters & reservoir condition that give rise to gravity stable flow Enhanced storage security.
Dept. of Geology & Geophysics, University of Wyoming
Accomplishments to Date • High-resolution 3D reservoir k heterogeneity (3.2 M) &
• A 1-unit homogeneous “formation” model is also created (not shown);
• A homogeneous shale caprock unit is added to all models (not shown);
Dept. of Geology & Geophysics, University of Wyoming
9
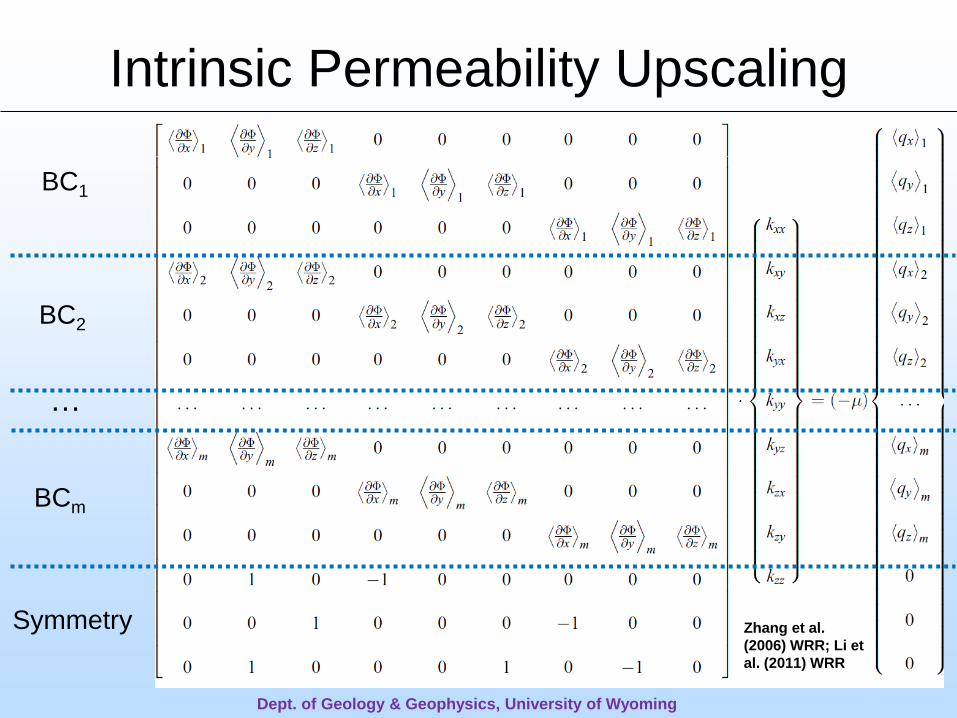
Intrinsic Permeability Upscaling
BC1
BC2
BCm
Symmetry
…
Zhang et al. (2006) WRR; Li et al. (2011) WRR
Dept. of Geology & Geophysics, University of Wyoming
10
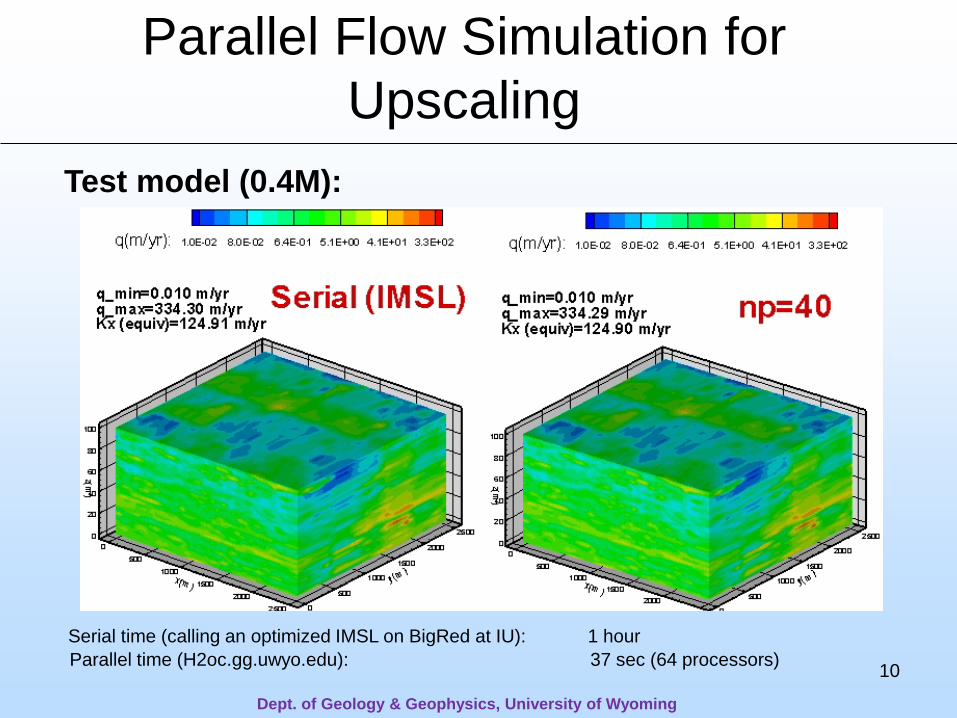
Parallel Flow Simulation for Upscaling
Test model (0.4M):
Serial time (calling an optimized IMSL on BigRed at IU): 1 hour Parallel time (H2oc.gg.uwyo.edu): 37 sec (64 processors)
Dept. of Geology & Geophysics, University of Wyoming
11
Reservoir Fluid Pressure Comparison
Upscaling Verification
Single-phase flow rate prediction error is similar but is slightly smaller than the P prediction errors. For both P and flow rate prediction, the order of increasing accuracy: 1-unit model 3-unit model 8-unit model
Dept. of Geology & Geophysics, University of Wyoming
12
• Global upscaling can homogenize irregularly shaped & hierarchical geologic models with reservoir-scale (long-range) k connectivity;
• Upscaling is successful even for high-variance systems (the highest successfully tested reservoir k varies ~106);
• Parallel HPC can overcome the computational hurdle associated with the global upscaling of large models;
• (poster tomorrow) A dispersivity upscaling analysis is conducted to estimate the effective longitudinal macrodispersivity for each unit of the geologic models, for both the low and high lnk variance systems.
Upscaling Summary
Dept. of Geology & Geophysics, University of Wyoming
13
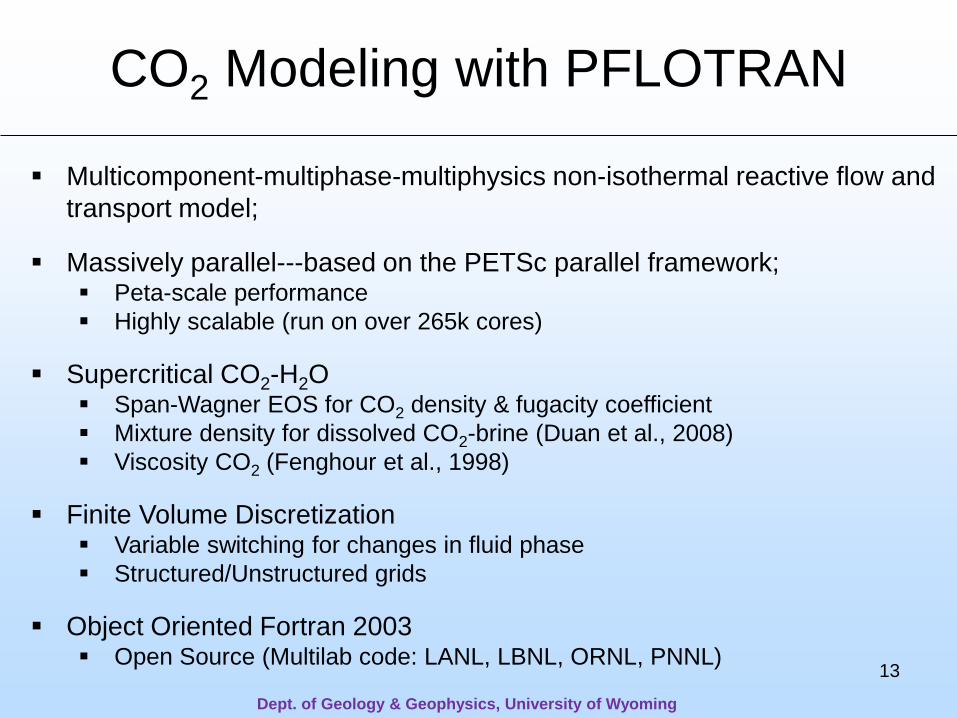
CO2 Modeling with PFLOTRAN
Multicomponent-multiphase-multiphysics non-isothermal reactive flow and transport model;
Massively parallel---based on the PETSc parallel framework; Peta-scale performance Highly scalable (run on over 265k cores)
Supercritical CO2-H2O
Span-Wagner EOS for CO2 density & fugacity coefficient Mixture density for dissolved CO2-brine (Duan et al., 2008) Viscosity CO2 (Fenghour et al., 1998)
Finite Volume Discretization Variable switching for changes in fluid phase Structured/Unstructured grids
Object Oriented Fortran 2003
Open Source (Multilab code: LANL, LBNL, ORNL, PNNL)
Dept. of Geology & Geophysics, University of Wyoming
14
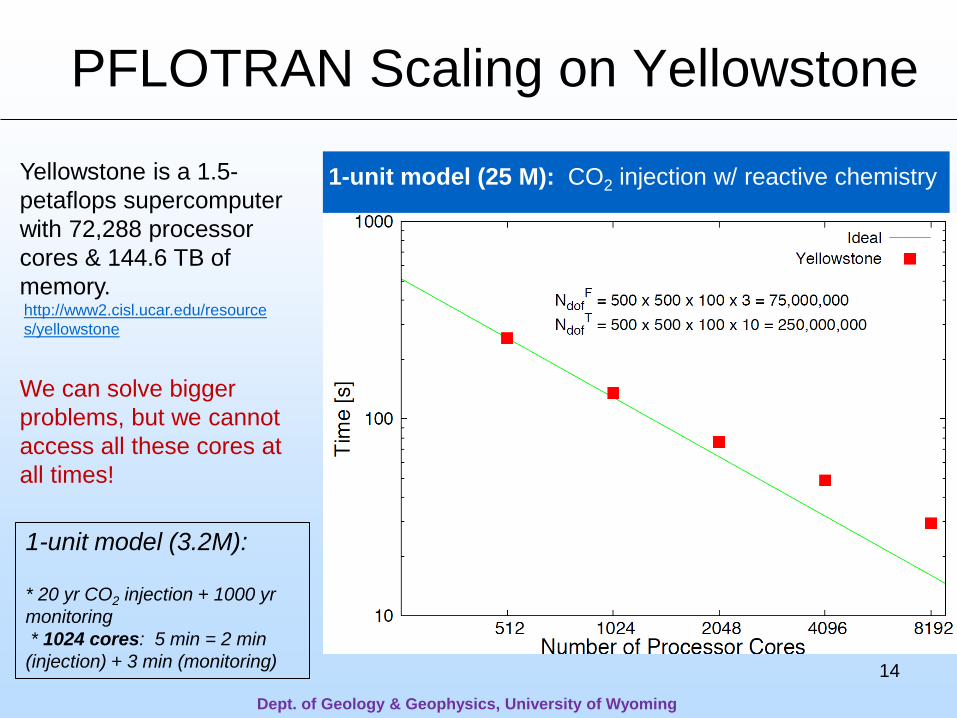
PFLOTRAN Scaling on Yellowstone
1-unit model (3.2M): * 20 yr CO2 injection + 1000 yr monitoring * 1024 cores: 5 min = 2 min (injection) + 3 min (monitoring)
Dept. of Geology & Geophysics, University of Wyoming
Yellowstone is a 1.5-petaflops supercomputer with 72,288 processor cores & 144.6 TB of memory.
We can solve bigger problems, but we cannot access all these cores at all times!
http://www2.cisl.ucar.edu/resources/yellowstone
1-unit model (25 M): CO2 injection w/ reactive chemistry
CO2 Simulation: FHM v. 1-Unit Model Dissolved CO2 at the end of monitoring (inj rate= 0.05 Mt/yr):
Dept. of Geology & Geophysics, University of Wyoming
5km
5km 40
0 m
aquifer k varies over 5 orders of magnitude
• Under both low and high variance conditions, the 1-unit model can capture the plume footprint (see above) and fluid pressure (Appendix) of the FHM very well.
• Base on results of the upscaling study, the 8-unit and 3-unit models should yield more accurate CO2 predictions than the 1-unit model yet to be simulated.
16
End of Monitoring: Iso_conc = 0.004
Var(lnk)=4.5
FHM FHM
1-Unit
Var(lnk)=0.1
1-Unit
17
Dept. of Geology & Geophysics, University of Wyoming
• Under low variance, the 1-unit model can capture the dissolved CO2 well;
• Under high variance, the 1-unit model over-estimates the dissolved CO2 because the equivalent kz is high faster density-driven convection more CO2 dissolved per unit time;
• Under high variance, how accurate are the 8-unit and 3-unit models remain to be seen.
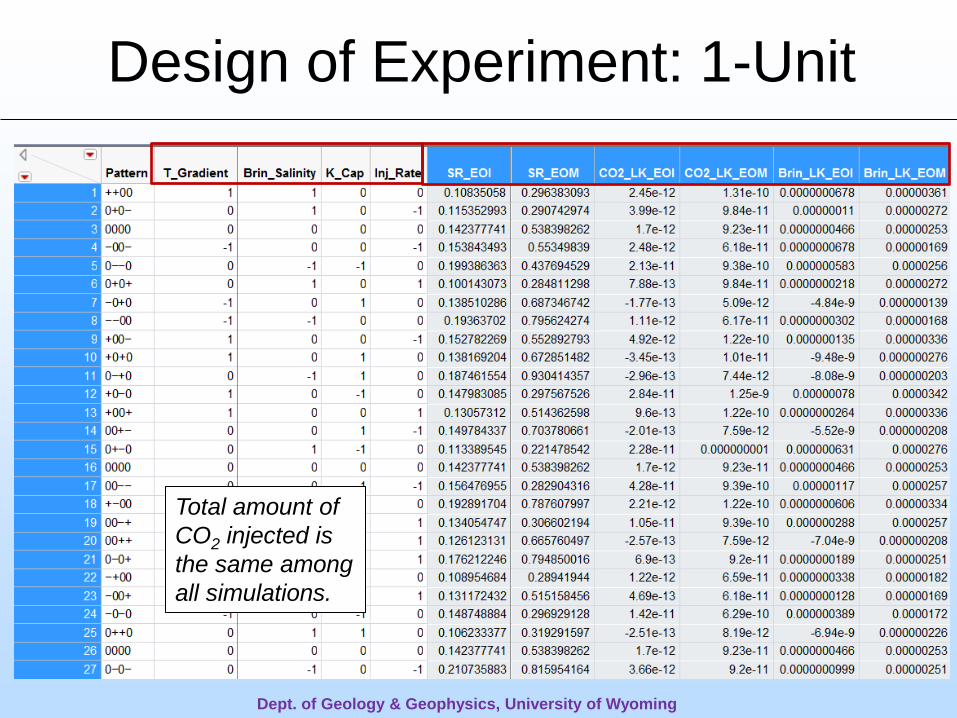
Design of Experiment: 1-Unit
18
Dept. of Geology & Geophysics, University of Wyoming
Total amount of CO2 injected is the same among all simulations.
19
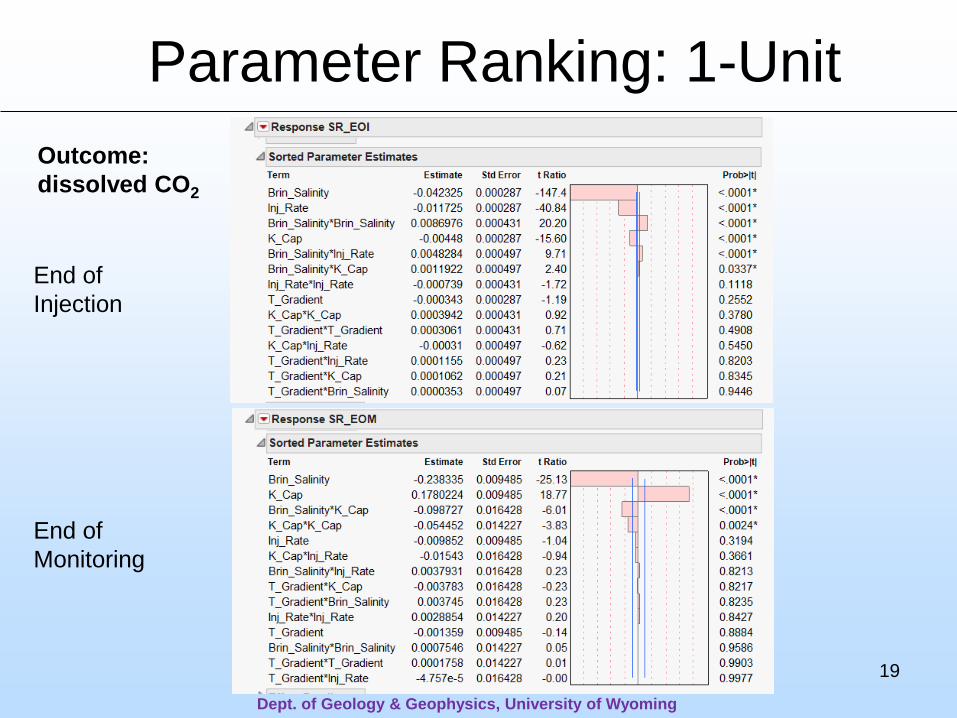
Parameter Ranking: 1-Unit
Dept. of Geology & Geophysics, University of Wyoming
End of Injection
End of Monitoring
Outcome: dissolved CO2
20
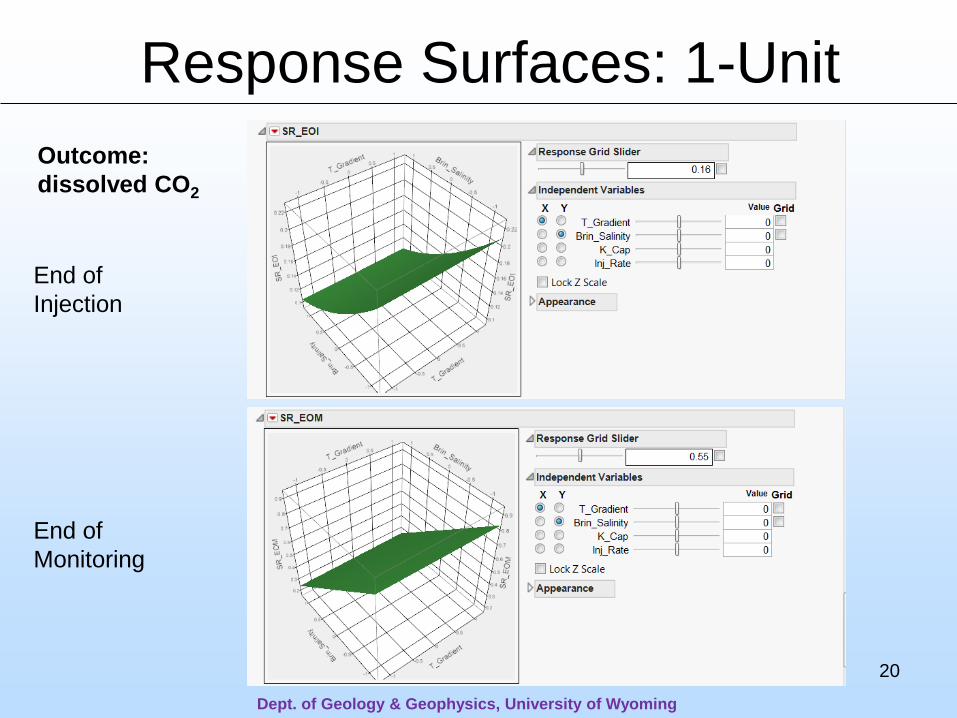
Response Surfaces: 1-Unit
Dept. of Geology & Geophysics, University of Wyoming
Outcome: dissolved CO2
End of Injection
End of Monitoring
Summary • Global upscaling computes equivalent ks for the geologic model with decreasing
heterogeneity resolution; for increasing reservoir lnk variances (0.1, 1.0, 4.5), FHM pressure and flow rate are captured well by the geologic models, but errors increase with variance.
• (poster) Upscaled dispersivities for the 8-, 3-, and 1-unit models can capture plume moments (centroid, longitudinal plume covariance, BTC) when variance is low to modest.
• When the variance of ln(k) is low, the 1-unit model yields very similar reservoir fluid pressure, plume footprint, and dissolution fingering as the FHM. It thus accurately predicts the total dissolution storage at the end of the simulation time.
• When the variance of ln(k) is high, the 1-unit model yields similar reservoir fluid pressure (slight increase in error) and plume footprint as the FHM, but predicts more dissolution fingering per unit time (more optimistic storage estimate).
• Preliminary experimental design analysis suggests that brine salinity is the single most influential factor impacting CO2 dissolution storage in the 1-unit model.
• Next step: For low and high variance systems, complete the DoE and RS analysis for all models to compare their parameter sensitivity & prediction uncertainty.
21
Dept. of Geology & Geophysics, University of Wyoming
Appendix – These slides will not be discussed during the
presentation, but are mandatory
22
Dept. of Geology & Geophysics, University of Wyoming
23
Organization Chart
US DOE: Program Manager
Project Coordinator:
Ye Zhang
GCS Uncertaintly Analysis: Mingkan Zhang
PFLOTRAN & Reacive Transport
Modeling: Peter Lichtner
Sedimentary Model Interprestation: Mingkan Zhang
WRPC Director: Davona
Douglass
Authorized UW Representative: Dorothy Yates
Dept. of Geology & Geophysics, University of Wyoming
24
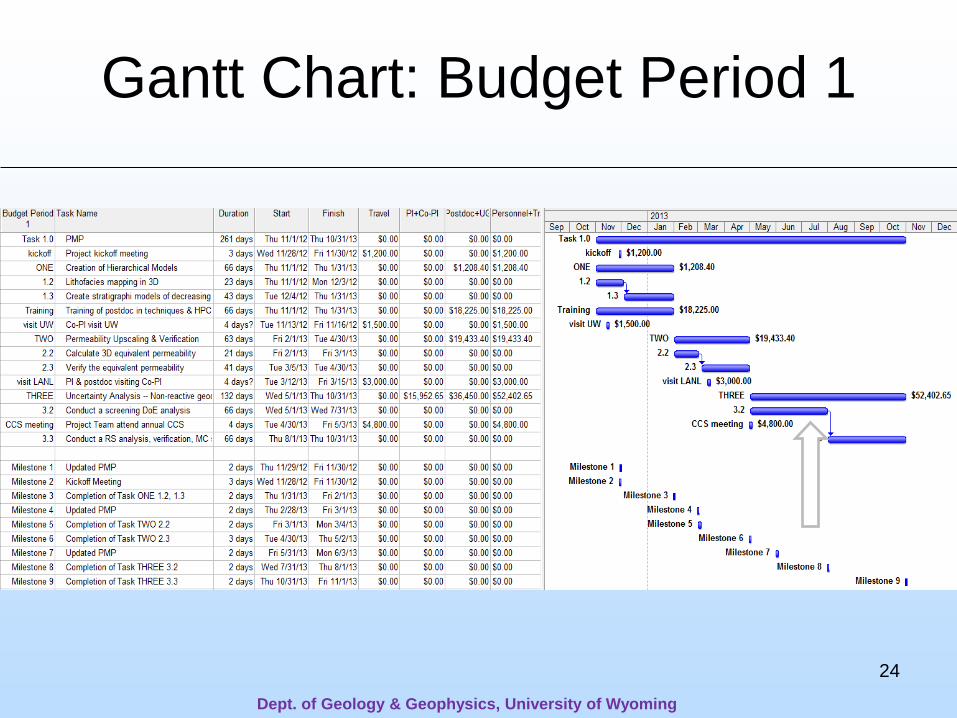
Gantt Chart: Budget Period 1
Dept. of Geology & Geophysics, University of Wyoming
25
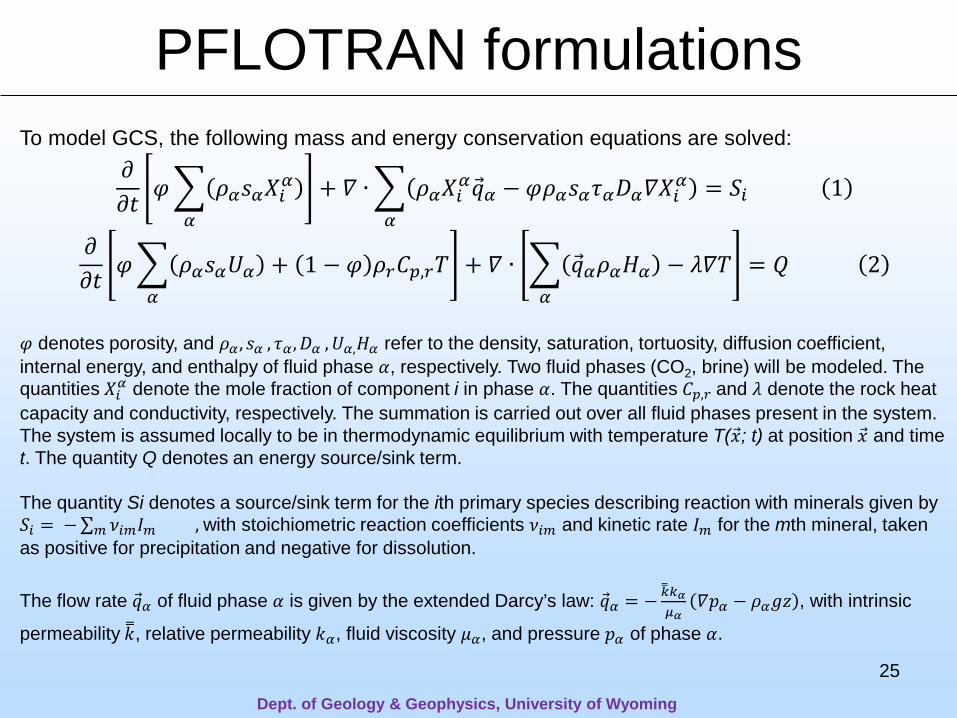
PFLOTRAN formulations To model GCS, the following mass and energy conservation equations are solved:
𝜑𝜑 denotes porosity, and 𝜌𝜌𝛼𝛼 , 𝑠𝑠𝛼𝛼 , 𝜏𝜏𝛼𝛼 ,𝐷𝐷𝛼𝛼 ,𝑈𝑈𝛼𝛼,𝐻𝐻𝛼𝛼 refer to the density, saturation, tortuosity, diffusion coefficient, internal energy, and enthalpy of fluid phase 𝛼𝛼, respectively. Two fluid phases (CO2, brine) will be modeled. The quantities 𝑋𝑋𝑖𝑖𝛼𝛼 denote the mole fraction of component i in phase 𝛼𝛼. The quantities 𝐶𝐶𝑝𝑝,𝑟𝑟 and 𝜆𝜆 denote the rock heat capacity and conductivity, respectively. The summation is carried out over all fluid phases present in the system. The system is assumed locally to be in thermodynamic equilibrium with temperature T(�⃗�𝑥; t) at position �⃗�𝑥 and time t. The quantity Q denotes an energy source/sink term. The quantity Si denotes a source/sink term for the ith primary species describing reaction with minerals given by 𝑆𝑆𝑖𝑖 = −∑ 𝜈𝜈𝑖𝑖𝑖𝑖𝐼𝐼𝑖𝑖 , 𝑖𝑖 with stoichiometric reaction coefficients 𝜈𝜈𝑖𝑖𝑖𝑖 and kinetic rate 𝐼𝐼𝑖𝑖 for the mth mineral, taken as positive for precipitation and negative for dissolution. The flow rate �⃗�𝑞𝛼𝛼 of fluid phase 𝛼𝛼 is given by the extended Darcy’s law: �⃗�𝑞𝛼𝛼 = −𝑘𝑘�𝑘𝑘𝛼𝛼
𝜇𝜇𝛼𝛼𝛻𝛻𝑝𝑝𝛼𝛼 − 𝜌𝜌𝛼𝛼𝑔𝑔𝑔𝑔 , with intrinsic
permeability 𝑘𝑘�, relative permeability 𝑘𝑘𝛼𝛼, fluid viscosity 𝜇𝜇𝛼𝛼, and pressure 𝑝𝑝𝛼𝛼 of phase 𝛼𝛼.
Dept. of Geology & Geophysics, University of Wyoming
26
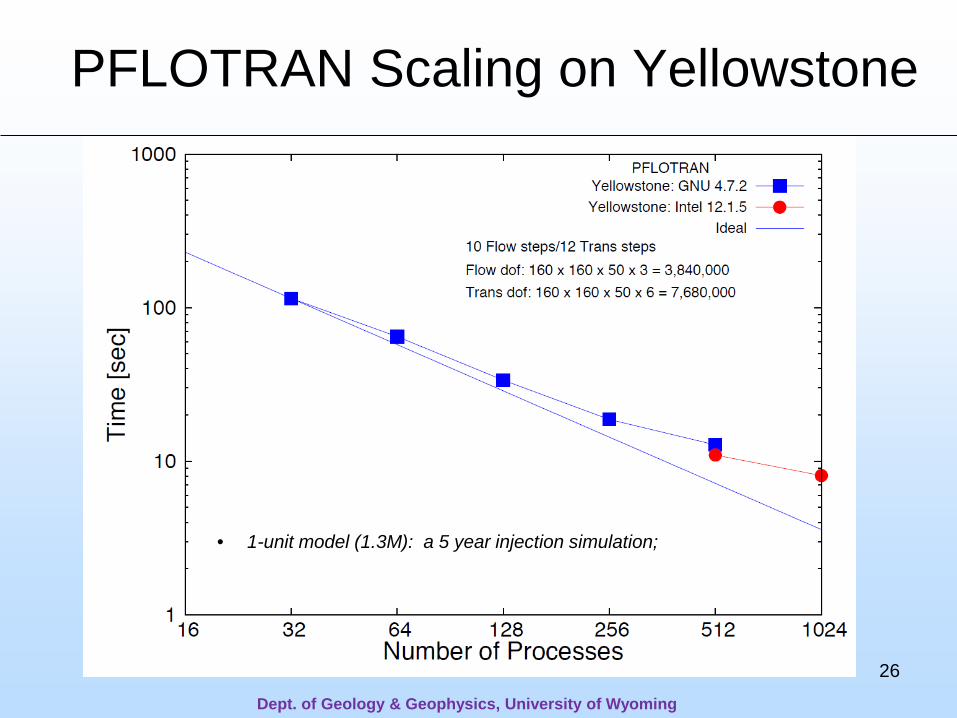
PFLOTRAN Scaling on Yellowstone
• 1-unit model (1.3M): a 5 year injection simulation;
Dept. of Geology & Geophysics, University of Wyoming
27
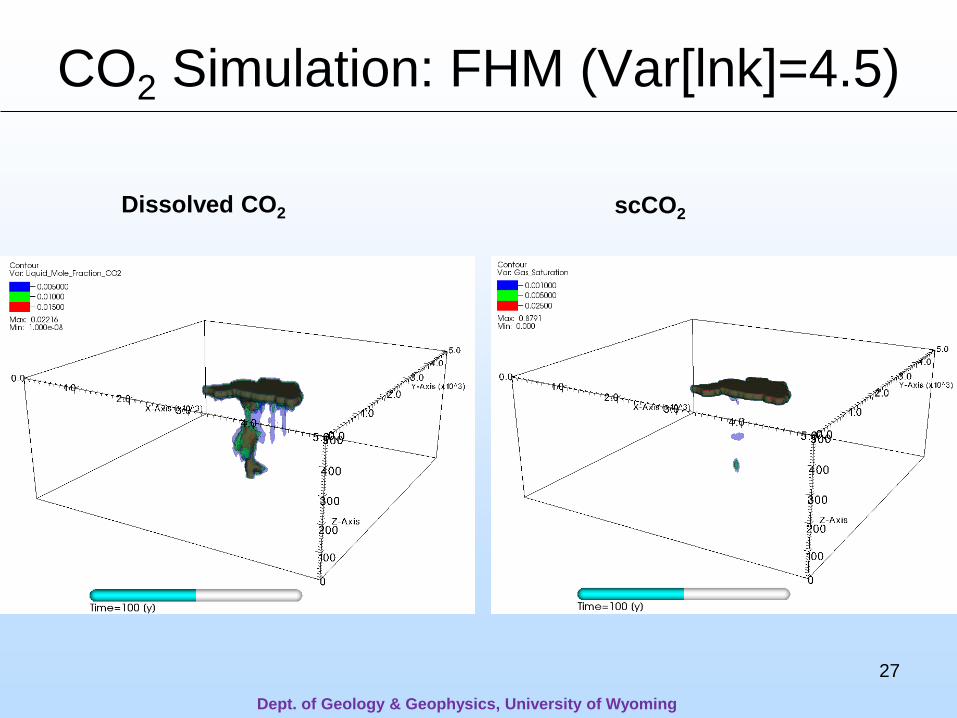
Dissolved CO2 scCO2
Dept. of Geology & Geophysics, University of Wyoming
CO2 Simulation: FHM (Var[lnk]=4.5)
28
FHM v. 1-Unit Model: σ2lnk=0.1
t (year)
p(×
107
Pa)
100 101 102 1032.187
2.188
2.189
2.19
2.191
1unitFHM
[2510, 2510, 205]
t (year)
p(×
107
Pa)
100 101 102 1031.954
1.96
1.966
1.972
1unitFHM
Dept. of Geology & Geophysics, University of Wyoming
[2510, 2510, 445]
t (year)
p(×
107
Pa)
100 101 102 1032.0918
2.0919
2.092
2.0921
2.09221unitFHM
[2510, 2510, 305]
t (year)
p(×
107
Pa)
100 101 102 1032.004
2.008
2.012
2.016
1unitFHM
[2510, 2510, 395]
relative error = 0.2%
29
FHM v. 1-Unit Model: σ2lnk=4.5
t (year)
p(×
107
Pa)
100 101 102 1032.188
2.189
2.19
1unitFHM
t (year)
p(×
107
Pa)
100 101 102 1032.004
2.008
2.012
2.016
1unitFHM
relative error =0.5%
t (year)
p(×
107
Pa)
100 101 102 1032.0918
2.0919
2.092
2.0921
2.09221unitFHM
t (year)
p(×
107
Pa)
100 101 102 1031.954
1.96
1.966
1.972
1.978 1unitFHM
[2510, 2510, 205]
[2510, 2510, 445]
[2510, 2510, 305]
[2510, 2510, 395]
Dept. of Geology & Geophysics, University of Wyoming
Potential Causes for Delay
CISL Daily Bulletin - August 19, 2013:
Yellowstone InfiniBand recabling set to start Monday, September 30
CISL, IBM, and Mellanox have set Monday, September 30, as the start date for the process of replacing the Yellowstone InfiniBand cables, previously announced in July. Users should plan for Yellowstone being out of service for up to three weeks from that date.