34
2012 Business Optimization Conference Kuala Lumpur, Malaysia Optimizing a World-Scale Petrochemical Plant Uberne A. Tapia

2012 Business Optimization Conference Kuala Lumpur, Malaysia
Optimizing a World-Scale Petrochemical Plant
Uberne A. Tapia
2 2012 Business Optimization Conference
Agenda
• The need for Optimization
• RPMS Project Implementation Methodology
• RPMS Solution Blue Print
• RPMS Model Development
• RPMS Model Validation & Calibration
• Benefits
• Next Steps

3 2012 Business Optimization Conference
Petrochemical Complex - Process Flow Diagram

4 2012 Business Optimization Conference
Olefins Unit – Feedstock Slate

5 2012 Business Optimization Conference
Petrochemical – Product Profile

6 2012 Business Optimization Conference
Why Do We Need an Optimization Model?
131
491
93
480
368
92
0
100
200
300
400
500
Jul-9
4
Jan-
95
Jul-9
5
Jan-
96
Jul-9
6
Jan-
97
Jul-9
7
Jan-
98
Jul-9
8
Jan-
99
Jul-9
9
Jan-
00
Jul-0
0
Jan-
01
Jul-0
1
Jan-
02
Jul-0
2
Jan-
03
Fe
ed
sto
ck P
rice
s0.00
0.05
0.10
0.15
0.20
Ethane Propane Naphtha
$/LB$/MT
Flexibility
Different Feedstocks
Many Furnaces
Price Volatility
Furnace availability
Equipment limits
Product demand
Feedstock availability
Constraints
7 2012 Business Optimization Conference
Polyethylene
ETHYLENE
UNIT
PY-GAS
TREATER UNIT
POLYETHYLENE
UNIT
POLYPROPYLENE
UNIT
HEXANE UNIT
OXYGEN
PLANT
ETHYLENE GLYCOL UNIT
ACETALDEHYDE
UNIT
ACRYLONITRILE
UNIT
POWER PLANT
Ethylene
Propylene PROPYLENE
ETHYLENE
PROPYLENE
LPG
Mix C4 LPG
MIX C 4
Irregular PP
Fiber PP
Plastic PP
RAFFINATE
HEXANE Hexane
Solvent Naphtha
Fuel Gas
Trtd. Gasoline
AIR AMMONIA
COMBUSTIBLE
GAS
Water Hydrogen Cyanide
Acetonitrile Acrylonitrile
AIR
OXYGEN
ETHYLENE
NITROGEN Nitrogen
OXYGEN
ETHYLENE
Ethylene Oxide
Acetaldehyde
Crotonaldehyde
ETHYLENE
OXIDE PLANT
WATER MEG
DEG
NAPHTHA
GAS OIL
Hydrogen
RESIDUAL NAPHTHA
HYDROGEN
CRACKED GASOLINE HYDROGEN
Electricity
RE
CY
CL
E
LP
G
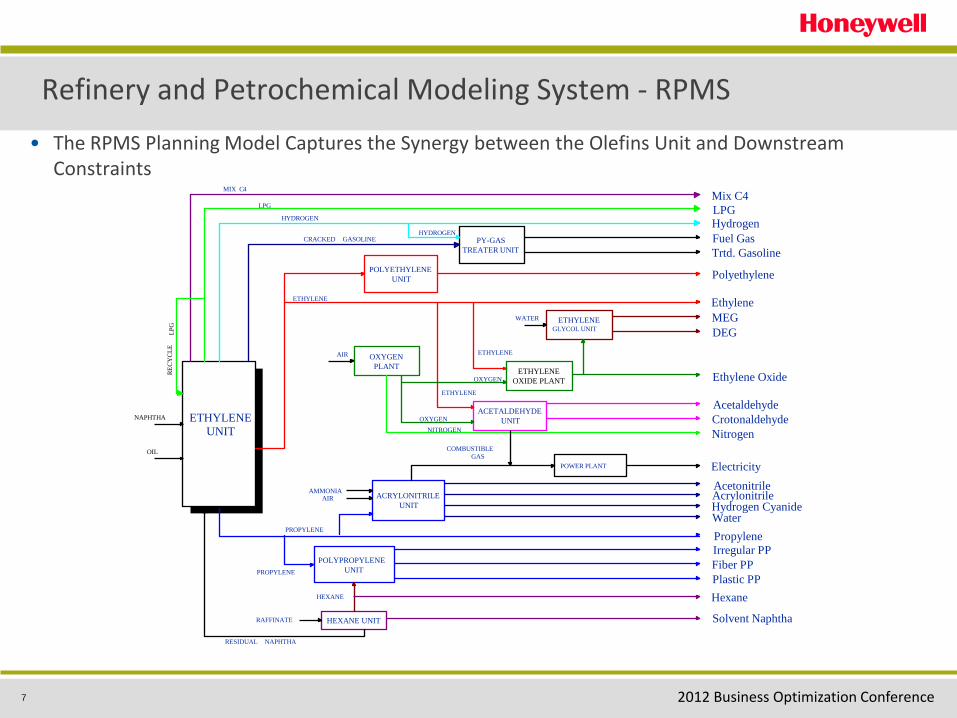
Refinery and Petrochemical Modeling System - RPMS
• The RPMS Planning Model Captures the Synergy between the Olefins Unit and Downstream Constraints

8 2012 Business Optimization Conference
Project Goal
• Lower unit manufacturing cost – Improve feedstock selection and evaluation – Explore variable feedstocks
• Improve plant asset utilization – Furnace severity optimization – Physical and quality constraints – Recycles – Inventory management
• Reduce losses – Performance monitoring (Plan versus Actual)
• Planning for market positioning – Strategic planning, budgeting – Identify highest margin products / Make the right product at the right
time

9 2012 Business Optimization Conference
Agenda
• The need for Optimization
• RPMS Project Implementation Methodology
• RPMS Solution Blue Print
• RPMS Model Development
• RPMS Model Validation & Calibration
• Benefits
• Next Steps

10 2012 Business Optimization Conference
RPMS Project Implementation Methodology
• Phase I - RPMS Model Building
– RPMS Solution Blue Print
– Develop RPMS Model
• Phase II - RPMS Model Fine Tuning
– RPMS Model Validation & Calibration
– RPMS Commissioning
11 2012 Business Optimization Conference
Agenda
• The need for LP Optimization
• RPMS Project Implementation Methodology
• RPMS Solution Blue Print
• RPMS Model Development
• RPMS Model Validation & Calibration
• Benefits
• Next Steps

12 2012 Business Optimization Conference
RPMS Solution Blue Print
• To work with the Customer ‘s resources to define & describe in a common data repository all the activities relevant to the Petrochemical Facility that may have an economic impact in the RPMS LP model
– Inputs / Outputs
– Furnaces : Hot & Cold Section
– Downstream Processing : EG-1, HDPE, LLDPE, PP, Butene-1, and BTX
– Utilities
• The RPMS Solution Blue Print contains the “Plant Knowledge” used to built the RPMS model for the Olefin Complex, Downstream Processing and Utilities

13 2012 Business Optimization Conference
RPMS Solution Blue Print - Furnaces

14 2012 Business Optimization Conference
Agenda
• The need for Optimization
• RPMS Project Implementation Methodology
• RPMS Solution Blue Print
• RPMS Model Development
• RPMS Model Validation & Calibration
• Benefits
• Next Steps
15 2012 Business Optimization Conference
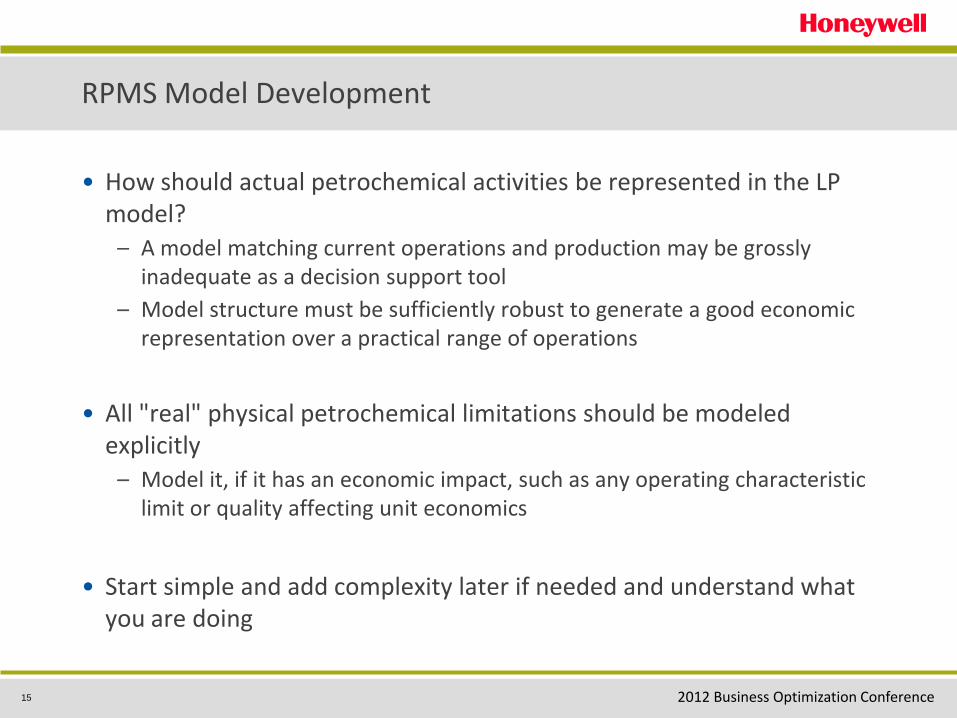
RPMS Model Development
• How should actual petrochemical activities be represented in the LP model?
– A model matching current operations and production may be grossly inadequate as a decision support tool
– Model structure must be sufficiently robust to generate a good economic representation over a practical range of operations
• All "real" physical petrochemical limitations should be modeled explicitly
– Model it, if it has an economic impact, such as any operating characteristic limit or quality affecting unit economics
• Start simple and add complexity later if needed and understand what you are doing

16 2012 Business Optimization Conference
Use of SPYRO
• Yield prediction program that provides a simulation software for modeling the ethylene Pyrolysis reactors
– It accepts any hydrocarbon feedstock from ethane through distillates up to 350 C (662 F) ASTM D-86 endpoint
– Produces an accurate, detailed analysis of product yields, furnace performance and coking rates for any feedstock or mixture (co-cracking)
• SPSL – SPYRO for Planning and Scheduling Optimization
– Extension to SPYRO
– Allows the reactor model to be called directly from a third-party optimization tool such as RPMS
– The model is accessed via a FORTRAN subroutine call SPSL(FNAM,SPYIN,DSPYIN,SPYOUT,DSPYOUT,IRET)
• SPSL must be configured with furnace geometry prior to using it

17 2012 Business Optimization Conference
Furnace Model Development Using SPYRO SPSL
• Define Furnaces Operation Modes (e.g. ethane or propane) and Mapping of SPSL Effluent Yields & RPMS
• Create BASE Vector – Using SPSL
– BASE Detailed Feed Composition
– BASE Operating Conditions (Conversion, COT, LOAD, S/HC, COP)
• Create DELTA Vectors (Partial Derivatives) – Using SPSL
– Provide perturbation step size for a Detailed Feed Composition variable in the corresponding input array of DSPYIN
– Provide perturbation step size for Operating Conditions variables (Conversion, COT, LOAD) in corresponding input array of DSPYIN
• Define / Model Operating Range for Operating Conditions – Conversion, COT, LOAD, ….
• Model Furnaces Capacities & Utilities (Fuel, Steam)

18 2012 Business Optimization Conference
SPSL Effluent & RPMS Mapping
• From 128 components in effluent exiting the furnaces to 40 consolidated components in RPMS
• Material and properties codes corresponding to each component in RPMS are defined and mapped to SPYRO codes
• Properties are automatically tracked and error is distributed properly

19 2012 Business Optimization Conference
RPMS – Furnace Model Development
S
P
S
L
(FNAM,
SPYIN,
DSPYIN,
DSPYOUT),
IRET)

20 2012 Business Optimization Conference
RPMS – Furnace Model Development
S
P
S
L
(FNAM,
SPYIN,
DSPYIN,
DSPYOUT),
IRET)

21 2012 Business Optimization Conference
RPMS Olefins Unit Furnaces
• Represented based on SPYRO SPSL simulation runs and Customer technical
knowledge as discussed in the RPMS Solution Blue Print
− Effluent furnaces yields are dynamically adjusted as a function of changes in
the feed composition and conversion simultaneously

22 2012 Business Optimization Conference
RPMS Dynamic & Static Model Structures
INPUTS
Demand Data: Products Demand,
price &
specifications
Supply Data:
Feedstocks
Availability,
cost & composition
Other Input
−Inventory
−Process Unit
Capacities
−Planned
shutdowns /
slowdowns
OUTPUT
Profit
Product Mix &
Marginal
Values
Incremental
Opportunities
Process Units
Utilization &
Operating
Parameters –
Conversion
Blending
Recipes
Utilities Inventory

23 2012 Business Optimization Conference
RPMS Graphical Representation
24 2012 Business Optimization Conference
Agenda
• The need for Optimization
• RPMS Project Implementation Methodology
• RPMS Solution Blue Print
• RPMS Model Development
• RPMS Model Validation & Calibration
• Benefits
• Next Steps

25 2012 Business Optimization Conference
RPMS Model Validation & Calibration
• To confirm that the RPMS model structure represents the Customer operating facilities in terms of key operating variables and economic drivers
• To verify that the model's structural integrity remains intact when subjected to expected and reasonable deviations from typical operation

26 2012 Business Optimization Conference
Model Validation & Calibration Approach & Objective
• Approach : Use of the Backcasting Technique
– To investigate LP process unit variances against actual plant data
– To understand and determine whether this variances are due to poor actual data or an inaccurate LP model so that “corrective actions (e.g. recovery factors and yields correction, etc) can be taken”
• Objective
– The LP should performs with accuracy of +/- 3% versus Actual Petrochemical Complex data

27 2012 Business Optimization Conference
Model Validation & Calibration - LP vs. Actual Results
• Ethylene production within 1.024% of actual data
• Propylene production within 0.70% of actual data
• MC4 Mix within -0.31% of actual data
• Derivates production within the overall +/- 3% of actual data

28 2012 Business Optimization Conference
Agenda
• The need for Optimization
• RPMS Project Implementation Methodology
• RPMS Solution Blue Print
• RPMS Model Development
• RPMS Model Validation & Calibration
• Benefits
• Next Steps

29 2012 Business Optimization Conference
How Are Benefits Achieved
• The RPMS LP model quickly and effectively provides optimal plans that respect operational constraints while meeting market supply and demand constraints
– Compare actual and planned plant performance to improve planning
– Enable business investment decisions to be evaluated and compared

30 2012 Business Optimization Conference
• Feedstock Selection
– Flexibility in feed stock purchase alternatives provides a high margin return
• Operations Planning
– Furnace severity optimization
– Constraint and recycle optimization
– Utility consumption/production optimization
• Unit Optimization
– What is the value of being 5% off on yield predictions?
– What is the value of being off 1% on optimum conversion?
– What is the value of being off on fractionation targets?
Economic Benefits

31 2012 Business Optimization Conference
Benefits
• Realization that is more economically to operate the ethane and propane furnaces at a lower conversion than a higher conversion as it was done previously by operations
– Saving of around 5% of the Objective Function
• Understanding of the economics implications when re-routing streams to a lower value disposition
– Sending MC4 to Fuel implies a decreased of 0.6% of the Objective Function
• Change in “operational philosophy” from Tons/day to $/day
• Customer on the proper path to increase the site variable margin by a minimum of 2% - this value shall ensure a project payback well under one year

32 2012 Business Optimization Conference
Agenda
• The need for Optimization
• RPMS Project Implementation
• RPMS Solution Blue Print
• RPMS Model Development
• RPMS Model Validation & Calibration
• Benefits
• Next Steps

33 2012 Business Optimization Conference
Further Expand Solution - The Supply Chain Challenges

34 2012 Business Optimization Conference
Next Steps
• Improve the Technical and Financial Level knowledge of the company personnel.
• Increase the available tools to check in forecasted financial values and operational plants targets against real complex data to maximize net profits – Performance Monitoring using Production Analyst
• Marriage between APC applications and LP software package could improve further financial benefits
• Increase the level of understanding of the overall SABIC complexes from a technical, operational and financial perspective - SABIC global optimization


