1 OTAY WATER DISTRICT SPECIAL MEETING OF THE BOARD OF DIRECTORS DISTRICT BOARDROOM 2554 SWEETWATER SPRINGS BOULEVARD SPRING VALLEY, CALIFORNIA MONDAY May 21, 2018 3:00 P.M. AGENDA 1. ROLL CALL 2. PLEDGE OF ALLEGIANCE 3. APPROVAL OF AGENDA 4. PUBLIC PARTICIPATION – OPPORTUNITY FOR MEMBERS OF THE PUBLIC TO SPEAK TO THE BOARD ON ANY SUBJECT MATTER WITHIN THE BOARD'S JURISDICTION BUT NOT AN ITEM ON TODAY'S AGENDA WORKSHOP 5. ADOPT RESOLUTION NO. 4348 ALLOWING FOR THE REIMBURSEMENT OF CERTAIN EXPENDITURES FROM THE PROCEEDS OF THE WATER DEBT OB- LIGATIONS OF THE DISTRICT, ANTICIPATED TO BE ISSUED DURING 2018 (FAKHOURI) 6. ADOPT RESOLUTION NO. 4345 TO APPROVE THE FY 2018-2019 OPERATING AND CAPITAL BUDGET; APPROVE FUND TRANSFERS FOR POTABLE, RECY- CLED, AND SEWER; ADOPT THE SALARY SCHEDULE; APPROVE THE WATER RATES; ADOPT ORDINANCE NO. 567 AMENDING THE CODE OF ORDINANC- ES SECTION 25, CONDITIONS FOR WATER SERVICE INCLUDING APPENDIX A, WITH THE APPROVED WATER RATE CHANGES, EFFECTIVE JANUARY 1, 2019; DIRECT STAFF TO DRAFT AND MAIL WATER RATE INCREASE NOTICES FOR POTABLE AND RECYCLED WATER CUSTOMERS; AND DIRECT STAFF TO DRAFT AND MAIL PROPOSITION 218 RATE DECREASE NOTICES TO SEWER CUSTOMERS (KOEPPEN) 7. ADJOURNMENT
Transcript
1
OTAY WATER DISTRICT
SPECIAL MEETING OF THE BOARD OF DIRECTORS DISTRICT BOARDROOM
2554 SWEETWATER SPRINGS BOULEVARD
SPRING VALLEY, CALIFORNIA
MONDAY May 21, 2018
3:00 P.M.
AGENDA 1. ROLL CALL 2. PLEDGE OF ALLEGIANCE 3. APPROVAL OF AGENDA 4. PUBLIC PARTICIPATION – OPPORTUNITY FOR MEMBERS OF THE PUBLIC TO
SPEAK TO THE BOARD ON ANY SUBJECT MATTER WITHIN THE BOARD'S JURISDICTION BUT NOT AN ITEM ON TODAY'S AGENDA
WORKSHOP 5. ADOPT RESOLUTION NO. 4348 ALLOWING FOR THE REIMBURSEMENT OF
CERTAIN EXPENDITURES FROM THE PROCEEDS OF THE WATER DEBT OB-LIGATIONS OF THE DISTRICT, ANTICIPATED TO BE ISSUED DURING 2018 (FAKHOURI)
6. ADOPT RESOLUTION NO. 4345 TO APPROVE THE FY 2018-2019 OPERATING AND CAPITAL BUDGET; APPROVE FUND TRANSFERS FOR POTABLE, RECY-CLED, AND SEWER; ADOPT THE SALARY SCHEDULE; APPROVE THE WATER RATES; ADOPT ORDINANCE NO. 567 AMENDING THE CODE OF ORDINANC-ES SECTION 25, CONDITIONS FOR WATER SERVICE INCLUDING APPENDIX A, WITH THE APPROVED WATER RATE CHANGES, EFFECTIVE JANUARY 1, 2019; DIRECT STAFF TO DRAFT AND MAIL WATER RATE INCREASE NOTICES FOR POTABLE AND RECYCLED WATER CUSTOMERS; AND DIRECT STAFF TO DRAFT AND MAIL PROPOSITION 218 RATE DECREASE NOTICES TO SEWER CUSTOMERS (KOEPPEN)
7. ADJOURNMENT
2
All items appearing on this agenda, whether or not expressly listed for action, may be deliberated and may be subject to action by the Board. The Agenda, and any attachments containing written information, are available at the District’s website at www.otaywater.gov. Written changes to any items to be considered at the open meeting, or to any attachments, will be posted on the District’s website. Copies of the Agenda and all attachments are also available through the District Secretary by contacting her at (619) 670-2280.
If you have any disability which would require accommodation in order to enable you to participate in this meeting, please call the District Secretary at 670-2280 at least 24 hours prior to the meeting.
Certification of Posting
I certify that on May 17, 2018, I posted a copy of the foregoing agenda near the regular meeting place of the Board of Directors of Otay Water District, said time being at least 24 hours in advance of the special meeting of the Board of Directors (Government
Code Section §54954.2).
Executed at Spring Valley, California on May 17, 2018. /s/ Susan Cruz, District Secretary
TYPE MEETING: Budget Workshop MEETING DATE: May 21, 2018
SUBMITTED BY: Eid Fakhouri, Finance Manager
W.O./G.F. NO: DIV. NO. All
APPROVED BY:
Joseph R. Beachem, Chief Financial Officer
Mark Watton, General Manager
SUBJECT: Adopt Resolution No. 4348 Allowing for Reimbursement of Certain Expenditures from the Proceeds of the Water Debt Obligations of the District, Anticipated to be Issued During 2018
GENERAL MANAGER’S RECOMMENDATION: That the Board adopt Resolution No. 4348 allowing for the reimbursement of certain expenditures from the proceeds of the water debt obligations (the “Obligations”) of the District, anticipated to be issued during 2018. PURPOSE: To present for the Board’s consideration the adoption of Resolution No. 4348 declaring the District’s intent to reimburse certain expenditures from the proceeds of the Obligations. ANALYSIS: The District anticipates the issuance of the Obligations during 2018 to finance an amount not to exceed $35 million with issuance costs of approximately $450,000. The District anticipates a debt issuance of approximately $30.3 million in 2018 to pay for water capital improvement projects over the next three fiscal years. The Resolution declares the intent of the District to reimburse itself from the proceeds of the Obligations for any qualifying expenditures incurred prior to the issuance of the Obligations. It should be noted that the U.S. Tax Code allows the District to reimburse itself for any such expenditures incurred within the 60 days prior to the adoption of the Resolution.
tita.ramos-krogman
Typewritten Text
AGENDA ITEM 5
Staff anticipates applying funds from its General Fund, from its capital reserves, and other legally available sources, to pay for expenditures that become due prior to the issuance of the Obligations. The Resolution will allow the District to reimburse its General Fund and other capital reserves. This reimbursement Resolution also assists the District in meeting the arbitrage spend-down requirements. Treasury and Internal Revenue Code Regulations require adoption of the Resolution as an “official action”, which then qualifies the District to reimburse itself upon the issuance of tax exempt debt. The adoption of the attached Resolution, however, does not irrevocably bind the District to issue the Obligations. It merely states the District’s current intent to do so at some future date and preserves the District’s right to reimburse itself for qualified expenditures. To assist with the decision making staff has brought in a Municipal Advisor to assist the District in understanding the bond issuance process along with the benefits of using debt obligations to fund water CIP projects. Additionally, with the issuing of this debt, this frees up reserves to pay down some of the CalPERS related obligations and the advisor will be providing analysis to ensure the District makes good financial decisions for our rate payers. FISCAL IMPACT: Joe Beachem, Chief Financial Officer
The potential reimbursement of $35 million in CIP expenditures will assist the District in maintaining its operating and capital reserve levels in accordance with the District’s Reserve Policy. STRATEGIC GOAL: The District ensures its continued financial health through long-term financial planning and debt planning. LEGAL IMPACT: None. General Manager
Attachments:
A) Resolution No. 4348 B) Municipal Advisor Report
RESOLUTION NO. 4348
RESOLUTION OF THE BOARD OF DIRECTORS OF THE OTAY WATER DISTRICT REGARDING ITS
INTENTION TO ISSUE TAX-EXEMPT OBLIGATIONS FOR VARIOUS WATER PROJECTS
WHEREAS, the Otay Water District is a municipal water district duly organized and existing under and pursuant to the Constitution and laws of the State of California (the “District”); and
WHEREAS, the Board of Directors of the District (the “Board”) desires to finance the costs of acquiring and constructing certain capital facilities, improvements and equipment, as provided in Exhibit A attached hereto and incorporated herein (the “Project”); and
WHEREAS, the District intends to finance the costs of the Project, or portions of the Project, with the proceeds of the sale of obligations, the interest on which is excluded from gross income for federal income tax purposes (the “Obligations”); and
WHEREAS, prior to the issuance of the Obligations, the District expects to incur certain expenditures with respect to the Project from available monies of the District, which expenditures are desired to be reimbursed by the District from a portion of the proceeds of the sale of the Obligations; and
NOW, THEREFORE, the Board of Directors of the Otay Water District does hereby resolve as follows:
Section 1. The District hereby states its intention and reasonably expects to reimburse Project costs incurred prior to the issuance of the Obligations with proceeds of the Obligations. Exhibit A describes the general character, type, purpose and function of the Project.
Section 2. The reasonably expected maximum principal amount of the Obligations is $35,000,000.
Section 3. Except as to certain costs described in Section 7 below, this resolution is being adopted not later than 60 days after the payment of the original expenditures (the “Expenditures Date or Dates”).
Section 4. Except as described in Section 7 below, the expected date of issue of the Obligations will be within eighteen months of the later of the Expenditure Date or Dates and the date the Project is placed in service; provided, the reimbursement may not be made more than three years after the Expenditure Date.
Section 5. Proceeds of the Obligations to be used to reimburse for Project costs are not expected to be used, within one year of reimbursement, directly or indirectly to pay debt service with respect to any obligation (other than to pay current debt service coming due within the next succeeding one-year period on any tax-exempt obligation of the District (other than the Obligations)) or to be held as a reasonably required reserve or replacement fund with respect to an obligation of the District or any entity related in any manner to the District, or to reimburse any expenditure that was originally paid with the proceeds of any obligation, or to replace funds that are or will be used in such manner.
Attachment A
Section 6. This resolution is consistent with the budgetary and financial circumstances of the District, as of the date hereof. No monies from sources other than the Obligations are, or are reasonably expected to be, reserved, allocated on a long-term basis, or otherwise set aside by the District (or any related party) pursuant to their budget or financial policies with respect to the Project costs. To the best of our knowledge, this Board is not aware of the previous adoption of official intents by the District that have been made as a matter of course for the purpose of reimbursing expenditures and for which tax-exempt obligations have not been issued.
Section 7. The limitations described in Section 3 and Section 4 do not apply to (a) costs of issuance of the Obligations, (b) an amount not in excess of the lesser of $100,000 or five percent (5%) of the proceeds of the Obligations, or (c) any preliminary expenditures, such as architectural, engineering, surveying, soil testing, and similar costs other than land acquisition, site preparation, and similar costs incident to commencement of construction, not in excess of twenty percent (20%) of the aggregate issue price of the Obligations that finance the Project for which the preliminary expenditures were incurred.
Section 8. This resolution is adopted as official action of the District in order to comply with Treasury Regulation §1.150-2 and any other regulations of the Internal Revenue Service relating to the qualification for reimbursement of District expenditures incurred prior to the date of issue of the Obligations, is part of the District’s official proceedings, and will be available for inspection by the general public at the main administrative office of the District.
Section 9. This Resolution shall take effect immediately upon its passage.
ADOPTED, SIGNED and APPROVED at a special meeting of the District this 21st day of May, 2018.
President of the Board of Directors
Attest: Secretary of the Board of Directors
STATE OF CALIFORNIA ) ) ss
COUNTY OF SAN DIEGO )
I, Susan Cruz, Secretary of the Board of Directors of the Otay Water District, do hereby certify that the foregoing Resolution No. 4348 was duly adopted by the Board of Directors of said District at a special meeting thereof held on the 21st day of May, 2018, and that it was so adopted by the following vote:
AYES: DIRECTORS:
NOES: DIRECTORS:
ABSENT: DIRECTORS:
ABSTAIN: DIRECTORS:
Secretary of the Board of Directors of the Otay Water District
(SEAL)
STATE OF CALIFORNIA ) ) ss
COUNTY OF SAN DIEGO )
I, Susan Cruz, Secretary of the Board of Directors of the Otay Water District, do hereby certify that the above and foregoing is a full, true and correct copy of Resolution No. 4348 of said Board, and that the same has not been amended or repealed.
DATED: _________________, 2018.
Secretary of the Board of Directors of the Otay Water District
(SEAL)
EXHIBIT 1 DESCRIPTION OF PROJECT
Capital improvements to the District’s water system, including, but not limited to, pump station replacements, pipeline replacements and tank and reservoir improvements.
The City Tower, 333 City Boulevard West, Suite 1215, Orange, California 92868 Tel: 714.939.1464
May 14, 2018
Joseph R. Beachem Chief Financial Officer Otay Water District 2554 Sweetwater Springs Blvd. Spring Valley, CA 91978-2096 RE: CalPERS Unfunded Actuarial Liability – Supplemental Information
Dear Joe:
This report supplements the information provided in the May 2, 2018 report.
As we have discussed, first and foremost, the funding plan being considered by the District is a cashflow management plan. The interest rate differential between (1) what PERS is charging the District on its Unfunded Actuarial Liability (UAL) and (2) what the District’s other borrowing costs are for CIP, is what provides the basis for creating cashflow benefit, and ultimately lower water rates. Further, by strategically selecting which portions of the UAL to fund with cash on hand and repaying the new debt over a reasonable period, the District can improve its cashflow – providing both operational flexibility in the short term, and a cushion against increased pension costs in the long term should PERS investment returns not meet expectations.
As noted in the report of May 2, 2018 (Attachment C), the District’s UAL as of June 30, 2018 will be made up of 21 “amortization bases,” which are positive and negative amounts generated each year based on the performance of the PERS Investment Fund and changes in the actuarial assumptions. Each amortization base has a separate payment schedule over a fixed period of years. Because of the PERS methodology, some of the payments continue to increase each year while others will drop off. Issuing debt to fund some of the shorter maturing amortization bases will allow the District to consolidate those balances and create a level repayment schedule rather than one that increases and decreases over time.
Exhibit B to the May 2, 2018 Report shows the payments due each year for each amortization base. The amortization bases that would be selected for funding are the ones that provide the most cashflow benefit, subject to the PERS limitation on the use of asset gains (created from returns above the discount rate) to offset only asset losses (created by returns below the discount rate). The bases that would generally be funded would be all of the assumption change bases (2002-2017) and the bases for the asset losses for 2009-2011 and half of the asset loss for 2012. Even though we are estimating what the 2018 assumption change will be using the GovInvest model, it will not actually be calculated by PERS until 2019 and therefore not eligible to be funded at this time.
Dianea
Typewritten Text
Attachment B
Dianea
Typewritten Text
Dianea
Typewritten Text
Dianea
Typewritten Text
Dianea
Typewritten Text
Page 2 May 14, 2018
One of the criticisms of pension funding through debt issuance is the possibility that future PERS Investment Fund low performance could lead to increased costs over the long-term. The CIP debt payment schedule tries to mitigate the possibility of increased costs by having the benefit of level debt service for the first 20 years, but then decreasing the payments over time to mirror the expected decrease in cashflow savings after most of the original amortization bases would have been paid off under the PERS methodology. Once again, this is consistent with the cashflow benefit strategy for the funding plan.
The District can of course have a different amortization commensurate with the actual assets being constructed with the bonds, say 30 years, but it does create a situation where the combined UAL and debt service payments are greater than the existing remaining UAL amortization payments in some years. Since every year new amortization bases will be created and amortized over new 20 year periods, it might be best not to create extra payments in the later years when there will be other amortization payments to be layered on.
In addition, the District should be aware that there is always the possibility that a net pension asset will be created and the District will end up with “stranded” pension assets that are only available to offset future investment losses or assumptions changes.
GFOA Concerns about Pension Obligation Bonds
While this proposed financing plan is not for the issuance of pension obligation bonds directly, it has many of the same characteristics. There has been a lot of discussion about the issuance of debt to fund unfunded pension liabilities. For example, the Government Finance Officers Association (GFOA) has the following statements on their website:
Pension obligation bonds (POBs) are taxable bonds that some state and local governments have issued as part of an overall strategy to fund the unfunded portion of their pension liabilities by creating debt. The use of POBs rests on the assumption that the bond proceeds, when invested with pension assets in higher-yielding asset classes, will be able to achieve a rate of return that is greater than the interest rate owed over the term of the bonds. However, POBs involve considerable investment risk, making this goal very speculative. Failing to achieve the targeted rate of return burdens the issuer with both the debt service requirements of the taxable bonds and the unfunded pension liabilities that remain unmet because the investment portfolio did not perform as anticipated. In recent years, local jurisdictions across the country have faced increased financial stress as a result of their reliance on POBs, demonstrating the significant risks associated with these instruments for both small and large governments.
Recommendation:
The GFOA recommends that state and local governments do not issue POBs for the following reasons:
1. The invested POB proceeds might fail to earn more than the interest rate owed over the term of the bonds, leading to increased overall liabilities for the government.
Page 3 May 14, 2018
2. POBs are complex instruments that carry considerable risk. POB structures may incorporate the use of guaranteed investment contracts, swaps, or derivatives, which must be intensively scrutinized as these embedded products can introduce counterparty risk, credit risk and interest rate risk.
3. Issuing taxable debt to fund the pension liability increases the jurisdiction’s bonded debt burden and potentially uses up debt capacity that could be used for other purposes. In addition, taxable debt is typically issued without call options or with "make-whole" calls, which can make it more difficult and costly to refund or restructure than traditional tax-exempt debt.
4. POBs are frequently structured in a manner that defers the principal payments or extends repayment over a period longer than the actuarial amortization period, thereby increasing the sponsor’s overall costs.
5. Rating agencies may not view the proposed issuance of POBs as credit positive, particularly if the issuance is not part of a more comprehensive plan to address pension funding shortfalls.
The following discussion addresses these issues one-by-one as they relate to the District borrowing additional funds for capital projects that would have otherwise been funded from the reserves that the District is remitting to PERS to reduce its UAL.
Investment rate
GFOA: The invested POB proceeds might fail to earn more than the interest rate owed over the term of the bonds, leading to increased overall liabilities for the government.
Ideally, the PERS Fund investment rate of return should align with the discount rate (interest rate) charged to the District on its pension liability. PERS has reduced its discount rate from time to time based on revised estimates of its long term investment return potential. A history of the changes in the PERS discount rate and actual investment return is shown on the following page.
Page 4 May 14, 2018
PERS HISTORICAL INVESTMENT RETURNS Fiscal Year Rate of 10 Year
The investment rate of return is important since any time the PERS Investment Fund rate of return is less than the discount rate, a new amortization base layer is created and funding is amortized over a period of time (existing period is 30 years, but that will be reduced to 20 years starting in with the 2019 PERS valuation). If additional District funds are deposited in PERS and PERS fails to achieve a 7% return in every year going forward, a new amortization base will be created in each year – and the resulting increase in the annual UAL payment will reduce the cashflow savings expected from the difference in the District’s borrowing for CIP and the reduction in UAL payments as a result of the additional contribution.
Conversely, investment gains from achieving a higher rate of return will provide a credit amortization base to the UAL to be used to offset future amortization bases. However, in no event does a credit amortization base resulting from an investment gain ever offset the District’s normal pension cost. Because of this policy, if the investment return is consistently higher, it could ultimately create a net pension asset which is effectively “stranded” until there is another UAL amortization base to apply it to. Meanwhile, the District will still be paying the normal pension cost as well as the debt service on the CIP bonds, neither of which benefit from any net pension asset.
In the projections of debt service, the all-in effective interest rate (with all costs of issuance factored in) is 3.45%. The bonds are being issued for CIP projects and the interest is based on a tax-exempt bond interest rate, not the typical taxable rate for issuers directly borrowing to make a direct deposit to the PERS Investment Fund. Taxable interest rates can be 1.25% higher, and therefore, there is less differential between the long term 7% return and a taxable interest rate than is the case with the District’s bonds. The long term rate of return would need to be below 3.5% to turn the estimated long term benefit into a long term cost.
The longer the maturity of the bonds and the longer that the PERS rate of return is lower that the bond yield, the greater the potential increase in costs. That is one reason to recommend a somewhat shorter maturity that mirrors the estimated reduction in UAL payments by applying the UAL deposit toward the earlier maturing amortization bases.
POB Structure
GFOA: POBs are complex instruments that carry considerable risk. POB structures may incorporate the use of guaranteed investment contracts, swaps, or derivatives, which must be intensively scrutinized as these embedded products can introduce counterparty risk, credit risk and interest rate risk.
The District’s debt service will be structured conventionally – that is, a fixed rate over a fixed maturity with no swaps, derivatives or other hedging mechanisms.
GFOA: In addition, taxable debt is typically issued without call options or with "make-whole" calls, which can make it more difficult and costly to refund or restructure than traditional tax-exempt debt.
Because the District is applying cash on hand to the unfunded liability, the bonds will be issued for CIP on a tax-exempt basis, with typical call options.
GFOA: POBs are frequently structured in a manner that defers the principal payments or extends repayment over a period longer than the actuarial amortization period, thereby increasing the sponsor’s overall costs.
The debt repayment contemplated is intended to mirror the existing UAL payments, and not defer or extend payments.
Debt Profile
GFOA: Issuing taxable debt to fund the pension liability increases the jurisdiction’s bonded debt burden and potentially uses up debt capacity that could be used for other purposes
Since the GFOA comments are addressed to issuers across the nation and not any specific issuing jurisdiction (cities, counties, water districts), this comments does not necessarily apply to the District.
The District has a well-monitored CIP program funding model and it is unlikely that additional debt will be required for capital in the near future. The last issuance of new debt for CIP was in 2010. So although
Page 6 May 14, 2018
this new issue would reduce additional CIP bond funding opportunities without additional rate increases, it is unlikely that the CIP will need additional financing in the near-term. This funding plan will provide for most of the CIP needs for the next 3 years, with the balance paid with existing reserves or annual net revenue.
The District’s debt capacity is primarily limited by its ability to meet certain debt service coverage ratios. Reducing the UAL payment, an operating expense, will increase the net revenue by a similar amount. The new debt service will be added to the existing debt service. The total debt service will then be compared to the net revenue to calculate the debt service coverage. With a 1.25x debt coverage ratio, every $1.25 decrease in an operating expense such as the UAL payment, will provide capacity for $1.00 of debt service. Based on the report dated May 2, 2018, the UAL payments in the first 15 years will be reduced an average of $3 million annually, which would provide 1.25x coverage for $2.4 million in debt service. The expected annual debt service for $30 million of CIP projects is $1,925,000. Therefore, the District’s coverage ratio is expected to be maintained at least at a level equal to what it would have been without implementing the funding plan. In-depth discussion of the S&P coverage ratio evaluation is included later in the report.
The District also continually updates it 6-year rate model to make certain that rates generate sufficient net revenue to provide adequate debt service coverage in accordance with District policies. The implementation of the funding plan means lower increases in rates are required to maintain coverage than would have otherwise been required.
GFOA: Rating agencies may not view the proposed issuance of POBs as credit positive, particularly if the issuance is not part of a more comprehensive plan to address pension funding shortfalls.
The District’s current PERS funding ratio is slightly over 60% as of June 30, 2016. This funding plan will increase the funding ratio to approximately 85%. Increasing the funding ratio should be a credit positive. Providing some cashflow savings by increasing the funding of the UAL will afford some budgetary flexibility to pay new amortization bases as they come on line. In addition, to address future UAL layers, some public agencies have adopted an UAL Funding Policy. An example of such policy language that the District could consider and tailor to its own needs is included as Attachment A.
Fresh Start – PERS has a “Fresh Start” program that would allow the District to re-amortize the entire remaining UAL after the partial payment as if one lump sum – similar to the debt consolidation example described earlier. This Fresh Start program allows the UAL to be amortized over any period the District selects, as long as the total payments do not exceed the current payments. The structure of a Fresh Start payment plan starts with fixed payment in the first year, which increases with the COLA adjustment used by PERS (currently 3% but going down to 2.75% next year). This idea for this amortization schedule being that the UAL payment would go up in proportion to payroll, not using the ramp-up ramp-down methodology factors in some of the existing bases, but more along the lines of the percentage of payroll used in other existing bases. This District might consider implementing a Fresh Start once the 2018 assumption change is reflected in the PERS valuation in 2019 to capture the most significant change on the horizon and take earlier advantage of the investment gain created in 2017.
Page 7 May 14, 2018
S&P Rating Criteria
S&P uses a combination of factors to assess the District’s credit rating. These factors are given an assessment number from 1 to 6 (1 is best) and each factor is then weighted. The combined weighted factor gives an initial assessment which can be modified by other qualitative factors. Attachment B provides an overview of the factors and their weight in the assessment of the District’s credit rating. It includes an assessment of Enterprise Risk Profile (50%) and Financial Risk Profile (50%).
The District’s S&P rating is “AA”, which from the table in the S&P criteria, indicates that the District falls in the 2 category (Very Strong) for Enterprise Risk and in the 2 category for Financial Risk.
Issuing bonds effectively converts a portion of the PERS UAL from a “soft” debt to a “hard” debt. Debt and liabilities account for 10% of S&P’s Financial Risk Profile factors. One of the components of the debt assessment is Debt to Capitalization. The current debt to capitalization is approximately 22%, a factor of “2” in a category that spans from 20% to 35%. With the addition of the CIP debt, the debt to capitalization is expected to remain below 30%, and no change in the debt and liabilities factor is anticipated.
All-in coverage and liquidity and reserves each account for 40% of the Financial Risk Profile Factors.
The District’s liquidity will be impacted in the short term by deposit with PERS, because although the District will replace the CIP funding with bond proceeds, bond proceeds cannot be included in liquidity ratios. The District’s liquidity factor is currently “2” in a category that spans $20 to $75 million or 90 to 150 days’ operating cash. In the last rating update, the District had $42 million of liquidity for this purpose. The District expects liquidity to remain above $20 million after making the deposit to PERS. There is a slight concern that the District could end with a factor of “3” but that is not likely to move the rating out of the Very Strong category on its own. However, the Very Strong category includes both “AA” and “AA-minus” ratings, so the liquidity is an issue to closely monitor as the bond structure is finalized.
Based on the current 6-year rate model and including the implementation of the funding plan, the District’s projected debt service coverage ratio continues to meet the District’s long-term policy of 1.25x minimum ratio based on all available revenue, and 1.50x minimum ratio without growth-dependent fees.
S&P has developed a concept of “all-in coverage” where they calculate the implicit debt service for the debt incurred by other public agencies that can be allocated to the District based on its share of the revenues paid to the wholesaler and add that amount to the District’s debt service. A like amount is deducted from operating expense. Included in the District’s all-in coverage are obligations of CWA, MWD and the State Water Project. The District really has no control over the all-in coverage factor, and would generally not base its financing decisions or rate increases to provide coverage on what are essentially operating costs (paid through MWD and CWA water costs) and not directly related to its own capital needs.
At the last rating in 2016, the District’s all-in coverage was 1.40x compared to its stand-alone coverage of 2.10x. In 2013 the all-in coverage was 1.20x compared to the District’s stand-alone coverage of 1.60x. This falls in the coverage factor of “3” in a category that spans from 1.20x to 1.40x.
Page 8 May 14, 2018
S&P indicated that approximately $16.5 million of implied debt was included in the 1.4x ratio in 2016. Due to the desalination plant financing in Carlsbad, MWD financing and State Water Project funding, it might be prudent to assume that amount has increased by 25%, possibly to $20.6 million. Using FY 2017 figures, the District’s stand-alone coverage was 2.0x based on its own debt service of $7.8 million. Including $20.6 million of implied debt would reduce the ratio to 1.27x. With FY 2018 projected results and the increased debt service to implement the funding plan, the all-in coverage would stay in the “3” category, but if historical audited results from FY 2017 are used, the all-in coverage would fall in the “4” category that spans 1.10x to 1.20x.
So there is a possibility that the combination of the liquidity factor and the all-in coverage factor may result in a change in S&P’s view of the District’s credit rating. These factors will be carefully analyzed as the District moves forward.
Timing
Issuance of bonds can be completed within 90 days from the time the District’s financing team is in place. The primary services required are bond counsel, disclosure counsel and financial advisor.
The debt service included in the analysis was based on interest rates that are at least one month old. There is a historically low supply of tax-exempt bonds at the moment, which can help to keep interest rates from rising quickly. For every 25 basis point increase in interest rates, the debt service will increase by approximately $60,000.
I look forward to discussing any questions you have on this information.
Very truly yours,
Suzanne Q. Harrell
Suzanne Harrell
Attachment A
Unfunded Accrued Liability Funding Policy
The purpose of this funding policy is to establish a framework for funding the District’s defined benefit pension plan, taking into account factors that are relevant to the plan and the District. These factors include:
- The financial position of the District. - Stability of the plan and / or the affordability of the annual contributions. - Benefit security. - The terms of the CALPERS contract for the District, along with any related collective
bargaining agreements. - Minimum funding requirements under State law.
There are a number of advantages to developing a funding policy to address an unfunded accrued liability. These advantages include the following:
- Establishing a funding policy provides the framework to ensure proper management of future liabilities. The adoption of a funding policy will ensure a disciplined decision making process, which will contribute to better predictability in funding.
- Having a written summary of the funding policy that is accessible to the members will help improve the transparency of funding decisions and increase the members’ understanding of pension funding issues.
- The exercise of developing this funding policy improves the identification, understanding, and management of the risk factors that affect the variability of funding requirements and the security of benefits to the members.
The District may incur additional new unfunded accrued liabilities from year to year, due to the following factors:
- Changes in actuarial assumptions and experience changes (e.g., changes in the discount rate, changes in demographic experience, etc.).
- Changes in actuarial gains and losses due to asset returns being higher or lower than expected.
- Changes in plan benefits.
Any new increase or decrease in the liability resulting from the annual actuarial valuation is identified as a separate line item, or amortization base, on the annual CALPERS actuarial valuation report.
Due to the possibility of a new pension liability developing, the District desires to create an Unfunded Accrued Liability (“UAL”) Funding Policy in order to immediately address any new pension liabilities, or amortization bases, that arise. This policy lays out the parameters for paying off the UAL in a designated amount of time, based on the amount of the UAL, as follows:
Unfunded Accrued Amount (Separate Amortization Base
From CALPERS Report)
Payoff Time Period $0 to $5,000,000 Between 3 and 5 years
$5,000,001 to $10,000,000 Between 5 and 7 years $10,000,001 to $15,000,000 Between 7 and 9 years $15,000,001 to $20,000,000 Between 9 and 10 years
$20,000,001 or more Between 10 and 15 years
Under the new CALPERS policies, no amortization base will be amortized over more than 20 years, beginning with amortization bases created in 2019.
Each year, when the District is provided with the annual valuation report from CALPERS, staff will present to the Board of Directors, as part of the next budgetary cycle, the following:
- The dollar amount of the new liability (new amortization base). - The number of years that staff is recommending to pay off the liability. - The dollar amount of the annual contribution to be made. - The funding source(s) of the payments.
When an amortization base results in a credit balance, the credit will be applied, first, to any negative bases during the same period and, secondly, against any prior year bases until the credit is fully exhausted. The remaining outstanding liability will then be recalculated and a new payoff schedule and annual contribution will be determined based on the payoff schedule above.
The City Tower, 333 City Boulevard West, Suite 1215, Orange, California 92868 Tel: 714.939.1464
May 2, 2018
Joseph R. Beachem Chief Financial Officer Otay Water District 2554 Sweetwater Springs Blvd. Spring Valley, CA 91978-2096 RE: CalPERS Unfunded Actuarial Liability
Dear Joe:
The Otay Water District (District) has requested assistance with its analysis of the operating fund impact of reducing the CalPERS unfunded actuarial liability (UAL) using current fund balance reserves. Use of the fund balance reserves to reduce the UAL would require the issuance of additional debt to pay for capital projects that would have been paid for with such funds.
Executive Summary
In its simplest form, this transaction exchanges one outstanding debt (UAL) that has a higher implicit interest rate for a new debt (Bonds) that accrues interest at a lower rate. It is only when the structure of each debt is looked at that we can come to a conclusion about the benefit to the District of such an undertaking.
As described in this report, while there are many options for selecting which portions of the existing UAL to fund and how to structure the bonds in terms of maturity and amortization, the ultimate decision to reduce the UAL by using reserves and instead borrowing for CIP will have a positive impact on the District’s total cashflow over 30 years and therefore mitigate rate increases that may be necessary to fund the projected increases in the annual UAL payment by CalPERS.
CalPERS UAL Calculation
The CalPERS reporting lags the District’s fiscal year. In July 2017, CalPERS reported as of June 30, 2016, the market value of the District’s assets in the Public Employees Retirement Fund (Fund) as $73.7 million. The present value of all benefits as of the same date was $121.8 million, generating a UAL of $48.1 million. The assets were 60.5% of Plan liabilities at that time. Since CalPERS will set contributions to fund 100% of the UAL over 20-30 years depending on the amount and type of liability and what year it was generated, the greater the unfunded portion, the greater the annual increase in UAL payments and the more significant impact on the operating budget and ultimately the water rates.
sharrell
Typewritten Text
Attachment C
Page 2 May 2, 2018
In addition, CalPERS has reduced the expected long-term earnings rate of the Fund from 7.75% to 7.0% over a period of years. The phasing in of this assumption change and the amortization of the cost of the changes over a limited number of years, as well as a “ramp-up” period for each change, has caused a spike, and will cause further spikes, in annual UAL payments. In 2014, the UAL contribution was $2,657,504. In July 2017, CalPERS projected the annual UAL payment to be $5,213,000 by 2023, nearly double the 2014 amount. The District has no input into the payment calculation or the calculation assumptions determined by the CalPERS Board of Administration. The District purchased the GovInvest web-based platform that allows the District to project the impact of future CalPERS assumption changes as well as Fund portfolio gains and losses. Using the platform, and factoring in the benefit of the 2016-17 CalPERS actual investment return of 11.2%, the expected UAL payments calculated as of June 30, 2018 are shown below:
This calculation does not take into account future gains or losses in the Fund’s portfolio, but assumes that investment returns (7%) are equal to the discount rate (7%) used to calculate the actuarially determined pension liability. So it is a snapshot in time of future UAL payments based on the anticipated June 30, 2018 UAL carried forward from the June 30, 2016 CalPERS reported figure. There are negative payments in the later years because CalPERS is currently amortizing investment gains (reduction in liability) over 30 years, but amortizing assumption changes (increases in liability) over 20 years. So in theory, there would be no payment due in those years showing negative payments. Those amounts are available, however, to offset future investment losses or the cost of future assumption changes. CalPERS recently announced that beginning in 2020, all changes and investment gains or losses will be amortized over a fixed 20 year period. Using the GovInvest platform, we can see what the future impact on UAL is once the discount rate and investment rate are both normalized at 7%. The discount rate is the effective interest rate that CalPERS charges participants on the unfunded liability in determining the UAL. Attached as Exhibit A is the
Page 3 May 2, 2018
Gain/Loss Analysis for FY 2015-16 from CalPERS that shows the interest on the UAL being calculated at 7.5% (the discount rate for FY 2015-16). Increasing the District’s Funding Ratio While there is no set definition for what defines a “healthy” or “unsustainable” funding status, many refer to an 80% funding level as the basis for a financially sound pension plan. In reality, CalPERS UAL payments are calculated to achieve 100% funding at a point in time based on certain assumptions, and the financial viability of the District’s plan depends on many factors – including the size of the shortfall compared with the District’s resources to pay the higher UAL payments required as a result of the lower funding status. In effect, the question is – is it possible or practical to continue raising water rates or cutting other costs to make these higher UAL payments based on the current 60% funding level when alternatives are available? The UAL Payments In addition to the simple comparison of paying higher implicit interest rates for the UAL and paying lower bond interest rates for funding the CIP described at the beginning of this report, it is important to make certain that the amount deposited in the Fund has the desired impact on the UAL payment from a cashflow point of view. The cashflow impact of the higher or lower funding level is what will drive the District’s need to raise water rates or not. The District’s total UAL is made up of 17 existing liability/asset bases plus 4 projected new bases for 2017 and 2018 (2 assumption changes and 2 years investment gains/losses since the 2016 report). Each base is created as of a point in time, and each has a different number of years over which it is being paid off. Further, because CalPERS uses a “ramp-up” system, the full impact of a particular year’s liability may not be felt for several years into the future. The calculation of the annual UAL payment is therefore a complex one, and the District cannot assume that if it deposits 50% of the current unfunded balance, that the actual UAL payment will be reduced by 50% in every year. This is due to the disparate amortization periods for investment gains (30 years) and assumption changes (20 years), and also due to the remaining amortization periods for prior changes (for example, some are 5 years, some are 20 years). This is complicated by the fact that if the District is not funding the entire UAL for all amortization bases, the reductions in the existing net liability for investment gains are not eligible to offset the UAL portion being prepaid. The table on the following page shows the projected amortization bases as of June 30, 2018. The District has indicated that approximately $31.8 million in reserves are available to apply to the funding of the UAL, leaving a short term need to fund $30 million of water CIP.
Page 4 May 2, 2018
PROJECTED AMORTIZATION BASES AS OF JUNE 30, 2018
Date Amortization Reason for Base Established Period* Total
(GAIN)/LOSS 6/30/2018 30 (361,636) Balance Projected (To be reported by PERS in 2020 for 2018) $51,353,519 ____________ * Remaining as of June 30, 2018
This schedule highlights the two large investment gains in 2014 and in 2017 totaling $11.7 million. These bases cannot be used to offset any other bases when only a portion of the total UAL is being funded. Exhibit B shows the individual amortization of each base separately. As noted above, it is important to determine how the District’s cashflow is being affected based on which base the funding is to be applied. While funding the longest amortizing bases may save the most interest expense in the long run, funding the shortest bases provides the greatest cashflow benefit while still saving some interest compared to the existing cost. If the District applies $31.8 million to the total UAL, the chart on the following page approximates the remaining UAL annual payments if the longest or the shortest bases are funded.
Page 5 May 2, 2018
Remaining UAL Payments After $31.8 Million Funding
The rows that are shaded represent the balance of the unamortized investment gains that are greater than any remaining unamortized investment losses, and could offset future new bases resulting from future assumption changes, benefit changes or investment losses. The total of the remaining payments if the longest bases are funded is $38.4 million, before deducting the shaded figures of $3.3 million. The total of the remaining payments if the shortest bases are funded is $44.9 million, before deducting the shaded figures of $217,000. The District’s objectives for the funding of the UAL and the CIP will play a role in determining which bases are the optimum bases to fund upfront.
Page 6 May 2, 2018
Funding the CIP When the reserves of $31.8 million are applied to the UAL funding, the District will need to finance a like amount of CIP. While there is $1.8 million that will be allocated to the sewer fund, for this analysis, only the $30 million of the water fund CIP bonding is assumed at this time. This part of the analysis provides the data for the calculation of the impact on water rates of the additional debt service for the CIP bond funding when offset against the reduction in the UAL. Another goal is to preserve future flexibility to absorb additional layers of UAL created from future investment losses or assumption changes, but not to leave stranded Net Pension Assets that can only be used against future losses and not against normal costs. The chart below shows the cashflow impact of funding $31.8 million of the shortest UAL bases, and then creating a debt service that is primarily level and then decreases to match the savings in the longer years, so that on a combined basis, the new payments never exceed the existing payments. The cumulative cashflow benefit is $16.4 million over 25 years.
Net
Existing UAL Reduction in Remaining Debt Combined Cashflow
Payment UAL Payment UAL Payment Service UAL/Debt Benefit
For comparison, another option is to fund the longest UAL bases and overlay a debt service schedule that extends to 30 years. The cumulative cashflow benefit is $16.9 million over 30 years.
Net
Existing UAL Reduction in Remaining Debt Combined Cashflow
Payment UAL Payment UAL Payment Service UAL/Debt Benefit
Which funding and debt options the District chooses depends on the ability to achieve debt service coverage ratios and the expectations on how much capacity to leave for future UAL layers that will be created. The maturity and amortization of the new debt service can be determined as you move forward toward the issuance of the debt. For now, it is sufficient to demonstrate that under any scenario, the concept of using existing reserves to fund a portion of the UAL and issue debt to fund CIP creates a significant cashflow benefit that is useful in managing the District’s water rates.
There are future layers of the UAL bases that will be created over time which the District will have to manage as part of future budgets. However, these new layers will be created with or without the additional funding. It is also important to recognize how CalPERS is changing certain amortization periods (beginning in 2020, investment gains and losses will be amortized over 30 years instead of 20 years) and how to make the most of any anticipated future net pension asset.
I look forward to assisting in determining the optimal UAL bases to fund and the optimal debt service structure for the bonds to fund the CIP as the District moves forward with this financing mechanism.
Very truly yours,
Suzanne Q. Harrell
Suzanne Harrell
CALPERS ACTUARIAL VALUATION - June 30, 2016 MISCELLANEOUS PLAN OF THE OTAY WATER DISTRICT CalPERS ID: 7662006988
Page 14
(Gain)/Loss Analysis 6/30/15 – 6/30/16
To calculate the cost requirements of the plan, assumptions are made about future events that affect the amount and timing of benefits to be paid and assets to be accumulated. Each year, actual experience is compared to the expected experience based on the actuarial assumptions. This results in actuarial gains or losses, as shown below.
1. Total (Gain)/Loss for the Year a) Unfunded Accrued Liability (UAL) as of 6/30/15 $ 41,685,540 b) Expected Payment on the UAL during 2015-16 2,582,193 c) Interest through 6/30/16 [.075 x (1a) - ((1.075)½ - 1) x (1b)] 3,031,334 d) Expected UAL before all other changes [(1a) - (1b) + (1c)] 42,134,681 e) Change due to plan changes 0 f) Change due to assumption change 1,813,975 g) Expected UAL after all other changes [(1d) + (1e) + (1f)] 43,948,656
h) Actual UAL as of 6/30/16 48,143,628
i) Total (Gain)/Loss for 2015-16 [(1h) - (1g)] $ 4,194,972 2. Contribution (Gain)/Loss for the Year a) Expected Contribution (Employer and Employee) $ 4,939,286 b) Interest on Expected Contributions 181,875 c) Actual Contributions 4,794,891 d) Interest on Actual Contributions 176,558 e) Expected Contributions with Interest [(2a) + (2b)] 5,121,161 f) Actual Contributions with Interest [(2c) + (2d)] 4,971,449
g) Contribution (Gain)/Loss [(2e) - (2f)] $ 149,712 3. Asset (Gain)/Loss for the Year a) Market Value of Assets as of 6/30/15 $ 74,038,571 b) Prior Fiscal Year Receivables (510,399) c) Current Fiscal Year Receivables 430,669
d) Contributions Received 4,794,891 e) Benefits and Refunds Paid (5,448,218) f) Transfers and Miscellaneous Adjustments 114,335 g) Expected Int. [.075 x (3a + 3b) + ((1.075)½ - 1) x ((3d) + (3e) + (3f))] 5,494,766 h) Expected Assets as of 6/30/16 [(3a) + (3b) + (3c) + (3d) + (3e) + (3f) + (3g)] 78,914,615 i) Market Value of Assets as of 6/30/16 73,678,504
j) Asset (Gain)/Loss [(3h) - (3i)] $ 5,236,111 4. Liability (Gain)/Loss for the Year a) Total (Gain)/Loss (1i) $ 4,194,972 b) Contribution (Gain)/Loss (2g) 149,712 c) Asset (Gain)/Loss (3j) 5,236,111
EXHIBIT BPROJECTED AMORTIZATION BASES AS OF JUNE 30, 2018
STAFF REPORT
TYPE MEETING: Budget Workshop MEETING DATE: May 21, 2018
SUBMITTED BY: Kevin Koeppen, Finance Manager PROJECT: DIV. NO. All
APPROVED BY: (Chief)
Joseph R. Beachem, Chief Financial Officer
Mark Watton, General Manager
SUBJECT: Adopt Resolution No. 4345 to Approve the FY 2018-2019 Operating and Capital Budget; Approve Fund Transfers for Potable, Recycled and Sewer; Adopt the Salary Schedule; Approve Water Rates; and Adopt Ordinance No. 567 Amending the Code of Ordinances, Section 25 Conditions for Water Service, including Appendix A with the Approved Water Rate Changes; Direct Staff to Draft and Mail Water Rate Increase Notices; and Direct Staff to Draft and Mail Proposition 218 Hearing Notices for Sewer Customers
GENERAL MANAGER’S RECOMMENDATION: That the Board adopt Resolution No. 4345 to approve the FY 2018-2019 Operating and Capital Budget including the following:
a) Approve the fund transfers for potable, recycled and sewer.
b) Adopt the Salary Schedule.
c) Approve the water rates.
d) Adopt Ordinance 567 amending the Code of Ordinances, Section 25 Conditions for Water Service including Appendix A, with the approved water rate changes, effective January 1, 2019.
e) Direct staff to draft and mail water rate notices for potable and recycled water customers.
f) Direct staff to draft and mail sewer Proposition 218 hearing notices to sewer customers.
tita.ramos-krogman
Typewritten Text
AGENDA ITEM 6
2
PURPOSE: To adopt Resolution No. 4345 to approve the FY 2018-2019 Operating and Capital Budget; approve fund transfers for potable, recycled, and sewer; adopt the Salary Schedule; approve water rates; and adopt Ordinance No. 567 amending the Code of Ordinances Section 25 Conditions for Water Service, including Appendix A with the approved water rates changes; direct staff to draft and mail water rate increase notices; and direct staff to draft and mail Proposition 218 hearing notices for sewer customers. BACKGROUND: Each year the District goes through a rate setting process with new challenges. The process begins in January and ends with the implementation of rates the following January. The District is seeing a return in water volumes from the low experienced in 2016 and 2017, and the current and projected water sales volumes reflect the increase in usage. The District performed a Cost of Service Study for sewer rate structures and presented it to the Board on March 7, 2018. The purpose of a Cost of Service Study is to ensure the rate structure meets the constitutional requirements of Proposition 218. In addition, the Cost of Service Study considers changes in economic factors, price increases, infrastructure, and changes in other cost drivers. The Cost of Service Study highlighted areas of change that have been incorporated into this budget and will be reviewed at a 218 hearing tentatively scheduled for October 3, 2018. Staff has made every effort to present the most realistic set of factors and assumptions based on information received from various sources including: the wholesale water suppliers, the Metropolitan Water District of Southern California (MWD), the San Diego County Water Authority (CWA), and the City of San Diego (the City); vendors such as SDG&E; and an economic report prepared by the Expera Group. Staff uses this information in conjunction with other economic indicators affecting taxes and revenues, such as inflation and interest rates, to prepare the budget. Staff has prepared the proposed Operating and Capital Budget with the proposed water and sewer rates. The water rates may be approved, based on the prior 218 process, which was approved by
3
the Board on October 4, 2017. The sewer rates may be approved subsequent to the Proposition 218 hearing to be held in October. DISCUSSION: Water Challenges The primary challenge for the District remains potential reductions from drought and potential political mandates. On April 26, 2017, the State Water Resource Control Board (SWRCB) rescinded the conservation mandates but maintained water-use reporting requirements and prohibitions against wasteful practices. The District has consistently advocated for policies that include supply development and water-use efficiency and will continue to work with CWA and other water agencies in San Diego County to advocate that the targets and measures in the state’s long-term framework support a balanced approach. Predicting changes in usage patterns due to political mandates, weather patterns, and growth are key challenges of the budget process. In FY 2018, the District has been experiencing a significant recovery in water sales volumes versus the sales volumes experienced in FY 2017. Staff attributes the recovery to the elimination of mandated conservation and reductions in rainfall between FY 2017 and FY 2018. Potable Sales Volumes For fiscal year 2019, staff is budgeting potable water sales of 12.8 million units, which will be 15% above the FY 2018 budgeted volumes and 1% above the FY 2018 projected actual volumes. Staff is estimating that the FY 2018 levels will continue into the next fiscal year, plus an additional 1% increase related to estimated FY 2019 growth. Recycled Sales Volumes For FY 2019, the recycled water sales of 1.6 million units will be less than FY 2018 budgeted and projected volumes by 50k units (3%) and 96k units (6%), respectively. The decrease in projected volumes is due to the closure of the Salt Creek golf course, which represents approximately 6% of FY 2018’s projected recycled volume. The FY 2018 rainfall of 3.3 inches was 63% below the median of the 10-year average of 8.9 inches. The National Weather Service is forecasting similar conditions 2018 for the Southwest in the upcoming winter months.
4
The current six-year rate model estimates growth will average approximately 1.2% annually from FY 2019 to FY 2024. These modest figures were used to ensure adequate margins are achieved to support the District’s financial position and provide stability in the event of future downturns in water usage due to changes in climate conditions or economic events. Sewer Challenges The challenges facing the sewer operation in FY 2019 are similar to the challenges it faced FY 2018. The funding of the Capital Improvement Program (CIP) costs, anticipated debt covenant requirements, and Metro sewer cost increases related to the City of San Diego’s Pure Water program remain the challenges driving the projected rate increases. The increase in the Metro sewer costs related to the Pure Water program remain a challenge; however, the City has pursued additional loan and grant funding, which has reduced the projected Metro fee increases versus the amounts projected in the FY 2018 budget. Metro fees are expected to increase to a cumulative total of $4.1 million over the next five years. When compared to the FY 2018 budget, this increase is $0.9 million less than the cumulative total estimated for the same five-year period. Staff is recommending the District obtain a $5.0 million loan to fund a portion of the sewer CIP, and anticipates the terms of the loan will include a debt coverage covenant of 125%. The FY 2018 budget and proposed rates projected that the borrowing would be needed in FY 2019. Due to Metro refunds, reductions in the projected Metro fee increases, and reductions in the FY 2019 budgeted CIP expenditures, sewer is able to defer borrowing until FY 2020. Due to these changes, the District is also able to both reduce the overall recommended rate increases, and smooth remaining recommended rate increases over additional years. The current proposed sewer rate increases will result in a debt coverage ratio of 196% in FY 2021, and reserves are at target levels in all years projected. There are additional items to note that would impact proposed sewer rate increases in future years.
Budgeted Pure Water costs are estimates based on the most recent information provided by the City. The City’s estimate includes assumptions regarding the allocation of Pure Water costs that have not been finalized and the City’s ability to obtain SRF loans and grant funding for the majority of the capital costs. Changes in the presumed assumptions could impact the proposed sewer rate increases
5
from FY 2020 to FY 2024. When compared to the FY 2018 Metro projections, the City has increased its anticipated loan and grant funding and has communicated Phase 2 of Pure Water will begin around 2024. The City of San Diego has not provided an estimate of how Phase 2 costs will impact Metro agency fees; however, staff is assuming Metro fees will continue to rise and level off in the future, due to the need to fund future loan payments related to the City of San Diego financing Pure Water costs and Pure Water Phase 2 funding. This is a change from the prior year, in which staff assumed Metro fees would increase and decrease based on cash funding requirements and less funding from grants and loans.
On an annual basis, the City reconciles the sewer costs to sewer revenues and refunds the Metro member agencies for any excess revenue collected. Since the FY 2018 budget was prepared and approved, the District has received or will receive a total of approximately $800k in true-up refunds for years covering up to FY 2016 from the City, which were unavailable at the time the FY 2018 budget was prepared. Future refunds or additional billings will affect future budgets by increasing or decreasing the impact of the Metro sewer cost increases and changing the recommended level of the debt issuance.
Strategic Planning and Internal Cost Cutting In addition to the budget and rate setting process, the District’s focus on strategic planning has played a positive role in the financial strength of the District. By managing staffing, automating processes, and implementing Best Management Practices, the District has become more efficient and cost effective. Operating Budget
The proposed FY 2019 budget supports changes in rates and charges from the District’s suppliers including CWA, the City of San Diego and SDG&E. The proposed budget also supports the District’s Capital Improvement Budget and strategic objectives. The proposed budget presents an overall average water rate increase of 3.2% for FY 2019. The rate model also projects 3.2% annual rate increases for water in fiscal years 2020 through 2024. These rate increases will maintain the District’s debt
6
coverage ratios and reserves at or above targeted levels through 2024. For sewer customers, the rate model projects the need for a 4.6% revenue increase in FY 2019. The rate model also projects 4.6% annual rate increases for sewer in fiscal years FY 2020 through FY 2024. When combined with the recommended debt financing, these increases will maintain the reserves and debt coverage at or above targeted levels through 2023. Debt Coverage and Credit Ratings The debt coverage ratio is the ratio of net revenues to debt service. One of the FY 2019 budget objectives is that the District remains at or above the “no growth” debt coverage ratio target and covenant levels. The projected rate increases result in the District maintaining its debt coverage ratio objective. The District historically has a “no growth” debt coverage target and bond covenant of 150% and 100%, respectively. The “no growth” debt coverage ratio excludes capacity fees from the net revenues used in the calculation. The District’s “no growth” debt coverage ratio increased from 133% in FY 2016 to 186% in FY 2017. Staff is projecting a “no growth” debt coverage ratio of 230% in FY 2018 and will remain above the 150% target through 2024, which meets the target and covenant requirements. There is also a 125% “with growth” minimum debt coverage ratio, as defined in the District’s bond covenants. This ratio includes capacity fees, which are omitted from the “no growth” calculation. The District achieved “with growth” bond covenant ratios of 200% in FY 2017 and is estimating the ratio to be 330% in FY 2018. Due to an increase in capacity fees, staff is projecting “with growth” bond covenant debt ratios from FY 2019 to FY 2024 to be between 308% and 243%, which is above the minimum required by the District’s bond covenant. The decline from 2019 to 2024 is due to growth related revenues peaking in the 2019/2020 timeframe and gradually declining over the six-year period as developments are built out. The District currently maintains a split AA/AA- credit rating, which is comprised of a ‘AA’ rating from Standard & Poor’s (S&P) and a ‘AA-’ rating from Fitch Ratings (Fitch). The last credit rating update the District received from either credit agency was in 2016. A credit rating is an overall rating that considers many factors, with debt coverage being one of the main financial factors. These ratings are all related to the
7
District’s water side of the business as no credit rating is issued for the District’s sewer system. In September 2008, the District received a rating upgrade from S&P to ‘AA’, from ‘AA-’, as part of their global rating recalibration for municipal agencies. In March 2012, Fitch lowered their credit rating for the District from ‘AA’ to ‘AA-’, based on lower-than-budgeted water revenues and a corresponding lower debt coverage ratio. In April 2016, S&P affirmed the District’s ‘AA’ rating with a stable outlook. The affirmed outlook was based on good historical coverage metrics, a strong liquidity position, moderate leverage, and strong financial management policies and practices. S&P could take a positive rating action if the District is able to materially widen margins and provide stronger levels of coverage on a basis that S&P believes to be sustainable. They could take a negative action if water demand softens or rate increases are not approved as expected, leading to thinner margins and weaker coverage metrics, or if the District’s liquidity position is significantly drawn down. In February 2016, Fitch affirmed the District’s ‘AA-’ rating. The affirmed rating was based on the District’s willingness to raise rates in support of cost recovery, strong cash reserves, moderate leverage, and capital needs. This rating also recognized the anticipated declines in both water sales and margins due to the drought. The financial strength of the District’s sewer business is evaluated separately from the water business. While the District currently has no sewer related debt, staff is proposing a $5.0 million debt issuance in FY 2020. This debt is needed to meet the capital improvement needs of the District and will require a 125% coverage ratio. The City of San Diego’s pass-through of Pure Water costs to the District impacts the District’s ability to meet the 125% coverage ratio in 2021. When compared to Metro costs prior to Pure Water, the current six-year budget for Metro sewer expenses increased approximately $450k, or an average of $75k per year, due to the City accelerating its Pure Water program and passing through the associated costs to member agencies. The proposed rate increases from FY 2019 to 2024 are needed to achieve the 125% debt coverage covenant and maintain reserves at targeted levels. The current budget projects the debt coverage ratio for sewer will be 196% in 2021, which is above the required debt covenant level. It is important to note that, due to sewer’s size, its debt coverage is sensitive to operating fluctuations. A $50k
8
incremental increase in sewer expenditures results in a corresponding debt coverage decrease of 27%. Financing Plan The District uses a comprehensive approach to financing. The Debt Policy provides guidance for debt issuance and refinancing. The Reserve Policy provides guidance on both fund transfers and reserve balances. With these policies, a six-year financing plan is formulated that identifies the timing and amounts of debt issuances, the level of rate increases, debt coverage ratios, reserve balances, and necessary transfers. Future debt issuances are highly dependent on the rate at which growth returns to the District and how management responds to these variables. Growth is expected to increase significantly in FY 2019 and FY 2020 and gradually decrease in future years. This growth will provide funding for CIPs through capacity fees. In FY 2019, the CIP is supported by the transfers requested in Attachment A and proposed debt issuances for both sewer and water. To support the planned CIP expenditures, staff is proposing that water issue $30.0 million of debt in FY 2019 and sewer issue $5.0 million in 2020. With the proposed transfers, debt issuances, and proposed rates, the District will be able to maintain all reserve levels at or above target levels in the coming fiscal years.
Sewer Rates and Rate Implementation The rate model projects a need for revenues to increase 4.6% annually from fiscal years 2019 and 2024. This need for additional revenue is based on anticipated increases in Metro sewer fees, a requirement to achieve a debt coverage ratio that will meet the requirements associated with the planned debt, and to retain reserve levels at or above target. For FY 2019, the residential winter average usage increased by 33% to 12.6 units. As total sewer charges vary with winter water usage, and as the winter average usage has increased significantly, staff is proposing a 7.0% decrease in sewer rates to achieve the needed net increase in overall revenues of 4.6%. With the adjustments to rates from the Cost of Service Study, and the 7.0% rate reduction, customers who used 12.6 units in
9
both FY 2018 and FY 2019 would see a $3.01 decrease in their monthly bill. Staff prepared the sewer budget using the rates proposed in the sewer Cost of Service Study, which were presented to the Board on March 7, 2018. The study recommended no changes to rate structures, but did make changes to the rates for each customer class due to updated cost allocations. Sewer’s current 218 notice expired with the January 1, 2018 rate increase. In order for the recommended rates to become effective, the Board must hold a sewer 218 Hearing, and then approve the rates. If approved through the 218 process, the rates will become effective for all sewer services billed beginning January 1, 2019. The tables below compare the current rates, Cost of Service Study rates, and January 1, 2019 proposed rates.
10
The following table shows that residential customers with a winter average of 10 HCF or less will see, on average, a slight decrease in their monthly bill. While the average residential customer who has current winter averages of over 10 units will see their monthly bill increase. This impact is a result of three changes: their usage increases, the 7.0% rate reduction, and the Cost of Service rate adjustments.
The District has four multi-residential sewer customers. Their winter averages were relatively consistent with the prior year averages. The table below shows how each of these customers’ bills will change on a per unit basis, with each line representing an individual multi-residential complex. These changes are consistent with the Cost of Service Study presented to the Board in the March 7, 2018, and the 7.0% rate reduction.
Commercial, school, and church sewer customers’ averages were relatively consistent with the prior year averages and they will, as a result, primarily see lower bills. Again their monthly bills are consistent with the Cost of Service Study presented to the Board in the March 7, 2018, and the 7.0% rate reduction. Water Rates and Rate Implementation The proposed overall average water rate increase is 3.2% for all customer classes. The proposed FY 2019 budget covers changes in CWA costs, supports the CIP plan, improves the District’s financial position, and supports the Strategic Plan. The rate model projects annual 3.2% rate increases for water in fiscal years 2020 through 2024.
Multi-Residential by Complex (Figures are on a per dwelling unit basis)
11
Staff prepared this budget using the rate structures approved by the Board on October 4, 2017, after going through the required 218 hearing process. The new rates will be effective for all water services billed beginning January 1, 2019, and may include water used as early as December 1, 2018, depending on the billing cycle. Relative Position to Other Districts The District performs an annual county-wide survey of the water provider rates. For many years, the District has remained in the lower half of this comparison. Depending on their relative dependence on CWA water, it is expected that all water providers in the county are facing the same rate pressures by purchasing water from CWA and MWD. The District’s survey, shown in the attached presentation, illustrates the average District customer using 13 units, will be charged the 4th lowest rate when compare to all 22 agencies in the county. The District also performs an annual survey comparing its sewer rates to other sewer providers in the county. The District’s survey, shown in the attached presentation, illustrates an average residential sewer customer will be charged the 6th lowest rate when compared to all 28 agencies in the county. Water and Sewer Revenues Using the current projected volumes, plus a 1% growth factor for potable and a 1% growth factor for recycled, water sales are budgeted to be $95.5 million and $9.4 million, respectively. This is an 11.8% increase in potable water sales and a 4.7% decrease in recycled water sales versus the FY 2018 budget. When compared to the FY 2018 projection, FY 2019 potable water sales are increasing $4.5 million or 4.8% and recycled water sales are decreasing $0.6 million or 7.3%. The 4.8% increase in potable water sales is due to the 3.2% rate increase, growth, and the full year impact of the rates and rate structures implemented in the Cost of Service Study. Approximately $400k of the decrease in recycled revenues is due to the closure of Salt Creek golf course. The remaining decrease is due to FY 2019 being the first full year to reflect the impact of the rates and rate structures implemented in the Cost of Service Study. The sewer budgeted revenues are expected to increase approximately $94k or 3.2% to $3.1 million compared to last year’s budget due to an increases in the number of customers and
12
winter averages, which are offset by a 7.0% proposed rate decrease. Other changes in the revenues include the following:
Capacity fee revenues funding operating expenses are
expected to increase $140,500 or 9.3%, due to increases in the planning area as major planning projects are completed.
Property tax revenues are expected to increase $81,400 or 1.9%, due to increases in property valuations and growth.
Non-operating revenues are expected to decrease ($109,300) or (5.0%), primarily due to a reduction in cost reimbursements from SANDAG, Caltrans, and billable work orders.
Water Costs For FY 2019, potable and recycled water costs are budgeted to be $52.5 million and $3.8 million, respectively. Water costs represent 52.3% of the District’s operating budget and any changes in the wholesale water price has a significant impact on the overall operating budget. The net water cost is increasing $6.1 million. Approximately $5.2 million of the increase is related to increases in sales volume, while $836k is related to an increase in the average cost per acre-foot of potable water purchased from CWA, which increased purchase costs by $870k, offset by a $34k reduction in fixed fees. The effective average CWA cost per acre-foot is expected to increase $30.00 from $1,673 in FY 2018 to $1,703 in FY 2019. The recycled water rates from the City for FY 2019 is expected to remain at $1.73/HCF in FY 2019. The $0.1 million increase in recycled purchase cost is due to the take-or-pay penalty related to the District not meeting the recycled water contractual minimums. Power Costs Power costs of $3.2 million for water and sewer are budgeted to increase $138k or 4.3% versus the FY 2018 budget. This is due primarily to a 5.0% anticipated price increase from SDG&E. Labor and Benefits The District has, through strategic planning, reduced the FTE count by 23% from 174.75 in FY 2007 to 134.0 in FY 2018. In FY
13
2019, the District will be adding a net of three FTE’s mainly due to anticipated increases in meter sales, inspections, and the ongoing meter register replacement program. The increased FTE’s will be mainly funded by developer fees. The overall reduction in FTE’s since 2007 has saved the District $42.9 million over the eleven-year period. Labor and benefit costs of $22.1 million increased $590k (2.7%) versus the FY 2018 budget. The increase is due to:
o Increase in salaries and related costs for negotiated COLA of $460k.
o Increase in pension costs of $444k based on the June 30, 2016 actuarial valuation. Based on the proposed pension financing plan, staff is estimating these costs will decrease by 35% to 40% in FY 2020 and the District will experience an average annual cash flow savings, net of debt service, of approximately $1.0 million in each future year. This will completely offset the FY 2019 increase.
o Increase in workers compensation of $69k due to the updated workers claim history which resulted in a rate increase.
o Decrease due to increases in allocation to capital projects ($273k).
o Decrease in Healthcare of ($89k) due to a ($50k) reduction in OPEB costs based on June 30, 2017 actuarial study and a ($39k) reduction in healthcare costs due to FY 2018 actual healthcare rate increases being less than the FY 2018 budget.
o Decrease due to net changes in staffing levels of ($40k) due to the elimination of the Assistant General Manager position offset by the addition of four FTE’s. Three of the additional FTE’s are needed to meet the anticipated District growth and will ultimately be funded by growth-related fees.
Annual Salary Schedule While the General Manager has authority to set salaries pursuant to Section 2.01 of the Code of Ordinances, recent legislation, namely the California Code of Regulations (CCR) section 570.5,
14
adopted and effective August 10, 2011, as well as a CalPERS circular letter clarifying section 570.5, require information regarding the compensation of public employees to be publicly available. Thus, in order to be in compliance with CCR 570.5, the District is required to have a publicly available Salary Schedule that “has been duly approved and adopted by the employer’s governing body in accordance with requirements of applicable public meeting laws.” As such, a copy of the Job Classification and Salary Schedule is included herein for Board approval (Exhibit B). Although District salaries are already made public as a part of our NeoGov recruitment system, this Salary Schedule will be retained for public inspection for the required five years and posted to the District’s website per requirements of CalPERS. Please note, that making such information publicly available does not in any way interfere with or change the General Manager’s authority to set salaries pursuant to the authority granted to him. Accordingly, and consistent with such authority, the Board is requested to authorize the General Manager to update the Salary Schedule, when necessary, to reflect changes made within his authority.
Materials and Maintenance The materials and maintenance budget of $3.7 million is increasing $44k or 1.2% due to the following:
o Increase of $169k in Meters and Materials due to increased
meter sales. This increase has a net $0 increase as it is offset by increases in revenues from meter sales and installation fees.
o Increase of $33k in Contracted Services due to increases for ongoing weed abatement at the 54 acre lot and golf course.
o Increase of $31k in Other Materials and Supplies due to increases in meter sales.
o Increase of $29k in Chemicals due for chemicals used in the pax mixer, and residual control system chemical usage.
o Increase of $22k in Fuel and Oil due to rising fuel costs.
o Increase of $18k in Fleet Parts and Equipment due to increasing tire costs and a new truck bed.
15
o Increase of $8k in Safety Equipment due to a transfer of safety equipment out of infrastructure equipment and supplies.
o Decrease of ($195k) or 23.8% in Metro O&M fees due to a decrease in projected cash funding requirements for the City of San Diego’s Pure Water program, in addition to the District exceeding budgeted flows to Metro in 2018 due to upsets at the treatment plant. Staff anticipates flows to Metro will return to normal in FY 2019. Due to the City’s Pure Water program, staff estimates Metro fees will increase from $625,500 in FY 2019 to $864,400 in FY 2020, and remain at the FY 2020 levels for all future years. When compared to the FY 2018 rate model, the overall increase in Metro fees was reduced from approximately $5.0 million to $4.1 million through 2023. The decrease is a result of the City debt funding and/or obtaining more grant funding for its Pure Water program.
o Decrease of ($59k) in Infrastructure Equipment and Supplies primarily because the previous fiscal year’s budget included one-time equipment purchases and maintenance expenses that were infrequent in nature.
o Decrease of ($21k) in Laboratory Equipment and Supplies due to the removal of glassware washer and handheld instruments that were one-time purchases in the FY18 budget.
Administrative Expenses The administrative expenses budget of $6.2 million is increasing, versus the FY 2018 budget, by $668k or 12.2%, primarily due to the following:
o Increases in Insurance and Legal Expense of $380k or 33.5%, are primarily due to Insurance Expense increasing $235k due to a $52k increase in the deductible for main breaks and $183k increase in the premiums versus FY 2018. The increases were due to the District’s recent insurance claim history. Legal expense is budgeted to increase $145k due to the Cozier lawsuit of $90k and Office of Education lawsuit of $40k. The legal budget continues to include anticipated costs related to City of San Diego lawsuit.
16
For FY 2018 and FY 2019, the legal budget includes $225k and $175k, respectively, for the City of San Diego lawsuit.
o Increase in combined Equipment and Services Expense of $252k due to: $105k increase for the purchase of a pax mixer and residual control system for the North District system to reduce nitrification events, improve water quality and meet EPA mandates, $55k funding for EMA daily bacti samples collected and analyzed for the use area, $50k for the sale of the Salt Creek property, and $50k for scrubber repairs at the treatment plant. These increases were offset by $35k related to the removal of rate studies from the FY 2019 budget.
o Increase in Director’s budget of $31k or 21.5% to meet potential increases in the Board of Directors’ fee amounts and anticipated increases in Director Reimbursements.
o Increase in Fees of $16k or 2.5% due to increases of $16k for election fees and $30k for APCD fee increases. These increases were offset by a reduction of $15k in SWRCB water system fees.
o Increase in conservation and outreach primarily due to $10k being added to the FY 2019 budget for education outreach with the Chula Vista School District.
Transfers The requested transfers serve the purpose of ensuring the reserves are funded at target levels, in accordance with the Reserve Policy. There are two types of transfers the District can make. The first is the use of operating revenues to fund reserves which are shown in the operating budget. The second type of transfer is fund to fund. Both types rebalance funds to target levels. The total fund to fund transfers requested in this staff report is $10,962,200. Capital Improvement Program (CIP) Budget As a component of the annual budget development process, the Engineering staff updates the CIP budget. This year, the total six-year CIP budget of $92.8 million is decreasing by $9.5 million versus last year. Water and sewer total CIP budgets for the six-year period are $81.6 million and $11.2 million,
17
respectively. The majority of the decrease is a due to completing $20.1 million in CIP project expenditures in FY 2018 and projecting $10.5 million of projects in 2024. The following process is used to prepare the CIP budget:
CIP projects selected are based on the Water Facilities Master Plan (WFMP), the Urban Water Management Plan (UWMP), Sub Area Master Plan (SAMP), Integrated Water Resources Plan (IRP), Sewer System Management Plan (SSMP), and other focused or specific planning documents and reports.
The CIP goes through an iterative process to meet the criteria of growth, service levels, supply targets, and system requirements.
CIP target expenditures for the next six years are refined and used in the rate model.
The following general criteria are used to determine the reasonableness of a project before it is considered for inclusion within the CIP budget:
Existing facility conditions. Operating system conditions. Water and sewer system deficiencies. Regulatory and permitting requirements. Developer driven requirements. Economic outlook. Growth projections. Water supply diversification goals. Board and management directives.
This year, the CIP budget includes the following amounts by project category. Project details within each of the categories are located in Exhibit 1 under the Capital Budget tab. In order to fund these projects, staff is projecting the water fund will need to borrow funds in FY 2019 and the sewer fund will need to borrow funds beginning in FY 2020. FISCAL IMPACT: Joseph R. Beachem, Chief Financial Officer
A six-year rate modeling effort is one of the ways the District can better inform its customers, minimize financial risks, reduce rate impacts, and establish fiscal strength.
18
The recommended balanced operating budget totals $108.0 million and the recommended CIP budget totals $24.2 million. With budget approval, the District will move forward into FY 2019 with clear financial direction and with rates that will strengthen the coverages at or above target levels. This budget, with the recommended transfers, provides sufficient funding to pay increased water costs; continues funding for the District’s administration, maintenance, and operations; and is consistent with the Strategic Plan and Reserve Policy. STRATEGIC OUTLOOK: The District ensures its continued financial health through long-term financial planning and debt planning. LEGAL IMPACT: None. Attachments:
A) Fund Transfers B) Resolution No. 4345
Exhibit A - FY 2018-19 Preliminary Operating and Capital Budget
Exhibit B - Job Classification and Salary Schedule C) Ordinance No. 567
D) FY 2018-19 Budget Presentation E) The Expera Group Economic Report F) The Expera Group Presentation
Fund Transfers for the FY 2018-2019 Operating and Capital Budget
Potable: Designated Expansion to Designated Betterment $ 2,196,000 Designated Replacement to General Fund Reserve 4,423,100 Designated Expansion to General Fund Reserve 1,254,000 Recycled: Designated Replacement to Designated Betterment 28,200 Designated Replacement to Designated Expansion 94,800 General Fund Reserve to Designated Expansion 1,443,900
Sewer: Designated Replacement to Designated Betterment 438,000 General Fund Reserve to Designated Betterment 1,084,200
Total Transfers $ 10,962,200
Attachment A
Page 1 of 2
RESOLUTION NO. 4345
A RESOLUTION OF THE BOARD OF DIRECTORS OF
OTAY WATER DISTRICT ADOPTING THE FISCAL YEAR 2018-2019
OPERATING AND CAPITAL BUDGET; AND SALARY SCHEDULE
WHEREAS, the Otay Water District Board of Directors have
been presented with a budget (Exhibit A) for the operation of the
Otay Water District for Fiscal Year 2018-2019; and
WHEREAS, the Fiscal Year 2018-2019 Operating and Capital
Budget, has been reviewed and considered by the Board;
WHEREAS, it is in the interest of the District to adopt a
budget for said year;
WHEREAS, in connection with the adoption of the budget, the
Board is also being presented with the Salary Schedule
(Exhibit B) for its consideration, in order to comply with
California Code of Regulations Section 570.5,
NOW, THEREFORE, BE IT RESOLVED, DETERMINED AND ORDERED by
the Board of Directors of the Otay Water District that the
Operating and Capital Budget for the operation of the District,
incorporated herein by reference, is hereby adopted as the
District’s budget for Fiscal Year 2018-2019.
BE IT FURTHER RESOLVED that the Board hereby approves and
adopts the Salary Schedule included with the budget and,
consistent with his authority over employee compensation under
both State law and the District’s Code of Ordinances, authorizes
the General Manager to update the Salary Schedule whenever
necessary to reflect changes made within his authority.
Attachment B
Page 2 of 2
PASSED, APPROVED AND ADOPTED by the Board of Directors of
Otay Water District at a board meeting held this 21st day of May
Total Water Sales 73,977,348$ 82,146,988$ 77,036,300$ 86,956,300$ 9,920,000$ 12.9%
Water Sales 56,119,900$ 64.6% System Fees 15,340,700 17.6% Energy Fees 2,335,300 2.7% MWD and CWA Fixed Fees 12,268,400 14.1% Penalties 892,000 1.0%
Total Water Sales 86,956,300$ 100.0%
Water Sales: Water rates vary among classes of service and are charged per unit of water. A unit of water is equal to 100
cubic feet of water.
System Fees: Each water service customer pays a monthly system charge for water system replacement, maintenance,
and operation expenses. The charge is based on the size of the meter.
Energy Fees: The energy pumping fee is $ .056 per 100 cubic feet of water for each 100 feet of lift above the elevation
of 450 feet. All water customers are in one of 29 zones based on elevation.
MWD and CWA Fixed Fees: These pass-through charges are calculated to recover the MWD's and CWA's fixed annual
costs including the construction, operation and maintenance of aqueducts, and emergency storage projects.These fixed charges are based on the size of the meter.
Penalties: Charges and penalties are imposed on customer accounts for late payments and returned checks.
FY 2019 Classification of Water Sales
Classification of Water Sales - Potable
FY 2018Budget to Budget
Variance
8
Tier Rate Structure Current Proposed Accounts Unit Sales Budget
Residential
46,018 7,057,600 30,965,300$
1 - 10 3.05$ 3.17$
11 - 22 5.44 5.65
over 23 hcf 7.03 7.30
Multi-Residential872 1,612,700 6,476,300
0 - 4 2.85 2.96 5 - 9 5.17 5.37
over 10 hcf 6.35 6.60
Business and Publicly-Owned
1 unit 3.61 3.75 1,490 2,005,600 7,368,800
Irrigation and Commercial Agricultural
1 unit 5.27 5.47 1,445 2,120,800 10,856,300
49,825 12,796,700 55,666,700$
Government Fee 0.41 0.42 - - 453,200
Total Water Sales 49,825 12,796,700 56,119,900$
Unit %
Residential 7,057,600 55.1%
Multi-Residential 1,612,700 12.6%
Business and Pubicly-Owned 2,005,600 15.7%
Irrigation and Commercial Agricultural
2,120,800 16.6%
Total Water Sales 12,796,700 100.0%
Water Sales Summary by Service Class - Potable
Water Rates FY 2019
FY 2019 Unit Sales by Service Class
(1) Proposed rates for water billed beginning in January 2019.
Total 49,630 12,030,400$ 12,268,400$ 238,000$ 2.0%
(1) Construction Meters, Fire Services, and Recycled Meters are exempt from MWD and CWA Fixed Fees.(2) Proposed rates for water billed beginning in January 2019.
Historical MWD and CWA Fixed Fees, in millions ($)
MWD and CWA Fixed Fees (Pass-Through) - Potable
MWD and CWA Fixed Fees Budget to Budget Variance
$0$2$4$6$8
$10$12$14
FY 2015Actual
FY 2016Actual
FY 2017Actual
FY 2018Projected
FY 2018Budget
FY 2019Budget
(1) (2)
12
Meter Size Meter Sales Installation Fee Meter Fee Total Fees Budget
0.75 700 111.25$ 234.44$ 345.69$ 242,000$
1.00 1 111.25 302.52 413.77 400
1.50 9 111.25 491.72 602.97 5,400
2.00 3 111.25 704.58 815.83 2,400
3.00 7 669.83 2,195.75 2,865.58 20,100
4.00 - 669.83 3,813.67 4,483.50 -
6.00 - 1,058.05 6,587.25 7,645.30 -
8.00 - 1,622.42 8,230.28 9,852.70 -
10.00 - 1,622.42 11,836.68 13,459.10 -
Total 720 270,300$
Meter Fees - Potable
FY 2019
Historical Meter Count
Meter Fees: Charges collected for new water service connections. Fees vary depending upon meter sizeand type of service. The costs associated with meter installations are included in the Operating Expensessection of the budget. These charges are funded by developers.
Meter Fees: Charges collected for new water service connections. Fees vary depending upon metersize and type of service. The costs associated with meter installations are included in the OperatingExpenses section of the budget. These charges are funded by developers.
Meter Fees - Recycled
FY 2019
Historical Meter Count
550 575 600 625 650 675 700 725
FY 2015Actual
FY 2016Actual
FY 2017Actual
FY 2018Projected
FY 2018Budget
FY 2019Budget
24
FY 2015 FY 2016 FY 2017 FY 2019
Projected Budget Budget
Water Sales 6,412,122$ 6,240,661$ 7,431,235$ 7,618,783$ 7,493,200$ 6,838,800$
System Fees 431,121 471,962 434,775 592,324 589,100 804,300
Energy Fees 369,302 379,026 417,595 342,136 313,700 343,800
MWD and CWA Rebates 1,611,764 1,396,472 1,436,935 1,557,972 1,428,400 1,383,500
Average Cost Per Acre-Foot (Effective Rate) 1,256.59$ 1,396.89$ 1,500.76$
(1) This is the anticipated take-or-pay amount to be paid to the City of San Diego. The contract requires the purchase of minimum volume of water. The District does not anticipate meeting the minimum therefore, a payment would be due to the City of San Diego.
Total General Expense 2,439,985$ 2,023,552$ 2,242,200$ 2,585,700$ 108,400$ 4.8%
General Expense
Budget to Budget Variance
(1) Benefits include District-wide labor and benefit costs not attributable to any one department, such as theeffect of cost of living raises on accrued leave liabilities or the Other Post Employment Benefit (OPEB) costs.These costs are netted against the District's anticipated Vacancy Factor. The Vacancy Factor for FY 2018and FY 2019 is $205,300 and $212,500, respectively. Additionally, the labor and benefits shown on thisschedule are those related to operating costs and does not include CIP labor and benefit costs.
(2) Included in the Legal Expenses for FY 2018 and FY 2019 is $225,000 and $175,000 respectively, for the City of San Diego Recycled Water Rate Lawsuit.
FY 2018
40
Board of Directors 175,800$ 0.5%General Manager 1,732,700 5.2%
Information Technology Operations/Applications Chief Information Officer 0 0 0 IT Manager 1 1 1 GIS Manager 1 1 1 GIS Programmer/Analyst 1 1 1 GIS Analyst 1 1 1
Position Count by Department
FY 2017 FY 2019
(1) The District’s strategic planning efforts of streamlining business processes enabled the District to be more efficient and provided an opportunity to reduce staffing.
44
FY 2018
Information Technology Operations/Applications (continued)
GIS Technician 1 1 1 Network Engineer 1 1 1 Database Administrator 1 1 1 Data Systems Technician 1 1 1 System Support Analyst 1 1 1 Business Systems Analyst I and II 2 2 2 Network Analyst 0 0 0Information Technology 11 11 11
Total FTE - Administrative Services Department 23 23 23
Customer Service: Customer Service Manager 1 1 1 Customer Service Supervisor 1 1 1 Lead Customer Service Representative 1 1 1 Customer Service Representative I, II, III 6 6 6Customer Service 9 9 9
(1) The District’s strategic planning efforts of streamlining business processes enabled the District to be more efficient and provided an opportunity to reduce staffing.
Position Count by Department
45
FY 2018Meter Maintenance Meter Services Supervisor 0 1 1 Lead Cross Connection/Meter Maintenance Worker 1 0 0 Meter Maintenance Worker I & II 3 3 4 Lead Customer Service Field Representative 1 1 1 Customer Service Field Representative I and II 2 2 3Meter Maintenance 7 7 9
Total FTE - Finance Department 31 29 31
Operations Chief, Water Operations 1 1 1 Assistant Chief, Water Operations 1 1 1 Executive Secretary 1 1 1Operations 3 3 3 Water System Operations
System Operations Manager 1 1 1
Water Systems Supervisor 1 1 1
Recycled Water Systems Supervisor 0 0 0
Lead Water Systems Operator 2 2 2
Water Systems Operator I, II, and III 8 8 8
Senior SCADA Instrumentation Technician 2 2 2
Senior Disinfection Technician 2 2 2
Recycled Water Distribution Operator 0 0 0
Water System Operations 16 16 16
Utility Maintenance/Construction
Utility Maintenance Supervisor 2 2 2
Utility Crew Leader 3 3 3
Utility Workers I and II 8 8 8
Senior Utility/Equipment Operator 3 3 3
Valve Maintenance Worker 2 2 2
Pump Electricial Supervisor 1 1 1
Electrician I and II 2 2 2
Pump Mechanic I and II 2 2 2
Fleet Maintenance Supervisor 1 1 1
Equipment Mechanic I and II 3 3 3
Utility Maintenance/Construction 27 27 27
Collection/Treatment/Reclamation Operations Reclamation Plant Supervisor 1 1 1 Lead Reclamation Plant Operator 1 1 1 Reclamation Plant Operator I, II, III 2 2 2 Senior SCADA Instrumentation Technician 0 0 0 Laboratory Analyst 1 2 2Collection/Treatment/Reclamation Operations 5 6 6
Public Services, Survey, Inspection, & Recycled Water Program Engineering Manager 1 1 1 Field Services Manager 1 1 1 Permit Technicians 2 2 2 Recycled Water Program Supervisor 1 1 1 Recycled Water Specialist 3 3 3 Inspection Supervisor 1 1 1 Lead Construction Inspector 0 0 0 Construction Inspectors I and II 3 3 4 Supervising Land Surveyor 1 1 1 Assistant Survey Technician 1 1 2Public Services, Survey, Inspection, & Recycled Water Program 14 14 16Total FTE - Engineering Department 24 24 26
Total Expenses 2,439,985$ 2,023,552$ 2,242,200$ 2,585,700$
(1) Benefits include District-wide labor and benefit costs not attributable to any one department, such as theeffect of cost of living raises on accrued leave liabilities or the Other Post Employment Benefit (OPEB) costs.These costs are netted against the District's anticipated Vacancy Factor. The Vacancy Factor for FY 2018and FY 2019 is $205,300 and $212,500, respectively. Additionally, the labor and benefits shown on thisschedule are those related to operating costs and does not include CIP labor and benefit costs.
(2) Included in the Legal Expenses for FY 2018 and FY 2019 is $225,000 and $175,000 respectively, for the City of San Diego Recycled Water Rate Lawsuit.
General ExpenseThe expenditures in this section are general operating costs not associated with an individualdepartment. The expenditures include: legal costs, insurance premiums, changes in accruedemployee leave balances and miscellaneous interest. These expenditures represent 7.8% of thetotal Department Budget.
Department
Object
$-
$500
$1,000
$1,500
$2,000
$2,500
$3,000
2017 2018 2019
2,00
6 2,24
2 2,58
6
2,44
0
2,02
4
Budget Actual/Projected
91
FY 2017 FY 2019 Actual Projected Budget Budget
Total Labor and Benefits 1,397,852$ 868,374$ 1,106,200$ 1,069,600$
R2151 RWCWRF - Bulk Chlorine Vapor Scrubber System Refurbishment
35 2 - - - - 37
Six-Year CIP Projects by Source and Fund ($1,000s)
95
Replacement, ContinuedCIP No CIP Project Title FY 2019 FY 2020 FY 2021 FY 2022 FY 2023 FY 2024 TotalS2012 San Diego County Sanitation District Outfall and RSD Outfall
Replacement50 50 125 125 125 125 600
S2024 Campo Road Sewer Main Replacement 2,000 400 - - - - 2,400
S2027 Rancho San Diego Pump Station Rehabilitation 5 5 220 220 - - 450
Total CIP by Fund 24,239$ 18,361$ 13,566$ 10,707$ 12,446$ 13,482$ 92,801$
Six-Year CIP Projects by Source and Fund ($1,000s)
96
Quantity Amount
Vehicles1 One-half ton extra cab truck for the Survey Department. 46,000$ 1 1/2 ton extra cab truck for the Survey Department. 46,000 1 1/2 ton extra cab truck for the Inspection Department. 40,000 1 Compact truck for the Meter Reading Department. 29,500 1 One-ton truck for the Meter Maintenance Department. 56,000 1 One-ton truck for the Meter Maintenance Department. 49,500 1 Compact truck for the Meter Maintenance Department. 29,500 1 HAZWOP van for the Water Systems Department. 65,000 1 One-ton extra cab dual rear wheel truck for the valve crew. 56,000 1 Class 5 dump truck for the Utility Maintenance Department. 63,000 1 1/2 ton truck for the Water Systems Department. 40,000
Total vehicles 520,500
Field Equipment1 Replacement force main inspection UTV for Utility Maintenance. 15,000 1 Replacement rubber tire loader for Utility Maintenance Department. 177,600 1 Mini excavator for Utility Maintenance Department. 138,000 1 Replacement trailer, new loader and mini excavator. 32,800
Total field equipment 363,400
Total 883,900$
Summary by ProjectP2282 Vehicles 520,500 P2286 Field equipment 363,400 Total 883,900$
FY 2019 Capital Purchases
Description
Capital purchases are non-recurring operating expense items for District-wide use that cost more than$10,000 each and have an estimated useful life of two years or more. The capital purchase projects includevehicles, office equipment and furniture, field equipment and APCD engine replacements and retrofits.
97
This page intentionally left blank
98
P2040Res - 1655-1 Reservoir 0.5 MG
Kevin Cameron
8/19/1992
5
3
$3,400,000
PROJECT MANAGER:
ORIGINAL APPROVED DATE:
RELATED CIP PROJECTS:
PROJECT TITLE: CIP Number:
DIRECTOR DIVISION:
PRIORITY:
BUDGET AMOUNT:
DESCRIPTION OF PROJECT:
This project is for construction of a 0.5 million gallon reservoir and approximately 1,500 feet of 12-inch pipeline to connect to the existing system at Prisilla Drive. These improvements are located within the Rancho Jamul Estates area.
JUSTIFICATION OF PROJECT:
The project will increase both system reliability and service capabilities, and provide adequate fire protection for the Rancho Jamul Estates area within the 1655 Pressure Zone. The existing system is currently served with a hydropneumatic Pump Station. This current system isn't sufficient to meet fire flow demand and the Board agreed they would build the Reservoir as part of an exchange for land in the early 2000's.
COMMENTS:
In early 2000, the project was designed to 90%, and due to the economy, the project was put on hold. The overall budget was increased to account for the spending done prior to FY 2015. The project budget increased $1.2 Million after receiving a preliminary cost estimate from a concrete tank manufacturer and updating cost estimates from the estimate done in 2000. The concrete tank will have to be a Type I due to location and steep grades. Also, added updated costs for Reservoir security items.
FUNDING SOURCE: Expansion Betterment Replacement New Water Supply Total
P2174PS - 1090-1 Pump Station Replacement (400 gpm)
Jeff Marchioro
5/23/2016
P2176
5
2
$2,500,000
PROJECT MANAGER:
ORIGINAL APPROVED DATE:
RELATED CIP PROJECTS:
PROJECT TITLE: CIP Number:
DIRECTOR DIVISION:
PRIORITY:
BUDGET AMOUNT:
DESCRIPTION OF PROJECT:
Replace the existing Pump Station which serves the small 1090 Pressure Zone containing approximately thirty-two (32) potable meters and eight (8) hydrants. Improvements to the Pump Station will include a fire pump (1,500 gpm) and modifications to allow this Station to function with closed zone capability in the event that the 1090-1 Reservoir is out for inspection, maintenance, or repairs.
JUSTIFICATION OF PROJECT:
The existing Pump Station, originally constructed in 1962, has reached the end of its useful life.
COMMENTS:
Long duration 1090-1 Reservoir maintenance projects may be facilitated by the procurement of a Portable Trailer Mounted VFD Pump (CIP P2640).
FUNDING SOURCE: Expansion Betterment Replacement New Water Supply Total
This project is for the installation and replacement of the physical security burglar alarm systems to Digital Monitoring Systems (DMP) and associated security components at 23 District facilities. This is to ready sites for enterprise security and access control management software "ENTRE."
JUSTIFICATION OF PROJECT:
This project is to improve the security of the Otay Water District facilities by installing and upgrading the hardware and software required to provide access control management, intrusion detection and response, and to ready the facilities for future evaluation of video camera verification systems.
Although existing facilities are relatively safe and secure, the federal government has recommended that security to water systems be improved.
COMMENTS:
FY 2018 includes $150K to extend access controls and security enhancements to additional facilities on a per project basis. $325K is earmarked in FY 2018 and FY 2019 to address security items identified in the RWCWRF Master Plan including laser scan security system with cameras.
FUNDING SOURCE: Expansion Betterment Replacement New Water Supply Total
P2400PL - 20-Inch Pipeline Replacement, 711 Zone, Otay Lakes Road - at Santa Paula
Jeff Marchioro
5/23/2016
1
2
$2,280,000
PROJECT MANAGER:
ORIGINAL APPROVED DATE:
RELATED CIP PROJECTS:
PROJECT TITLE: CIP Number:
DIRECTOR DIVISION:
PRIORITY:
BUDGET AMOUNT:
DESCRIPTION OF PROJECT:
This project is to replace 3,700 feet of 16-inch asbestos concrete water main in Otay Lakes Road at Santa Paula.
JUSTIFICATION OF PROJECT:
The existing water main bottlenecks from 20-inch down to 16-inch. The existing 16-inch pipe causes high head loss at peak flow limiting the amount of water that can be delivered. The upsizing is needed to meet future anticipated demand. The timing of the project aligns with the development and related demand increases.
COMMENTS:
Overall budget increased in FY 2018 to match 2015 Water Facilities Master Plan (WFMP) Update.
FUNDING SOURCE: Expansion Betterment Replacement New Water Supply Total
P2405PL - 624/340 PRS, Paseo Ranchero and Otay Valley Road
Kevin Cameron
5/23/2016
2
2
$650,000
PROJECT MANAGER:
ORIGINAL APPROVED DATE:
RELATED CIP PROJECTS:
PROJECT TITLE: CIP Number:
DIRECTOR DIVISION:
PRIORITY:
BUDGET AMOUNT:
DESCRIPTION OF PROJECT:
This project is for the construction of approximately 1,200 feet of 12-inch pipeline in the 340 Pressure Zone in Otay Valley Road and the 16-inch pipeline in Otay Valley Road. Construction of a pressure reducing station between the 624/340 Pressure Zone near the intersection of Otay Valley Road/Main Street and Heritage Road.
JUSTIFICATION OF PROJECT:
This will provide a redundant service connection to the 340 Pressure Zone. The current pipeline is an environmentally sensitive area and not in the street. This project will relocate the pipe and allow redundant delivery through the newly extended Heritage Road. The developer is paying for the replacement and the District is paying for the cost to upsize the pipe.
COMMENTS:
FUNDING SOURCE: Expansion Betterment Replacement New Water Supply Total
P2451Otay Mesa Desalination Conveyance and Disinfection System
Bob Kennedy
5/23/2006
P2083
2
2
$30,000,000
PROJECT MANAGER:
ORIGINAL APPROVED DATE:
RELATED CIP PROJECTS:
PROJECT TITLE: CIP Number:
DIRECTOR DIVISION:
PRIORITY:
BUDGET AMOUNT:
DESCRIPTION OF PROJECT:
The Otay Water District could potentially receive a potable water supply source from the planned Rosarito Desalination Facility via a conveyance system, pumping facilities, and disinfection system.
JUSTIFICATION OF PROJECT:
The concept could provide for an independent water source to the Otay Water District.
COMMENTS:
Original Budget amount approved 5/23/2006 for $1,000,000. Budget increase approved 6/25/2008 to $5,000,000. On 5/21/2009, the Budget was increased to $30,000,000 ($1,000,000 for UV Treatment, $9,000,000 for Pump Station, and $20,000,000 for Conveyance Pipeline).
FUNDING SOURCE: Expansion Betterment Replacement New Water Supply Total
Betterment ID 22 0 % 69 % 0 % 0 % 69 %New Water Supply Fee Projects
This project is for all utility relocations required due to construction of the SR-11 on the Otay Mesa. Facility relocations vary in size from 8-inch to 24-inch. Both the potable and recycled water systems are impacted.
JUSTIFICATION OF PROJECT:
Caltrans will construct the SR-11, which will result in utility conflicts with existing Otay Water District facilities at various locations. In most cases, the Otay Water District does have prior and superior rights. The facilities must be relocated prior to Caltrans' construction of the SR-11. The cost of the facilities relocations that have prior rights will be reimbursed by Caltrans.
COMMENTS:
FUNDING SOURCE: Expansion Betterment Replacement New Water Supply Total
This project is for the steel trestle demolition and removal of a pipeline. The 1960's steel trestle 24-inch pipeline crossing of Otay River was replaced by the Central Area and Otay Mesa Interconnection Pipeline in 2001. The trestle also carries a high pressure gas line that supplies the 870-1 Pump Station that prevented the trestle from being demolished previously. SDG&E abandoned this gas line in 2017 and replaced it with a feed from the south.
JUSTIFICATION OF PROJECT:
The existing pipeline is no longer in service and should be removed to address liability concerns. The pipeline runs over a canyon and there are concerns that unauthorized individuals could gain access and be injured. The pipeline is in an environmentally sensitive area and becoming increasingly difficult to access. The Central Area - Otay Mesa Interconnection Pipeline supplies water to the Otay Mesa System.
COMMENTS:
Demolition of the trestle has been delayed until the completion of the 870-2 Pump Station Replacement project to avoid area access conflicts. This also provides time for an environmental study ($100K) to be prepared for the project starting Spring 2019 and assess potential site access concerns.
FUNDING SOURCE: Expansion Betterment Replacement New Water Supply Total
P2485SCADA - Infrastructure and Communications Replacement
Michael Kerr
5/21/2009
0
1
$2,428,000
PROJECT MANAGER:
ORIGINAL APPROVED DATE:
RELATED CIP PROJECTS:
PROJECT TITLE: CIP Number:
DIRECTOR DIVISION:
PRIORITY:
BUDGET AMOUNT:
DESCRIPTION OF PROJECT:
This project will replace the existing SCADA software and radio communication system and install fuel level transmitters on all diesel fuel tanks. A battery backup system will be installed at remote SCADA/radio sites without emergency power generators.
JUSTIFICATION OF PROJECT:
Beginning in 2012, the vendor no longer upgrades or supports the existing system. The radio equipment needs replacement to allow for increased bandwidth capability to increase security systems functionality. The fuel level transmitters on all diesel fuel tanks and remote SCADA monitoring will provide supervisors with real-time fuel levels to monitor available runtime on stand-by engines during extended power outages. The battery backup system will provide continuous communications and SCADA monitoring and control for three (3) days if the District lost power at sites without emergency power generators.
COMMENTS:
Going into FY 2018 and beyond, the anticipated expenditures are for the following:
Work also includes completing the installation of new UPS and cooling system for the support of the District’s SCADA technology infrastructure - $120K
Staff also are including sites that were unanticipated during initial recommended list of sites in support of the SCADA systems data and security communications services. Staff identified three (3) sites that require extensive work (power panel, conduits, circuits, and cabinet installation) - $55K
Emergency Operations Center – $22K
Replacement of PLC’s (facility-wide) throughout FY 2021:FY 2018 ($85K)FY 2019 ($84K)FY 2020 ($85K)FY 2021 ($24K)
FUNDING SOURCE: Expansion Betterment Replacement New Water Supply Total
This project is to develop a plan to streamline the environmental permitting processes for the Capital Improvement Program projects to be constructed.
JUSTIFICATION OF PROJECT:
The project will save time and money when compared to environmental permitting each Capital Improvement Program project individually.
COMMENTS:
An additional $50,000 is requested to be added to the budget in order to complete the Habitat Conservation Plan. The Plan is ready to be submitted to the Resource Agencies and they will have comments that will need to be addressed by the consultant and District staff before finalizing the Plan. In addition, the Plan must undergo basic CEQA compliance and the funds needed for that compliance, combined with the effort to address agency review comments, will exceed the current budgeted amount. This effort has taken many years, but will greatly streamline biological permitting for CIP projects as well as operations and maintenance issues once it is approved and in place.
FUNDING SOURCE: Expansion Betterment Replacement New Water Supply Total
P2500Padre Dam - Otay Interconnection Dehesa Valley
Jeff Marchioro
5/24/2017
5
1
$240,000
PROJECT MANAGER:
ORIGINAL APPROVED DATE:
RELATED CIP PROJECTS:
PROJECT TITLE: CIP Number:
DIRECTOR DIVISION:
PRIORITY:
BUDGET AMOUNT:
DESCRIPTION OF PROJECT:
Add an interconnection of the potable water system with Padre Dam MWD to provide a redundant supply to the District's most northeastern areas in the event of an emergency. The facility will include a meter, vault, telemetry, and other interconnection appurtenances.
JUSTIFICATION OF PROJECT:
Adds a redundant water supply to the District in the event of an emergency. The District currently does not have a redundant service connection for serving the Dehesa Valley area of the District. The interconnection is the most cost effective alternative. The other alternative would be to build a pipeline to this area, which is cost prohibitive.
COMMENTS:
FUNDING SOURCE: Expansion Betterment Replacement New Water Supply Total
This project is for the utility relocations due to construction improvements to I-805 near East Palomar Street. Both the existing potable and recycled water systems will be impacted.
JUSTIFICATION OF PROJECT:
Caltrans will be making improvements to I-805 that will result in conflicts with existing pipelines. Project funds reimbursement to Caltrans.
COMMENTS:
Project budget reduced $150K in FY 2018.
FUNDING SOURCE: Expansion Betterment Replacement New Water Supply Total
P2508Pipeline Cathodic Protection Replacement Program
Jeff Marchioro
5/17/2010
0
1
$1,250,000
PROJECT MANAGER:
ORIGINAL APPROVED DATE:
RELATED CIP PROJECTS:
PROJECT TITLE: CIP Number:
DIRECTOR DIVISION:
PRIORITY:
BUDGET AMOUNT:
DESCRIPTION OF PROJECT:
This project is for the replacement and repairs of existing cathodic protection systems on six (6) pipelines in environmentally sensitive areas, including the District's existing 1980 era 14-inch Forcemain, 2000 era Interconnect Pipelines between the Central Area and Otay Mesa, 1998 era pipeline along Proctor Valley Road, 1987 era pipelines in the Sweetwater River Bridge at Campo Road, 2004 era pipeline crossing Salt Creek, and 1981 era pipeline crossing the Sweetwater River.
JUSTIFICATION OF PROJECT:
The ongoing cathodic protection program efforts have identified various pipelines for anode replacement, cathodic test station repairs, installation of isolation kits, and repair of existing anode beds.
COMMENTS:
Budget increased to account for construction project that will be advertised for bid in April 2018 and awarded in July 2018. This blanket CIP has been split into five (5) CIPs based on service type and groups of pipelines based on location. CIP P2508 will be closed after construction and warranty phase of the project that will be awarded in 2018 (i.e., this CIP will be closed at the end of FY 2020).
FUNDING SOURCE: Expansion Betterment Replacement New Water Supply Total
This project is for construction of approximately 1,250 feet of 12-inch pipeline in Jamacha Road and Osage Drive in the 640 Pressure Zone. The pipe can last up to 85 years. Needs an inspection to assess condition.
JUSTIFICATION OF PROJECT:
The existing 1958 era pipelines are located in easements in the side yards of homes. The pipelines are a risk and liability to the District if they were to fail. This project will relocate the pipeline from yards to the streets.
COMMENTS:
Overall project budget increased in FY 2018 to match 2015 Water Facilities Master Plan.
FUNDING SOURCE: Expansion Betterment Replacement New Water Supply Total
This project is for the retrofit and upgrade of approximately 50 large meter vaults to either above ground conditions or eliminate the confined space depth.
JUSTIFICATION OF PROJECT:
The existing large meters are installed in below grade vaults, which create increased costs and safety issues due to confined space requirements. Some of the existing below grade systems are subject to flooding and create corrosive environments.
COMMENTS:
This is a re-activation of a previous CIP that incurred about $220K in costs through FY 2014. Current scope of work cost is $400K over 4 years, starting in FY 2017. Staff will be looking at vaults again to see if additional meters can be brought above ground or retrofits done to eliminate the confined space requirement.
FUNDING SOURCE: Expansion Betterment Replacement New Water Supply Total
This project is for the interior and exterior coating of the 711-2 Reservoir. In addition, an assessment of the facility will be accomplished to assure compliance to all applicable codes and OSHA standards.
JUSTIFICATION OF PROJECT:
Based upon the 2011 Cathodic Assessment Report, the 711-2 Reservoir interior and exterior coatings are in relatively poor condition and are in need of replacement.
COMMENTS:
Budget decreased from $840K to $820K in FY 2019.
FUNDING SOURCE: Expansion Betterment Replacement New Water Supply Total
This project is for the interior and exterior coating of the 711-1 Reservoir. In addition, an assessment of the facility will be accomplished to assure compliance to all applicable codes and OSHA standards.
JUSTIFICATION OF PROJECT:
Based upon the 2011 Cathodic Assessment Report, the 711-1 Reservoir interior and exterior coatings are in relatively poor condition and are in need of replacement.
COMMENTS:
FUNDING SOURCE: Expansion Betterment Replacement New Water Supply Total
This project is for the interior and exterior coating of the 944-1 Reservoir. In addition, an assessment of the facility will be accomplished to assure compliance to all applicable codes and OSHA standards.
JUSTIFICATION OF PROJECT:
Based upon the 2011 Cathodic Assessment Report, the 944-1 Reservoir interior and exterior coatings are in relatively poor condition and are in need of replacement.
COMMENTS:
Budget decreased from $410K to $345K in FY 2018.
FUNDING SOURCE: Expansion Betterment Replacement New Water Supply Total
This project is for the interior and exterior coating of the 944-2 Reservoir. In addition, an assessment of the facility will be accomplished to assure compliance to all applicable codes and OSHA standards.
JUSTIFICATION OF PROJECT:
Based upon the 2011 Cathodic Assessment Report, the 944-2 Reservoir interior and exterior coatings are in relatively poor condition and are in need of replacement.
COMMENTS:
Budget decreased from $1.05M to $960K in FY 2018.
FUNDING SOURCE: Expansion Betterment Replacement New Water Supply Total
This project is for the interior and exterior coating of the 1200-1 Reservoir. In addition, an assessment of the facility will be accomplished to assure compliance to all applicable codes and OSHA standards.
JUSTIFICATION OF PROJECT:
Based upon the 2011 Cathodic Assessment Report, the 1200-1 Reservoir interior and exterior coatings are in relatively poor condition and are in need of replacement.
COMMENTS:
Budget increased from $565K to $810K in FY 2018 to reflect latest bid results and include structural improvements required on many tanks recently recoated.
FUNDING SOURCE: Expansion Betterment Replacement New Water Supply Total
This project is for the interior and exterior coating of the 978-1 Reservoir. In addition, an assessment of the facility will be accomplished to assure compliance to all applicable codes and OSHA standards.
JUSTIFICATION OF PROJECT:
Based upon the 2011 Cathodic Assessment Report, the 978-1 Reservoir interior and exterior coatings are in relatively poor condition and are in need of replacement.
COMMENTS:
Budget decreased from $715K to $650K in FY 2018.
The tank was built in 1959.
FUNDING SOURCE: Expansion Betterment Replacement New Water Supply Total
This project is for the interior and exterior coating of the 458-2 Reservoir. In addition, an assessment of the facility will be accomplished to assure compliance to all applicable codes and OSHA standards.
JUSTIFICATION OF PROJECT:
Based upon the 2011 Cathodic Assessment Report, the 458-2 Reservoir interior coating is in relatively poor condition and is in need of replacement. The exterior coating on the roof is failing and in need of replacement.
COMMENTS:
Budget decreased from $885K to $810K in FY 2018.
FUNDING SOURCE: Expansion Betterment Replacement New Water Supply Total
P2539South Bay Bus Rapid Transit (BRT) Utility Relocations
Kevin Cameron
5/19/2014
1
1
$1,090,000
PROJECT MANAGER:
ORIGINAL APPROVED DATE:
RELATED CIP PROJECTS:
PROJECT TITLE: CIP Number:
DIRECTOR DIVISION:
PRIORITY:
BUDGET AMOUNT:
DESCRIPTION OF PROJECT:
This project is for all utility relocations required due to construction of South Bay BRT. Facility relocations vary in size and they impact both the potable and recycled water systems.
JUSTIFICATION OF PROJECT:
Project improvements will affect the locations of some OWD facilities in streets in Chula Vista. Engineering/staff time will be needed to review the design drawings and identify any OWD facilities which will need relocation or vertical adjustment. A construction budget is also needed for the work in relocating and adjusting these facilities.
COMMENTS:
Budget increased from $940K to $1.09M in FY 2018 to reflect actual costs encountered to date and remaining work to be completed.
FUNDING SOURCE: Expansion Betterment Replacement New Water Supply Total
This project is for the interior and exterior coating of the 850-1 Reservoir. In addition, an assessment of the facility will be accomplished to assure compliance to all applicable codes and OSHA standards.
JUSTIFICATION OF PROJECT:
Based upon the current Cathodic Assessment Report, the interior and exterior coatings on the 850-1 Reservoir are nearing the end of their useful life and are in need of replacement.
COMMENTS:
Budget increased from $575K to $875K in FY 2018 to reflect recent bid prices and anticipated structural repairs that have been encountered on many of the tanks recently recoated.
FUNDING SOURCE: Expansion Betterment Replacement New Water Supply Total
This project is for the interior and exterior coating of the 850-2 Reservoir. In addition, an assessment of the facility will be accomplished to assure compliance to all applicable codes and OSHA standards.
JUSTIFICATION OF PROJECT:
Based upon the current Cathodic Assessment Report, the interior and exterior coatings on the 850-2 Reservoir are nearing the end of their useful life and are in need of replacement.
COMMENTS:
Budget decreased from $1.07M to $980K in FY 2018 to reflect bid results, and to keep enough budget for unanticipated structural repairs encountered on many tanks recently recoated.
FUNDING SOURCE: Expansion Betterment Replacement New Water Supply Total
This project is for the interior and exterior coating of the 980-1 Reservoir. In addition, an assessment of the facility will be accomplished to assure compliance to all applicable codes and OSHA standards.
JUSTIFICATION OF PROJECT:
Based upon the 2013 Cathodic Assessment Report, the 980-1 Reservoir interior and exterior coatings are nearing the end of their useful life and are in need of replacement.
COMMENTS:
FUNDING SOURCE: Expansion Betterment Replacement New Water Supply Total
This project is for the interior and exterior coating of the 980-2 Reservoir. In addition, an assessment of the facility will be accomplished to assure compliance to all applicable codes and OSHA standards.
JUSTIFICATION OF PROJECT:
Based upon the current Cathodic Assessment Report, the interior and exterior coatings on the 980-2 Reservoir are nearing the end of their useful life and are in need of replacement.
COMMENTS:
FUNDING SOURCE: Expansion Betterment Replacement New Water Supply Total
This project is for the construction of four (4) electric vehicle charging stations at the lower Administration parking lot.
JUSTIFICATION OF PROJECT:
Alternative fueled vehicles are becoming more common, with electric only vehicles making up a significant portion of these. To support the needs of these vehicles and their limited driving range, the District proposes installing vehicle charging stations to allow employees to consider using for their commute.
COMMENTS:
$1K Permit$81K Engineer's Estimate$14K Design Fee$29K Staff time, inspection and contingency
FUNDING SOURCE: Expansion Betterment Replacement New Water Supply Total
P2553Heritage Road Bridge Replacement and Utility Relocation
Kevin Cameron
6/3/2015
2
2
$1,430,000
PROJECT MANAGER:
ORIGINAL APPROVED DATE:
RELATED CIP PROJECTS:
PROJECT TITLE: CIP Number:
DIRECTOR DIVISION:
PRIORITY:
BUDGET AMOUNT:
DESCRIPTION OF PROJECT:
The existing 16-Inch potable water pipeline to Sleep-Train Amphitheatre and Aquatica SeaWorld’s Waterpark was built under the Otay River.
The City of Chula Vista is planning to replace the Heritage Road Bridge (Project No. STM-364). The District has requested the City reserve room in the bridge for a 16-inch steel pipeline for potable water use and an 8-inch pipeline for future recycled water use. In addition to the bridge crossing, approximately 1,600 linear feet of 16-inch potable water pipeline is required. An existing 16-inch ACP pipeline in Otay River will be abandoned or converted to recycled water use.
JUSTIFICATION OF PROJECT:
A new bridge crossing of the Otay River at Heritage Road provides an opportunity for the District to relocate a pipeline out of the river into a more secure location and also provides an economical way to build a recycled water pipeline to these commercial customers. The current pipeline is in an environmentally sensitive area. The timing of the project will coincide with the City of Chula Vista's construction.
COMMENTS:
Budget increased from $1.2M to $1.43M to reflect latest projected costs and scope of work.
FUNDING SOURCE: Expansion Betterment Replacement New Water Supply Total
P2555Administration and Operations Parking Lot Improvements
Kevin Cameron
6/3/2015
3
2
$985,000
PROJECT MANAGER:
ORIGINAL APPROVED DATE:
RELATED CIP PROJECTS:
PROJECT TITLE: CIP Number:
DIRECTOR DIVISION:
PRIORITY:
BUDGET AMOUNT:
DESCRIPTION OF PROJECT:
This project is for AC pavement repairs, slurry seal, re-striping and updating area lighting improvements to existing Administration and Operations parking lots.
JUSTIFICATION OF PROJECT:
Parking lot needs to be re-striped and AC pavement needs to be resealed. Area lighting will be updated to more energy efficient fixtures.
COMMENTS:
Increased FY 2018 budget by $225,000 for repaving, striping, motorized gate, and canopies for the operations yard. Increase FY 2019 budget for lighting improvements for operations garage and workshop, larger canopy, current bidding environment.
FUNDING SOURCE: Expansion Betterment Replacement New Water Supply Total
P2557520 Res Recirculation Pipeline Chemical Supply and Analyzer Feed Replacement Project
Stephen Beppler
6/3/2015
5
1
$125,000
PROJECT MANAGER:
ORIGINAL APPROVED DATE:
RELATED CIP PROJECTS:
PROJECT TITLE: CIP Number:
DIRECTOR DIVISION:
PRIORITY:
BUDGET AMOUNT:
DESCRIPTION OF PROJECT:
This project is for the existing chemical feed lines that are cast/black iron and need to be replaced with new CPVC chemical feed lines. Other miscellaneous improvements needed include ammonia storage ventilation and injection vault upgrades. Length approximately 150 feet.
JUSTIFICATION OF PROJECT:
The existing chemical feed lines for the 520 Reservoir are experiencing deterioration and not designed to current code for providing chemical containment.
COMMENTS:
FY 2019 - Overall budget increased from $100K to $125K to reflect construction costs higher than projected. Complete design and beginning of construction of replacement ammonia feed lines proposed in FY 2018 with construction to be completed in FY 2019.
FUNDING SOURCE: Expansion Betterment Replacement New Water Supply Total
This project is for the replacement of the existing membrane floating cover and liner with new membrane system. Replace existing low profile mechanical spring tension system with weight tension towers.
JUSTIFICATION OF PROJECT:
The existing membrane floating cover and liner, and existing low profile mechanical spring tensioners, have reached the end of their useful lives and require replacement to meet regulatory requirements.
COMMENTS:
Construction schedule adjusted to coincide with recommendation from floating cover/liner contractor based on third party laboratory analysis of existing floating cover/liner samples taken from the reservoir in May 2017. Budget increased to account for analysis of recent 570-1 Reservoir floating cover/liner bid, replacement of existing spring tensioners, and addition of 5% contingency on construction cost estimate.
FUNDING SOURCE: Expansion Betterment Replacement New Water Supply Total
This project is for the interior and exterior coating of the 803-2 Reservoir. In addition, an assessment of the facility will be accomplished to assure compliance to all applicable codes and OSHA standards.
JUSTIFICATION OF PROJECT:
Based upon the 2013 Cathodic Assessment Report, the 803-2 Reservoir interior and exterior coatings are near the end of their useful life and in need of replacement.
COMMENTS:
Budget increased in FY 2018 from $725K to $940K to reflect recent bid prices and anticipated structural repairs that have been encountered on many of the tanks recently recoated. Budget increased in FY 2019 from $940K to $1.0M, to add work from CIP P2606 to this CIP, and close CIP P2606 (Budget $75K). This will reduce design and bidding costs.
FUNDING SOURCE: Expansion Betterment Replacement New Water Supply Total
This project is for the interior and exterior coating of the 520-2 Reservoir. In addition, an assessment of the facility will be accomplished to assure compliance to all applicable codes and OSHA standards.
JUSTIFICATION OF PROJECT:
Based upon the 2013 Cathodic Assessment Report, the 520-2 Reservoir interior and exterior coatings are at the end of their useful life and in need of replacement.
COMMENTS:
FUNDING SOURCE: Expansion Betterment Replacement New Water Supply Total
This project is for the interior and exterior coating of the 1004-2 Reservoir. In addition, an assessment of the facility will be accomplished to assure compliance to all applicable codes and OSHA standards.
JUSTIFICATION OF PROJECT:
Based upon the 2013 Cathodic Assessment Report, the 1004-2 Reservoir interior and exterior coatings are at the end of their useful life and in need of replacement.
COMMENTS:
Budget increased from $565K to $905K in FY 2018 to reflect recent bid prices and anticipated structural repairs that have been encountered on many of the tanks recently recoated.
FUNDING SOURCE: Expansion Betterment Replacement New Water Supply Total
P2571Datacenter Network- Data, Storage, and Infrastructure Enhancements
Michael Kerr
6/3/2015
0
2
$200,000
PROJECT MANAGER:
ORIGINAL APPROVED DATE:
RELATED CIP PROJECTS:
PROJECT TITLE: CIP Number:
DIRECTOR DIVISION:
PRIORITY:
BUDGET AMOUNT:
DESCRIPTION OF PROJECT:
This project is for the replacement and enhancement of the infrastructure components for the Data Center Network.
JUSTIFICATION OF PROJECT:
Data Center Network infrastructure is reaching the end of its service life. This project plans for enhancement and replacement. Some of the components that support the District’s business operations require upgrades and/or replacements. The District’s data Storage Area Network (SAN) is reaching its end of service life. The Tegile manufactured system (SAN) will not be supported as of Fiscal Year 2020 and require replacement. Additional components of the Data Center will also require extensive upgrades. Most of the hardware was replaced in 2014 and, based on industry standards of a 4 to 6 year replacement refresh cycle, will need to be upgraded or replaced. These end-of-life devices/hardware exposes the threat of unsupported infrastructure and new replacements would be costly. District operations depends on these components for business continuity and service reliability.
COMMENTS:
FUNDING SOURCE: Expansion Betterment Replacement New Water Supply Total
This project is for the replacement of the Enterprise Resource Planning (ERP) system.
JUSTIFICATION OF PROJECT:
Based on preliminary road maps from the current vendor, staff anticipates that the current ERP system, Eden, will become inflexible and constricted with new systems on the horizon. Staff is presently identifying key core business processes in achieving improvements in productivity and quality. Staff also anticipates that the outcome of the workshops will recognize that Eden will lack the necessary functionality, business agility, flexibility, and technology necessary for the District's overall growth.
COMMENTS:
Staff will start the discovery process in FY 2020 to identify possible alternatives for a new system. Given the history of the current solution (Eden), staff anticipates that FY 2021 will be appropriate for a replacement. In FY 2021, the District will have been utilizing Eden Financials for over 15 years. In the interim, staff will conduct research based on the District’s current technology infrastructure for best fit for conversion of historical data, proper workflow and security, and templates for utility billing and invoicing.
FUNDING SOURCE: Expansion Betterment Replacement New Water Supply Total
This project is for the replacement of approximately 4,000 feet of 12-inch potable water main within the 803 Pressure Zones in Hillsdale Road. The County has a CIP to repave Hillsdale Road after the pipeline replacement project is complete.
JUSTIFICATION OF PROJECT:
This project will replace thin wall, 1959 era, steel pipe originally constructed under as-built number 01-03. Two of the original four miles of thin wall steel pipe have been already replaced through separate CIP and developer projects. The remaining 2.1 miles of pipe has developed several water main breaks, including catastrophic failures due to semi-localized coating failures and severe corrosion of the thin wall steel can.
COMMENTS:
Design to be completed in FY 2017 and constructed in FY 2018. Construction of S2048 to be completed at the same time. Revision to water main alignment and updated cost opinion increased the project budget from $1.75M to $2.45M to also reflect jump in bid prices experienced in early 2017.
FUNDING SOURCE: Expansion Betterment Replacement New Water Supply Total
P2574PL - 12-Inch Pipeline Replacement, 978 Zone, Vista Vereda
Stephen Beppler
5/23/2016
P2573, P2615, P2616, P2625
5
2
$2,000,000
PROJECT MANAGER:
ORIGINAL APPROVED DATE:
RELATED CIP PROJECTS:
PROJECT TITLE: CIP Number:
DIRECTOR DIVISION:
PRIORITY:
BUDGET AMOUNT:
DESCRIPTION OF PROJECT:
This project is for the replacement of approximately 0.5 miles of 12-inch potable water main within the 978 Pressure Zones in Vista Vereda and easements on private property. The replacement water line will vary from 2-inch to 12-inch as the water line north of the feed from the 978 PS will be changed to local distribution only. The transmission capabilities to the western portions of the 978 PZ are being transferred to Hidden Mesa Road under CIP P2625.
JUSTIFICATION OF PROJECT:
This project will replace thin wall, 1959-60 era, steel pipe originally constructed under as-built number 01-03. Two of the original four miles of thin wall steel pipe have been already replaced through separate CIP and developer projects. This pipe is located in the Hillsdale area that has had major failures. This project will replace the pipe and relocate significant portions of the pipe out of these backyards before a major failure.
COMMENTS:
FY 2018 budget decreased from $2.5M to $2.0M. New water line for transmission purposes being constructed in Hidden Mesa Dr under CIP P2625. Other 1960s era steel pipe replacement projects include P2615 for Vista Grande and P2616 for Pence Drive.
FUNDING SOURCE: Expansion Betterment Replacement New Water Supply Total
This project is for the construction of a new Pump Station to replace the existing Pump Station.
JUSTIFICATION OF PROJECT:
The existing Pump Station was derated in 2010 to resolve vibration and cavitation issues. The current Pump Station isn't capable of meeting the required flow rates for daily demands that are anticipated to meet growth in Villages 4, 8, 9 and 3. The timing of this project coincides with the related development.
COMMENTS:
Overall project budget increased to match 2015 Water Facilities Master Plan Update.
FUNDING SOURCE: Expansion Betterment Replacement New Water Supply Total
This project is to incorporate the existing 657 Pressure Zone into the 640 Pressure Zone, abandon and demolish the two (2) 657 Reservoirs, and modify associated 657 Zone Pressure Reducing Stations in the La Presa area.
JUSTIFICATION OF PROJECT:
Eliminating the existing 657 Pressure Zone will simplify operations, reduce operating cost, and improve reliability. These facilities are no longer necessary and the demolishing will coordinate with the timing of the current coatings useful life ending.
COMMENTS:
FUNDING SOURCE: Expansion Betterment Replacement New Water Supply Total
This project is for the interior and exterior coating of the 458-1 Reservoir. In addition, an assessment of the facility will be accomplished to assure compliance to all applicable codes and OSHA standards.
JUSTIFICATION OF PROJECT:
Based upon the 2013 Cathodic Assessment Report, the 458-1 Reservoir interior and exterior coatings are at the end of their useful life and in need of replacement.
COMMENTS:
FUNDING SOURCE: Expansion Betterment Replacement New Water Supply Total
This project is for the replacement of water meters 3-inch or larger.
JUSTIFICATION OF PROJECT:
FY 2017-FY 2019 of the 219 large meters in the ground, 105 are no longer repairable and must be replaced. Staff anticipates 97 of these meters will need to replaced in the next three (3) years.
Large meters typically have a life cycle of 5-7 years. Based on prior replacements, staff anticipates another round of replacements beginning in FY 2024. This includes 3-10-inch meters (approx. $20,000 each).
COMMENTS:
FUNDING SOURCE: Expansion Betterment Replacement New Water Supply Total
P2595 PL - 16-inch, 624 Zone, Village 3N - Heritage Road, Main St/Energy Way
Stephen Beppler
5/23/2005
P2403
2
2
$150,000
PROJECT MANAGER:
ORIGINAL APPROVED DATE:
RELATED CIP PROJECTS:
PROJECT TITLE: CIP Number:
DIRECTOR DIVISION:
PRIORITY:
BUDGET AMOUNT:
DESCRIPTION OF PROJECT:
This project is for construction of approximately 1,200 feet of 16-inch pipeline within the 624 Pressure Zone (PZ) in Heritage Road between Main Street to Energy Way. This project will be constructed by the developer and is subject to reimbursement per Board policy. The budget reflects the upsizing of the developer required 12-inch water line to a 16-inch water line requested by the District for transmission capabilities within the 624 PZ.
JUSTIFICATION OF PROJECT:
This project will provide transmission capacity for development of Otay Ranch and other areas within the 624 Pressure Zone.
COMMENTS:
FUNDING SOURCE: Expansion Betterment Replacement New Water Supply Total
Change-out of existing Master Meter 3G registers to a combination of 3G and Allegro registers and complete meter change-out of District's highest users of 3/4-2-inch. In addition, implement cellular reading technology for District's temporary meters.
JUSTIFICATION OF PROJECT:
Update FY 2018- Master Meter has identified a manufacture defect in registers built between 2009-2013 causing them to fail at the 6-8 year mark. Otay has approx. 15,000 of these in the ground and will need to make arrangements to change out prior to original planned change out at year 11. In addition, 2005-2008 installed registers will also need to be changed out at year 11. Staff has developed a new plan to change out all registers with a mixture of 3G (paid for under warranty by Master Meter) and Allegro (Master Meter's latest technology) by the end of FY 2020. This shrinks the change out program from a 7 year to a 4 year time frame. Total program budget was estimated at $10.1M (including recycled (R2143) and potable), projected to be spent over 7 years. Now the total program budget is estimated to be $6.8M (recycled and potable).
Also, implement cellular reading technology for District's temporary meters and any large users requesting hourly data on a regular basis. Will pilot cell technology in FY 2018 with 20 endpoints and, if all works well, implement to all temp meters in FY 2019. The temporary cellular technology cost is estimated to be $75,000.
COMMENTS:
In FY 2025, program will resume replacing all meters and registers. Plan to expand the program to a 10 year change-out program for registers and 20 year program for meters (with exception of high users which will have full meter change-out every 10 years) at that time.
FUNDING SOURCE: Expansion Betterment Replacement New Water Supply Total
Replace existing Pressure Reducing Station (PRS) as-is without power or SCADA. Replace existing steel laterals. Construct pressure relief with modern air gap. For cost efficiency, project will be designed and constructed together with similar PRS on Oleander Avenue.
JUSTIFICATION OF PROJECT:
The existing 1965 era PRS has exceeded its useful life. PRS will be replaced without power/SCADA because there is insufficient space to construct modern remote monitoring and controls within the existing right-of-way. An air gap is required by the Health Department.
COMMENTS:
Project redefined and estimate has been updated.
FUNDING SOURCE: Expansion Betterment Replacement New Water Supply Total
P2607Douglas Ave SWA and OWD Interconnection Upgrade
Stephen Beppler
5/24/2017
2
1
$50,000
PROJECT MANAGER:
ORIGINAL APPROVED DATE:
RELATED CIP PROJECTS:
PROJECT TITLE: CIP Number:
DIRECTOR DIVISION:
PRIORITY:
BUDGET AMOUNT:
DESCRIPTION OF PROJECT:
Replace existing 3-inch PRV at interconnection between Sweetwater Authority (SWA) and Otay with a new 8-inch PRV. Interconnection is a one-way feed from Otay to SWA so SWA will cover a majority of the costs.
JUSTIFICATION OF PROJECT:
SWA requested this replacement and upgrade in PRV size to better supply their system in the event of an emergency.
COMMENTS:
FUNDING SOURCE: Expansion Betterment Replacement New Water Supply Total
Fire flows on this section of water line are below recommended rates due to the current pipe being undersized. Preferred alternative to resolve this is to replace existing water line with about 1,300 feet of a higher pressure rated 8-inch pipeline and provide individual residential pressure reducing valves (PRVs). 1,300 feet is the length needed to replace this section of Coronado.
JUSTIFICATION OF PROJECT:
Existing water line is on the 657 Pressure Zone (PZ) and does not provide adequate fire protection. Moving this portion of the water system to a higher pressure zone will resolve this issue.
COMMENTS:
Issue discovered during modeling of moving the 657 PZ to the 640 PZ.
FUNDING SOURCE: Expansion Betterment Replacement New Water Supply Total
Replace existing water line through easement along Eucalyptus Street with 1,600 feet of new 8-inch water line along Coronado Avenue, Date Street, and La Mesa Avenue.
JUSTIFICATION OF PROJECT:
Existing water line through easement along Eucalyptus Street is inaccessible, old, and has experienced leaks. Without this water line, fire flows in the area are below recommended rates. The current pipeline in this area is failing. The recommended length is needed to adequately serve the homes currently served by the failing pipe.
COMMENTS:
FUNDING SOURCE: Expansion Betterment Replacement New Water Supply Total
Replacement of non-functioning isolation valves on the potable water system. Phase 1 is expected to replace up to 20 valves.
JUSTIFICATION OF PROJECT:
Working isolation valves are vital to the efficient operation of the water system.
COMMENTS:
Increased overall budget from $150K to $275K in FY 2019 budget cycle to reflect increase in recent bids received from Helix WD and increase in the number of valves needed to be replaced.
FUNDING SOURCE: Expansion Betterment Replacement New Water Supply Total
P2612PL - 12-inch, 711 Zone, Pas de Luz/Telegraph Canyon Rd
Kevin Cameron
5/24/2017
4
2
$500,000
PROJECT MANAGER:
ORIGINAL APPROVED DATE:
RELATED CIP PROJECTS:
PROJECT TITLE: CIP Number:
DIRECTOR DIVISION:
PRIORITY:
BUDGET AMOUNT:
DESCRIPTION OF PROJECT:
Replacement of existing 12-inch water line located in a steep slope easement with a new water line located within right-of-way.
JUSTIFICATION OF PROJECT:
The pipe is currently leaking and needs to be replaced. A 12-inch water line is needed to meet flow requirements and will remain in the same alignment.
COMMENTS:
FUNDING SOURCE: Expansion Betterment Replacement New Water Supply Total
This project is for the interior and exterior coating of the 485-1 Reservoir. In addition, an assessment of the facility will be accomplished to assure compliance to all applicable codes and OSHA standards.
JUSTIFICATION OF PROJECT:
Based upon the current Cathodic Assessment Report, the interior and exterior coatings on the 485-1 Reservoir are nearing the end of their useful life and are in need of replacement.
COMMENTS:
FUNDING SOURCE: Expansion Betterment Replacement New Water Supply Total
P2615PL - 12-Inch Pipeline Replacement, 803 PZ, Vista Grande
Stephen Beppler
5/24/2017
5
2
$1,200,000
PROJECT MANAGER:
ORIGINAL APPROVED DATE:
RELATED CIP PROJECTS:
PROJECT TITLE: CIP Number:
DIRECTOR DIVISION:
PRIORITY:
BUDGET AMOUNT:
DESCRIPTION OF PROJECT:
This project is for the replacement of approximately 0.5 miles of 12-inch and 14-inch potable water main within the 803 Pressure Zones in Vista Grande.
JUSTIFICATION OF PROJECT:
This project will replace thin wall, 1959-60 era, steel pipe originally constructed under as-built number 01-03. Two of the original four miles of thin wall steel pipe have been already replaced through separate CIP and developer projects. The remaining 2.1 miles of pipe has developed several water main breaks including semi-localized coating failures and corrosion of the thin wall steel can. This is the last of the projects for this pipeline replacement.
COMMENTS:
FUNDING SOURCE: Expansion Betterment Replacement New Water Supply Total
P2616PL - 12-Inch Pipeline Replacement, 978 Zone, Pence Dr/Vista Sierra Dr
Stephen Beppler
5/24/2017
P2573, P2574, P2615
5
1
$2,500,000
PROJECT MANAGER:
ORIGINAL APPROVED DATE:
RELATED CIP PROJECTS:
PROJECT TITLE: CIP Number:
DIRECTOR DIVISION:
PRIORITY:
BUDGET AMOUNT:
DESCRIPTION OF PROJECT:
This project is for the replacement of approximately 0.4 miles of 14-inch potable water main within the 978 Pressure Zones in Pence Drive, Vista Sierra Drive, and easements on private property east of Vista Grande. Replacement length of water lines could potentially increase to 5,000 feet to relocate lines outside of easements. The length of the replacement represents the remaining cement mortar line and coated steel that has not been replaced in this location.
JUSTIFICATION OF PROJECT:
This project will replace thin wall, 1959-60 era, steel pipe originally constructed under as-built number 01-03. Two of the original four miles of thin wall steel pipe have been already replaced through separate CIP and developer projects. The remaining 2.1 miles of pipe has developed several breaks and leaks.
COMMENTS:
FUNDING SOURCE: Expansion Betterment Replacement New Water Supply Total
Redesign and install new customer service counter with enhanced security features; reconfigure the public service desk to include security enhancements along with an enlarged and secured adjoining conference room; replace finance and engineering double doors with new secured glass doors.
JUSTIFICATION OF PROJECT:
This project will add security features to the District’s public lobby in the form of bullet resistant barriers and glass and work areas with sufficient protection to allow staff to retreat to a safe location should a dangerous encounter present itself.
COMMENTS:
Project construction budget increased $75K to $150K.
FUNDING SOURCE: Expansion Betterment Replacement New Water Supply Total
P2619PS - Temporary Lower Otay Pump Station Redundancy
Jeff Marchioro
5/24/2017
P2579
1
1
$1,800,000
PROJECT MANAGER:
ORIGINAL APPROVED DATE:
RELATED CIP PROJECTS:
PROJECT TITLE: CIP Number:
DIRECTOR DIVISION:
PRIORITY:
BUDGET AMOUNT:
DESCRIPTION OF PROJECT:
Add a second pump to the temporary Lower Otay Pump Station (TLOPS) to provide redundancy to the existing single trailer mounted pump. Project involves site work, yard piping, replacement of a 30-inch flow meter and adjoining piping due to internal deterioration, instrumentation and controls, and security improvements.
JUSTIFICATION OF PROJECT:
A second, redundant pump is needed to serve as a back up to the existing pump at TLOPS. The existing diesel pump engine has recently failed during a SDCWA Aqueduct shutdown. Aqueduct shutdowns may occur for routine maintenance or emergencies. With the exception of portable trailer pumps, which can be deployed at the Telegraph Canyon site, TLOPS is the only potable water supply to the District's central and south service areas during Aqueduct shutdowns. TLOPS has a much higher capacity (12,500 gpm) compared to the potable trailer pumps deployed at Telegraph Canyon (5,000 gpm).
COMMENTS:
FUNDING SOURCE: Expansion Betterment Replacement New Water Supply Total
P2623Central Area to Otay Mesa Interconnection Pipelines Combination Air/Vacuum Valve Replacements
Jeff Marchioro
5/24/2017
P2083
2
2
$270,000
PROJECT MANAGER:
ORIGINAL APPROVED DATE:
RELATED CIP PROJECTS:
PROJECT TITLE: CIP Number:
DIRECTOR DIVISION:
PRIORITY:
BUDGET AMOUNT:
DESCRIPTION OF PROJECT:
Replace approximately sixty (60) existing 4-inch combination air/vacuum valves with surge type (slow closing) combination air/vacuum valves on the Central Area to Otay Mesa Interconnection Pipelines. Replace existing valve enclosures as needed.
JUSTIFICATION OF PROJECT:
A transient surge analysis for the new 870-2 Pump Station project identified existing combination air/vacuum valves which need to be replaced with surge type (slow closing) valves. Existing air/vacuum valve enclosures will need to be replaced since some are corroded and others are too short for the taller replacement valves. This will reduce the risk of damage to existing infrastructure that could lead to pipe failure.
COMMENTS:
FUNDING SOURCE: Expansion Betterment Replacement New Water Supply Total
Replacement of approximately 3,000 linear feet of 8-inch and 10-inch potable water line with a new 12-inch water main to serve as the primary transmission main to the western portions of the 978 Pressure Zone in the Hillsdale area.
JUSTIFICATION OF PROJECT:
The existing 12-inch water line along Vista Vereda and Hidden Mesa Trail providing transmission capabilities to the western portions of the 978 Pressure Zone was constructed in 1959 through easements that are difficult to access, pose maintenance issues ,and present risks to the adjoining properties. This line is at the end of its useful life and analysis for the replacement of the pipeline was performed under CIP P2574. An alternative project was selected to replace the pipeline with the portion in Vista Vereda to be converted to a local distribution system with reduced reach and upsizing of the water line in Hidden Mesa Road to 12-inch to handle transmission duties. This alternative provides the lowest risks to the District while providing the best maintenance access with long-term cost savings. This separate CIP was established for the Hidden Mesa Road portion of the work.
COMMENTS:
Project approved by the Board of Directors at the November 1, 2017 Board Meeting. This project is to be built prior to construction of CIP P2574 to ensure continued transmission of fire flows to the western portions of the 978 pressure zone.
FUNDING SOURCE: Expansion Betterment Replacement New Water Supply Total
Replace existing Pressure Reducing Station (PRS) as-is without power or SCADA. Replace existing steel laterals. Construct pressure relief with modern air gap. For cost efficiency, project will be designed and constructed together with similar PRS on Melrose Avenue.
JUSTIFICATION OF PROJECT:
The existing 1965 era PRS has exceeded its useful life. PRS will be replaced without power/SCADA because there is insufficient space to construct modern remote monitoring and controls within the existing right-of-way. An air gap is required by the Health Department.
COMMENTS:
FUNDING SOURCE: Expansion Betterment Replacement New Water Supply Total
P2630624-3 Reservoir Automation of Chemical Feed System
Kevin Cameron 1
2
$385,000
PROJECT MANAGER:
ORIGINAL APPROVED DATE:
RELATED CIP PROJECTS:
PROJECT TITLE: CIP Number:
DIRECTOR DIVISION:
PRIORITY:
BUDGET AMOUNT:
DESCRIPTION OF PROJECT:
This project is to standardize the disinfection station located at the 624-3 reservoir. The 624-3 reservoir is a 30 million gallon potable storage and disinfection facility located in Chula Vista that receives water from Water Authority FCF # 12, which is then pumped and/or gravity fed to other reservoir facilities to meet water demands. The 624-3 has a boosting disinfection station that is able to bring up the chlorine residual to a more stable and higher residual that will endure throughout the distribution system to maintain water quality. The chlorine and ammonia pumps are manually operated and must be adjusted every time a flow change is requested from San Diego County Water Authority. This process is usually done once per day and it takes about an hour to complete.
JUSTIFICATION OF PROJECT:
The District currently has two (2) other disinfection facilities in operation that are automated with chemical pumps that automatically adjust to achieve the desired chlorine residual to maintain water quality and meet EPA and State requirements. This allows the System Operator to have the flexibility of requesting flow changes and not physically be at the disinfection facility, but rather monitor remotely via SCADA and respond if needed. This project will automate the chemical delivery system and will provide the water system operators more operational flexibility, increase efficiency, and reduce operational costs and overtime.
COMMENTS:
Staff will be evaluating the cost/benefit of these improvements. Automating the chemical system at the 624-3 reservoir is considered as an option as it will standardize the operation of the disinfection system throughout the District.
FUNDING SOURCE: Expansion Betterment Replacement New Water Supply Total
This project is for the interior and exterior coating of the 1485-2 Reservoir. In addition, an assessment of the facility will be accomplished to assure compliance to all applicable codes and OSHA standards.
JUSTIFICATION OF PROJECT:
Based upon the current Cathodic Assessment Report, the interior and exterior coatings on the 1485-2 Reservoir are nearing the end of their useful life and are in need of replacement. The Reservoir was constructed in 2006, and has never been recoated.
COMMENTS:
FUNDING SOURCE: Expansion Betterment Replacement New Water Supply Total
P2633Otay Mesa Rd and Alta Rd Water Appurtenances Relocations
Stephen Beppler 2
1
$500,000
PROJECT MANAGER:
ORIGINAL APPROVED DATE:
RELATED CIP PROJECTS:
PROJECT TITLE: CIP Number:
DIRECTOR DIVISION:
PRIORITY:
BUDGET AMOUNT:
DESCRIPTION OF PROJECT:
The County is widening Otay Mesa Road and improving the intersection at Alta Road. The District will need to relocate existing District facilities along both streets. Total project length is approximately one half mile. In addition to relocating meters, air valves, and blow offs, the relocation of water mains may be required with potential grade changes. The District's water mains within the project area are 24-inch AC pipes installed in 1993.
JUSTIFICATION OF PROJECT:
The County of San Diego is widening the existing roadway and improving the intersection as part of their improvements for the SR-11 Freeway project. Their construction of the improvements is slated for FY 2019.
COMMENTS:
The District's improvements are in the existing right-of-way by permit and the District will need to prepare plans for the relocation of the District's facilities as part of this project. The District does not own a water line property in Alta Road north of Otay Mesa Road. At this time relocation of the 24-inch water lines in Otay Mesa Road and Alta Road are not anticipated, only appurtenances such as hydrants, blow offs, air valves, and meters (11 are estimated) are covered at roughly $45,000 per appurtenance (all in cost). Budget will need to be revised if the water mains require relocation.
FUNDING SOURCE: Expansion Betterment Replacement New Water Supply Total
P2634Rolling Hills Hydropneumatic Pump Station Jockey Pump Replacement
Don Anderson 5
1
$35,000
PROJECT MANAGER:
ORIGINAL APPROVED DATE:
RELATED CIP PROJECTS:
PROJECT TITLE: CIP Number:
DIRECTOR DIVISION:
PRIORITY:
BUDGET AMOUNT:
DESCRIPTION OF PROJECT:
Upsize existing vertical turbine jockey pump and motor while utilizing existing components to minimize costs including the existing motor control center and existing ten horsepower rated soft start, existing pump head, existing pump control valve, and existing pump control piping. The motor will be upsized from five to ten horsepower maximum, which is expected to increase flow from 36 gpm to approximately 175 gpm.
JUSTIFICATION OF PROJECT:
The existing five horsepower, 36 gpm rated jockey pump, is undersized and is unable to keep pace with the growing demands of this pressure zone. As a temporary fix, the existing undersized jockey pump has been locked out to minimize cycling and lengthen the run time of the two (2) existing 40 horsepower, 780 gpm pumps. The existing 100 horsepower, 1,750 gpm fire pump will be unaffected by this project.
COMMENTS:
The budget includes $25K for the larger pump and $10K for startup, contingency, and staff time.
FUNDING SOURCE: Expansion Betterment Replacement New Water Supply Total
Replace the existing hydropneumatic tank pressure vessel.
JUSTIFICATION OF PROJECT:
The existing 1966 era, 10,000 gallon hydropneumatic pressure vessel was inspected by an API Standard 510 certified inspector in 2007, 2014, and 2015. The pressure vessel has been previously repaired, patched, and welded due to leaks at nozzles. The existing pressure vessel is nearing the end of its useful life, and is not suitable for repair or recoating.
COMMENTS:
A separate CIP number P2639 has been developed for assessment and future replacement of this pump station. The cost estimate for this project assumes that the District will proceed with procurement of a Portable Trailer Mounted VFD Pump through CIP number P2640. Acquisition of additional property may be an alternative to a Portable Trailer Mounted VFD Pump.
FUNDING SOURCE: Expansion Betterment Replacement New Water Supply Total
P2636980-2 PS Surge Tank Interior/Exterior Coating
Kevin Cameron 1
1
$175,000
PROJECT MANAGER:
ORIGINAL APPROVED DATE:
RELATED CIP PROJECTS:
PROJECT TITLE: CIP Number:
DIRECTOR DIVISION:
PRIORITY:
BUDGET AMOUNT:
DESCRIPTION OF PROJECT:
Recoat interior and exterior of the existing 10' diameter and 25' long horizontal pressure vessel originally manufactured in 2005.
JUSTIFICATION OF PROJECT:
An interior inspection completed by an API Standard 510 certified inspector in 2017 showed global coating failure and light surface corrosion with minimal pit depths along the interior ceiling of the vessel. Recoating will prevent future corrosion to preserve the life expectancy of this relatively new vessel. This vessel has a documented corrosion allowance that will facilitate a successful recoating project. Recoating is the most cost effective solution compared to replacement of the existing tank.
COMMENTS:
FUNDING SOURCE: Expansion Betterment Replacement New Water Supply Total
P2637Survey Division Field GPS Equipment Replacement
Michael O'Donnell 0
1
$35,000
PROJECT MANAGER:
ORIGINAL APPROVED DATE:
RELATED CIP PROJECTS:
PROJECT TITLE: CIP Number:
DIRECTOR DIVISION:
PRIORITY:
BUDGET AMOUNT:
DESCRIPTION OF PROJECT:
Trimble R10 GNSS receiver and Trimble Rugged PC with Trimble Access.Receiver hardware and firmware maintenance. Trimble pole with bracket and associated hardware.
JUSTIFICATION OF PROJECT:
The District’s current GPS field equipment consists of a TSC2 data collector and R8 Receiver. This equipment works in tandem and is used several times a week by the Survey Division to support critical District operations. This equipment is 10 years old and at the end of its product life cycle. Replacement parts including the battery pack and touchscreen for the TSC2 data collector are no longer available. The software that acts as a link between the TSC2 data collector and R8 receiver is also no longer supported. If this equipment breaks down, there is no method to repair it through the manufacturer or an authorized dealer. The Trimble R10 GNSS receiver and Rugged PC with Trimble Access have a 10 year product life cycle. This equipment was designed with future-proof in mind, meaning it will be able to accommodate anticipated technologies including BeiDou.
COMMENTS:
The Survey Division field GPS equipment supports the District's USA Mark-out Program, CIP Program, Right-of-Way Program, and GIS Program.
FUNDING SOURCE: Expansion Betterment Replacement New Water Supply Total
Throughout Admin and Ops main campus, replace deteriorated irrigation systems; upgrade and calibrate irrigation controls for optimal water usage; replace eroded slope areas along customer driveway, public and employee parking, and equipment lots; install hard and soft ground cover for effective erosion control; remove and replace dead and dying trees; restore plantings based on original architectural material schedules.
JUSTIFICATION OF PROJECT:
Much of the existing irrigation systems, remaining plants, and hardscape at Admin are the from the original 1998 construction and are in need of replacement and replanting. The slopes along driveways and parking areas have eroded, undermining sidewalks, fence posts, and other landscape materials. Age and drought have compromised several trees and other original plantings. The result is a deteriorating appearance in public facing and employee surroundings throughout the main campus.
COMMENTS:
FUNDING SOURCE: Expansion Betterment Replacement New Water Supply Total
P2639Vista Diego Hydropneumatic Pump Station Replacement
Jeff Marchioro 5
3
$2,500,000
PROJECT MANAGER:
ORIGINAL APPROVED DATE:
RELATED CIP PROJECTS:
PROJECT TITLE: CIP Number:
DIRECTOR DIVISION:
PRIORITY:
BUDGET AMOUNT:
DESCRIPTION OF PROJECT:
Replace the existing hydropneumatic pump station which serves the small 1530 Pressure Zone containing approximately thirty-five (35) potable water meters and four (4) hydrants.
JUSTIFICATION OF PROJECT:
The original 1966 era Pump Station was retrofitted with a fire pump in the late 1980's, at which time all electrical gear was replaced and a generator was installed. The existing Pump Station has an ongoing water quality (entrained air) issue observed within the Pump Station and the small 1530 Pressure Zone it serves. The existing Pump Station is nearing the end of its useful life.
COMMENTS:
An assessment of the existing Pump Station will be prepared before the design for the replacement pump begins and rescheduled if needed. Replacement of the generator will be done through a separate CIP.
FUNDING SOURCE: Expansion Betterment Replacement New Water Supply Total
Construct up to two (2) custom portable trailers fitted with multistage centrifugal variable frequency drive (VFD) pump packages. Prior to procurement of trailer(s), staff will conduct a cost/benefit analysis and compare to other alternatives at individual sites in which trailer(s) might be deployed throughout the District. Staff will confirm quantity of trailers needed to cover hydraulic conditions at suitable sites District-wide.
JUSTIFICATION OF PROJECT:
A cost/benefit analysis of the portable VFD pump trailer(s) deployed at up to nine (9) existing sites including five (5) hydropneumatic Pump Stations and four (4) small Pressure Zones each fed by a single gravity reservoir will be compared with other alternatives. The trailer(s) would provide a means to avoid disruption of water service while taking existing critical facilities offline for extended periods of time including entire hydropneumatic Pump Stations and small reservoirs with no redundancy.
COMMENTS:
Upcoming projects including the 1200-1 Reservoir Interior & Exterior Coating project (P2533) and the 1004-2 Reservoir Interior/Exterior Coating & Upgrades project (P2567) would benefit from a temporary hydropneumatic Pump Station to serve these small Pressure Zones with a single gravity reservoir.
Budgets for hydropneumatic tank coating or replacement work at Rancho Jamul (P2641) in FY 2021, Vista Diego (P2629) in FY 2024 and Rolling Hills (P2645) in FY 2021 have assumed that the District will proceed with procurement of a Portable Trailer Mounted VFD Pump(s).
These will be similar to Rincon Del Diablo Municipal Water District's (Rincon) trailer.
FUNDING SOURCE: Expansion Betterment Replacement New Water Supply Total
Replace the existing hydropneumatic tank pressure vessel.
JUSTIFICATION OF PROJECT:
The existing 1979 era, approximate 1,100 gallon hydropneumatic pressure vessel was inspected by an API Standard 510 certified inspector in 2015. The existing pressure vessel has developed pits and is not suitable for repair or recoating.
COMMENTS:
This tank will be re-inspected in 2020, at which time this schedule for the replacement of the tanks will be re-evaluated. A separate CIP P2642 has been developed for assessment and possible replacement of this Pump Station. A separate CIP P2640 has been developed to procure Portable Trailer Mounted VFD Pump(s) to facilitate replacement of this tank.
FUNDING SOURCE: Expansion Betterment Replacement New Water Supply Total
Replace the existing hydropneumatic Pump Station with a new Pump Station coordinated with a separate CIP P2040 (1655-1 Reservoir) project. The existing Pump Station currently serves approximately twenty five (25) meters and eleven (11) hydrants.
JUSTIFICATION OF PROJECT:
The existing 1655 Pressure Zone will change from a closed hydropneumatic system to a gravity system when the future 1655-1 Reservoir is constructed (CIP 2040). The existing Rancho Jamul Hydropneumatic Pump Station will need to be modified to pump to the future 1655-1 Reservoir. The existing 1979 era Pump Station is nearing the end of its useful life.
COMMENTS:
An assessment of the existing pump station will be prepared before the design for the replacement pump station begins and rescheduled if needed. Replacement of this pump station may be facilitated by the procurement of a Portable Trailer Mounted VFD Pump (CIP P2640).
FUNDING SOURCE: Expansion Betterment Replacement New Water Supply Total
Replace two (2) existing surge tank pressure vessels if future inspection(s) show evidence of pitting corrosion.
JUSTIFICATION OF PROJECT:
The existing two (2) surge tank pressure vessels originally manufactured in 1986 and 1995 were inspected in 2017. Both vessels have interior global coating failures; however, no pitting corrosion was noted by an API Standard 510 certified inspector in 2017. Both vessels are not suitable for recoating due to no access to the underside of the vessel/support skirt, small size, and lack of corrosion allowance. Consequently, both vessels should be replaced rather than recoated. Replacing the vessels simultaneously would save costs compared to staggering replacement based on vessel age.
COMMENTS:
These tanks will be re-inspected in 2023, at which time this schedule for the replacement of the tanks will be re-evaluated.
FUNDING SOURCE: Expansion Betterment Replacement New Water Supply Total
Replace the existing surge tank pressure vessel if future inspection(s) show evidence of pitting corrosion.
JUSTIFICATION OF PROJECT:
The existing surge tank pressure vessel originally manufactured in 1994 was inspected in 2017. The vessel has interior coating failures and light general surface corrosion; however, no pitting corrosion was noted by an API Standard 510 certified inspector in 2017. The vessel should be replaced rather than recoated due to lack of corrosion allowance.
COMMENTS:
This pressure vessel will be re-inspected in 2023, at which time the replacement schedule of this tank will be re-evaluated.
FUNDING SOURCE: Expansion Betterment Replacement New Water Supply Total
P2645Rolling Hills Hydropneumatic Tank Interior/Exterior Coating
Kevin Cameron 5
2
$225,000
PROJECT MANAGER:
ORIGINAL APPROVED DATE:
RELATED CIP PROJECTS:
PROJECT TITLE: CIP Number:
DIRECTOR DIVISION:
PRIORITY:
BUDGET AMOUNT:
DESCRIPTION OF PROJECT:
Recoat interior and exterior of the existing 11-feet diameter and 30-feet long horizontal pressure vessel.
JUSTIFICATION OF PROJECT:
An interior inspection completed by an API Standard 510 certified inspector in 2017 showed global coating failure and pitting corrosion less than the corrosion allowance. Recoating will prevent future corrosion to preserve the life expectancy of this vessel manufactured in 2004. This vessel has a documented corrosion allowance that will facilitate a successful recoating project. Recoating should be the most cost effective solution compared to replacement of the existing tank; however, a plan to keep the existing Pressure Zone in service must be developed and considered during the planning phase.
COMMENTS:
The alternative of replacing this tank, rather than recoating, will be reevaluated based on the outcome of the 980-2 PS surge tank coating project (CIP P2636) scheduled for FY 2019. The cost estimate for this project assumes that the District will proceed with procurement of a Portable Trailer Mounted VFD Pump through CIP P2640. Replacement of this tank, or the addition of a second/redundant tank, may be alternatives to a Portable Trailer Mounted VFD Pump.
FUNDING SOURCE: Expansion Betterment Replacement New Water Supply Total
P2646North District Area Cathodic Protection Improvements
Jeff Marchioro
P2508
5
3
$800,000
PROJECT MANAGER:
ORIGINAL APPROVED DATE:
RELATED CIP PROJECTS:
PROJECT TITLE: CIP Number:
DIRECTOR DIVISION:
PRIORITY:
BUDGET AMOUNT:
DESCRIPTION OF PROJECT:
This project is for the replacement and repairs of existing cathodic protection systems on various potable pipelines in the North District.
JUSTIFICATION OF PROJECT:
The ongoing cathodic protection program efforts have identified various pipelines for anode replacement, cathodic test station repairs, installation of isolation kits, and repair of existing anode beds. This CIP has been budgeted based on recommendations and cost estimates found in the District’s Cathodic Protection Program 2015 Annual Report. Up to 25 Cathodic Protection systems that may be repaired under this CIP.
COMMENTS:
This CIP evolved from CIP #P2508 (Pipeline Cathodic Protection Replacement Program). P2508 has been split into five (5) separate CIPs based on service type and groups of pipelines based on location.
FUNDING SOURCE: Expansion Betterment Replacement New Water Supply Total
P2647Central Area Cathodic Protection Improvements
Jeff Marchioro
P2508
1
3
$1,000,000
PROJECT MANAGER:
ORIGINAL APPROVED DATE:
RELATED CIP PROJECTS:
PROJECT TITLE: CIP Number:
DIRECTOR DIVISION:
PRIORITY:
BUDGET AMOUNT:
DESCRIPTION OF PROJECT:
This project is for the replacement and repairs of existing cathodic protection systems on various potable pipelines in the Central Area.
JUSTIFICATION OF PROJECT:
The ongoing cathodic protection program efforts have identified various pipelines for anode replacement, cathodic test station repairs, installation of isolation kits, and repair of existing anode beds. This CIP has been budgeted based on recommendations and cost estimates found in the District’s Cathodic Protection Program 2015 Annual Report. Up to 28 Cathodic Protection systems may be repaired under this CIP.
COMMENTS:
This CIP evolved from CIP #P2508 (Pipeline Cathodic Protection Replacement Program). P2508 has been split into five (5) separate CIPs based on service type and groups of pipelines based on location.
FUNDING SOURCE: Expansion Betterment Replacement New Water Supply Total
P2648Otay Mesa Area Cathodic Protection Improvements
Jeff Marchioro
P2508
2
2
$400,000
PROJECT MANAGER:
ORIGINAL APPROVED DATE:
RELATED CIP PROJECTS:
PROJECT TITLE: CIP Number:
DIRECTOR DIVISION:
PRIORITY:
BUDGET AMOUNT:
DESCRIPTION OF PROJECT:
This project is for the replacement and repairs of existing cathodic protection systems on various potable pipelines in the Otay Mesa Area.
JUSTIFICATION OF PROJECT:
The ongoing cathodic protection program efforts have identified various pipelines for anode replacement, cathodic test station repairs, installation of isolation kits, and repair of existing anode beds. This CIP has been budgeted based on recommendations and cost estimates found in the District’s Cathodic Protection Program 2015 Annual Report. Up to fifteen (15) Cathodic Protection systems may be repaired under this CIP.
COMMENTS:
This CIP evolved from CIP #P2508 (Pipeline Cathodic Protection Replacement Program). P2508 has been split into five (5) separate CIPs based on service type and groups of pipelines based on location.
FUNDING SOURCE: Expansion Betterment Replacement New Water Supply Total
This project provides funding for the capital purchase of replacement heating, ventilation, and air conditioning (HVAC) roof top air handling units (RTU) for the administration building that were installed in 1998.
JUSTIFICATION OF PROJECT:
Replacement HVAC equipment will be used for administrative functions.
COMMENTS:
The HVAC system RTUs have reached the end of their useful life and need to be replaced. The schedule and estimated cost for the replacement of these units will be done over several years.Unit # Location Install Date Replacement Year (FY) EstimateRTU 4 Board Room 1998 2019 $21,000AC-2 Accounting 1998 2020 $22,000AC-4 Finance 1998 2020 $22,000RTU 8 Training Room 1998 2021 $20,000RTU 7 Lunchroom 1998 2022 $15,000RTU 6 Gym Area 1998 2023 $15,000RTU 9 Computer Training 1998 2023 $15,000
FUNDING SOURCE: Expansion Betterment Replacement New Water Supply Total
This project provides funding for the capital purchase of software for human resources management and automatic data processing of payrolls.
JUSTIFICATION OF PROJECT:
Based on a cost benefit analysis performed by Finance, utilizing a third party payroll provider would save the District approximately $50,000 per year and reduce the risk of payroll compliance liabilities.
COMMENTS:
This information technology software is expected to have a useful life of three years before it will be replaced or upgraded.
FUNDING SOURCE: Expansion Betterment Replacement New Water Supply Total
R2084RecPL - 20-Inch, 680 Zone, Village 2 - Heritage/La Media
Stephen Beppler
6/2/2004
R2083, R2085
1
2
$365,000
PROJECT MANAGER:
ORIGINAL APPROVED DATE:
RELATED CIP PROJECTS:
PROJECT TITLE: CIP Number:
DIRECTOR DIVISION:
PRIORITY:
BUDGET AMOUNT:
DESCRIPTION OF PROJECT:
This project is for construction of approximately 2,000 feet of 20-inch pipeline within the 680 Pressure Zone in Village 2 in Santa Victoria Road from Santa Carolina Road to Santa Alexia Avenue.
JUSTIFICATION OF PROJECT:
This project will provide transmission capacity for the recycled water supply pumped from the 680-1 Pump Station to the 680 and higher pressure zones. Significant energy savings will occur due to lower total dynamic head requirements for the 680-1 Pump Station. Funding opportunity is the United States Bureau of Reclamation Water Reclamation and Reuse Program, Title XVI of P.L. 102-575.
COMMENTS:
This is a developer driven project. A reimbursement agreement was signed in June 2016 for $266K. This CIP budget was reduced from $970K to $365K for the FY 2017 CIP budget.
FUNDING SOURCE: Expansion Betterment Replacement New Water Supply Total
R2110RecPS - 944-1 Optimization and Pressure Zone Modifications
Jeff Marchioro
5/14/2014
R2091
1
1
$200,000
PROJECT MANAGER:
ORIGINAL APPROVED DATE:
RELATED CIP PROJECTS:
PROJECT TITLE: CIP Number:
DIRECTOR DIVISION:
PRIORITY:
BUDGET AMOUNT:
DESCRIPTION OF PROJECT:
This project is to improve the control strategy to increase pumping capacity and streamline operation of the Pump Station. As a result of this effort, replacement of five (5) service saddles on Clubhouse Drive will need to be replaced with higher pressure class saddles. Replace water damaged instrumentation and control equipment and add a sump pump to an existing Pressure Reducing Station (PRS) vault located east of the intersection of Otay Lakes Road and Hunte Parkway.
JUSTIFICATION OF PROJECT:
Revising the control strategy will increase pumping capacity and improve the District's ability to operate the Pump Station during off-peak hours when electricity rates are low. Retrofitting the Pressure Reducing Station (PRS) vault with a sump pump will prolong the life expectancy of existing pressure reducing station components that were damaged by vault flooding.
COMMENTS:
FUNDING SOURCE: Expansion Betterment Replacement New Water Supply Total
R2116RecPL - 14-Inch, 927 Zone, Force Main Improvements
Jeff Marchioro
6/3/2015
3
1
$2,500,000
PROJECT MANAGER:
ORIGINAL APPROVED DATE:
RELATED CIP PROJECTS:
PROJECT TITLE: CIP Number:
DIRECTOR DIVISION:
PRIORITY:
BUDGET AMOUNT:
DESCRIPTION OF PROJECT:
This project is for the repair of the existing 16,000 L.F. 14-Inch force main, built in 1978, and the replacement of fifteen (15) blow-offs.
JUSTIFICATION OF PROJECT:
Active leaks and significant localized corrosion have been spot repaired. Additional spot repairs and replacement of the existing blow-offs are needed to extend the remaining useful life of the facility.
COMMENTS:
FUNDING SOURCE: Expansion Betterment Replacement New Water Supply Total
R2118Steele Canyon Sewer PS Large Solids Handling Improvements
Stephen Beppler
6/3/2015
S2051
3
1
$150,000
PROJECT MANAGER:
ORIGINAL APPROVED DATE:
RELATED CIP PROJECTS:
PROJECT TITLE: CIP Number:
DIRECTOR DIVISION:
PRIORITY:
BUDGET AMOUNT:
DESCRIPTION OF PROJECT:
This project is for installation of measures in the Steele Bridge Sewer Pump Station wet well to protect the sewage pumps from assorted debris. The existing pumps have been requiring a high frequency of repairs and replacement of parts due to rags, construction materials, and other non-typical wastewater solids entering the Pump Station. Assessment of installing either a new chopper pump or bar screen to handle these types of materials is needed.
JUSTIFICATION OF PROJECT:
The prevention of large debris from reaching the existing pumps will result in reduced maintenance repairs and extend the life of the sewage pumps. Based upon the current frequency and cost of maintenance of the sewage pumps, the proposed improvement should pay for itself within a few years. Improvements may trigger safety upgrades to also be included.
COMMENTS:
FY 2019 budget increased from $75K to $150K to reflect bid price received for project. A reassessment of the cost to benefit for the project was performed and still found to be acceptable, but the project will be delayed to rebid with other work (S2051) at the treatment plant to obtain a better economies of scale for construction. Design completed in FY 2017. CIP is based upon recommendations from RWCWRF Master Plan (Item 3.1).
FUNDING SOURCE: Expansion Betterment Replacement New Water Supply Total
R2120RWCWRF Filtered Water Storage Tank Improvements
Stephen Beppler
6/3/2015
R2096
3
1
$500,000
PROJECT MANAGER:
ORIGINAL APPROVED DATE:
RELATED CIP PROJECTS:
PROJECT TITLE: CIP Number:
DIRECTOR DIVISION:
PRIORITY:
BUDGET AMOUNT:
DESCRIPTION OF PROJECT:
This project is to seal and recoat the interior and exterior of steel tank walls and concrete floor. Construct improvements to facilitate operation and maintenance activities and compliance with all applicable codes and OSHA standards. Salvage or replace and improve existing floating cover. Replace tank appurtenances including overflow pipe and install a galvanic cathodic protection system.
JUSTIFICATION OF PROJECT:
HDR Engineering Inspection and Condition Assessment Report dated May 2015 recommends structural improvements, replacement of the exterior coatings, and replacement of the cathodic protection system. This improvement was included in the Ralph W. Chapman Water Reclamation Facility (RWCWRF) Master Plan (Item 7.9). The report prepared by HDR in 2015 stated that the interior coating has exceeded its life cycle due to deterioration. The report also states that the exterior coating is in fair condition and as one of their recommendations it can be power washed and scrubbed with a mild biodegradable cleaner to remove all of the chalking. An overcoat of paint can then be applied on the exterior.
COMMENTS:
Construction delayed until FY 2019 in response to other priorities at the plant.
FUNDING SOURCE: Expansion Betterment Replacement New Water Supply Total
This project will assess the alternative use potential for the Otay Mesa recycled waterlines utilizing hydraulic modeling.
JUSTIFICATION OF PROJECT:
Determining alternative uses for these waterlines will allow for these assets to be used rather than lie dormant.
With the moratorium on extending recycled water to Otay Mesa, the recycled waterlines already installed throughout the area will be evaluated for potential uses. To continue to serve potable water the District must either put backflow devices on the existing services or connect the existing services to the potable pipeline with a backflow device.
COMMENTS:
FUNDING SOURCE: Expansion Betterment Replacement New Water Supply Total
Add permanent SDG&E power supply to eliminate existing solar panel and batteries. Develop SCADA to enable remote operation of the existing hydraulic valves, monitor valve position, and automatically close valves during 944-1R Pump Station operation. Add vault flood alarm and sump pump.
JUSTIFICATION OF PROJECT:
The facility has been normally used during interruption of City recycled water supplies or when RWCWRF production has exceeded 944/927 Pressure Zone demands. PRS hydraulic valve solenoids have failed to function when the existing power supply from solar panels/batteries has been insufficient on cloudy days. Remote control will save staff time since the facility has been operated by manually toggling switches at the site. Automatic lock out of the PRS will prevent inefficient short circuiting of the 944-1R Pump Station. The interior of the existing SCADA cabinet (electronic devices, wiring, and plywood backboard) should be updated.
COMMENTS:
FUNDING SOURCE: Expansion Betterment Replacement New Water Supply Total
Replace existing fiberglass reinforced plastic (FRP) weir troughs that supply flow to the filters as well as bypass the filters during plant operations that do not meet discharge requirements.
JUSTIFICATION OF PROJECT:
Existing FRP weir troughs are from original 1992 construction and are at the end of their useful life. Fibers are exposed and can become waterlogged with trough breakage a risk. Weight is causing trough to sag, resulting in leakage and disproportional feed through the filters.
COMMENTS:
CIP is based upon recommendations from Ralph W. Chapman Water Reclamation Facility (RWCWRF) Master Plan (Item 7.5).
FUNDING SOURCE: Expansion Betterment Replacement New Water Supply Total
Change-out of existing Master Meter 3G registers to a combination of 3G and Allegro register and complete meter change-out of District's highest users of 3/4-2-Inch.
JUSTIFICATION OF PROJECT:
Update FY 2018 - Master Meter has identified a manufacture defect in registers built between 2009-2013 causing them to fail 6-8 year mark. Otay has approx. 15,000 of these in the ground and will need to make arrangements to change out prior to original planned change out at year 11. In addition, 2005-2008 installed registers will also need to be changed out at year 11. Staff has developed a new plan to change out all registers with a mixture of 3G (paid for under warranty by Master Meter) and Allegro (Master Meter's latest technology) by the end of FY 2020. This shrinks the change out program from a 7 year to a 4 year time frame. Total program budget was estimated at $10.1M (including recycled (R2143) and potable), projected to be spent over 7 years. Now the total program budget is estimated to be $6.8M (recycled and potable).
COMMENTS:
In FY 2025, program will resume replacing all meters and registers. Plan to expand the program to a 10 year change-out program for registers and 20 year program for meters (with exception of high users which will have full meter change-out every 10 years) at that time.
FUNDING SOURCE: Expansion Betterment Replacement New Water Supply Total
R2145RWCWRF - Filter Media and Nozzles Replacement
Stephen Beppler 3
1
$130,000
PROJECT MANAGER:
ORIGINAL APPROVED DATE:
RELATED CIP PROJECTS:
PROJECT TITLE: CIP Number:
DIRECTOR DIVISION:
PRIORITY:
BUDGET AMOUNT:
DESCRIPTION OF PROJECT:
Replace tertiary filter media and filter underdrain media-retaining nozzles for both filters at the Ralph W. Chapman Water Reclamation Facility.
JUSTIFICATION OF PROJECT:
The existing filter media is at the end of its service life, as are the filter underdrain media-retaining nozzles. Typical life for the media is about five (5) years and the current media has been in service since 2011. Filter media consists of sand and anthracite layers and each has specified parameters ranges for uniform conformity and effective size for proper filter operation. After three (3) years of service the media is sampled and tested annually to confirm the media has not degraded outside of the allowed ranges. The past testing showed the media had reached the limit of the range and is expected to fall outside of the accepted range by the next inspection. The media replacement portion of the CIP is estimated at $60,000.
There are about 1300 media retaining nozzles in the filters, fabricated of PVC. They also function for distributing backwash air and water to the filter media to clean it. In addition to the 2 to 3 daily backwash cycles, several times a week the filters are backwashed at very high chlorine levels (about 50 mg/l) to disinfect the filters to limit algal growth. The existing PVC nozzles are from the original filter construction in 1992 and the high chlorine concentrations can make them more brittle and susceptible to breakage during the turbulent backwash process. A single nozzle costs approximately $50 to replace while the media is be changed out as opposed to about $4,000 to replace a single nozzle if it breaks during plant operation, which would shut down the recycled water production for at least a day. The replacement of the 1300 nozzles portion of the CIP is $70,000.
COMMENTS:
FUNDING SOURCE: Expansion Betterment Replacement New Water Supply Total
This project is for the replacement and repairs of existing cathodic protection systems on various recycled pipelines.
JUSTIFICATION OF PROJECT:
The ongoing cathodic protection program efforts have identified various pipelines for anode replacement, cathodic test station repairs, installation of isolation kits, and repair of existing anode beds. This CIP has been budgeted based on recommendations and cost estimates found in the District’s Cathodic Protection Program 2015 Annual Report. Up to ten (10) Cathodic Protection systems may be repaired under this CIP.
COMMENTS:
This CIP evolved from CIP #P2508 (Pipeline Cathodic Protection Replacement Program). P2508 has been split into five (5) separate CIPs based on service type and groups of pipelines based on location.
FUNDING SOURCE: Expansion Betterment Replacement New Water Supply Total
Replace underground and above ground diesel fuel piping between the existing 12,000 bulk diesel tank, two (2) 65 gallon day tanks, and return tank. Replace existing return tank. SCADA improvements will be completed under a separate CIP number.
JUSTIFICATION OF PROJECT:
Existing underground diesel fuel lines, partially installed together with the original treatment plant in 1979, must be replaced to gain compliance with the County of San Diego inspection report dated July 25, 2017 and current federal regulations. The late 1980’s/early 1990’s era return tank and associated components has not held up outside/uncovered and has reached the end of its useful life.
COMMENTS:
FUNDING SOURCE: Expansion Betterment Replacement New Water Supply Total
This project is for the replacement of recycled water meters 3-inch or larger.
JUSTIFICATION OF PROJECT:
Staff has an annual large meter testing program to ensure the District's large meters are performing accurately. When a large meter fails, staff looks at the failing result, the cost of repair and/or replacement, and determines the action that will be of the greatest benefit to the District. Historically, staff has been able to repair the large recycled irrigation meters. However, as the meters age, repairing becomes more difficult and in some cases not possible. There are currently 14 recycled meters 3-inch or larger in the Otay system. Based on the age of the meters, funds are distributed throughout the six year period to account for replacement by 2024.
COMMENTS:
FUNDING SOURCE: Expansion Betterment Replacement New Water Supply Total
R2149680-1R PS Surge Tank Interior/Exterior Coating
Kevin Cameron 2
2
$175,000
PROJECT MANAGER:
ORIGINAL APPROVED DATE:
RELATED CIP PROJECTS:
PROJECT TITLE: CIP Number:
DIRECTOR DIVISION:
PRIORITY:
BUDGET AMOUNT:
DESCRIPTION OF PROJECT:
Recoat the interior and exterior of the existing 8' diameter and 20' long horizontal pressure vessel originally manufactured in 2006.
JUSTIFICATION OF PROJECT:
An interior inspection completed by an API Standard 510 certified inspector in 2017 showed several spot coating failures and pitting corrosion. Recoating will prevent future corrosion to preserve the life expectancy of this relatively new vessel. This vessel has a documented corrosion allowance that will facilitate a successful recoating project. Recoating should be the most cost effective solution compared to replacement of the existing tank.
COMMENTS:
The alternative of replacing this tank rather than renewing the coating will be reevaluated based on the outcome of the 980-2 PS surge tank coating project (CIP #AA-P2636) scheduled for FY 2019. The interior/exterior recoat of the 680-1R surge tank will be performed during a planned shutdown of the SBWRP, which is tentatively scheduled for the month of January 2020.
FUNDING SOURCE: Expansion Betterment Replacement New Water Supply Total
R2150RWCWRF - Secondary Chlorine Analyzer and Feed System
Stephen Beppler 3
1
$45,000
PROJECT MANAGER:
ORIGINAL APPROVED DATE:
RELATED CIP PROJECTS:
PROJECT TITLE: CIP Number:
DIRECTOR DIVISION:
PRIORITY:
BUDGET AMOUNT:
DESCRIPTION OF PROJECT:
The project will add a second monitoring location of the RWCWRF effluent and automate the existing effluent wet well chlorine dosing system. Scope of work includes replacement of the manual chlorine injection equipment within the chlorine control room with automated equipment that can begin dosing when the level of free chlorine measured in the system falls below a set point.
JUSTIFICATION OF PROJECT:
Measuring the level of free chlorine entering the effluent force main from the plant is currently not possible. The current chlorine feed and monitoring equipment at the chlorine contact tank provides the dosing information at the immediate injection and end of the chlorine contact tank but the duration at this point is under 10 minutes. The proposed location for the secondary monitoring equipment increases the time of reaction for the free chlorine. This additional stage of monitoring will potentially enable the initial and overall chlorine dosage to be reduced, decreasing chemical usage and prolonging the life of the pumps and force main appurtenances. The proposed equipment would be usable in any future modification of the disinfection system.
Price quotes for the equipment (analyzer, chlorinator, and controller) total $25,500. Additional funds are for enclosures at the monitoring station, project administration, inspection, and warranty.
COMMENTS:
FUNDING SOURCE: Expansion Betterment Replacement New Water Supply Total
R2151RWCWRF - Bulk Chlorine Vapor Scrubber System Refurbishment
Jerry Lintner 3
1
$37,000
PROJECT MANAGER:
ORIGINAL APPROVED DATE:
RELATED CIP PROJECTS:
PROJECT TITLE: CIP Number:
DIRECTOR DIVISION:
PRIORITY:
BUDGET AMOUNT:
DESCRIPTION OF PROJECT:
An inspection of the bulk chlorine scrubber system at the RWCWRF recommended replacement of the two chlorine scrubber recirculation pumps to ensure the longevity and continued reliability of the system.
JUSTIFICATION OF PROJECT:
During the last inspection of the bulk chlorine scrubber system, deterioration was found in the main header at a threaded connection, the top cover, and the bottom of the tank. In addition, the pump discharge flanges have warped creating a gap at the connection. The cost to repair the flanges would be comparable to the cost of a replacement pump and are expected to improve performance and have a longer useful life.
COMMENTS:
A preliminary quote was received as the basis for the budget, which includes the reinstallation of the existing motors and a crane rental for pump removal and installation of the new pumps. Not included is the periodic cleaning and maintenance required every five years.
FUNDING SOURCE: Expansion Betterment Replacement New Water Supply Total
S2012 San Diego County Sanitation District Outfall and RSD Outfall Replacement
Stephen Beppler
6/4/2003
3
1
$3,550,000
PROJECT MANAGER:
ORIGINAL APPROVED DATE:
RELATED CIP PROJECTS:
PROJECT TITLE: CIP Number:
DIRECTOR DIVISION:
PRIORITY:
BUDGET AMOUNT:
DESCRIPTION OF PROJECT:
This project is for the Otay Water District proportionate share of the San Diego County Sanitation District total costs for replacement of various system components of the existing Spring Valley and Rancho San Diego Outfall Systems, per terms of an existing agreement with the County of San Diego Sanitation District. The reimbursement also includes a proportionate share of operating and maintenance costs.
JUSTIFICATION OF PROJECT:
Various components of the San Diego County Sanitation District Spring Valley Outfall and the Rancho San Diego Outfall are in very bad condition and are in need of repair and/or replacement.
COMMENTS:
For the last 6 years, the County of San Diego Sanitation Department has billed the District an average of $100,000 a year.
FUNDING SOURCE: Expansion Betterment Replacement New Water Supply Total
This project is to upgrade the sewer main capacity of approximately 11,050 feet of existing 10-inch PVC sewer main, 450 feet of 10-inch reinforced polymer mortar pipe sewer main, and 50 feet of 15-inch sewer main. The project location begins at the south end of Avocado Boulevard, through the Rancho San Diego Village Shopping Center, paralleling the SR-94/Campo Road in the adjacent open space.
JUSTIFICATION OF PROJECT:
The existing sewer main is under-sized and must be replaced to increase capacity. Portions of the sewer main are located in areas of sensitive habitat making it difficult to access for maintenance.
COMMENTS:
FY 2019 Budget - Increase from $10.1M to $10.3M to reflect change orders from rock excavations and conflicting utilities. Project design completed in FY 2016. Easement costs increased from $150K to $350K . Construction costs increased with delay from easement acquisition. Apparent low bid is $7.82M, with additional costs for administration, inspection, and construction management bringing the project total estimate to $10.3M. This project may potentially be partially funded by the Clean Water State Loan Fund.
FUNDING SOURCE: Expansion Betterment Replacement New Water Supply Total
This project provides funding for the rehabilitation of the Rancho San Diego Pump Station located near Singer Lane. The project is being designed and constructed by the County of San Diego, with the District sharing the costs. The County invoices the District once a year.
JUSTIFICATION OF PROJECT:
The existing sewer Pump Station is over 20 years old and the pumps have reached the end of their useful lives. The Pump Station also needs improvements to bring the Station up to current OSHA requirements.
COMMENTS:
Project design is complete and construction is in progress.
FUNDING SOURCE: Expansion Betterment Replacement New Water Supply Total
This project is for a Sludge Handling System at the Ralph W. Chapman Water Recycling Facility (RWCWRF) to reduce the amount of solids the District sends to Metro.
JUSTIFICATION OF PROJECT:
The District currently sends all sludge produced at RWCWRF to Metro for treatment. The District's Wastewater Management Plan provided a preliminary estimate of the cost of handling sludge at the RWCWRF that is close to the cost Metro charges the District for treatment of solids.
COMMENTS:
City of San Diego is in the process of determining future sewer rates related to the implementation of the Pure Water Program. Once these rates are established, the feasibility of handling solids at the RWCWRF can be fully assessed. This CIP is as indicated in the RWCWRF Master Plan under item 11.2.
FUNDING SOURCE: Expansion Betterment Replacement New Water Supply Total
This project is to repair sewer damage by trenchless repair methods at over 50 identified sewer sites. The planning and design for this project was begun under S2033 and is now separated out into its own project entity.
JUSTIFICATION OF PROJECT:
The closed circuit television sewer assessment program process has assisted in the identification of sewer mains containing sags, which has allowed debris to form, and/or are damaged and need to be repaired.
COMMENTS:
Project construction completed in FY 2018. Warranty period extends into FY 2019, after which project will be closed. Several projects from this package could not be corrected and will be moved to other CIP projects for future repair.
FUNDING SOURCE: Expansion Betterment Replacement New Water Supply Total
This project is for the relocation of the Fuerte Drive Sewer Main. The County of San Diego is realigning a portion of Fuerte Drive in an area where the District has identified sewer Site 34 for rehabilitation. This design will be accelerated to enable the work to be completed in coordination with the County road work.
JUSTIFICATION OF PROJECT:
To coordinate the location of all utilities within the new alignment of Fuerte Drive, the County has required the relocation of the District's sewer line within the project limits. The closed circuit television sewer assessment program process has assisted in the identification of sewer mains containing sags, which has allowed debris to settle, and/or are damaged and need to be repaired.
COMMENTS:
FY 2019 Budget - Delays from other utilities relocating their lines have moved this project from Nov 2017 to Jan 2018 to April 2018. These delays have resulted in our contractor withdrawing from performing the project. On March 7, 2018 the Board approved a $60,000 budget increase to $370,000.
FUNDING SOURCE: Expansion Betterment Replacement New Water Supply Total
This project is for the replacement of 39 aeration panels. The existing aeration diffuser panels installed in the aeration basins are no longer being produced by the manufacturer and have failed in less than half the expected life indicated from the manufacturer's literature. Options include manufacturer's retrofit with their currently offered panels or explore other alternative manufacturers. Depending upon the replacement aeration system selected, completion of the aeration header loop may also be included to provide better air distribution at equal pressure. CIP is based upon recommendations from Ralph W. Chapman Water Reclamation Facility (RWCWRF) Master Plan (Items 5.1 and 5.3).
JUSTIFICATION OF PROJECT:
Failures of existing aeration diffuser panels required replacement immediately. Ultimate replacement of the system is required within the expected life of the replacement diffusers - within four years.
COMMENTS:
A study of aeration systems and their costs will be performed during FY 2018 and a decision made on the replacement system. If possible, recommend panel replacement be performed in a two-step process to enable assessment of the new system. Retrofit of one basin at first, as this will allow for assessment of the operation of the new panels prior to implementing in all basins. If the replacement system and existing system are not compatible, than all three basins will need to be replaced all at once.
FUNDING SOURCE: Expansion Betterment Replacement New Water Supply Total
S2047Asset Management - Info Master Sewer Implementation
Ming Zhao
5/23/2016
5
2
$58,000
PROJECT MANAGER:
ORIGINAL APPROVED DATE:
RELATED CIP PROJECTS:
PROJECT TITLE: CIP Number:
DIRECTOR DIVISION:
PRIORITY:
BUDGET AMOUNT:
DESCRIPTION OF PROJECT:
This project is for the purchase and implementation of sewer asset management decision making software, Info Master Sewer.
JUSTIFICATION OF PROJECT:
Allows for asset management of sewer system.
COMMENTS:
This was originally part of the P2486 Asset Management CIP. As this portion is for sewer, a separate CIP was created to reflect the different funding resource. The overall CIP amount does not change.
FUNDING SOURCE: Expansion Betterment Replacement New Water Supply Total
This project is to repair two (2) areas of sewer mains. Sites 790 and 878 will be designed and constructed in coordination with the proposed waterline improvements in Hillsdale Road. This work was originally included in S2033.
JUSTIFICATION OF PROJECT:
The closed circuit television sewer assessment program process has identified sags and roots in this section of pipe, which has allowed debris to form, and/or are damaged and need to be repaired. The timing of the project will align with the Hillsdale water main repairs.
COMMENTS:
Coordination with the waterline project is necessary. Budget increased for FY 2018 from $500K to $720K to reflect updated project cost estimate, additional MH repair, and jump in recent bids in early 2017. Construction is scheduled to be completed by late FY 2018, with potential for work to extend into FY 2019. Warranty period extended into FY 2020.
FUNDING SOURCE: Expansion Betterment Replacement New Water Supply Total
This project is for repairs to the gravity sanitary sewer system to repair areas with potential for sewer backups and spills. This project addresses the following sewer sites, primarily in the Calavo area: 56, 78, 310, 705, and 775. The replacement of sewer manhole MH-368-173 will also be included.
JUSTIFICATION OF PROJECT:
The closed circuit television sewer assessment program process has assisted in the identification of sewer mains containing sags, which has allowed debris to accumulate, and/or are damaged and need to be repaired. This is a continuation of the CIP's in this area. Phase I was completed in 2017. Rehabilitating these sags will prevent debris from accumulating and sewer system overflows.
COMMENTS:
This project is taken from S2033 and is the next highest priority areas after the Rancho San Diego Phase 1 project for open cut repairs. Construction to be after completion of Campo Road Sewer project. Additional planning time has been included to resolve easement infringement cases that are apparent.
FUNDING SOURCE: Expansion Betterment Replacement New Water Supply Total
S2050Rancho San Diego Basin Sewer Rehabilitation - Phase 2
Stephen Beppler
5/23/2016
5
2
$1,300,000
PROJECT MANAGER:
ORIGINAL APPROVED DATE:
RELATED CIP PROJECTS:
PROJECT TITLE: CIP Number:
DIRECTOR DIVISION:
PRIORITY:
BUDGET AMOUNT:
DESCRIPTION OF PROJECT:
This project is for the repairs to gravity sanitary sewer system to repair areas with potential for sewer backups and spills. This project addresses the following sewer sites: 724, 735, and 747.
JUSTIFICATION OF PROJECT:
The closed circuit television sewer assessment program process identified sags and roots in this section of pipe, which has allowed debris to form, and/or are damaged and need to be repaired. This is a continuation of the CIP's in this area. Phase I was completed in 2017. Rehabilitating these sags will prevent debris from accumulating and sewer system overflows.
COMMENTS:
This project is taken from S2033 and is the next highest priority area for open cut repairs after the Calavo Phase 2 project. Additional planning time and costs incorporated to deal with easement issues that are apparent at several of the sites.
FUNDING SOURCE: Expansion Betterment Replacement New Water Supply Total
This project is for the refurbishment of the treatment plant headworks, notably the rotary screen concrete channel. Repairs include channel wall replacement, removal and reinstallation of electrical panels and rotary screen, and new coatings. Added to the scope for FY 2019 is the repair of channel grate supports at the flow meter to remove a tripping hazard and replacement of the headworks area drain pipe that is deteriorated.
JUSTIFICATION OF PROJECT:
Existing channel wall is greatly deteriorated by H2S and supports the rotary screen. Repair will fix channel wall and extend coating over the top of the wall which contributed to the wall deterioration. CIP is based upon recommendations from Ralph W. Chapman Water Reclamation Facility (RWCWRF) Master Plan (Item 4.1) and additional plant staff input.
COMMENTS:
Design performed in FY 2018. Budget increased for FY 2019 from $150K to $250K to reflect additional scope of work and high contractor administration costs relative to the amount of work performed. Bidding will be combined with R2118 for a better combined bid amount to reflect economies of scale.
FUNDING SOURCE: Expansion Betterment Replacement New Water Supply Total
This project is to replace on each of the three (3) sedimentation basins the effluent weirs. Additional items identified in the Ralph W. Chapman Water Reclamation Facility (RWCWRF) Master Plan for scum weir actuators, and sludge collector drives will be evaluated at a later date and added as necessary including installing new motor actuated valves on the solids collection piping to complete the automation of this system.
JUSTIFICATION OF PROJECT:
The fiberglass reinforced plastic (FRP) effluent weirs installed in 1992, are at the end of their useful life and need replacement, with the weirs having exposed fibers that increases their chance of failure. CIP is based upon recommendations from RWCWRF Master Plan (Item 6.1).
COMMENTS:
Project will be done in one year, replacing elements of one basin at a time.
FUNDING SOURCE: Expansion Betterment Replacement New Water Supply Total
This project is for the repairs to gravity sanitary sewer system to repair areas with potential for sewer backups and spills. This project addresses the following sewer sites in the Calavo area: 93, 150.1, 150.2, and 1000.
JUSTIFICATION OF PROJECT:
The closed circuit television sewer assessment program process identified sags and roots in this section of pipe, which has allowed debris to form, and/or are damaged and need to be repaired. This is a continuation of the CIP's in this area; Phase I was completed in 2017 and Phase 2 (S2049) is scheduled prior to this project. Rehabilitating these sags will prevent debris from accumulating and reduce the potential for sewer system overflows.
COMMENTS:
This project is taken from S2033 and is the next highest priority areas after the Rancho San Diego Phase 2 project for open cut repairs. Project delayed from FY 2018 estimate by one year to avoid construction overlap with RSD Phase 2.
FUNDING SOURCE: Expansion Betterment Replacement New Water Supply Total
Replacement of the existing sewage pump station is required to raise the station above the 100 year flood plain and to enable handling of daily peak flows for future flow equalization at RWCWRF. Replacement of the flow splitting manhole on the gravity sewer diverting flow to the pump station is also involved.
JUSTIFICATION OF PROJECT:
The existing pump station was built in 1981 and is located within the 100 year flood plain, making it susceptible to significant flood damage as the pumps and electrical equipment are installed below the potential flood elevation. By the time of the project construction, the electrical components of the pump station will have reached the end of their useable life. Elimination of the chopper feature on the pumps will aid the operational efficiency of the treatment plant rotary screens. Flow diversion improvements and increased pumping capacity will allow for additional treatment during low diurnal night flow periods when coupled with flow equalization at RWCWRF.
COMMENTS:
CIP is based upon the RWCWRF Master Plan Items 3.1 and 3.3 recommendations. Master plan estimated costs for the two (2) items are $797,000 and $148,300, for a total of $945,300. CIP budget set at $1,000,000. An assessment of the pump station will be made before the design of the replacement pump station begins.
FUNDING SOURCE: Expansion Betterment Replacement New Water Supply Total
S2061RWCWRF Aeration Controls Consolidation & Optimization Upgrades (S)
Stephen Beppler
5/24/2017
R2119
3
1
$190,000
PROJECT MANAGER:
ORIGINAL APPROVED DATE:
RELATED CIP PROJECTS:
PROJECT TITLE: CIP Number:
DIRECTOR DIVISION:
PRIORITY:
BUDGET AMOUNT:
DESCRIPTION OF PROJECT:
This project will consolidate the aeration controls for the biological treatment process of the Ralph W. Chapman Water Reclamation Facility (RWCWRF) to fully integrate the aeration system controls and allow for automated adjustments. Also included are studies for plant optimization and long-term cost effectiveness of the facility considering proposed Pure Water/Point Loma Secondary Equivalency on sewer rates.
JUSTIFICATION OF PROJECT:
Implementation of the Aeration Controls Consolidation task will eliminate operational risks that include: - Dealing with shock loads on the plant that upset the biological process. Plant can take a week to recover, which results in returning some or all flows to Metro during this recovery time. These events can occur 2-3 times a year. - Allow for automatic adjustment of air flow level. Plant can't automatically adjust air levels that need twice daily manual entry at this time, weekends see reductions in nitrogen removal that can lead to a permit violation.
COMMENTS:
Budget set at $190K to reflect identified scope of work from the Treatment Plant Master Plan under 5.2 Aeration Controls Consolidation ($157,800) [Note that 12.1 Automation/SCADA Upgrades that are not operational costs are covered in CIP P2485 and that 13.7 Security Improvements are covered in CIP P2382], plus $30K for proposed optimization planning studies. Recycled Water CIP R2119 closed out at end of FY 2017.
FUNDING SOURCE: Expansion Betterment Replacement New Water Supply Total
Addition of a Total Organic Carbon (TOC) meter that provides real time measurement of the sewage strength as it enters the Ralph W. Chapman Water Reclamation Facility. The spectral sensor is optical, is submerged in the process flow, and has an ultrasonic self-cleaning system to keep maintenance requirements to a minimum.
JUSTIFICATION OF PROJECT:
The TOC monitor will provide treatment staff with a tool to react to influent changes before adversely impacting the aeration process, which has been a significant issue lately.
COMMENTS:
FUNDING SOURCE: Expansion Betterment Replacement New Water Supply Total
S2066Rancho San Diego Basin Sewer Rehabilitation - Phase 3
Stephen Beppler 5
3
$1,900,000
PROJECT MANAGER:
ORIGINAL APPROVED DATE:
RELATED CIP PROJECTS:
PROJECT TITLE: CIP Number:
DIRECTOR DIVISION:
PRIORITY:
BUDGET AMOUNT:
DESCRIPTION OF PROJECT:
This project is for the repairs to gravity sanitary sewer system to repair areas with potential for sewer backups and spills. This project addresses the following sewer sites: 700, 851, and 853. A total of 2,500 linear feet of sewer is required for the sewer replacement and rerouting to resolve pipe sags and remove elevated waterway crossings.
JUSTIFICATION OF PROJECT:
The closed circuit television sewer assessment program process identified sags and roots in this section of pipe, which has allowed debris to form, and/or are damaged and in need of repair. This is a continuation of the CIP's in this area; Phase I was completed in 2017 and Phase 2 (S2050) is scheduled prior to this project. Rehabilitating these sags will prevent debris from accumulating and reduce the potential for sewer system overflows.
COMMENTS:
This project is taken from S2033 and is the next highest priority area for open cut repairs after the Calavo Phase 3 project. Extended planning time and costs incorporated to deal with easement issues that are apparent at several of the sites.
FUNDING SOURCE: Expansion Betterment Replacement New Water Supply Total
S2067RWCWRF Roofing Replacement and Natural Light Enhancement
Kent Payne 3
1
$165,000
PROJECT MANAGER:
ORIGINAL APPROVED DATE:
RELATED CIP PROJECTS:
PROJECT TITLE: CIP Number:
DIRECTOR DIVISION:
PRIORITY:
BUDGET AMOUNT:
DESCRIPTION OF PROJECT:
The existing cap sheet torch roofs to be replaced with a single-ply thermoplastic polyolefin (TPO) roof with polyisocyanurate (ISO) insulation as a moisture barrier. A TPO roofing system is a commercial fire rated roofing product that provides heat-reflective and energy efficient roofing systems with high resistance to UV, ozone, and chemical exposure. Single-ply TPO roofing systems provide better performance characteristics (e.g., good seam strength, puncture resistance, weather resistance) and longevity than a modified torch system. Also, install a lighting system, such as Solatube, that will allow in natural light through the roof.
JUSTIFICATION OF PROJECT:
The flat portion of the roofs of the Administration Building (Operations Control Center), the Blower Room, and the Effluent Pump Station are from the original installation. They are cap sheet torch roofs. The roofs of these buildings are old and degrading and require replacement.
COMMENTS:
FUNDING SOURCE: Expansion Betterment Replacement New Water Supply Total
Accountant NE 25 $36.5533 $41.1226 $45.6917 $6,335.91 $7,127.92 $7,919.89 $76,031.20 $85,534.81 $95,038.59Accounting Technician NE 20 $28.6406 $32.2206 $35.8006 $4,964.37 $5,584.90 $6,205.44 $59,572.35 $67,018.76 $74,465.22Assistant Chief E 38 $68.9270 $77.5427 $86.1584 $11,947.35 $13,440.73 $14,934.12 $143,368.13 $161,288.78 $179,209.41Assistant Civil Engineer I NE 25 $36.5533 $41.1226 $45.6917 $6,335.91 $7,127.92 $7,919.89 $76,031.20 $85,534.81 $95,038.59Assistant Civil Engineer II E 27 $40.3002 $45.3376 $50.3750 $6,985.37 $7,858.52 $8,731.67 $83,824.40 $94,302.10 $104,780.05Assistant Survey Technician NE 19 $27.2769 $30.6863 $34.0958 $4,728.00 $5,318.96 $5,909.94 $56,735.75 $63,827.48 $70,919.27Associate Civil Engineer E 32 $51.4344 $57.8636 $64.2928 $8,915.30 $10,029.69 $11,144.09 $106,983.54 $120,356.23 $133,728.84Business Systems Analyst I E 25 $36.5533 $41.1226 $45.6917 $6,335.91 $7,127.92 $7,919.89 $76,031.20 $85,534.81 $95,038.59Business Systems Analyst II E 29 $44.4311 $49.9847 $55.5385 $7,701.39 $8,664.01 $9,626.67 $92,416.31 $103,968.08 $115,520.00Chief Financial Officer E 40 $75.9920 $85.4908 $95.0179 $13,171.95 $14,818.41 $16,469.77 $158,063.28 $177,820.87 $197,637.07Chief, Administrative Services E 40 $75.9920 $85.4908 $95.0179 $13,171.95 $14,818.41 $16,469.77 $158,063.28 $177,820.87 $197,637.07Chief, Engineering E 40 $75.9920 $85.4908 $95.0179 $13,171.95 $14,818.41 $16,469.77 $158,063.28 $177,820.87 $197,637.07Chief, Water Operations E 40 $75.9920 $85.4908 $95.0179 $13,171.95 $14,818.41 $16,469.77 $158,063.28 $177,820.87 $197,637.07Communications Assistant NE 22 $31.5764 $35.5233 $39.4703 $5,473.24 $6,157.37 $6,841.52 $65,678.62 $73,888.15 $82,097.91Communications Officer E 30 $46.6524 $52.4839 $58.3155 $8,086.42 $9,097.21 $10,108.02 $97,037.05 $109,166.57 $121,295.99Confidential Executive Secretary NE 22 $31.5764 $35.5233 $39.4703 $5,473.24 $6,157.37 $6,841.52 $65,678.62 $73,888.15 $82,097.91Confidential Secretary NE 18 $25.9780 $29.2250 $32.4722 $4,502.85 $5,065.67 $5,628.51 $54,034.03 $60,788.07 $67,542.15Construction Inspector I NE 22 $31.5764 $35.5233 $39.4703 $5,473.24 $6,157.37 $6,841.52 $65,678.62 $73,888.15 $82,097.91Construction Inspector II NE 24 $34.8127 $39.1643 $43.5158 $6,034.20 $6,788.48 $7,542.74 $72,410.54 $81,461.80 $90,512.94Customer Service Field Representative I NE 16 $23.5627 $26.5080 $29.4533 $4,084.20 $4,594.72 $5,105.24 $49,010.45 $55,136.48 $61,262.73Customer Service Field Representative II NE 18 $25.9780 $29.2250 $32.4722 $4,502.85 $5,065.67 $5,628.51 $54,034.03 $60,788.07 $67,542.15Customer Service Manager E 33 $54.0061 $60.7568 $67.5073 $9,361.06 $10,531.18 $11,701.27 $112,332.76 $126,373.88 $140,415.24Customer Service Representative I NE 16 $23.5627 $26.5080 $29.4533 $4,084.20 $4,594.72 $5,105.24 $49,010.45 $55,136.48 $61,262.73Customer Service Representative II NE 18 $25.9780 $29.2250 $32.4722 $4,502.85 $5,065.67 $5,628.51 $54,034.03 $60,788.07 $67,542.15Customer Service Supervisor E 27 $40.3002 $45.3376 $50.3750 $6,985.37 $7,858.52 $8,731.67 $83,824.40 $94,302.10 $104,780.05Data Systems Technician NE 20 $28.6406 $32.2206 $35.8006 $4,964.37 $5,584.90 $6,205.44 $59,572.35 $67,018.76 $74,465.22Database Administrator E 32 $51.4344 $57.8636 $64.2928 $8,915.30 $10,029.69 $11,144.09 $106,983.54 $120,356.23 $133,728.84Disinfection Technician NE 23 $33.1551 $37.2993 $41.4437 $5,746.88 $6,465.21 $7,183.57 $68,962.49 $77,582.75 $86,202.81District Secretary E 29 $44.4311 $49.9847 $55.5385 $7,701.39 $8,664.01 $9,626.67 $92,416.31 $103,968.08 $115,520.00Electrician I NE 22 $31.5764 $35.5233 $39.4703 $5,473.24 $6,157.37 $6,841.52 $65,678.62 $73,888.15 $82,097.91Electrician II NE 24 $34.8127 $39.1643 $43.5158 $6,034.20 $6,788.48 $7,542.74 $72,410.54 $81,461.80 $90,512.94Engineering Manager E 37 $65.6448 $73.8502 $82.0556 $11,378.43 $12,800.70 $14,222.97 $136,541.07 $153,608.36 $170,675.66Engineering Technician NE 22 $31.5764 $35.5233 $39.4703 $5,473.24 $6,157.37 $6,841.52 $65,678.62 $73,888.15 $82,097.91Environmental Compliance Specialist E 28 $42.3153 $47.6044 $52.8938 $7,334.65 $8,251.43 $9,168.26 $88,015.57 $99,017.29 $110,019.05
HOURLY MONTHLY ANNUALLY
Board Approved 5/21/18; Resolution No. 4345
OTAY WATER DISTRICT
Job Classification and Salary Schedule
Effective July 1, 2018
Exhibit B
PositionExempt (E)Non‐Exempt
(NE)
Salary Grade
Min Mid Max Min Mid Max Min Mid Max
HOURLY MONTHLY ANNUALLY
Equipment Mechanic I NE 18 $25.9780 $29.2250 $32.4722 $4,502.85 $5,065.67 $5,628.51 $54,034.03 $60,788.07 $67,542.15Equipment Mechanic II NE 21 $30.0727 $33.8316 $37.5906 $5,212.60 $5,864.14 $6,515.70 $62,551.06 $70,369.85 $78,188.50Executive Secretary NE 22 $31.5764 $35.5233 $39.4703 $5,473.24 $6,157.37 $6,841.52 $65,678.62 $73,888.15 $82,097.91Facilities Maintenance Technician NE 19 $27.2769 $30.6863 $34.0958 $4,728.00 $5,318.96 $5,909.94 $56,735.75 $63,827.48 $70,919.27Field Services Manager E 33 $54.0061 $60.7568 $67.5073 $9,361.06 $10,531.18 $11,701.27 $112,332.76 $126,373.88 $140,415.24Finance Manager, Controller & Budget E 35 $59.5418 $66.9842 $74.4269 $10,320.58 $11,610.59 $12,900.66 $123,846.85 $139,327.20 $154,807.80Finance Manager, Treasury & Accounting E 35 $59.5418 $66.9842 $74.4269 $10,320.58 $11,610.59 $12,900.66 $123,846.85 $139,327.20 $154,807.80Fleet Maintenance Supervisor E 28 $42.3153 $47.6044 $52.8938 $7,334.65 $8,251.43 $9,168.26 $88,015.57 $99,017.29 $110,019.05General Manager* E N/A $240,649.87GIS Analyst E 25 $36.5533 $41.1226 $45.6917 $6,335.91 $7,127.92 $7,919.89 $76,031.20 $85,534.81 $95,038.59GIS Manager E 34 $56.7063 $63.7947 $70.8828 $9,829.09 $11,057.75 $12,286.35 $117,949.20 $132,692.73 $147,436.03GIS Programmer Analyst E 27 $40.3002 $45.3376 $50.3750 $6,985.37 $7,858.52 $8,731.67 $83,824.40 $94,302.10 $104,780.05GIS Technician NE 22 $31.5764 $35.5233 $39.4703 $5,473.24 $6,157.37 $6,841.52 $65,678.62 $73,888.15 $82,097.91Human Resources Analyst E 25 $36.5533 $41.1226 $45.6917 $6,335.91 $7,127.92 $7,919.89 $76,031.20 $85,534.81 $95,038.59Human Resources Manager E 35 $59.5418 $66.9842 $74.4269 $10,320.58 $11,610.59 $12,900.66 $123,846.85 $139,327.20 $154,807.80Information Technology Manager E 34 $56.7063 $63.7947 $70.8828 $9,829.09 $11,057.75 $12,286.35 $117,949.20 $132,692.73 $147,436.03Inspection Supervisor E 28 $42.3153 $47.6044 $52.8938 $7,334.65 $8,251.43 $9,168.26 $88,015.57 $99,017.29 $110,019.05Laboratory Analyst NE 25 $36.5533 $41.1226 $45.6917 $6,335.91 $7,127.92 $7,919.89 $76,031.20 $85,534.81 $95,038.59Laboratory Analyst (Assigned Lab Director Duties NE 26 $38.3812 $43.1787 $47.9764 $6,652.74 $7,484.31 $8,315.91 $79,832.78 $89,811.60 $99,790.51Lead Customer Service Field Representative NE 21 $30.0727 $33.8316 $37.5906 $5,212.60 $5,864.14 $6,515.70 $62,551.06 $70,369.85 $78,188.50Lead Customer Service Representative NE 21 $30.0727 $33.8316 $37.5906 $5,212.60 $5,864.14 $6,515.70 $62,551.06 $70,369.85 $78,188.50Lead Reclamation Plant Operator NE 26 $38.3812 $43.1787 $47.9764 $6,652.74 $7,484.31 $8,315.91 $79,832.78 $89,811.60 $99,790.51Lead Water Systems Operator NE 26 $38.3812 $43.1787 $47.9764 $6,652.74 $7,484.31 $8,315.91 $79,832.78 $89,811.60 $99,790.51Meter Maintenance Worker I NE 18 $25.9780 $29.2250 $32.4722 $4,502.85 $5,065.67 $5,628.51 $54,034.03 $60,788.07 $67,542.15Meter Maintenance Worker II NE 21 $30.0727 $33.8316 $37.5906 $5,212.60 $5,864.14 $6,515.70 $62,551.06 $70,369.85 $78,188.50Meter Services Supervisor E 28 $42.3153 $47.6044 $52.8938 $7,334.65 $8,251.43 $9,168.26 $88,015.57 $99,017.29 $110,019.05Network Engineer E 31 $48.9851 $55.1081 $61.2312 $8,490.75 $9,552.07 $10,613.41 $101,889.00 $114,624.87 $127,360.81Permit Technician NE 20 $28.6406 $32.2206 $35.8006 $4,964.37 $5,584.90 $6,205.44 $59,572.35 $67,018.76 $74,465.22Pump Mechanic I NE 19 $27.2769 $30.6863 $34.0958 $4,728.00 $5,318.96 $5,909.94 $56,735.75 $63,827.48 $70,919.27Pump Mechanic II NE 22 $31.5764 $35.5233 $39.4703 $5,473.24 $6,157.37 $6,841.52 $65,678.62 $73,888.15 $82,097.91Pump/Electrical Supervisor E 28 $42.3153 $47.6044 $52.8938 $7,334.65 $8,251.43 $9,168.26 $88,015.57 $99,017.29 $110,019.05Purchasing & Facilities Manager E 34 $56.7063 $63.7947 $70.8828 $9,829.09 $11,057.75 $12,286.35 $117,949.20 $132,692.73 $147,436.03Reclamation Plant Operator I NE 19 $27.2769 $30.6863 $34.0958 $4,728.00 $5,318.96 $5,909.94 $56,735.75 $63,827.48 $70,919.27Reclamation Plant Operator II NE 21 $30.0727 $33.8316 $37.5906 $5,212.60 $5,864.14 $6,515.70 $62,551.06 $70,369.85 $78,188.50
Board Approved 5/21/18; Resolution No. 4345
OTAY WATER DISTRICT
Job Classification and Salary Schedule
Effective July 1, 2018
Exhibit B
PositionExempt (E)Non‐Exempt
(NE)
Salary Grade
Min Mid Max Min Mid Max Min Mid Max
HOURLY MONTHLY ANNUALLY
Reclamation Plant Operator III NE 23 $33.1551 $37.2993 $41.4437 $5,746.88 $6,465.21 $7,183.57 $68,962.49 $77,582.75 $86,202.81Reclamation Plant Supervisor E 30 $46.6524 $52.4839 $58.3155 $8,086.42 $9,097.21 $10,108.02 $97,037.05 $109,166.57 $121,295.99Recycled Water Program Supervisor E 28 $42.3153 $47.6044 $52.8938 $7,334.65 $8,251.43 $9,168.26 $88,015.57 $99,017.29 $110,019.05Recycled Water Specialist NE 23 $33.1551 $37.2993 $41.4437 $5,746.88 $6,465.21 $7,183.57 $68,962.49 $77,582.75 $86,202.81Safety and Security Specialist E 30 $46.6524 $52.4839 $58.3155 $8,086.42 $9,097.21 $10,108.02 $97,037.05 $109,166.57 $121,295.99SCADA/Instrumentation Technician NE 25 $36.5533 $41.1226 $45.6917 $6,335.91 $7,127.92 $7,919.89 $76,031.20 $85,534.81 $95,038.59Secretary NE 18 $25.9780 $29.2250 $32.4722 $4,502.85 $5,065.67 $5,628.51 $54,034.03 $60,788.07 $67,542.15Senior Accountant E 28 $42.3153 $47.6044 $52.8938 $7,334.65 $8,251.43 $9,168.26 $88,015.57 $99,017.29 $110,019.05Senior Civil Engineer E 34 $56.7063 $63.7947 $70.8828 $9,829.09 $11,057.75 $12,286.35 $117,949.20 $132,692.73 $147,436.03Senior Confidential Executive Secretary E 24 $34.8127 $39.1643 $43.5158 $6,034.20 $6,788.48 $7,542.74 $72,410.54 $81,461.80 $90,512.94Senior Disinfection Technician NE 24 $34.8127 $39.1643 $43.5158 $6,034.20 $6,788.48 $7,542.74 $72,410.54 $81,461.80 $90,512.94Senior Engineering Technician NE 24 $34.8127 $39.1643 $43.5158 $6,034.20 $6,788.48 $7,542.74 $72,410.54 $81,461.80 $90,512.94Senior Human Resources Analyst E 30 $46.6524 $52.4839 $58.3155 $8,086.42 $9,097.21 $10,108.02 $97,037.05 $109,166.57 $121,295.99Senior Procurement and Contracting Analyst E 26 $38.3812 $43.1787 $47.9764 $6,652.74 $7,484.31 $8,315.91 $79,832.78 $89,811.60 $99,790.51Senior SCADA/Instrumentation Technician NE 28 $42.3153 $47.6044 $52.8938 $7,334.65 $8,251.43 $9,168.26 $88,015.57 $99,017.29 $110,019.05Senior Utility/Equipment Operator NE 22 $31.5764 $35.5233 $39.4703 $5,473.24 $6,157.37 $6,841.52 $65,678.62 $73,888.15 $82,097.91Senior Warehouse Worker NE 20 $28.6406 $32.2206 $35.8006 $4,964.37 $5,584.90 $6,205.44 $59,572.35 $67,018.76 $74,465.22Supervising Land Surveyor E 29 $44.4311 $49.9847 $55.5385 $7,701.39 $8,664.01 $9,626.67 $92,416.31 $103,968.08 $115,520.00Survey Technician NE 25 $36.5533 $41.1226 $45.6917 $6,335.91 $7,127.92 $7,919.89 $76,031.20 $85,534.81 $95,038.59System Operations Manager E 36 $62.5190 $70.3334 $78.1483 $10,836.63 $12,191.12 $13,545.71 $130,039.17 $146,293.58 $162,548.22System Suppport Analyst E 29 $44.4311 $49.9847 $55.5385 $7,701.39 $8,664.01 $9,626.67 $92,416.31 $103,968.08 $115,520.00Utility Crew Leader NE 24 $34.8127 $39.1643 $43.5158 $6,034.20 $6,788.48 $7,542.74 $72,410.54 $81,461.80 $90,512.94Utility Maintenance Supervisor E 28 $42.3153 $47.6044 $52.8938 $7,334.65 $8,251.43 $9,168.26 $88,015.57 $99,017.29 $110,019.05Utility Services Manager E 35 $59.5418 $66.9842 $74.4269 $10,320.58 $11,610.59 $12,900.66 $123,846.85 $139,327.20 $154,807.80Utility Worker I NE 18 $25.9780 $29.2250 $32.4722 $4,502.85 $5,065.67 $5,628.51 $54,034.03 $60,788.07 $67,542.15Utility Worker II NE 20 $28.6406 $32.2206 $35.8006 $4,964.37 $5,584.90 $6,205.44 $59,572.35 $67,018.76 $74,465.22Valve Maintenance Worker NE 18 $25.9780 $29.2250 $32.4722 $4,502.85 $5,065.67 $5,628.51 $54,034.03 $60,788.07 $67,542.15Water Systems Operator I NE 20 $28.6406 $32.2206 $35.8006 $4,964.37 $5,584.90 $6,205.44 $59,572.35 $67,018.76 $74,465.22Water Systems Operator II NE 22 $31.5764 $35.5233 $39.4703 $5,473.24 $6,157.37 $6,841.52 $65,678.62 $73,888.15 $82,097.91Water Systems Operator III NE 23 $33.1551 $37.2993 $41.4437 $5,746.88 $6,465.21 $7,183.57 $68,962.49 $77,582.75 $86,202.81Water Systems Supervisor E 30 $46.6524 $52.4839 $58.3155 $8,086.42 $9,097.21 $10,108.02 $97,037.05 $109,166.57 $121,295.99
* Salary is determined by the Board
Board Approved 5/21/18; Resolution No. 4345
1
ORDINANCE NO. 567
AN ORDINANCE OF THE BOARD OF DIRECTORS OF THE OTAY WATER DISTRICT
AMENDING SECTION 25, CONDITIONS FOR WATER SERVICE; AND APPENDIX A OF THE DISTRICT’S CODE OF ORDINANCES
BE IT ORDAINED by the Board of Directors of Otay Water
District that the District’s Code of Ordinances Section 25,
Conditions for Water Service; and Appendix A be amended as per
Exhibits 1 & 3 to this resolution.
NOW, THEREFORE, BE IT RESOLVED that the new proposed
Section 25, Conditions for Water Service (Exhibit 2) and shall
become effective on July 1, 2018. The new proposed Appendix A
(Exhibit 4) of the Code of Ordinances shall become effective
January 1, 2019.
PASSED, APPROVED AND ADOPTED by the Board of Directors of
the Otay Water District at a regular meeting duly held this 21st
day of May 2018, by the following roll call vote:
AYES: NOES: ABSENT: ABSTAIN: ________________________________ President ATTEST: __________________________ District Secretary
Attachment C
25-1
25 SECTION 25 CONDITIONS FOR WATER SERVICE
25.01 SERVICE AREA
Water service shall be furnished by the District only to property within (annexed to) a water improvement district within the District’s service area. Water service to property located outside an improvement district may be furnished only upon prior approval of the Board of Directors. Temporary water service to property located outside an improvement district may be furnished, in accordance with Section 25.03 D.12., upon the approval of the General Manager.
25.02 DEFINITION OF "HCF" AND "UNIT OF WATER"
As used in the Code the terms "HCF" and "unit of water" are interchangeable and each shall mean 100 cubic feet or 748 gallons of water.
25.03 DEFINITIONS OF WATER SERVICE CATAGORIES, WATER RATES, CHARGES AND FEES
Water service furnished by the District shall be under the categories of services and at the rates, charges and fees as set forth in Appendix A, Section 25.
All District water rates, charges and fees are subject to Board approval of rate increases beginning January 1, 2018 and periodically thereafter through December 31, 2022. The increases shall be the amount sufficient to cover cost increases related to operations and maintenance, but not to exceed 10% per year.
Five-year Periodic Pass–through Rate Increases or Decreases from District Wholesalers – All District water rates, charges and fees are subject to periodic rate changes from the District’s public agency wholesalers for a five-year period beginning January 1, 2018 through December 31, 2022.
A. Set-up Fees for Accounts A set-up fee shall be charged for each account transferred to another customer. See Appendix A, 25.03 A. for charges. A deposit will be required of all customers who do not own the property to be served. See Appendix A, 25.04 A. for deposit amounts.
B. Monthly Fixed MWD & CWA Charges Each potable water service customer shall pay a monthly MWD and CWA fixed system charge, as set forth in Appendix A, 25.03 B. Proceeds of the charge will be used to pay for operating and maintenance costs, including the following: MWD Readiness-to-Serve Charge and Capacity Reservation Charge; CWA Infrastructure Access Charge, Customer Service Charge, Emergency Storage Charge, and Supply Reliability Charge.
Exhibit 1
25-2
The MWD & CWA charge is based on the size of the water meter(s) in service with the exception of upsizing the meter for individually metered residential fire service, as described in Section 38.03 of the Code. The MWD & CWA charge shall start upon installation of the meter.
C. Monthly Fixed System Charges Each water service customer shall pay a monthly fixed system charge, as set forth in Appendix A, 25.03 C. Proceeds of the charge will be used to pay for water system replacement, maintenance, and operation expenses. The system charge is based on the customer class and the size of the water meter(s) in service. For individually metered residential fire service, as outlined in Section 38.03 of the Code, the size and fee would be set based on water use requirements without additional fire capacity. The system charge shall start upon installation of the meter.
D. Categories of Water Service The definitions and rates and charges for water service furnished by the District shall be as follows:
1. DOMESTIC RESIDENTIAL WATER
(a) Defined as: Water service for single residential and individually metered attached households as well as other domestic uses (other than that provided for in Paragraph 2.(a).
(b) Base Rate: The tiered base rates of water furnished under this category shall be set forth in Appendix A, 25.03 D.1.(b).
(c) Monthly system charge: The monthly system charge for water service is set forth in Appendix A, 25.03 C.1.
2. MULTIPLE- RESIDENTIAL WATER
(a) Defined as: Master metered water service for multiple residential households, for example, duplexes, townhomes, apartments and mobile homes.
(b) Base Rate: The tiered base rates of water
furnished for each dwelling unit under each block of service in this category shall be as set forth in Appendix A, 25.03 D.2.(b).
(c) Monthly system charge: The monthly system charge for water service is set forth in Appendix A, 25.03 C.2.
25-3
3. BUSINESS AND PUBLICLY-OWNED WATER
(a) Defined as: Potable water service for commercial, industrial and publicly-owned establishments.
(b) Base Rate: The base rate for water furnished under this category shall be determined as set forth in Appendix A, 25.03 D.3.(b).
(c) Monthly system charge: The monthly system charge for water service is set forth in Appendix A, 25.03 C.3.
4. IRRIGATION AND COMMERCIAL AGRICULTURAL USING POTABLE WATER
(a) Irrigation is potable water service provided solely for irrigation of landscape or landscaping, as defined in Section 0.02 A.
(b) Commercial agricultural engaged in the growing or raising of livestock, in conformity with recognized practices of husbandry, for the purpose of commerce, trade or industry, or for the use by public educational or correctional institutions or agricultural horticultural or floricultural products and produced,
(i) for human consumption or for the market, or
(ii) for the feeding of fowl or livestock produced for human consumption or for the market, or
(iii) for feeding fowl or livestock for the purpose of obtaining their products for human consumption or for the market, such products to be grown or raised on a parcel of land having an area of not less than one acre utilized exclusively therefore.
(c) Base Rate: The base rate for water furnished under this category shall be determined as set forth in Appendix A, 25.03 D.4.(c).
(d) Monthly system charge: The monthly system charge for water service is set forth in Appendix A, 25.03 C.4.
25-4
5. RECYCLED WATER – LANDSCAPE IRRIGATION AND CERTAIN NON-IRRIGATION PURPOSES
(a) Defined as: Non-potable and recycled water service provided for irrigation of landscaping, as defined in Section 0.02 A. of the Code, and certain non-irrigation purposes, other than domestic use, in compliance with federal, state and local laws and regulations regarding use of recycled water.
(b) The provisions of this Code, relating to use of recycled water, set forth in Section 26 of the Code, including but not limited to cross-connections and backflow protective devices, shall be strictly enforced in connection with the use of recycled water.
(c) Base Rate: The base rate for water furnished under this category shall be determined as set forth in Appendix A, 25.03 D.5.(c).
(d) Monthly system charge: The monthly system charge for recycled water service is set forth in Appendix A, 25.03 C.5.
6. RECYCLED WATER - COMMERCIAL
(a) Defined as: Non-potable and recycled water service provided for commercial customers, as defined in Section 0.02 A. of the Code, and certain non-irrigation purposes, other than domestic use, in compliance with federal, state and local laws and regulations regarding use of recycled water.
(b) The provisions of this Code, relating to use of recycled water, set forth in Section 26 of the Code, including but not limited to cross-connections and backflow protective devices, shall be strictly enforced in connection with the use of recycled water.
(c) Base Rate: The base rate for water furnished under this category shall be determined as set forth in Appendix A, 25.03 D.6.(c).
(d) Monthly system charge: The monthly system charge for recycled commercial water service is set forth in Appendix A, 25.03 C.6.
7. POTABLE TEMPORARY AND CONSTRUCTION WATER SERVICE
(a) Defined as: Potable water service provided by the District on a temporary basis, pursuant to Section 31 of this Code.
25-5
(b) If capacity fees have not been paid by the customer, the rates for water furnished under this category is set forth in Appendix A, 25.03 D.7.(b).
(c) If the customer has paid capacity and annexation fees, the base rates and charges for water furnished under this category shall be the base rates and charges charged billed customers in the same category of service on a permanent meter basis.
(d) The applicable monthly system charge shall be the same rates charged to customers in the same category of service on a permanent meter basis per Appendix A, 25.03 C.5.
8. RECYCLED TEMPORARY AND CONSTRUCTION WATER SERVICE
(a) Defined as: Recycled water service provided by the District on a temporary basis, pursuant to Section 31 of this Code.
(b) If capacity fees have not been paid by the customer, the rates for water furnished under this category is set forth in Appendix A, 25.03 D.8(b).
(c) If the customer has paid capacity and annexation fees, the base rates and charges for water furnished under this category shall be the base rates and charges charged billed customers in the same category of service on a permanent meter basis.
(d) The applicable monthly system charge shall be the same rates charged to customers in the same category of service on a permanent meter basis per Appendix A, 25.03 C.5
9. WATER SERVICE UNDER SPECIAL AGREEMENTS
(a) Defined as: Water service provided under express agreements approved by the Board of Directors for service to golf courses and other entities, which service may be curtailed or interrupted by the District under conditions provided in such agreements.
(b) For water service under this category the base rate shall be determined on a case-by-case basis.
10. TANK TRUCKS
(a) Defined as: Water service provided for the filling of tanks on motor vehicles transporting
25-6
water used for other than earth grading purposes, which service shall be made only through a portable meter issued by the District to a customer specifically for use in accordance with the provisions herein for such service.
(b) The rate for metered water furnished under this
category is reflected in Appendix A, 25.03.D.10. (b), plus a monthly system charge at the rate set forth in Appendix A, 25.03 C.4.
(c) Requirements for Use of Water Meter
(1) To receive such service, the customer must make a deposit for the use a water meter furnished by the District. The fee is set forth in Appendix A, 31.03 A.1.
(2) Upon termination of the service, the Dis-trict will refund the amount of deposit remaining after making the following deductions:
(i) Cost of repairing or replacing the meter, fire hydrant and/or any fittings damaged or lost while in use; and
(ii) Unpaid charges for water or other applicable charges.
(3) Prior to the end of each six month period following issuance of a meter under this section, or at the request of the District, whichever is earlier, the customer shall return the meter to the District for inspection, repair, or calibration as deemed necessary by the District.
(4) Payment for water service under this cate-gory shall be made as follows:
(i) The bill shall be based on the amount of water actually used, which shall be determined by the District’s reading of the meter or by a report made by the customer to the District in the manner prescribed by the District.
(ii) Where the actual amount of water used cannot be determined as provided in (i), the District will issue a bill based on a District estimate of the amount of water used, as determined by the District. Such estimates shall be reconciled with actual amounts used when the customer returns the meter to
25-7
the District as provided in paragraph 3 above.
(iii)Payments shall be made as specified on the bill.
11. WATER SERVICE OUTSIDE DISTRICT BOUNDARIES
(a) Defined as: Water service for real property outside the service area of the District.
(b) This service will be provided only upon prior approval of the General Manager when there is a surplus of water over and above the existing needs for service in the District. This service is temporary and may be terminated upon written notice from the District. Customers for this service are sometimes referred to as "outside users."
(c) Customers applying for this category of service shall pay an application fee as set forth in Appendix A, 25.03 D.11.(c).
(d) The rate for metered water furnished under this
category shall be charged the rate as described in Appendix A, 25.03 D.11.(d), plus a monthly system charge at the rate set forth in Appendix A, 25.03 C.4.
(e) Customers requesting only fire service or a fire
hydrant under this category shall be charged a capacity fee based on one (1) EDU for a permanent meter in the improvement district from which the fire service derives its flow, plus a monthly system charge at the rate set forth in Appendix A, 25.03 D.13.(c).
12. WATER SERVICE OUTSIDE AN IMPROVEMENT DISTRICT
(a) Defined as: Water service for property located within the boundaries of the District, but not within a water improvement district. Customers for this service are sometimes referred to as "outside users."
(b) Customers applying for this service shall pay an application fee as set forth in Appendix A, 25.03 D.12.(b). The District will review the application to determine whether the land to be served should be annexed to an improvement district. If it is determined that annexation is not practical, the Board of Directors may authorize service as an outside user. This service will be reviewed periodically until it is
25-8
determined that the property must be annexed to an improvement district or that service must be terminated.
(c) The rate for metered water furnished under this category is as set forth in Appendix A, 25.03 D.12.(c), plus a monthly system charge as set forth in Appendix A, 25.03 C.4.
(d) Upon approval of the Board of Directors, a cus-tomer, who has paid all construction costs for facilities necessary to serve the customer's property in lieu of annexation to a water improvement district, shall be exempt from the provision for this category of service.
13. SERVICE FOR FIRE PROTECTION
(a) Defined as: Water service provided by the Dis-trict solely to feed fire hydrants or fire sprinkler systems from lines or laterals con-nected to District water mains.
(b) The District will not make a charge for the quantity of water used for fire protection purposes.
(c) The monthly system charge for this category of service is set forth in Appendix A, 25.03
D.13.(c) for each connection to a District water main made for fire protection service.
14. WATER SERVICE TO PROPERTY NOT SUBJECT TO DISTRICT
TAXES
(a) Pursuant to Section 71613 of the California Water Code, the District may furnish water to property, not subject to District taxes, at special rates, terms and conditions as are determined by the Board of Directors for such service. Such rates, terms and conditions shall be uniformly applied to like classes and conditions of service in the same improvement district or geographical area.
(b) Customers in this category, such as publicly-
owned establishments, shall pay an additional fee as outlined in Appendix A, 25.03 D.14.(b).
15. INTERIM WATER SERVICE IN IMPROVEMENT DISTRICT 7
(a) Definition of Interim Service. This is water Service furnished to a customer in Improvement District 7 (ID 7) for temporary use.
25-9
(b) Rates for Interim Service. Customers applying for interim service in ID 7 shall not be required to pay the ID 7 water capacity fee and San Diego
County Water Authority fee, as required under Section 28.01 of this Code. The water rate is set forth in Appendix A, 25.03D.15.(b).
(c) The rate for metered water furnished under this category is as set forth in Appendix A, 25.03 D.12 (c), plus a monthly system charge as set forth in Appendix A, 25.03 C.4.
(d) Conversion to Permanent Service. At such time as use expires, the customer shall be required to pay all fees in effect at the time the permanent use is implemented.
E. Energy Charges for Pumping Water
In addition to water rates and other charges provided for in this Section 25.03, customers shall be charged an energy pumping charge based on the quantity of water used and the elevation to which the water has been lifted to provide service. The energy pumping charge shall be made at the rate set forth in Appendix A, 25.03 E.
25.04 DEPOSITS BY LESSEES OR NON-OWNERS OF PROPERTY
8. RECYCLED TEMPORARY AND CONSTRUCTION WATER SERVICE
(a) Defined as: Recycled water service provided by the District on a temporary basis, pursuant to Section 31 of this Code.
(b) If capacity fees have not been paid by the customer, the rates for water furnished under this category is set forth in Appendix A, 25.03 D.8(b).
(c) If the customer has paid capacity and annexation fees, the base rate for water furnished under this category shall be the base rate charged customers in the same category of service on a permanent meter basis.
(d) The applicable monthly system charge shall be the same rates charged to customers in the same category of service on a permanent meter basis per Appendix A, 25.03 C.5.
A. AMOUNT OF DEPOSIT
25-10
The customer's deposit shall be applied to reduce or satisfy any delinquent payment or other amount due the District at the time of termination of water service to the customer. Any portion of the deposit remaining, after satisfaction of the amount due, shall be refunded to the customer that made the deposit. The deposits listed per Appendix A, 25.04 A. may be waived for a new residential applicant where the applicant demonstrates credit worthiness based upon prior utility payments or a non-delinquent water account for one year or other similar evidence of credit.
B. REFUND OF DEPOSIT
Where funds have been on deposit for twelve months in a domestic service account and there has been no more than one delinquent payment on that account during that period, the District will apply a credit to the water account in the amount of the deposit.
C. LETTER OF CREDIT
A letter of credit, in a form approved by the General Manager or Department Head of Finance, may be submitted to the District to satisfy the deposit requirements.
25.05 SERVICE TO SUBSEQUENT CUSTOMERS
After a water meter has been installed for a customer and all fees and charges have been paid, water service may be furnished to a subsequent customer through the water meter installed without payment of further charges, except for the set-up fee for transferred accounts, payment of delinquent charges for the applicant's service or other deposits that may be required by this Code.
25-1
25 SECTION 25 CONDITIONS FOR WATER SERVICE
25.01 SERVICE AREA
Water service shall be furnished by the District only to property within (annexed to) a water improvement district within the District’s service area. Water service to property located outside an improvement district may be furnished only upon prior approval of the Board of Directors. Temporary water service to property located outside an improvement district may be furnished, in accordance with Section 25.03 D.12., upon the approval of the General Manager.
25.02 DEFINITION OF "HCF" AND "UNIT OF WATER"
As used in the Code the terms "HCF" and "unit of water" are interchangeable and each shall mean 100 cubic feet or 748 gallons of water.
25.03 DEFINITIONS OF WATER SERVICE CATAGORIES, WATER RATES, CHARGES AND FEES
Water service furnished by the District shall be under the categories of services and at the rates, charges and fees as set forth in Appendix A, Section 25.
All District water rates, charges and fees are subject to Board approval of rate increases beginning January 1, 2018 and periodically thereafter through December 31, 2022. The increases shall be the amount sufficient to cover cost increases related to operations and maintenance, but not to exceed 10% per year.
Five-year Periodic Pass–through Rate Increases or Decreases from District Wholesalers – All District water rates, charges and fees are subject to periodic rate changes from the District’s public agency wholesalers for a five-year period beginning January 1, 2018 through December 31, 2022.
A. Set-up Fees for Accounts A set-up fee shall be charged for each account transferred to another customer. See Appendix A, 25.03 A. for charges. A deposit will be required of all customers who do not own the property to be served. See Appendix A, 25.04 A. for deposit amounts.
B. Monthly Fixed MWD & CWA Charges Each potable water service customer shall pay a monthly MWD and CWA fixed system charge, as set forth in Appendix A, 25.03 B. Proceeds of the charge will be used to pay for operating and maintenance costs, including the following: MWD Readiness-to-Serve Charge and Capacity Reservation Charge; CWA Infrastructure Access Charge, Customer Service Charge, Emergency Storage Charge, and Supply Reliability Charge.
Exhibit 2
25-2
The MWD & CWA charge is based on the size of the water meter(s) in service with the exception of upsizing the meter for individually metered residential fire service, as described in Section 38.03 of the Code. The MWD & CWA charge shall start upon installation of the meter.
C. Monthly Fixed System Charges Each water service customer shall pay a monthly fixed system charge, as set forth in Appendix A, 25.03 C. Proceeds of the charge will be used to pay for water system replacement, maintenance, and operation expenses. The system charge is based on the customer class and the size of the water meter(s) in service. For individually metered residential fire service, as outlined in Section 38.03 of the Code, the size and fee would be set based on water use requirements without additional fire capacity. The system charge shall start upon installation of the meter.
D. Categories of Water Service The definitions and rates and charges for water service furnished by the District shall be as follows:
1. DOMESTIC RESIDENTIAL WATER
(a) Defined as: Water service for single residential and individually metered attached households as well as other domestic uses (other than that provided for in Paragraph 2.(a).
(b) Base Rate: The tiered base rates of water furnished under this category shall be set forth in Appendix A, 25.03 D.1.(b).
(c) Monthly system charge: The monthly system charge for water service is set forth in Appendix A, 25.03 C.1.
2. MULTI-RESIDENTIAL WATER
(a) Defined as: Master metered water service for multiple residential households, for example, duplexes, townhomes, apartments and mobile homes.
(b) Base Rate: The tiered base rates of water
furnished for each dwelling unit under each block of service in this category shall be as set forth in Appendix A, 25.03 D.2.(b).
(c) Monthly system charge: The monthly system charge for water service is set forth in Appendix A, 25.03 C.2.
25-3
3. BUSINESS AND PUBLICLY-OWNED WATER
(a) Defined as: Potable water service for commercial, industrial and publicly-owned establishments.
(b) Base Rate: The base rate for water furnished under this category shall be determined as set forth in Appendix A, 25.03 D.3.(b).
(c) Monthly system charge: The monthly system charge for water service is set forth in Appendix A, 25.03 C.3.
4. IRRIGATION AND COMMERCIAL AGRICULTURAL USING POTABLE WATER
(a) Irrigation is potable water service provided solely for irrigation of landscape or landscaping, as defined in Section 0.02 A.
(b) Commercial agricultural engaged in the growing or raising of livestock, in conformity with recognized practices of husbandry, for the purpose of commerce, trade or industry, or for the use by public educational or correctional institutions or agricultural horticultural or floricultural products and produced,
(i) for human consumption or for the market, or
(ii) for the feeding of fowl or livestock produced for human consumption or for the market, or
(iii) for feeding fowl or livestock for the purpose of obtaining their products for human consumption or for the market, such products to be grown or raised on a parcel of land having an area of not less than one acre utilized exclusively therefore.
(c) Base Rate: The base rate for water furnished under this category shall be determined as set forth in Appendix A, 25.03 D.4.(c).
(d) Monthly system charge: The monthly system charge for water service is set forth in Appendix A, 25.03 C.4.
25-4
5. RECYCLED WATER – LANDSCAPE IRRIGATION AND CERTAIN NON-IRRIGATION PURPOSES
(a) Defined as: Non-potable and recycled water service provided for irrigation of landscaping, as defined in Section 0.02 A. of the Code, and certain non-irrigation purposes, other than domestic use, in compliance with federal, state and local laws and regulations regarding use of recycled water.
(b) The provisions of this Code, relating to use of recycled water, set forth in Section 26 of the Code, including but not limited to cross-connections and backflow protective devices, shall be strictly enforced in connection with the use of recycled water.
(c) Base Rate: The base rate for water furnished under this category shall be determined as set forth in Appendix A, 25.03 D.5.(c).
(d) Monthly system charge: The monthly system charge for recycled water service is set forth in Appendix A, 25.03 C.5.
6. RECYCLED WATER - COMMERCIAL
(a) Defined as: Non-potable and recycled water service provided for commercial customers, as defined in Section 0.02 A. of the Code, and certain non-irrigation purposes, other than domestic use, in compliance with federal, state and local laws and regulations regarding use of recycled water.
(b) The provisions of this Code, relating to use of recycled water, set forth in Section 26 of the Code, including but not limited to cross-connections and backflow protective devices, shall be strictly enforced in connection with the use of recycled water.
(c) Base Rate: The base rate for water furnished under this category shall be determined as set forth in Appendix A, 25.03 D.6.(c).
(d) Monthly system charge: The monthly system charge for recycled commercial water service is set forth in Appendix A, 25.03 C.6.
7. POTABLE TEMPORARY AND CONSTRUCTION WATER SERVICE
(a) Defined as: Potable water service provided by the District on a temporary basis, pursuant to Section 31 of this Code.
25-5
(b) If capacity fees have not been paid by the customer, the rates for water furnished under this category is set forth in Appendix A, 25.03 D.7.(b).
(c) If the customer has paid capacity and annexation fees, the rates and charges for water furnished under this category shall be the rates and charges billed customers in the same category of service on a permanent meter basis.
(d) The applicable monthly system charge shall be the same rates charged to customers in the same category of service on a permanent meter basis per Appendix A, 25.03 C.5.
8. RECYCLED TEMPORARY AND CONSTRUCTION WATER SERVICE
(a) Defined as: Recycled water service provided by the District on a temporary basis, pursuant to Section 31 of this Code.
(b) If capacity fees have not been paid by the customer, the rates for water furnished under this category is set forth in Appendix A, 25.03 D.8(b).
(c) If the customer has paid capacity and annexation fees, the rates and charges for water furnished under this category shall be the rates and charges billed customers in the same category of service on a permanent meter basis.
(d) The applicable monthly system charge shall be the same rates charged to customers in the same category of service on a permanent meter basis per Appendix A, 25.03 C.5
9. WATER SERVICE UNDER SPECIAL AGREEMENTS
(a) Defined as: Water service provided under express agreements approved by the Board of Directors for service to golf courses and other entities, which service may be curtailed or interrupted by the District under conditions provided in such agreements.
(b) For water service under this category the base rate shall be determined on a case-by-case basis.
10. TANK TRUCKS
(a) Defined as: Water service provided for the filling of tanks on motor vehicles transporting water used for other than earth grading purposes, which service shall be made only through a
25-6
portable meter issued by the District to a customer specifically for use in accordance with the provisions herein for such service.
(b) The rate for metered water furnished under this
category is reflected in Appendix A, 25.03.D.10. (b), plus a monthly system charge at the rate set forth in Appendix A, 25.03 C.4.
(c) Requirements for Use of Water Meter
(1) To receive such service, the customer must make a deposit for the use a water meter furnished by the District. The fee is set forth in Appendix A, 31.03 A.1.
(2) Upon termination of the service, the Dis-trict will refund the amount of deposit remaining after making the following deductions:
(i) Cost of repairing or replacing the meter, fire hydrant and/or any fittings damaged or lost while in use; and
(ii) Unpaid charges for water or other applicable charges.
(3) Prior to the end of each six month period following issuance of a meter under this section, or at the request of the District, whichever is earlier, the customer shall return the meter to the District for inspection, repair, or calibration as deemed necessary by the District.
(4) Payment for water service under this cate-gory shall be made as follows:
(i) The bill shall be based on the amount of water actually used, which shall be determined by the District’s reading of the meter or by a report made by the customer to the District in the manner prescribed by the District.
(ii) Where the actual amount of water used cannot be determined as provided in (i), the District will issue a bill based on a District estimate of the amount of water used, as determined by the District. Such estimates shall be reconciled with actual amounts used when the customer returns the meter to
25-7
the District as provided in paragraph 3 above.
(iii)Payments shall be made as specified on the bill.
11. WATER SERVICE OUTSIDE DISTRICT BOUNDARIES
(a) Defined as: Water service for real property outside the service area of the District.
(b) This service will be provided only upon prior approval of the General Manager when there is a surplus of water over and above the existing needs for service in the District. This service is temporary and may be terminated upon written notice from the District. Customers for this service are sometimes referred to as "outside users."
(c) Customers applying for this category of service shall pay an application fee as set forth in Appendix A, 25.03 D.11.(c).
(d) The rate for metered water furnished under this
category shall be charged the rate as described in Appendix A, 25.03 D.11.(d), plus a monthly system charge at the rate set forth in Appendix A, 25.03 C.4.
(e) Customers requesting only fire service or a fire
hydrant under this category shall be charged a capacity fee based on one (1) EDU for a permanent meter in the improvement district from which the fire service derives its flow, plus a monthly system charge at the rate set forth in Appendix A, 25.03 D.13.(c).
12. WATER SERVICE OUTSIDE AN IMPROVEMENT DISTRICT
(a) Defined as: Water service for property located within the boundaries of the District, but not within a water improvement district. Customers for this service are sometimes referred to as "outside users."
(b) Customers applying for this service shall pay an application fee as set forth in Appendix A, 25.03 D.12.(b). The District will review the application to determine whether the land to be served should be annexed to an improvement district. If it is determined that annexation is not practical, the Board of Directors may authorize service as an outside user. This service will be reviewed periodically until it is
25-8
determined that the property must be annexed to an improvement district or that service must be terminated.
(c) The rate for metered water furnished under this category is as set forth in Appendix A, 25.03 D.12.(c), plus a monthly system charge as set forth in Appendix A, 25.03 C.4.
(d) Upon approval of the Board of Directors, a cus-tomer, who has paid all construction costs for facilities necessary to serve the customer's property in lieu of annexation to a water improvement district, shall be exempt from the provision for this category of service.
13. SERVICE FOR FIRE PROTECTION
(a) Defined as: Water service provided by the Dis-trict solely to feed fire hydrants or fire sprinkler systems from lines or laterals con-nected to District water mains.
(b) The District will not make a charge for the quantity of water used for fire protection purposes.
(c) The monthly system charge for this category of service is set forth in Appendix A, 25.03
D.13.(c) for each connection to a District water main made for fire protection service.
14. WATER SERVICE TO PROPERTY NOT SUBJECT TO DISTRICT
TAXES
(a) Pursuant to Section 71613 of the California Water Code, the District may furnish water to property, not subject to District taxes, at special rates, terms and conditions as are determined by the Board of Directors for such service. Such rates, terms and conditions shall be uniformly applied to like classes and conditions of service in the same improvement district or geographical area.
(b) Customers in this category, such as publicly-
owned establishments, shall pay an additional fee as outlined in Appendix A, 25.03 D.14.(b).
15. INTERIM WATER SERVICE IN IMPROVEMENT DISTRICT 7
(a) Definition of Interim Service. This is water Service furnished to a customer in Improvement District 7 (ID 7) for temporary use.
25-9
(b) Rates for Interim Service. Customers applying for interim service in ID 7 shall not be required to pay the ID 7 water capacity fee and San Diego
County Water Authority fee, as required under Section 28.01 of this Code. The water rate is set forth in Appendix A, 25.03D.15.(b).
(c) The rate for metered water furnished under this category is as set forth in Appendix A, 25.03 D.12 (c), plus a monthly system charge as set forth in Appendix A, 25.03 C.4.
(d) Conversion to Permanent Service. At such time as use expires, the customer shall be required to pay all fees in effect at the time the permanent use is implemented.
E. Energy Charges for Pumping Water
In addition to water rates and other charges provided for in this Section 25.03, customers shall be charged an energy pumping charge based on the quantity of water used and the elevation to which the water has been lifted to provide service. The energy pumping charge shall be made at the rate set forth in Appendix A, 25.03 E.
25.04 DEPOSITS BY LESSEES OR NON-OWNERS OF PROPERTY
A. AMOUNT OF DEPOSIT
The customer's deposit shall be applied to reduce or satisfy any delinquent payment or other amount due the District at the time of termination of water service to the customer. Any portion of the deposit remaining, after satisfaction of the amount due, shall be refunded to the customer that made the deposit. The deposits listed per Appendix A, 25.04 A. may be waived for a new residential applicant where the applicant demonstrates credit worthiness based upon prior utility payments or a non-delinquent water account for one year or other similar evidence of credit.
B. REFUND OF DEPOSIT
Where funds have been on deposit for twelve months in a domestic service account and there has been no more than one delinquent payment on that account during that period, the District will apply a credit to the water account in the amount of the deposit.
25-10
C. LETTER OF CREDIT
A letter of credit, in a form approved by the General Manager or Department Head of Finance, may be submitted to the District to satisfy the deposit requirements.
25.05 SERVICE TO SUBSEQUENT CUSTOMERS
After a water meter has been installed for a customer and all fees and charges have been paid, water service may be furnished to a subsequent customer through the water meter installed without payment of further charges, except for the set-up fee for transferred accounts, payment of delinquent charges for the applicant's service or other deposits that may be required by this Code.
Section # Code # Fee Description Meter Size
9 9.04 A.1. District Annexation Processing Fee $795.26
9.04 B.
Annexation Fees for Water Annexations
into Otay Water District Boundaries
Districtwide
Annexation
Fee
3/4" $2,088.01
1" $5,220.03
1-1/2" $10,440.05
2" $16,704.08
3" $33,408.16
4 $52,200.25
6" $104,400.50
8" $167,040.80
10" $240,121.15
9.04 C.4.
Annexation Fees for Annexations to
Sewer Improvement Districts per EDU $1,142.23
10 10.01 Waiver Request $50.00
23 23.04 Backflow Certification
- Second Notification $10.00
- Third Notification $25.00
- Third Notification (hand delivered) $45.00
- Reconnection $50.00
- Reconnection (if test performed with technician present) $150.00
- Initial Filing Fee (New applicants for
addition to the list of approved backflow
prevention device testers) $25.00
- Renewal Filing Fee (to remain on list
of approved backflow prevention device
testers) Annually $10.00
25 25.03 A. Set-up Fees for Accounts $10.00
25 25.03 B.
Monthly MWD & CWA Fixed System
Charges (1)
3/4" $15.45
1" $28.68
1-1/2" $64.85
2" $110.30
3" $234.60
Otay Water District
Appendix A
Charges
(1) All Water used in December and billed in January 2018.
Exhibit 3
Section # Code # Fee Description Meter Size Charges
25 25.03 B.
Monthly MWD & CWA Fixed System
Charges (1)
(continued) 4" $375.68
6" $769.02
8" $1,241.89
10" $1,787.55
25 25.03 C.1.
Domestic Residential Monthly Fixed
System Charges (1)
3/4" $17.38
1" $24.56
1-1/2" $42.49
2" $64.00
25 25.03 C.2.
Multi-Residential Monthly Fixed System
Charges (1)
3/4" $38.21
1" $53.97
1-1/2" $93.37
2" $140.61
3" $266.66
4" $408.50
6" $802.55
8" $1,275.34
10" $1,826.91
25 25.03 C.3.
Business and Publicly-Owned Monthly
Fixed System Charges (1)
3/4" $35.99
1" $50.83
1-1/2" $87.95
2" $132.45
3" $251.19
4" $384.79
6" $755.97
8" $1,201.32
10" $1,720.86
25 25.03 C.4. 3/4" $30.40
1" $42.93
1-1/2" $74.28
2" $111.85
3" $212.13
4" $324.98
6" $638.44
8" $1,014.56
10" $1,453.33
Irrigation and Commercial Agricultural
Monthly Fixed System Charges (1)
(1) All Water used in December and billed in January 2018.
Section # Code # Fee Description Meter Size Charges
25 25.03 C.5.
- Irrigation 3/4" $31.11
1" $43.94
1-1/2" $76.04
2" $114.50
3" $217.15
4" $332.67
6" $663.54
8" $1,038.56
10" $1,487.72
25 25.03 C.6.
- Commercial 3/4" $36.85
1" $52.04
1-1/2" $90.06
2" $135.63
3" $257.21
4" $394.01
6" $774.07
8" $1,230.08
10" $1,762.08
25 25.03 D.1.(b) Domestic Residential Water Rates(1)
Unit Charge
1-10 $3.05
11-22 $5.44
23 or more $7.03
25 25.03 D.2.(b)
Multiple Residential Water Rates - Per
Dwelling Unit (1)
0-4 $2.85
5-9 $5.17
10 or more $6.35
25 25.03 D.3.(b)
Business and Publicly-Owned Water
Rates (1)
All Units $3.61
25 25.03 D.4.(c)
Irrigation and Commercial Agricultural
Using Potable Water Rates (1)
All Units $5.27
25 25.03 D.5.(c) Recycled Irrigation (1)
All Units $4.26
25 25.03 D.6.(c) Recycled Commercial (1)
All Units $3.01
25 25.03 D.7.(b)
Potable Temporary and Construction
Water Service Rates (1)
All Units $10.54
Recyled Monthly Fixed System Charges (1)
Recyled Monthly Fixed System Charges (1)
(1) All Water used in December and billed in January 2018.
Section # Code # Fee Description Meter Size Charges
25 25.03 D.8.(b)
Recycled Temporary and Construction
Water Service Rates (1)
All Units $8.52
25 25.03 D.10.(b) Tank Trucks Water Rates (1)
All Units $10.54
25 25.03 D.11.(c)
Application Fee for Water Service Outside
District Boundaries $500.00
25 25.03 D.11.(d)
Water Rate for Service Outside District
Boundaries (1)
All Units $10.54
25 25.03 D.12.(b)
Application Fee for Water Service Outside
an Improvement District $275.00
25 25.03 D.12.(c)
Water Rate for Service Outside
Improvement District (1)
All Units $10.54
25 25.03 D.13.(c) Fire Service Monthly Charge 3" or less $20.77
more than 4" $27.98
25 25.03 D.14.(b) Government Fee Per Unit $0.41
25 25.03 D.15.(b) Interim Service Water Rate(1)
All Units $10.54
25 25.03 E. Energy Charges for Pumping Water (1)
Per 100 ft of lift
over 450 ft per
unit $0.053
25 25.04 A. Deposits for Non-Property Owners 3/4" $75.00
1" $150.00
1-1/2" $200.00
2" $360.00
3" $800.00
4" $1,350.00
6" $3,300.00
8" $4,400.00
10" $5,500.00
(1) All Water used in December and billed in January 2018.
Section # Code # Fee Description Meter Size Charges
28 28.01 B.1. Capacity Fees and Zone Charge
Districtwide
Capacity Fee
- All IDs excluding Triad 3/4" $7,601.73
1" $19,004.33
1-1/2" $38,008.65
2" $60,813.84
3" $121,627.68
4 $190,043.25
6" $380,086.50
8" $608,138.40
10" $874,198.95
- TRIAD 3/4" $5,702.82
1" $14,257.05
1 -1/2" $28,514.10
2" $45,622.56
3" $91,245.12
4 $142,570.50
6" $285,141.00
8" $456,225.60
10" $655,824.30
28 28.01 B.2. New Water Supply Fee
- All IDs including Triad 3/4" $825.17
1" $2,062.93
1-1/2" $4,125.85
2" $6,601.36
3" $13,202.72
4" $20,629.25
6" $41,258.50
8" $66,013.60
10" $94,894.55
28 28.02 Installation and Water Meter Charges Meter Size Meter Cost Installation Total
Meter
Box/Vault
(if Needed)
- Potable (Non-Irrigation) 3/4" x 7.5" $234.44 $111.25 $345.69 $94.45
3/4" x 9" $249.61 $111.25 $360.86 $94.45
1" $302.52 $111.25 $413.77 $94.45
1.5" $491.72 $111.25 $602.97 $214.11
2" $704.58 $111.25 $815.83 $214.11
3" $2,195.75 $669.83 $2,865.58 $3,819.41
4" $3,813.67 $669.83 $4,483.50 $3,819.41
6" $6,587.25 $1,058.05 $7,645.30 $3,819.41
8" $8,230.28 $1,622.42 $9,852.70 $5,479.21
10" $11,836.68 $1,622.42 $13,459.10 $5,479.21
Section # Code # Fee Description Meter Size Charges
28 28.02
- Potable/Recycled Irrigation 3/4" x 7.5" $234.44 $111.25 $345.69 $240.70
3/4" x 9" $240.70 $111.25 $351.95 $249.61
1" $302.52 $111.25 $413.77 $240.70
1.5" $491.72 $111.25 $602.97 $240.70
2" $704.58 $111.25 $815.83 $240.70
3" $1,519.68 $669.83 $2,189.51 $3,819.41
4" $2,958.59 $669.83 $3,628.42 $3,819.41
6" $5,326.42 $1,058.05 $6,384.47 $3,819.41
8" $7,095.75 $1,622.42 $8,718.17 $5,479.21
10" $10,069.41 $1,622.42 $11,691.83 $5,479.21
- Combined Fire and Domestic 4" $9,073.07 $669.83 $9,742.90 $3,819.41
6" $12,075.46 $1,058.05 $13,133.51 $3,819.41
8" $17,556.85 $1,622.42 $19,179.27 $5,479.21
10" $23,959.30 $1,622.42 $25,581.72 $5,479.21
31 31.03 A.1.
Requirement of Deposit for Temporary
Meters 3/4" $156.85
1" $184.78
1-1/2" $379.62
2" $2,046.00
4" $1,986.00
6" $2,465.00
- Construction Trailer Temporary Meter 2" $2,046.00
- Tank Truck Temporary Meter
(Ordinance No. 372) 2" $850.00
31 31.03 A.4. Temporary Meter Install & Removal 3/4" - 4" (on hydrant) $150.00
4" - 6" $806.00
8" - 10" Actual Cost
31 31.03 A.5.
Temporary Meter Move Fee
(includes backflow certification) 3/4" - 4" (on hydrant) $150.00
4" - 6" $806.00
8" - 10" Actual Cost
33 33.07 A.
Customer Request for Meter Test
(Deposit) 5/8", 3/4" & 1" $25.00
1-1/2" & 2 " $50.00
3" & Larger $125.00
34 34.01 D.2. Returned Check Charges $25.00
34 34.02 B. Late Payment Charge
5% of
Delinquent
Balance
Installation and Water Meter Charges (continued)
Section # Code # Fee Description Meter Size Charges
34 34.02 G.1.(d) Delinquency Tag $15.00
34 34.02 G.3. Meter "Turn-On" Charge $50.00
53 53.03 A.1. Sewer Capacity Fee per EDU for parcels within a Sewer ID $3,353.37
53 53.03 A.2. Sewer Capacity Fee per EDU for parcels not within a Sewer ID $5,737.43
53 53.03 B.1. Sewer Connection Fee - Russell Square $7,500.00
53 53.03 B.2. Monthly Sewer Service Charge - Russell Square $200.00
CWA diversification of regional supply (drought-proofing San Diego)
Efficiency Gains (Since 2007)
23% headcount reduction
36% increase in customers per FTE
Bond Rating
S&P ‘AA’ rating
Sound Financial Management
Reserve, debt and investment policies
External economist assisting with growth projections10
ECONOMIC OVERVIEW
(ALAN NEVIN, EXPERA GROUP)
11
STRATEGIC PLANFY2019 – FY2022
(ADOLFO SEGURA)
12
Overview
STRATEGIC PLAN FY19 – FY22:
Continuing with the closure of the FY15 – FY18 plan, the District has developed a new four-year Strategic Plan
designed to address new initiatives, projects, and track essential day-to-day performance metrics. Key areas of
focus are: continued advancement of the Asset Management (AM) and Capital Improvement Project (CIP) programs,
long-term business planning of the sewer and recycled water system, assessment and requirement development for
a next generation enterprise resource planning (ERP) business system to replace the current financial and customer
management system, pension liability financing, enhanced customer engagement, increased use of cloud and social
media tools, enhancement of cybersecurity, and advancement of employee development programs and retention.
The District’s Strategic Plan was developed with the Balanced Scorecard (BSC) framework, which centers around
the customer, financial, internal business processes, and learning and growth perspectives. Working toward a
common goal, the framework ensures the alignment of the District’s mission, vision, and plan execution. With the
strategic planning process rooted in the District’s culture, the continued output is that of an organization focused on
its core business and customers, and the delivery of reliable, cost-effective services.
To provide exceptional water and wastewater services to its customers and to manage District resources in a transparent and fiscally responsible manner.
MISSION
14
To be a model water agency by providing stellarservice, achieving measurable results, andcontinuously improving operational practices.
VISION
15
INNOVATION
TEAMWORK We promote mutual trust by sharing information, knowledge, and ideas to reach our common goals.
EMPLOYEESWe see each individual as unique and important. We value diversity andopen communication to promote fairness, dignity, and respect.
INTEGRITYWe commit ourselves to doing the right thing. Ethical behavior,trustworthiness, and accountability are the District’s foundation.
EXCELLENCE We strive to provide the highest quality and value in all that we do.
CUSTOMERSWe take pride that our commitment to customer-centered serviceis our highest priority.
Statement of Values
We constantly seek better, more efficient and cost-effective ways to deliver our services.
17
Goals, Strategies, and ObjectivesBalanced Scorecard Perspective: Financial
Execute and deliver services that meet or exceed customer expectations,
and increase customer engagement in order to improve District services.
1. Enhance and build awareness and engagement among the District’s customers and stakeholders andwithin the San Diego Region of the District’s strategies, policies, projects, programs, andlegislative/regulatory issues
• Evaluate and enhance the District’s water conservation programs (Water Conservation Garden;San Diego County Water Authority programs; District supplemental programs; Outreach to HOAsand other groups)
• Continue implementation of and enhance the District’s community and business outreach, media,and government relations programs
• Ensure consistency of branding and representation across the District, using consistent logos,colors, messaging, communications tools, and other collaterals through enhancement of internaland external marketing materials
19
2. Assess and enhance communications tools; increase online presence and social media exposure
Social media Lobby display
Email Evaluate the use of paid advertising
Text Video
Newsletter Mobile Applications
Website (design, functionality, user interface,and other applications that integrate withthe website)
Collaterals (PowerPoint presentations, billinserts, bill messaging, fact sheets,infographics, and other)
Analytics for a variety of tools (social media,web, video, mobile app, and other)
Develop list of social media influencers asambassadors
Execute and deliver services that meet or exceed customer expectations,
and increase customer engagement in order to improve District services.
20
Goals, Strategies, and ObjectivesBalanced Scorecard Perspective: Customer
Plan and execute sound financial activities that are essential to running and sustaining District operations with the lowest possible impact to customers.
1. Integrated resource planning and facility optimization• South District Potable Water Supply Alternatives to San Diego County Water Authority
(SDCWA) Pipeline 4 Supply Interruption (catastrophic event)• Treatment Plant long-term business plan (sewer portion)• Recycled Water long-term business plan
2. Evaluation of key system alternatives and financial impact• In support of Engineering, Recycled Water and Sewer business financial analysis• Desalination (Rosarito) financial analysis
3. Enhancement of business systems• Enterprise Resource Planning (ERP)/Customer Information System (CIS)/Customer
Relationship Management (CRM) validation and replacement evaluation• Evaluate enhancements to, or replacement, of the rate model program• Implement Paperless Account Payable (AP) solution• Evaluate and if beneficial, implement Cloud payroll service 22
4. Enhance Asset Management and Capital Improvement Plan (CIP) development programs• Enhance framework for systematic development, validation, and implementation of new CIPs• Financial-Activity based cost cross-training• In support of Engineering, enhance financial impact forecasting and analysis of future CIP’s• Enhancement of District Asset Management (AM) Program
5. Develop alternative Public Employees Retirement System (PERS) financing strategy to fund ahead ofPERS schedule
• Optimize funding and liability schedule
6. Negotiate and implement new labor agreement and optimize employee benefit programs• Negotiate and implement new labor agreement• Review Deferred Compensation Program for reduced fees and streamlined approach and
ensure program offerings are fully utilized
Plan and execute sound financial activities that are essential to running and sustaining District operations with the lowest possible impact to customers.
23
Goals, Strategies, and ObjectivesBalanced Scorecard Perspective: Internal BusinessProcesses
.
1. Optimize meter activity operations• Explore web-based options for meter reading and backflow test entry• Optimize Global Positioning System (GPS) fleet assignment and routing operation• Evaluation of Advanced Metering Infrastructure (AMI) technology
2. Enhance customer experience (partnership between Customer Service & Public Relations)• Customer electronic communication and outreach• Enterprise Resource Planning (ERP)/Customer Information System (CIS)/Customer
Relationship Management (CRM) validation and replacement evaluation
3. Evaluate and leverage the use of available HR self-service and capital management technologysolutions
• Implement Human Resource Information System (HRIS) in coordination with payroll conversion• Pilot cloud-based human capital performance management system and implement if determined• Evaluate on-boarding programs and implement if determined
INTE
RN
AL
BUSI
NES
S PR
OC
ESSE
S
Improve business services by continually improving essential processes,
invest in strategic technology, and achieve new efficiencies.
25
4. Maintain a reliable, scalable, secure, and high performing technology infrastructureto support current and future service needs• Deploy next generation storage services and communication architecture• Adopt National Institute of Standards and Technology (NIST) cyber security framework
and enhance disaster recovery planning• Create framework to evaluate cost efficiency of new technology services and cloud vs.
on premise selection• Advance business processes and operational efficiencies through effective implementation
of information technology
5. Enhance SCADA system services via SCADA roadmap project• Prioritize 14 strategic project/initiatives, recently developed
INTE
RN
AL
BUSI
NES
S PR
OC
ESSE
S
Improve business services by continually improving essential processes,
invest in strategic technology, and achieve new efficiencies.
26
6. Enhancement of the District’s enterprise geographic data• Deploy ArcGIS Pro for 3D analysis• Standardization of District asset data and collection process• Migrate Geographic Information System (GIS) data structure from geometric network to
utility network• Evaluate the use of Drone2Map technology for asset, field inspections, and condition assessment
7. Enhance District maintenance and program standards• Evaluate the efficiency and effectiveness of the District’s valve exercise preventative
maintenance including proposed recommendations• Analyze electric energy savings programs as they become available• Evaluate the impacts as a result of recent and upcoming regulatory changes including but
not limited to Air Pollution Control District (APCD), State Water Resource Control Board(SWRCB), Occupational Safety and Health Administration (OSHA), etc.
• Evaluate the effectiveness of various methods to reduce nitrification events
INTE
RN
AL
BUSI
NES
S PR
OC
ESSE
S
Improve business services by continually improving essential processes,
invest in strategic technology, and achieve new efficiencies.
27
8. Enhancement of contracting and facility services• Streamline contract and purchase order (contract) management and lifecycle• Enhance Customer and Public Service security in public lobby areas• Evaluate feasibility of incorporating electric and hybrid vehicles into District fleet
9. Enhancement of District’s confined space program• Automate confined space regulatory and work forms (electronic conversion), add confined
space data layer in the District’s enterprise GIS system and use data to electronicallyautomate the District’s confined space inventory
10. Optimize District’s Hazardous Waste Operations and Emergency Response (HAZWOP)and Confined Space Emergency Response Team• Certify at Industry State Level and under the Incident Command System, streamline
chlorine gas and confined space rescue training, operations, response and areas ofresponsibility and convert to inventory lists and equipment logs to electronic form
INTE
RN
AL
BUSI
NES
S PR
OC
ESSE
S
Improve business services by continually improving essential processes,
invest in strategic technology, and achieve new efficiencies.
28
Goals, Strategies, and ObjectivesBalanced Scorecard Perspective: Learning & Growth
Provide hands-on leadership, support, and empowerment of staff, in order to maintain an accountable high-performing workforce.
1. Enhance leadership and employee training programs, and knowledge transfer process• Continue development of leadership and District-wide training programs• Review and enhance knowledge transfer process to ensure retention of District knowledge
CIP Project Expenditures vs. Budget Sewer Rate Ranking
Construction Change Order Incidence Water Rate Ranking
O&M Cost per Account Debt Coverage Ratio
Billing Accuracy Reserve Levels
Overtime Percentage Injury Incident Rate
33
Accounts per Full-Time Employee (FTE) Distribution System Loss
Percent of Customers Paying Bills
Electronically
Direct Cost of Treatment per MGD
Planned Recycled Water Maintenance
Ratio in $
Leak Detection Program
Planned Potable Water Maintenance
Ratio in $ 34
INTERNAL BUSINESS PROCESSES
Enterprise System Availability
Mark-out Accuracy
Project Closeout Time
Recycled Water Shutdown Testing
System Valve Exercising Program
Annual Recycled Water Site
Inspections
Percentage of Preventative Maintenance
Completed – Fleet Maintenance
Percentage of Preventative Maintenance
Completed – Reclamation Plant
Percentage of Preventative Maintenance
Completed – Pump/Electric
35
INTERNAL BUSINESS PROCESSES
Potable Water Distribution System Integrity Emergency Facility Power Testing
Potable Water Compliance Rate Potable Tank Inspection and Cleaning
Recycled Water System Integrity Main Flushing and Hydrant Maintenance
Sewer Overflow Rate Critical Valve Exercising
36
Employee Voluntary Turnover Rate
Training Hours per Employee
Safety Training Program
37
BUDGET HIGHLIGHTS
(JOE BEACHEM)
38
RATE MODEL AND BUDGET PROCESS
6-YearRate Model
Year-end Balances
Operating Budget Input
6-Year CIP Budget Input
MWD/CWA & City Sewer Rates
StrategicPlan
AssumptionsInterest Rates
InflationGrowthSales
Targets
Debt CoverageReserve Levels
Operating Budget
CIP Budget
Water &
Sewer Rates
State LegislativeMandates
39
BUDGET OBJECTIVES (FISCAL YEAR 2019)
Maintain the debt coverage target of 150% for water
Obtain a debt coverage ratio of 125% for sewer by 2020
Fund the $108.0 million Operating Budget
Minimize rate impacts of supplier cost increases
Rate setting built on reasonable projections
Fund the $92.8 million 6-year capital budget
Maintain reserves at or above target
Maintain water and sewer rate positions relative to other
agencies in the region 40
DEBT COVERAGE RATIOS WATER
310.0%
295.0%
260.0% 256.0%
238.0%246.0%
216% 211%
194% 189% 186%192%
125%
100.0%
150.0%
200.0%
250.0%
300.0%
350.0%
2019 2020 2021 2022 2023 2024
Minimum Debt Ratio without Growth
Debt Ratio with Growth
Debt Ratio without Growth
Minimum with Growth Debt Ratio
41
DEBT COVERAGE RATIOSSEWER
196%
170%
209%
231%
125%
1
1.2
1.4
1.6
1.8
2
2.2
2.4
2019 2020 2021 2022 2023 2024
Debt Ratio Minimum Debt Ratio
Debt Ratio*
Minimum Debt Ratio
* There is no proposed growth for sewer; therefore, the “with growth” and “without growth” debt ratio are
the same
42
INTER-FUND TRANSFERSPotable
Designated Expansion to Designated Betterment $ 2,196,000
Designated Replacement to General Fund Reserve 4,423,100
Designated Expansion to General Fund Reserve 1,254,000
Recycled
Designated Replacement to Designated Betterment 28,200
Designated Replacement to Designated Expansion 94,800
General Fund Reserve to Designated Expansion 1,443,900
Sewer
Designated Replacement to Designated Betterment 438,000
General Fund Reserve to Designated Betterment 1,084,200
Total Transfers $ 10,962,200 43
NET OPERATING REVENUETRANSFERS
Water Sewer Total
Expansion Reserve 2,712,100 - 2,712,100
Replacement Reserve 12,489,600 289,000 12,761,600
Transfer to OPEB 941,200 39,600 980,800
Transfer to New Supply Fund 75,000 - 75,000
Total Reserve Funding $ 16,217,900 $ 328,600 $16,546,500
44
OPERATING BUDGET HIGHLIGHTS
ITEMS HOLDING DOWN RATES
FY2019 potable sales volume increasing 14.8% versus FY2018
budget (1.0% versus FY2018 projection)
Decrease in 6-year CIP $9.1 million
Pio Pico funding of approximately $235,000
45
OPERATING BUDGET HIGHLIGHTS
ITEMS PUTTING UPWARD PRESSURE ON RATES
CWA rate related effective rate increases of $800,000 million or 1.7%
Labor and benefit costs increase of $589,800 or 2.7%
Increase in insurance costs of $235,000 or 36%
Increase in legal fees of $145,000 or 31%
Power cost increase of $136,800 or 4.5% vs FY 2018 budget and
5.0% vs FY 2018 projection46
POTABLE AND RECYCLED BUDGET HIGHLIGHTS
3.2% proposed average rate increase
Average residential customer monthly volume is increasing from 12
to 13 units
Average residential customer using 13 units will see a $2.23
increase in their monthly bill beginning January 1, 2019
$81.6 million CIP over six years
$30 million proposed debt issuance in FY 2019
Reserves and debt coverage on target
47
LAST YEAR VS. THIS YEAR - WATER
Projected Water Rate Increase
2018 2019 2020 2021 2022 2023 2024
FY18 0.0% 4.0% 4.0% 4.0% 4.0% 4.0%
FY19 3.2% 3.2% 3.2% 3.2% 3.2% 3.2%
Debt Coverage Ratio (No Growth)
2018 2019 2020 2021 2022 2023 2024
FY18 195% 170% 178% 184% 188% 193%
FY19 212% 207% 190% 184% 181% 187%
48
SEWER BUDGET HIGHLIGHTS
A residential customer with a winter average of 12.6 units in both years
will see a $3.01 decrease in their monthly bill beginning January 1, 2019:
33% Increase in residential winter average (9.5 to 12.6)
7.0% rate decrease
4.6% overall annual increases in revenue dollars needed in FY 2019 through
FY 2024
Decrease in Metro sewer costs of ($195,200) or (23.8%) for FY2019
$11.2 million CIP over six years
Sewer will seek $5.0 million debt issuance in FY 2020
Reserves on target49
LAST YEAR VS. THIS YEAR - SEWER
Projected Sewer Rate Increase
2018 2019 2020 2021 2022 2023 2024
FY18 7.5% 7.5% 7.5% 2.0% 2.0% 2.0%
FY19 (7.0%) 4.6% 4.6% 4.6% 4.6% 4.6%
Debt Coverage Ratio (No Growth)
2018 2019 2020 2021 2022 2023 2024
FY18 N/A N/A 125% 144% 279% 250%
FY19 N/A 194% 168% 208% 230%
50
Preliminary Survey of Member Agency Water Rates
51
Preliminary Sewer Rate Comparison
52
CAPITAL IMPROVEMENT PROGRAMFY 2019-2024(ROD POSADA)
53
GROWTH PROJECTIONS1
FISCAL YEARS
2019 2020 2021 2022 2023 2024
Single-Family Dwelling
Units700 600 600 600 500 500
Condominium Units 520 480 400 320 240 240
Apartment Units 780 720 600 480 360 360
Non-Residential2
(Permit valuation in millions of
dollars)
$21.9 $21.9 $21.9 $21.9 $21.9 $21.9
1Source: The Xpera Group’s report March 23, 2018 (all dwelling units reflected above do not have a one-to-one ratio
with an EDU and are converted to EDUs for budget purposes)2 Source: The Xpera Group’s report March 23, 2018 Non-Residential Permit Valuations (Historic and Projected) Otay
Water District and San Diego County 2002-2024 54
METER SALES AND GROWTH
55
925 EDU’s (Projected FY 2019)
950 EDU’s (Projected FY 2018)
CIP BUDGET GUIDELINES
Growth is expected to continue for FY 2019
New development with multi-family in greater proportion to
single-family dwellings
In preparing the budgets for the individual CIP projects, the
Engineering Department used current construction and bidding
data to adjust costs for each project
Reprioritized projects based on District’s planning documents
and Water Supply Assessment and Verification reports
56
CIP SIX-YEAR BUDGET LOOK FORWARD($ MILLIONS)
FY 2018
FY 2018 FY 2019 FY 2020 FY 2021 FY 2022 FY 2023
Totals $ 20.0 $ 25.8 $ 14.2 $ 15.1 $ 15.0 $ 12.2
Six-Year Total: $102.3
FY 2019 FY 2020 FY 2021 FY 2022 FY 2023 FY 2024
Totals $ 24.2 $ 18.4 $ 13.6 $ 10.7 $12.4 $13.5
Six-Year Total: $92.8
FY 2019
57
CIP Six-Year Budget DifferencesFY 2018 vs. FY 2019 $ Millions (Negative Value)
FY 2018 6-year CIP Budget $ 102.3
FY 2018 Budget Adjustments 1.5
Change in 6-year time period:
FY 2018 CIP Spending ( 20.1)
FY 2019 New Projects 10.5
Projects with Increases: 3.3
Projects with Decreases: ( 4.7)
FY 2019 Six-Year CIP Budget $ 92.8
58
County of San Diego pavement restoration requirements are
increasing project costs (approx. $8,000 in FY 2018)
City of Chula Vista Utility Permit fees have increased 15%
Certified Unified Program Agency (CUPA) Program fees for
hazardous material permits the County of San Diego bills the
District have increased almost 18% from the previous year
(approx. $2,000 in FY 2018)
Air Pollution Control District fees for emissions and permit renewal
fees have increased approximately 20% from the previous year
(approx. $5,000 in FY 2018)
Increase of approximately $15,000 over previous year
Increase in Permit Fees
59
High Profile CIP ProjectsFiscal Year 2019 ($ Millions)
870-2 PS Replacement $ 7.9
Campo Road Sewer Replacement 4.0
711-3 Reservoir Cover / Liner Replacement 2.0
AMR Change Out 2.0
Hidden Mesa / Vista Vereda Pipeline Replacement 1.5
803-2 Reservoir Interior / Exterior Coating 0.8
Total Expenditure Projection $ 18.2
% of Total FY 2019 Budget 75%
60
High Profile CIP ProjectsFiscal Year 2019 – 2024 CIP ($ Millions)
870-2 PS Replacement $ 12.7
711-2 PS (711-1 PS Replacement) 10.0
Various Waterline Replacements (11 Total) 12.0
Reservoir Improvements
Sewer Basin Improvements
AMR
8.8
3.9
3.4
Total Expenditure Projection% of Total FY 2019 - 2024 Budget
$ 50.8
55%
61
BALANCED OPERATING BUDGET(KEVIN KOEPPEN)
62
FY 2019 OPERATING BUDGET
Budget Process
Budget Details
Revenues and Expense Highlights
Conclusion
63
BUDGET PROCESS
Strategic plan objectives set the overall direction for the budgeting effort
Each department submits a current year expenditure projection
Each department submits budget requests assessing actual needs of the District
Review of all Operating and CIP Budget requests with Chiefs and General Manager
Review and incorporate reasonable assumptions on sales, growth, interest rates, and price inflators
Evaluate cost-saving measures and make adjustments where prudent
Recommend rates that support strategic plan initiatives, CIP, and operational needs
64
WATER SUMMARY
Potable sales projections for FY 2019 are based on FY 2018 projections
plus 1% growth
Recycled sales projections for FY 2019 are based on FY 2018 projections
plus 1% growth, less Salt Creek recycled water volume (6.25%)
Growth rates for FY 2019 through FY 2024 were developed using the
Total $ 2,955,430 $ 2,869,400 $ 2,922,600 $ 53,200 1.9%
73
OTHER REVENUES
Tax revenues increase of $81,400 or 1.9%
Capacity fee revenues increase of $140,500 or 9.3%
Non-operating revenues decrease of ($109,300) or (5.0%)
74
SEWER RATE IMPLEMENTATION COST OF SERVICE
Recommended changes to rates
based on Cost of Service Study to
be effective for billings beginning
January 1, 2019:
No changes in rate structure
218 Notice mailing July/August
timeframe
218 Hearing tentatively scheduled
for October 4, 2018
5 12.6 18Units Units Units
Current RatesVariable Bill $11.77 $29.43 $42.38Fixed Bill $17.08 $17.08 $17.08Total Current $28.85 $46.51 $59.46
Proposed Rates:Variable Bill $11.35 $28.60 $40.85Fixed Bill $14.91 $14.91 $14.91Total Proposed $26.26 $43.51 $55.76
Increase (Decrease) ($2.60) ($3.01) ($3.70)
Residential Average Monthly Bill
75
POWER COSTS
Power cost increase of $136,800 or 4.5% vs FY 2018 budget
and 5.0% vs FY 2018 projection
Compared to FY 2018 projection, water demand increase
of 1.0% for potable and 1.0% for recycled
In FY 2018 the rate per kilowatt hour increased 5%
In FY 2019 an additional 5.0% power rate increase 72
76
STAFFING HIGHLIGHTS
(ADOLFO SEGURA)
77
STAFFING HIGHLIGHTS
Process
The Senior Team and Section Managers continuously analyzeworkload requirements, opportunities for automation, and areaswhere we can effectively share or reallocate resources
Total Expenditures $95,486,000 $9,434,300 $3,070,000 $107,991,100
Balanced budget which meets the water and sewer needs of our customers and
supports the Strategic Plan
95
CONCLUSION - REQUESTING THAT THE BOARD:
Adopt resolution no. 4345 to approve the FY 2018-2019 operating and capital budget
Approve fund transfers for potable, recycled, and sewer
Approve the water rate changes and adopt Ordinance No. 567 to amend the Code of
Ordinances, including Appendix A, with the proposed 3.2% water rate increase on all
billings that begin January 1, 2019
Adopt the Salary Schedule pursuant to CA code of regulations 570.5 (CalPERS
enforced)
Provide direction to draft and mail water rate increase notices
Provide direction to draft and mail Proposition 218 hearing notices for recommended
sewer rate changes
96
QUESTIONS?
97
10911 Technology Place San Diego CA 92127
858-436-7770
Economic Outlook Update Otay Water District San Diego County
Prepared for
Otay Water District
March 2018
Dianea
Typewritten Text
Attachment E
Dianea
Typewritten Text
Dianea
Typewritten Text
Dianea
Typewritten Text
Dianea
Typewritten Text
Dianea
Typewritten Text
Dianea
Typewritten Text
Page 2 of 83
March 23, 2018 Mr. Mark Watton General Manager Otay Water District 2554 Sweetwater Springs Blvd. San Diego CA 91978 RE: Economic Outlook Update, Otay Water District Dear Mr. Watton: Xpera Group has been retained to prepare an economic outlook update for the Otay Water District. The outlook includes an economic and demographic analysis of the national and local economy and then focuses on the changes in population, residential and commercial development within the Otay Water District service area. We stand ready to respond to your inquiries about the study and its findings. Sincerely yours,
Alan N. Nevin Director, Economic Research Xpera Group
Page 3 of 83
Introduction: Economic Outlook Update Otay Water District Service Area
Xpera Group has undertaken and now completed an update of the Economic Outlook Study for both San Diego County and the area served by the Otay Water District (“OWD”). In this report, we concentrate on the changing demographics in the Nation, California and San Diego County and the projected residential and commercial development within the County and the OWD service area. The OWD services most of Chula Vista east of I-805 and the Otay Mesa area. The service area covers 125 square miles and services more than 50,000 customers.
Page 4 of 83
In last year’s report, we noted evidence of strong future development in the OWD service area. We have now updated this information to 2018 in order to project outward to fiscal year 2023/2024. This report is segmented into seven sections: ➢ Section 1: The National Economy
➢ Section 2: The California Economy
➢ Section 3: The San Diego County Economy
➢ Section 4: San Diego County Housing Market
➢ Section 5: Future of South County
➢ Section 6: Future Residential Development – OWD Jurisdiction
➢ Section 7: Projections for OWD Development Activity 2018-2024 Although the results, conclusions and recommendations contained within this consultant’s report are based upon a thorough review and analysis of current competitive market conditions and the expertise of the author, Consultant does not in any way represent, warrant or guarantee that any reported results will be achieved as a result of various reasons, including but not limited to the sensitivity to ever-fluctuating market conditions and the efficiency of a Client and its representatives, agent, employees, successors and assigns.
Page 5 of 83
Table of Contents
Section Page Section 1: The National Economy 6
Section 2: The California Economy 22
Section 3: The San Diego County Economy 30
Section 4: San Diego County Housing Market 40
Section 5: Future of South County 46
Section 6: Future Residential Development – OWD Jurisdiction 54
Section 7: Projections for OWD Development Activity 2018-2024 65
Appendix 69
Page 6 of 83
Section 1: The National Economy
As we move into calendar year 2018, it is interesting to note that the Nation is now in its 10th year of recovery, after a lengthy and devastating recession. Looking back ten years, the economy was in a weakened position: ➢ Crude oil was $145 per barrel; ➢ 30-year mortgages were at 6.0%; ➢ The unemployment rate was 7.2% and climbing; ➢ Lehman Brothers and Bear Stearns had collapsed; ➢ Construction jobs had declined by 20%, losing 115,000 jobs per
month; and ➢ U.S. resale home prices had declined 13% from their 3rd quarter
2006 peak. Gradually, over the past decade, the economy has strengthened and has experienced more than 100 continuous months of expansion. 1-1 The Path of the GDP Despite the continuous growth, it is notable that the gross domestic product has not risen to the levels of past recoveries. In virtually all modern recoveries, the Nation has expanded by 5.0% +/-. To date, in this recovery, the GDP has only reached the 3.5-3.7% expansion level.
Page 7 of 83
The GDP is comprised of two factors: first, the expansion in the total dollars produced in goods and services and second, inflation. Inflation has been the primary culprit in keeping the GDP increase from reaching previous levels. Inflation has continued to be in the 2.0% range nationally, perhaps the lowest peacetime rates in modern history.
Page 8 of 83
1.2 U.S Population Trends The U.S. continues to expand its population and economy. The population expansion is perhaps the most important element in the expansion of the Nation. For an industrialized Nation to expand on a continuing basis, it is necessary to continue to add population. From a basic demographic standpoint, it is necessary to have 2.0 children per every mother and father. If a Nation falls below that level, it faces a long-term stagnation of its economy. We in the United States are solidly in the 2.0 range which places us among the population leaders in the industrialized world. Looking out a few decades, we can see that many of the major Nations are experiencing only minor population growth and in several cases, decline.
Page 9 of 83
The United States continues to gain population at a pace of 2.0-2.5 million annually, both recently and projected well into the future.
Population 2010 2050 Change % Change
Annual
Change
United States 308,700,000 422,600,000 113,900,000 36.9% 3,796,667
Japan 128,100,000 95,200,000 (32,900,000) -25.7% (1,096,667)
Source: United Nations Population Division
Population Projections
Major Industrialized Countries
2010-2050
Page 10 of 83
The millennial population is driving the gains in population and that includes millennials. Millennials, by Census Bureau definition, are persons 18-34 years of age. They are the persons with a very high propensity to spend and do form the basis for the current rise in automobile, housing, household goods and away-from-home eating and dining. The millennial population is as the heart of the rising economy.
Page 11 of 83
There has been a major change in the lifestyle of millennials as they are staying in school later and marrying later and having children later. Still, millennials do get married and eventually have children. A recent Pew Research study notes: ➢ 80% of women with professional degrees or doctorates have a
child by the time they are 44, compared with 65% two decades ago.
➢ 55% of never married women ages 40 to 44 have at least one
child, up from 31% two decades ago; and In 1975, 57.0% of millennials at that point of time were living with their spouses; now only a quarter of them are living with spouses.
Page 12 of 83
Now 31% of millennials are living with their parents. There is a major difference in the percent of millennials living at home in high cost vs. low cost states.
In high cost states, 40% of millennials still live with their parents compared to 20% in low cost states. Obviously, at some point, most will move out of their parents’ houses, but it’s a gradual process.
Category 1975 2016
Spouse 57.0% 27.0%
Parents' Home 26.0% 31.0%
Alone 3.1% 8.0%
Other 13.9% 34.0%
Total 100.0% 100.0%
Source: U.S.Census
Where Millennials Live
United States
1975 and 2016
Page 13 of 83
There is a strong correlation between home prices and household income levels. Those metropolitan areas with strong incomes (including dual income households) also have high housing prices, as shown here for both sale and rental housing:
High Cost States %
New Jersey 47%
Connecticut 42%
New York 41%
Maryland 39%
California 38%
Low Cost States %
North Dakota 14%
South Dakota 20%
Wyoming 21%
Montana 23%
Iowa 23%
Source: U.S. Census
% of Millennials Living in Parents' Home
Low Cost/High Cost States
2015
Page 14 of 83
Page 15 of 83
1.3 U.S. Employment Trends Since the bottom of the decline in 2009, the Nation has added more than 16.0 million jobs, a pace of more than 2.0 million annually. Although the rate of gain has slowed somewhat recently, the Nation continues to add between 175,000 to 200,000 jobs monthly.
As a result of job increases, the unemployment rate has plummeted and today stands at approximately 4.0% nationally. Inevitably there will be another recession in our future, but we project that the 4.0% unemployment level with persist another 2-3 years before the market turns softer. The current up cycle, now in its 9th year, is highly unusual and most probably unsustainable.
Page 16 of 83
One of the key reasons why the unemployment rate has declined is that labor force participation rate has been on a sharp declining path since the recession. There is some indication that as employers are scampering for new labor, and wages rise, the participation rate will increase.
Page 17 of 83
Those returning to the labor force are most often persons over 50 who may have been retired from other jobs and for several reasons return to the work force. They include persons who realize they do not have enough funds set aside to retire; persons who are bored; persons who have moved to new metropolitan areas and want to get involved in the community. Also, there are those who realize that their current skill levels are not as advanced as they need to be to earn a decent income; return to school and prepare for a new career. Economic Drivers In typical economic recoveries, construction and manufacturing lead the way. As these two industries have a strong multiplier effect, their impact is substantial. In this recovery, construction and manufacturing jobs have not been at the forefront. This time, professional and business services and leisure and hospitality lead the way.
1.4 IRS Collections Yet another way to assess the economic recovery of the Nation is to look at individual income tax collections.
Since 2010, collections have increased by an average of more than 9.0% annually.
1.5 Residential Construction
The residential construction industry began its recovery from the recession in 2012. Since then, there has been a steady advancement in both single-family and multi-family production. Multi-family includes both condominiums and rental housing. 2017 marked the strongest year since 2012 and we project that 2018 will outpace 2017. In 2018, the total U.S. permit count should reach the 1,300,000 level.
Page 19 of 83
1.6 Non-Residential Construction A major component of the construction industry is the non-
residential sector which includes both private and public spending. Since 2010, there has been a steady rise in spending in this sector and 2017 should be the strongest year since 2010.
Year SFD MF Total % MF
2008 575 330 905 36%
2009 441 142 583 24%
2010 447 157 604 26%
2011 418 206 624 33%
2012 518 311 829 38%
2013 620 370 990 37%
2014 640 412 1052 39%
2015 696 487 1183 41%
2016 750 456 1206 38%
2017 842 435 1277 34%
2018 (f) 900 450 1350 33%
Source: U.S. Census; forecast by Xpera Group
Residential Construction (000)
United States
2008-2017
Page 20 of 83
1.7 Forecast of the U.S. Economy: 2018-2020 It would be presumptuous of us to look beyond the 2020 elections
in terms of the economic future of the Nation, but we will summarize here, in bulletpoint fashion, our national outlook for the next three years:
➢ The population will continue to increase by more than 2.0
milllion annually; ➢ Employment will continue to expand at a pace of 2.0-2.25
million jobs annually; ➢ The unemployment rate will remain in the 4.0-4.5% range;
➢ 30-year mortgage rates will remain in the 4.0-5.0% range;
➢ Oil prices per barrel will remain in the $50-60 range;
➢ Construction will continue to strengthen, reaching an output
of 1.3-1.4 million residential units, as millennials increase family formations;
Year ($millions) Index
2010 259,162 1.00
2011 280,259 1.08
2012 303,499 1.17
2013 339,647 1.31
2014 364,201 1.41
2015 391,701 1.51
2016 448,388 1.73
2017r 455,000 1.76
Source: Census Bureau
Value: Private Nonresidential
Construction Put in Place
United States
2010-2017
Page 21 of 83
➢ Our projections for residential construction will be affected by the volume of replacement from natural disasters and the changes to the financing of affordable rental housing; and
➢ The non-residential construction market will continue to
expand thanks to major increases in infrastructure and military spending.
Page 22 of 83
Section 2: The California Economy
In this section, we discuss the overall economy of the state of
California, including population, employment and housing. Arguably, California is the 6th largest “nation” in the world in terms
of GDP, just barely trailing the United Kingdom. It is possible that by 2020, California would be in 5th place.
2.1 Population of California
In Alan Nevin’s book “The Great Divide” the nation is segmented into two types of states: growth and non-growth. The 15 growth states account for 75% of all the population growth in the Nation
Placement Nation $Billions
1 United States 18,500$
2 China 11,215$
3 Japan 4,939$
4 Germany 3,467$
5 United Kingdom 2,629$
6 California 2,603$
Source: Int'l Monetary Fund; Ca. DOF
California's World Ranking2016 Gross Domestic Product
Page 23 of 83
And perhaps more important, for this report, is that California,
Texas and Florida accounted for almost half of the total population gains in the United States in the past year.
California continues to grow as a result of both natural household formation (more births than deaths) and in-migration from both within the U.S. and from foreign lands.
California had a net gain of 300,000 persons in the past year. In 2017, there were 220,000 persons added as a result of natural household formations. Then, there was a net immigration 80,000 (185,000 in and a net out domestic migration of 105,000).
The Great Divide
Page 24 of 83
By the end of 2018, California will have a population of 40,000,000. San Diego will have 8.0% of that total. 2.2 California Employment California now has 18.5 million jobs and is adding more than 300,000 jobs annually. The state is adding more jobs each year than population. The result is an unemployment rate in the 4.0-4.5% range.
Source: California Dept. of Finance, Demographics Division
Components of Change
California County Population Estimates and Components of Change
Revised July 1, 2016 and Preliminary July 1, 2017
Page 25 of 83
With the exception of manufacturing, which is nearing its 2008 figures, the other economic drivers of California are moving forward with strength, as shown here:
Page 26 of 83
Overall, the California economy is moving forward with great strength and vivacity. 2.3 The California Housing Market
It is obvious that California has a housing shortage, at least near the coast. One way to show the shortage is to compare the number of single family homes permitted with the population gain. In this exhibit, we show 11 of the fast-growing states, isolating the three west coast states (in pink). The three west coast states have the lowest ratio of building permits to population, indicating the housing imbalance.
Category 2008 2017 Change % Change
Construction 725,200 840,000 114,800 15.8%
Manufacturing 1,384,000 1,305,000 (79,000) -5.7%
Professional & Business Services 2,164,600 2,595,000 430,400 19.9%
The permitting activity in residential construction is strengthening in California, passing the 100,000-unit level in 2017 and anticipated to be in the 110,000-unit range in 2018. The last time the state passed the 100,000 level was 2007 (112,000 units).
State Pop.
Units
Permitted
% of
Permits % of Pop
Ratio
Permits to
Pop. Gain
SC 66,285 28,972 3.5% 3.8% 44%
NC 111,602 47,545 5.7% 6.4% 43%
GA 110,973 40,809 4.9% 6.4% 37%
Colo 91,726 28,019 3.4% 5.2% 31%
Texas 432,957 116,753 14.0% 24.8% 27%
Arizona 113,506 28,019 3.4% 6.5% 25%
Florida 367,525 85,633 10.2% 21.0% 23%
CA 256,077 58,053 6.9% 14.7% 23%
Wash 127,710 23,401 2.8% 7.3% 18%
Oregon 68,831 10,323 1.2% 3.9% 15%
Ratio of SFD Units Permitted to Population Gain
Selected States
2017
Page 28 of 83
The supply of new homes available for owner-occupancy has continued to be below demand levels as the owner-occupancy rate continues to decline and is among the lowest in the Nation. The National average is 64%.
Page 29 of 83
The prices of existing single-family homes has been on a steady climb throughout California. At year-end 2017, the average price was $549,800, an increase of 25.3% since 2013.
Year %
2008 57.3%
2009 57.0%
2010 56.1%
2011 55.3%
2012 54.5%
2013 54.3%
2014 54.2%
2015 54.3%
2016 53.8%
2017 n/a
Source: Census.gov
Home Ownership Rates
California
2008-2017
Year Price Change Change %
2013 438,790$ n/a n/a
2014 453,270$ 14,480$ 3.3%
2015 489,770$ 36,500$ 8.1%
2016 502,490$ 12,720$ 2.6%
2017 549,800$ 47,310$ 9.4%
2013-2017 111,010$ 25.3%
Source: California Association of Realtors
Single Family Home Prices (Existing)
California
2015-2017
Page 30 of 83
2.4 Non-Residential Construction
2017 was the strongest year for non-residential construction in modern history, totaling more than $29 billion. We anticipate that 2018 will better the 2017 total as a result of both military and infrastructure spending.
Page 31 of 83
Section 3: The San Diego County Economy
In this section, we discuss the population and employment
changes in San Diego County.
3.1 Population Change, San Diego County San Diego County remains one of the most dependable growth
metropolitan areas in the United States, although its growth rate is slowing down.
The past few years the rate of growth has slowed to the 20,000 to
26,000 population range. Its slowdown has been partially attributed to the rapid expansion of the Temecula/Murrieta housing market, whose home prices are substantially less than San Diego County and are drawing the San Diego population base northward.
Year Population Change
2010 3,101,036
2011 3,135,522 34,486
2012 3,173,442 37,920
2013 3,207,852 34,410
2014 3,247,475 39,623
2015 3,274,141 26,666
2016 3,295,816 21,675
2017 3,320,108 24,292
Change 2010-2017
No. 219,072
% 7.1%
Source: CA DOF
Change in Population
San Diego County2010-2017
Page 32 of 83
The population gains are a combination of natural household
formations and immigration. Over the past few years, as shown here, the natural increase has slowed down somewhat. Further, net domestic out-migration (many related to the southern Riverside County moderate priced housing availability) has increased but net out-migration has increased.
In the past five years, Murrieta and Temecula have increased
their population by 15,749, some portion of which relates to out-movement from San Diego County.
Total Population Change 2016-2017 Components of Change
Components of Population Change
San Diego County
2009-2017
Page 33 of 83
3.2 San Diego County Future Population Change Based on SANDAG’s most recent projections, the County will add
almost 30,000 persons annually over the next two decades, gaining more than 500,000 people in that timeframe. By 2035, SANDAG projects that the County population will reach more than 3.8 million.
City 2012 2017 Change
Murrieta 106,978 114,914 7,936
Temecula 103,211 111,024 7,813
Total 210,189 225,938 15,749
Source: CA Department of Finance
Changes in Population
Murrieta and Temecula
Riverside County
2012-2017
Year No.
2017 3,320,108
2035 3,853,698
Change 2017-2035 533,590
Annual Change 29,644
% Change 16.1%
Source: SANDAG
Population Projections
San Diego County
2017-2035
Page 34 of 83
Millennials will continue to drive the consumer economy, including
the housing market. SANDAG is projecting that the number of millennials will remain relatively constant over the next two decades, a highly positive economic situation for San Diego County.
A recent analysis of Census data by Jones Lang LaSalle indicates that San Diego County has the highest percentage of millennials of any of the major metropolitan areas in the Nation. The metropolitan areas shaded in light yellow are in the high growth states.
Age Group 2016 2035
18-19 94,625 103,488
20-24 268,684 279,283
25-29 282,105 262,591
30-34 252,922 251,167
Total 898,336 896,529
Total Population 3,288,612 3,853,698
Millennials as % of Pop. 27.3% 23.3%
Median Age 38.5 35.5
Source: SANDAG
The Change in the Millennial Population
San Diego County
2016-2035
Page 35 of 83
The high level of millennial growth relates to the types of high-paying jobs that have become available in these strong metropolitan areas. More than 36% of San Diegans (over age 25) have a bachelor’s degree or higher compared to 30% nationwide.
Rank Metro
Millenials as
% of Metro
Population
1 San Diego 27.6%
2 Chicago 27.3%
3 Philadelphia 26.5%
4 Houston 26.3%
5 Dallas 26.0%
6 Los Angeles 25.4%
7 New York 25.1%
8 San Antonio 24.0%
9 Phoenix 23.0%
10 San Jose 22.3%
Source: U.S. Census, JLL
Millenial Rankings
Major Metropolitan Areas
United States
2017
Page 36 of 83
3.3. Employment and Economic Situation San Diego County continues to be one of the strongest and dependable metropolitan areas in the Nation as a result of its highly diversified employment base. In the past six years, the County has averaged 33,720 new civilian jobs annually, almost matching the population gain. The result of this situation is that the civilian unemployment rate has dipped below 4.0%. If the statistics included the military (115,000 in uniform, 100% of whom are employed), the unemployment rate would be still lower.
SD Co. U.S.
Level % %
High School or Higher 86.4% 87.0%
Bachelor's degree or Higher 36.5% 30.3%
Note: persons over age 25
Source: Census Bureau
Levels of Education
San Diego County & U.S.
2016
Page 37 of 83
In 2017, the County added 28,600 jobs, modestly below the average of the past six years, but still evidence of a strong economy.
Year Employment Change
2012 1,284,600 n/a
2013 1,317,700 33,100
2014 1,346,600 28,900
2015 1,386,800 40,200
2016 1,424,600 37,800
2017 1,453,200 28,600
Average 33,720
Source: CA EDD
Total All Industry Employment
San Diego County
2012-2017
Page 38 of 83
Local economies expand as a result of the growth in economic drivers. An economic driver is an industry whose source of revenue is mostly from outside the metropolitan area. Most metropolitan areas have, at best, two or three economic drivers. San Diego is most fortunate to have eight basic economic drivers as shown below. Unquestionably, the military continues to dominate and accounts for as much as 25% of the total gross domestic product. But the other seven are also meaningful to the economy and, for the most part, continue to expand.
Page 39 of 83
Although not technically an economic driver, we want to include the construction sector because of its economic impact and a rapid return to health. Since 2012, the construction sector has increased jobs by 42%. The construction industry is also highly important because of its multiplier factor. For every dollar spent in construction, more than twice that ripples through the local economy. Few industries can boast of that multiplier. 3.4 Income of the Population The IRS data file contains voluminous information on their revenue sources. Unfortunately, at the County level, data is only available through 2015. We analyzed the change in wage and salary and business and professional income on tax returns from 2011 to 2015 in San Diego County.
Category 2012 2017 Change % Change
Professional & Business Services 218,100 236,000.0 17,900.0 8.2%
College & Universities 14,400.0 16,700.0 2,300.0 16.0%
State Government 42,600.0 50,300.0 7,700.0 18.1%
Dept of Defense (civilian) 22,100.0 22,300.0 200.0 0.9%
Federal Government (non-defense) 24,700.0 23,900.0 (800.0) -3.2%
Total 608,600 677,200 68,600 11.3%
Construction 58.4 83.0 24.6 42.1%
Source: Bureau of Labor Statistics; California EDD
Economic Drivers
San Diego County
2012-2017
Page 40 of 83
In the 2011-2015 timeframe, total wage and salary income increased 20.1% while business and professional income increased 33.4%. Perhaps as interesting is the massive increase in the number of returns reporting over $200,000 in income. In the 2011-2015 period, the number of wage and salary returns reporting more than $200,000 in income increased 45.7% and business and professional returns increased 44.2%. We note these figures as an indication of the economic health of the County.
Year 2011 2015 Change % Change
Wage & Salary
No. Returns 1,207,313 1,275,560 68,247 5.7%
Total ($000) 67,334,610 80,884,883 13,550,273 20.1%
Business & Prof.
No. Returns 250,398 276,960 26,562 10.6%
Total ($000) 3,585,964 4,784,081 1,198,117 33.4%
Wage & Salary
No. Returns 54,020 78,730 24,710 45.7%
Total ($000) 15,592,453 23,846,258 8,253,805 52.9%
Business & Prof.
No. Returns 15,258 22,000 6,742 44.2%
Total ($000) 1,005,917 1,384,837 378,920 37.7%
% over $200,000
Wage & Salary 4% 6%
Business & Prof. 6% 8%
Source: IRS (2015 is latest data released at county level)
Returns over $200,000
Change in Income
San Diego County
2011-2015
Wage & Salary and Business & Professional
Total Returns
Page 41 of 83
3.5 Non-Residential Construction Indicative of the strength of the economy is the expansion of the non-residential construction activity. The County total was typically in the $4.0+ billion annual range from 2000 to 2006 and then fell dramatically during the recession. The low point was 2010 when the total was $1.463 billion. Since then there has been a gradual recovery and since 2014 the County non-residential construction activity once again reached the $4.0+ level. It is notable that almost half of the total non-residential construction activity is for renovations and alternations rather than ground-up construction.
Year Office Retail Industrial Total
2000-2006 179$ 150$ 137$ 4,637$
2006-2012 133$ 71$ 56$ 2,555$
2013-2015 168$ 152$ 36$ 3,700$
2016 54$ 142$ 18$ 4,255$
2017 (1) 8$ 164$ 90$ 4,500$
(1) Based on Jan-June 2017 Permit Activity
Source: Construction Industry Research Board
Non-Residential Permit Valuations ($millions)
San Diego County
2000-2017 (P)
San Diego County
Page 42 of 83
Section 4: The San Diego County Housing Market
In this section, we discuss the current and future state of the San Diego County housing market. 4.1 Composition of the Housing Inventory The inventory of the County housing market consists of 1,124,430 units, half of them detached; 16.4% condominiums; 30.8% apartments and 2.3% mobile homes.
4.2 Recent and Current Housing Construction After a dismal decade of limited housing production, residential construction is moving forward. The permit count is still driven by the
Type No. Units %
Single Family Detached 567,260 50.4%
Condominiums 184,820 16.4%
Apartments 346,455 30.8%
Mobile Homes et al 25,895 2.3%
0.0%
Total 1,124,430 100.0%
Source: SD County Assessor
Current Housing Units
San Diego County
2017
Page 43 of 83
multi-family segment, but we anticipate that the single-family sector (including low density attached housing – duplexes and townhomes) will blossom in 2018. It is notable that the production of single family units expanded substantially in 2017 compared to 2016.
The multi-family component in 2017 was almost entirely rental apartments, with the majority of them in downtown San Diego. The unusually large number of rental units being built downtown resulted from multiple land purchases 2-3 years ago by major national apartment builders like Trammel Crow, Alliance, Streetlights, Lennar and Greystar. It is highly probable that they did not realize that they would all break ground near-simultaneously. In 2018, there will be more than 4,000 units completed downtown. There were also several thousand units of affordable housing developed in the County in the past year. 4.3 Projections for Residential Construction
Year Total
Single
Family
Multi-
Family % MF
2010 3,494 2,270 1,224 35.0%
2011 5,370 2,245 3,125 58.2%
2012 5,687 2,198 3,489 61.4%
2013 8,264 2,565 5,699 69.0%
2014 6,871 2,478 4,393 63.9%
2015 9,893 3,253 6,640 67.1%
2016 10,666 2,341 8,325 78.1%
2017 10,415 4,058 6,357 61.0%
Source: Census Bureau
Residential Construction
San Diego County
2010-2017
Page 44 of 83
As we look out over the next few years, we foresee several changes occurring in the San Diego County housing market:
• As a result of a major increase in shovel-ready dirt, predominantly in south County and along Highway 78 in north county, there will be a substantial increase in overall production in the next few years;
• The multi-family category, which includes both sale and rental product, will experience a substantial increase in townhome-type for sale housing;
• Apartment construction, which has been in a boom mode the past three years, will slow down; and
• There will be a concerted countywide effort to encourage higher density in urban areas, particularly those within a 20-30 minute drive of downtown San Diego.
Based on calculations by SANDAG, San Diego County has a housing shortage of 100,000 housing units. Xpera Group is certain that there is a housing shortage, and it is possible that it is approaching 100,000 units, but even if 100,000 is an ebullient calculation, there is definitely a shortage, mostly of work force housing – sale and rental housing appropriate for the mainstream of San Diego households. The following exhibit documents our projections through fiscal year 2023-2024:
Page 45 of 83
The last year that the County permitted 10,000 units was 2006. The peak year was 18,000 units in 2003. 4.4 The Price of Housing The price of existing housing continues to escalate in San Diego County, both for detached and attached housing. At year-end 2017, the median price of a detached home was $612,750 and an attached home
Year Total
Single
Family
Multi-
Family % MF
2010 3,494 2,270 1,224 35.0%
2011 5,370 2,245 3,125 58.2%
2012 5,687 2,198 3,489 61.4%
2013 8,264 2,565 5,699 69.0%
2014 6,871 2,478 4,393 63.9%
2015 9,893 3,253 6,640 67.1%
2016 10,666 2,341 8,325 78.1%
2017 10,415 4,058 6,357 61.0%
2017-2018 11,500 6,000 5,500 47.8%
2018-2019 10,000 5,000 5,000 50.0%
2019-2020 10,000 5,500 4,500 45.0%
2020-2021 9,000 4,500 4,500 50.0%
2021-2022 9,000 4,500 4,500 50.0%
2022-2023 9,000 4,500 4,500 50.0%
2023-2024 9,000 4,500 4,500 50.0%
Source: Census Bureau 2010-2017; projections Xpera Group
Residential Construction Projections
San Diego County
FY 2017-2024
Projections in Fiscal Years
(including historic construction)
Page 46 of 83
$407,000. Since 2013, detached homes have risen in price by 7.0% annually and attached housing 10.0%
The level of demand for housing has caused a massive reduction in the inventory of available homes. In a stable market, there is traditionally a six-month inventory of homes on the market. In San Diego County, the inventory has fallen to two months.
Year Detached Attached
2013 479,690$ 294,000$
2017 612,750$ 407,000$
Change 133,060$ 113,000$
% Change 28% 38%
Annual % Change 7% 10%
Source: California Assoc. of Realtors
Median Home Prices
San Diego County
2013-2017
(Existing Units)
Page 47 of 83
Page 48 of 83
Section 5: The Future of South County
In Section 5, we look at the future of South County as an integral part of San Diego County. Section 5.1: Population and Housing in the OWD Service Area SANDAG has computed the population of the OWD Service Area in 2017 at 227,000, up from 206,878 in the 2010 Census. The increase has been relatively erratic in the 2010 to 2016 timeframe. In 2016, the total population gain was fewer than 1,000, according to SANDAG.
Year Population Change
2010 206,878 n/a
2011 208,275 1,397
2012 211,599 3,324
2013 215,519 3,920
2014 220,080 4,561
2015 222,764 2,684
2016 223,754 990
2017 (Est.) 227,000 3,246
Total Change 2010-
2016 16,876
Annual Change 2,411
Source: SANDAG
Population
Otay Water District Service Area
2010-2016
Page 49 of 83
5.2 Population and Residential Units in Chula Vista As Chula Vista is the largest city in south County and the OWD encompasses most of the City east of I-805, we think it appropriate to note the City’s growth pattern in recent years. In the exhibit below, the population growth pattern in the years 2000-2017 changed dramatically by time period. There was a major burst of population gain as a result of the housing boom of the early 2000’s. Since then, the annual increase per annum has steadily been reduced. In the 2010-2017 period, the annual increase in Chula Vista population was 3,619.
Currently, there are an estimated 83,400 residential units in Chula Vista, an increase of more than 20,000 units since 2000. As noted below, the rate of increase has slowed dramatically since 2005.
Year Population
Total
Increase
Annual
Increase
2000 181,613 n/a n/a
2005 224,006 42,393 8,479
2010 245,987 64,374 6,437
2017 271,323 25,336 3,619
Source: Ca Department of Finance
Population
City of Chula Vista
2000-2017
Page 50 of 83
In the timeframe of 2010 through 2015, residential units permitted in the City of Chula Vista averaged 640. In both 2016 and 2017, the permit count was over 1,000 units, but there was a major difference between the two years. In 2016, single family units accounted for only 8.0% of the total units permitted. This past year, 2017, more than half the units permitted were single family, due to the opening of new projects on the Otay Ranch.
Year Units
Total
Increase
Annual
Increase
2000 59,492 n/a n/a
2005 73,531 14,039 2,808
2010 79,416 19,924 1,992
2017 83,406 3,990 570
Source: Ca Department of Finance
Residential Units
City of Chula Vista
2000-2017
Year Total
Single
Family
Multi-
Family
2010 517 296 221
2011 728 394 334
2012 799 304 495
2013 630 269 361
2014 475 156 319
2015 689 89 600
2016 1,050 86 964
2017 1,044 534 510
Source: Census.gov; Dev. Services Dept., Chula Vista
Residential Building Permits
City of Chula Vista
2010-2017
Page 51 of 83
When the housing market was torrid in the early to mid-2000’s, Chula Vista’s housing production accounted for a substantial portion of the County output. For instance, in the 2004-2007 period, Chula Vista residential production accounted for 14.4% of the County output, compared to 8.6% in the 2014-2017 period. The 2004-2007 single family output was twice that as a percent of the County (15.9%/7.1%). With Otay Ranch in full production, it is highly likely that Chula Vista’s share of the County permit activity will increase substantially.
5.2 Home Prices – Otay Ranch The resale housing market in the Otay Ranch remains buoyant. In both 2016 and 2017, there were approximately 1,500 detached and attached resale units sold. Prices increased in all three Otay Ranch ZIP codes for both detached and attached housing.
5.3 Future Growth in south County Since our first OWD forecasts 7-8 years ago, there has been substantial commercial/residential activity in the OWD services areas and still much more to come. In the exhibit below, we have listed the projects that are in the pipeline or have been recently completed. Perhaps the most important of these is the substantial supply of residential shovel-ready land for both single family and multi-family housing. It is this supply that will result in a substantial increase in moderate priced housing in south County.
ZIP AREA 2016 2017 2016 2017 $ %
Detached
91913 West 469 409 539,000$ 565,000$ 26,000$ 4.8%
91914 North 204 179 688,000$ 725,000$ 37,000$ 5.4%
91915 South 335 295 525,000$ 580,000$ 55,000$ 10.5%
Attached
91913 West 288 299 332,500$ 365,000$ 32,500$ 9.8%
91914 North 66 66 357,500$ 390,000$ 32,500$ 9.1%
91915 South 205 236 375,000$ 405,000$ 30,000$ 8.0%
Sales 1,567 1,484
Change 2016-2017Sales Median Price
Home Prices (Existing Units)
Otay Ranch
2016-2017
Page 53 of 83
Major
Progress
since last
report
2017-
2020
2020-
2022
2022-
2024+Activity Category
X X Completion of SR-11 Transportation
X X
Cross Border Express with major plans for adjacent
properties. 1.8 MM crossings in 2017 Transportation
X X
Transfer of SR-125 to CalTrans; Major reduction in
toll fees Transportation
X X
Completion of Mesa de Otay II Port of Entry & Unified
Cargo Processing Program. Transportation
X X
26-mile South Bay Rapid Transit Bus Route under
way - serving the Otay Ranch area - $113 MM Transportation
X X
Widening of I-805 - one additional land in each
direction, under way Transportation
X X Shovel-Ready Dirt in ample supply Residences
X X
Initiation of Eastern Urban Center (Millenia)
development Residences
X X
Apex Power Group building $400 million Pio Pico
"peaker plant" on eastern edge of Chula Vista Employment
X X Sudberry shopping center groundbreaking in Millenia Retail
X X X X Substantial improvements in the San Ysidro crossing Transportation
X X X
Build-out of additional housing on Otay Ranch
(20,000+ units) Residences
X X X Build-out of housing on Otay Mesa Residences
X
Brown Field commercial traffic expansion; cargo
volume increase Transportation
X X Employment Growth along SR-125 and SR and 905 Employment
X
New Desalination Plant in Rosarita to Service Otay
Water District & Baja California Utilities
X X
Major residential development on the eastern side of
Tijuana (primarily Las Palmas) Residences
X X
Major commercial development on eastern side of
Tijuana Employment
X
Brown Field commercial traffic expansion; cargo
volume increase Transportation
X X Employment Growth along SR-125 and SR and 905 Employment
X Development of university campus on Otay Ranch Education
X
Development of major employment center on both
sides of SR11 (area has 4,000 acres, 40% of
County's developable employment land) Employment
X
Completion of 3 more interchanges on SR-125
Tollway Transportation
Proposed Planned Project Affecting
Otay Water District
South San Diego County
2017-2024
Time Span
Page 54 of 83
Aerial photographs of the substantial activity near the border appear below: The Otay Border
In addition to the projects noted above, there is substantial activity on the western side of Chula Vista, including the newly resuscitated 1,400 room hotel conference center on the Bayfront.
Page 55 of 83
Major
Progress
since last
report
2017-
2020
2020-
2022
2022-
2024+EVENT CATEGORY
X
Numerous multi-family rental
projects Residential
Bayfront mid-rises (Pacifica) Residential
X X X
RIDA hotel and conference center
(1,400 rooms) Hotels
X X
Bayfront retail, industrial, marina,
RV parks, etc. Commercial
Proposed Developments
Western Chula Vista
South San Diego County
2017-2024
Time Span
Page 56 of 83
Section 6: Future Development – OWD Service Area
In Section 6, we discuss the residential and commercial development that will take place in the Otay Ranch and in the Otay Mesa region that is served by the OWD.
6.1 Current Residential Development In 2016, there was virtually no residential development in the Otay Water District area. Since then, the area has exploded with new single family and multi-family development. At the current time, there are 19 single family projects actively selling and 16 multi-family projects, as well as several apartment developments. The single-family projects range in price from $594,373 to $628,899 or $232 to $250 per square foot. The multi-family housing sells for $389,810 to $453,591 or $342 to $273 per square foot. It is typical for multi-family housing to sell for more per square foot than single-family homes because of the marginal square footage differential. Of the 3,475 units that have been brought to market, 1,898 remain to be sold. There are currently only three completed unsold homes on the Otay Ranch. This exhibit contains only sale product.
Page 57 of 83
6.2 Future Residential Development Virtually all new residential construction in the OWD service area that will take place over the next few years will be in the greater Otay Ranch area. Most of that development will take place in the Millenia community and in Villages 2,3,8, 9 and 10.
Although it is difficult to project home sales and apartment construction going out seven or eight years, we have contacted the relevant landowners in the Otay Ranch community and have been able to prepare an exhibit that shows a total of more than 9,000 units that are anticipated to come on-line in that timeframe. Most of the future activity is anticipated to take place in 2018 through 2020. Note that Villages 8, 9 and 10 will ultimately have 11,000+ units, but only 2,112 units are anticipated to be developed in the 2017-2014 timeframe.
Page 59 of 83
The following exhibit displays the projected single family development activity at Otay Ranch:
Community Developer 2017 2018 2019 2020 2021 2022 2023 2024 Total
Planning Areas 16 & 19 Jackson Pendo - - - - 25 25 25 50 125
Total 406 700 404 307 602 575 575 150 3,719
Source: BIA, land owners, builders & City of Chula Vista
Projected Development Activity
Otay Ranch
2017-2024
Single Family
Page 60 of 83
In the 2017-2024 period, the unit mix is anticipated to be approximately 1/3rd single family and 2/3rd multi-family. The multi-family will be a mix of townhomes and vertical construction; for sale and for rent.
The multi-family development is shown here segmented into for sale and rental housing:
Community Developer 2017 2018 2019 2020 2021 2022 2023 2024 Total
Planning Areas 16 & 19 Jackson Pendo - - - - - - - - -
Total 767 1,388 2,069 734 576 185 176 - 5,895
Source: BIA, land owners, builders & City of Chula Vista
Projected Development Activity
Otay Ranch
2017-2024
Multi-Family (Sale and Rental)
Tenure 2017 2018 2019 2020 2021 2022 2023 2024 Total
For Sale 362 472 703 255 476 185 176 - 2,629
Rental 405 916 1,366 479 100 - - - 3,266
Total 767 1,388 2,069 734 576 185 176 - 5,895
% Sale 47% 34% 34% 35% 83% 100% 100% 0% 45%
% Rental 53% 66% 66% 65% 17% 0% 0% 0% 55%
Source: BIA, land owners, builders & City of Chula Vista
Summary: Projected Development Activity
Multi-Family (Sale and Rental)
Otay Ranch
2017-2024
Page 61 of 83
The projections for each of the communities can be found in the Appendix of this report.
In addition to the Otay Ranch components, there are other land masses that are anticipated to produce residential units in the 2017-2024 period. They are Salt Creek Golf Course community and Sunroad East Otay Mesa. The lessee of Salt Creek has defaulted on the lease so plans for development there are uncertain. Sunroad East is moving forward with its plan, but probably will not be underway until 2020 or 2021. There are three properties in the immediate vicinity of the OWD headquarters that will move forward with development in the near-term future: Sweetwater Vistas (Douglas Wilson Co.); Sweetwater Place (Mastercraft) and Sweetwater Village (Lennar). They total 433 units. We have also added 100 units annually for small developments which may take place within the Otay Water District. In total, in the 2017-2024 time-frame, we project a total of more than 12,000 units or on the order of 1,500-1,600 units annually, with the heaviest activity in 2018 and 2019.
Community Developer 2017 2018 2019 2020 2021 2022 2023 2024 Total
Total 1,273 2,188 2,673 1,392 1,428 1,493 1,351 650 12,448
Source: BIA, land owners, builders & City of Chula Vista
Total Residential Development Programs
Otay Water District Service Area
2017-2024
Page 62 of 83
6.2 Non-Residential Development There are several non-residential projects within the OWD service area that are planned for the near future that will result in demand for more water. Retail The sole retail project that is under construction is Sudberry’s new retail project in Millenia. That project, with 131,000 square feet, will contain four “big box” stores and adjacent in-line stores. There will be several smaller centers that will be built within the Otay Ranch as the Villages get built out, but none yet has been announced. Hotels There are several hotels that are anticipated to come on-line in the near-term future: The first two entries are Ayres with 135 rooms, now under construction, and a recently opened Residence Inn with 148 rooms, both near the 125 at Olympic Parkway. In total, there are almost 3,000 hotel rooms planned for south County, more than half of them on the Bayfront, including the 1,400-room RIDA hotel/conference center. Within the OWD service area, we count 775 rooms either under construction or in planning.
Page 63 of 83
Senior Housing Currently under construction is a 104-unit senior housing facility with 80 units of assisted living and 24 units for memory care patients. The developer is Douglas Wilson Company and Milestone Retirement Communities. It is scheduled for completion at year end 2018. Office Space Office space is not a major factor in the Chula Vista/Otay Mesa commercial market, totaling 3.1% of the San Diego office marketplace. The overall vacancy rate for office space there is 8.0%.
Hotel Location Rooms
Est. Date of
Completion
Hampton Inn Eastlake 104 2019
Homewood Suites Eastlake 91 2019
Ayres Millenia 135 2018
Residence Inn Olympic Pkway & 125 148 2017
Courtyard Olympic Pkway & 125 152 2020
RIDA Bayfront 1,450 2020-2022
RIDA Bayfront 550 2020-2022
Cross Border Express Otay Mesa 340 2020-2022
Total 2,970
Planned and Active Hotel Development
Chula Vista
as of January 2018
Page 64 of 83
The major office development that is actively planned is the “Millenia Office” – a project that could ultimately have more than 1.0 milliion square feet of space. The first project is 318,000 square feet of Class “A” space – awaits a major tenant before breaking ground. Chesnut Properties has recently announced that they will break ground in fall 2018. The project is by Chesnut Properties, a local firm that has substantial success in other parts of the County. Industrial Space Otay Mesa has more than 15.0 million square feet of industrial space, most of it “big boxes” utilized for storage/warehousing. The vacancy rate for industrial space in Otay Mesa is now 8.0%, one of the lowest rates for the area in many years.
Area Sq.Ft. Vacancy Rate
Otay Mesa 231,650 5%
Chula Vista 2,923,484 9%
Total OM/CV 3,155,134 8%
San Diego County 101,657,721 10%
OM/CV as % of SD Co. 3.1%
Source: Kidder Mathews
Office Space Market
Otay Mesa, Chula Vista & San Diego County
4th Quarter 2017
Page 65 of 83
The market is dominated by the Murphy Company which has developed industrial space there for several decades. Currently, the firm is developing the Brown Field Technology Park and is redeveloping the existing San Diego Business Park (once home to Sanyo). Rather than the traditional industrial space with one employee per 1,000 square feet, we anticipate that the Brown Field Technology Park space will be occupied by employment types that will be more labor intensive. The employment types we anticipate will be more service oriented and have as many as two persons per 1,000 square feet.
Area Sq.Ft.
Under
Construction
Otay Mesa 15,479,134 291,154
Chula Vista 9,925,888 -
Total OM/CV 25,405,022 291,154
San Diego County 186,233,079 3,160,004
OM/CV as % of SD Co. 13.6% 9.2%
Source: Kidder Mathews
Industrial Space Market
Otay Mesa, Chula Vista & San Diego County
4th Quarter 2017
Page 66 of 83
Miscellaneous Development There are two major projects on the horizon, although their development timing is an unknown: University Village and Sunroad East Otay Mesa Business Park. The Sunroad project was originally going to contain a major shopping center with a Target store, but has recently replanned the site for a combination of 3,100 multi-family units and 850,000 square feet of commercial space. At University Village (Village 3 & 4), there is a proposed campus of St. Katherine University, now based in San Marcos. The school currently has 1,000 students. Reportedly, the City of Chula Vista is in negotiations with St. Katherine representatives. The land use plan also calls for a total of 1,597 residential units: 1,002 single-family homes, 317 multi-family units and 278 mixed-use units as well as 29.3 acres of industrial space.
Building 17 Murphy Otay Mesa Industrial 79,050 2017
Building 18 Murphy Otay Mesa Industrial 121,970 2017
Brown Field Tech Park 1-C Murphy Otay Mesa Industrial 108,247 2018-2024
Brown Field Tech Park 1-A Murphy Otay Mesa Industrial 201,342 2018-2024
Brown Field Tech Park 1-B Murphy Otay Mesa Industrial 126,333 2018-2024
San Diego Bus. Park -2055 Sanyo Ave (1) Murphy Otay Mesa Industrial 208,985 2017
San Diego Bus. Park -2055 Sanyo Ave (1) Murphy Otay Mesa Industrial 352,378 2019
Otay Logistics Center
Black Creek
Group Otay Mesa Industrial 269,000 2018
Total 2,467,305
(1) renovation of existing facility
Source: Murphy Development Co. & various other sources
Planned and Active Office/Industrial Development
Chula Vista/Otay Mesa
as of March 2018
Page 67 of 83
Property Developer Location Type Acres
Est.
Date of
Comple
tion
Sunroad East
Otay Mesa Bus.
Park Sunroad 125 & Otay Mesa Rd.
Mixed use, including 3,100
housing units, 850,000 sf coml
space 253 n/a
University Village n/a Innovation Center University, 1,597 residential units 1,281 n/a
Proposed Miscellaneous Development Activity
Chula Vista/Otay Mesa
as of January 2018
Page 68 of 83
Section 7: Projections for OWD Development Activity 2018-2024
In this section, we discuss the projections for both residential and non-residential development in fiscal years 2018-2019 through 2023-2024. 7.1: Residential Development Projections We are confident that the next few years will be unusually vibrant on the Otay Ranch as the major landholders will continue to develop shovel-ready lots. Better yet, we anticipate that the market for the product developed there will be well accepted, as it represents a wide range of product types and prices/rents. For definition’s sake, we are assuming that “for sale” multi-family product will be townhomes or other varieties of attached for sale product. The rental product is assumed to be multi-story flats, but, at some point, developers may produce “for sale” flats – i.e. vertical condominiums. In the projection below, we anticipate that most of the development in the OWD service area will be in the Otay Ranch. Having said that, there are two projects that could surface during the latter fiscal years of our projections: those two are Salt Creek (discussed earlier in the report) and the Sunroad East Otay Mesa project.
Page 69 of 83
In the projections, we have placed a heavier weight on the multi-family market, for two reasons: first, apartment developers have a growing appetite for Otay Ranch product and second, townhomes will prove to be the most affordable sale product on the Ranch and therefore most popular with young families. The land prices in the OWD service area and government fees are most often substantially less than in the more urban areas of the County, making it highly attractive to multi-family developers. We also recognize that the ebullience of the economy may fade somewhat in a few years and interest rates may climb. Either of those events would soften the market for sale product but perhaps not for rental product. Lastly, it appears likely that many projects will be built out below their allowed density. We particularly see that in Millenia which was originally aiming for 3,000 units, but will most likely have fewer units.
7.2 Non-Residential Product Projecting non-residential development in the OWD service area is not as precise as the residential sector, as it remains largely untested for most product. For instance, the Chesnut office development, which could have as much as 1,000,000 square feet of office space, is not assured of near-term development. We have placed the start of that development in 2022-2023, hedging our bet. It could happen earlier. We have allocated a modest amount of office space in earlier years to reflect the possibility of smaller office space within the new villages, some of which may be health related. We have not assumed that University Village will move forward in this timeframe, although that might change is the proposed St. Katherine’s University moves forward with its plan. The probability of a number of smaller hotels is somewhat certain and most likely, the CBX may initiate hotel development in the near-term future. We, of course, have not included the RIDA Hotel and Conference Center in Bayfront as is not in the OWD service area, although most certainly will happen in the next few years. Retail will be developed in the villages as they mature, but it will be neighborhood shopping, with the exception of the Sudberry 131,000 square feet of space that is underway in Millenia. Until recently, the vacancy rate in industrial space on the Otay Mesa was 15%+ and has now edged down to the 10% range. Most of the development there is large one-story boxes that, in some cases, have been segmented into smaller incubator spaces.
Page 71 of 83
The major developer in Otay Mesa is the Murphy Company which has dominated the market there for several decades and continues to control most of the remaining industrially zoned land. The company tends to build in 100,000+ square foot increments, often speculative. They have also acquired the former Sanyo space that will be retrofitted for smaller users. We don’t mean to imply that the Murphy Company owns all the industrial space in Otay Mesa, but does control most of the space that is most likely to be developed in the near-term future. Certainly, the land along S-11 will ultimately developed with industrial, but we do not foresee that in the near-term future.
7.3 Valuation of Non-Residential Development The valuation of non-residential development in San Diego County follows the patterns of residential development. Non-residential development was very vibrant from 2000-2006, then declined
Fiscal Years: Measure 2018-2019 2019-2020 2020--2021 2021-2022 2022-2023 2023-2024 Total
dramatically through the recession and now has returned to pre-recession levels. The valuations for 2017 have not been released, but we have included our estimate based on activity in the first half of the year.
The Otay Water District will follow the same track as San Diego County in terms as Non-Residential development. The one “wild card” is the Chesnut office project at Millenia. Should that project move forward it will result in the OWD area having a higher percentage of the County’s office development activity than in past years.
Year Office Retail Industrial Total
2000-2006 179$ 150$ 137$ 4,637$
2006-2012 133$ 71$ 56$ 2,555$
2013-2015 168$ 152$ 36$ 3,700$
2016 54$ 142$ 18$ 4,255$
2017 (1) 8$ 164$ 90$ 4,500$
(1) Based on Jan-June 2017 Permit Activity
Source: Construction Industry Research Board
Non-Residential Permit Valuations ($millions)
San Diego County
2000-2017 (P)
San Diego County
Page 73 of 83
<<<<<<<<<<<<<<<<<<>>>>>>>>>>>>>>>> On balance, we are convinced that the next several years will be highly active ones for the residential and commercial development community in the Otay Ranch/Otay Mesa region. As a result, the Otay Water District will experience a substantial increase in customers and usage.
Year Office Retail Industrial Hotel Total
Annual Average
CY 2002-2007 208.0$ 141.1$ 136.4$ 78.2$ 563.7$
CY 2012-2015 159.4$ 122.4$ 32.5$ 70.7$ 385.0$
FY 2015-2018 120.0$ 105.0$ 43.3$ 63.3$ 331.6$
FY 2018-2024 130.0$ 125.0$ 75.0$ 90.0$ 420.0$
Annual Average
FY 2015-2018 4.0$ 4.0$ 2.0$ 3.5$ 13.5$
+25% Misc. 1.0$ 1.0$ 0.5$ 0.9$ 3.4$
Total 5.0$ 5.0$ 2.5$ 4.4$ 16.9$
FY 2018-2024 5.0$ 5.0$ 3.0$ 4.5$ 17.5$
+25% Misc. 1.3$ 1.3$ 0.8$ 1.1$ 4.4$
Total 6.3$ 6.3$ 3.8$ 5.6$ 21.9$
FY 2015-2018 4.2% 4.8% 5.8% 6.9% 5.1%
FY 2018-2024 4.8% 5.0% 5.0% 6.3% 5.2%
Note: Remodeling projects and publicly funded projects excluded
OWD as % of San Diego County
Non-Residential Permit Valuations (Historic and Projected)
Otay Water District and San Diego County
2002-2024 (P)
Annual Average ($millions)
San Diego County
OWD Service Area
Page 74 of 83
Detail Exhibits Projected Development Activity
Otay Ranch 2017-2024
Page 75 of 83
VILLAGE 2
Community Builder Type 2017 2018 2019 2020 2021 2022 2023 Total
Apartments Baldwin MF 0 300 425 330 0 0 0 1,055
MF Baldwin MF 157 79 92 103 60 60 51 602
R-28 MF R&V Management MF 96 0 0 0 0 0 0 96
SF Baldwin SF 80 156 135 40 27 0 0 438
Aventine Cornerstone SF 19 45 33 0 0 0 0 97
Cambria Cornerstone SF 9 33 18 0 0 0 0 60
Estancia Cornerstone SF 10 27 0 0 0 0 0 37
Monterra Cornerstone SF 24 12 0 0 0 0 0 36
395 652 703 473 87 60 51 2,421
MF 253 379 517 433 60 60 51 1,753
SF 142 273 186 40 27 0 0 668
Source: BIA, land owners, builders & City of Chula Vista
TOTAL
Projected Development Activity
Village 2
2017-2023
Otay Ranch
PA 12
Community Builder Type 2017 2018 2019 2020 2021 Total
Apartments Baldwin MF 0 213 351 0 0 564
MF - Sale
Product Baldwin MF 24 40 64 52 32 212
SF Baldwin SF 3 39 38 0 0 80
TOTAL 27 292 453 52 32 856
MF 24 253 415 52 32 776
SF 3 39 38 0 0 80
Source: BIA, land owners, builders & City of Chula Vista
Projected Development Activity
PA 12
2017-2021
Otay Ranch
Page 76 of 83
Escaya (Village 3)
Community Builder Type 2017 2018 2019 2020 Total
Alley Row TH Brookfield Homes MF 28 58 21 0 107
Mixed Use Project
(Apts./Commercial) HomeFed MF 0 150 246 0 396
Haciendas Brookfield Homes SF 26 38 12 0 76
Prado Front Load SFD Brookfield Homes SF 35 44 42 18 139
Castellena CalAtlantic Homes SF 42 26 0 0 68
Indigo CalAtlantic Homes SF 47 40 15 0 102
Valencia CalAtlantic Homes SF 46 38 31 0 115
Strata Shea Homes SF 21 51 0 0 72
Sierra Shea Homes SF 7 44 44 12 107
Seville Shea Homes SF 19 34 36 37 126
271 523 447 67 1,308
MF 28 208 267 0 503
SF 243 315 180 67 805
Source: BIA, land owners, builders & City of Chula Vista
TOTAL
Projected Development Activity
Village 3 (Escaya) - Home Fed
Otay Ranch
2017-2020
Page 77 of 83
Millenia
Community Builder Type 2017 2018 2019 2020 2021 Total
Cal Atlantic Lot 17
CalAtlantic
Homes MF 0 40 38 0 0 78
Skylar KB Homes MF 11 52 16 0 0 79
Evo/Trio /Metro
Meridian
Development MF 115 102 0 0 0 217
Lot 19 Chesnut MF 0 0 0 0 150 150
Lot 13
Meridian
Development MF 0 0 60 0 0 60
Lot 19 & 22
Meridian
Development MF 0 10 116 0 0 126
Main St Apartments
Meridian
Development MF 0 0 300 0 0 300
Main Street Residential n/a MF 44 100 0 144
Element & Z Shea Homes MF 27 41 34 0 0 102
Alexan Apartments
Trammell
Crow MF 309 0 0 0 0 309
Trammell Crow Lot 28
Trammell
Crow MF 0 253 0 0 0 253
8&15 n/a MF 49 100 149
TOTAL 462 498 608 149 250 1,967
MF 462 498 608 149 250 1,967
SF 0 0 0 0 0 0
Ayers Hotel (rooms) Ayers 0 135 0 0 0 0
Sudberry Commercial
(Sq.Ft.) Sudberry 0 131,000 0 0 0 0
Future Office (Sq.Ft.)
Lot 7 Chesnut 0 0 330,000 0 0 0
Lot 1 Chesnut 0 0 0 0 800,000 0
Lot 19 Chesnut 0 0 0 0 0 600,000
Source: BIA, land owners, builders & City of Chula Vista
Projected Development Activity
Millenia
Otay Ranch
2017-2019
Page 78 of 83
Village 4
Community Builder Type 2017 2018 2019 2020 2021 Total
MF Moeller MF 0 50 100 100 27 277
SF Moeller SF 0 48 0 0 0 48
0 98 100 100 27 325
MF 0 50 100 100 27 277
SF 0 48 0 0 0 48
Source: BIA, land owners, builders & City of Chula Vista
TOTAL
Projected Development Activity
Village 4
Otay Ranch
2017-2021
Community Builder Type 2017 2018 2019 2020 2021 2022 2023 2024 Total
MF HomeFed MF 0 0 162 0 150 125 125 0 562
SF HomeFed SF 0 0 0 200 450 450 450 0 1,550
0 0 162 200 600 575 575 0 2,112
MF 0 0 162 0 150 125 125 0 562
SF 0 0 0 200 450 450 450 0 1,550
Source: BIA, land owners, builders & City of Chula Vista
Projected Development Activity
Villages 8,9,10 (Home Fed)
Otay Ranch
2017-2024
Total
Villages 8,9,10
Page 79 of 83
Community Builder Type 2017 2018 Total
Vista del
Cielo
Shea
Homes SF 18 25 43
Total 18 25 43
MF 0 0 0
SF 18 25 43
Source: BIA, land owners, builders & City of Chula Vista
Shea
Projected Development Activity
Shea
2017-2018
Community Builder Type 2017 2018 2019 2020 2021 2022 2023 2024 Total
MF Moeller MF 0 0 0 0 57 57
SF Moeller SF 0 0 0 0 50 50 50 50 200
0 0 0 0 107 50 50 50 257
MF 0 0 0 0 57 0 0 0 57
SF 0 0 0 0 50 50 50 50 200
Source: BIA, Hunsaker Assoc., land owners, builders & City of Chula Vista
Total
Projected Development Activity
Village 13 (Unincorporated San Diego County
Otay Ranch
2017-2024
Villages 13
Page 80 of 83
Community Builder Type 2017 2018 2019 2020 2021 2022 2023 2024 Total
MF
Jackson
Pendo MF 0 0 0 0 0 0 0 0 -
SF
Jackson
Pendo SF 0 0 0 0 50 50 50 50 200
0 0 0 0 50 50 50 50 200
MF 0 0 0 0 0 0 0 0 0
SF 0 0 0 0 50 50 50 50 200
Source: BIA, Hunsaker Assoc., land owners, builders & City of Chula Vista
Total
Village 14 (South, Central and North)
Projected Development Activity
(Unincorporated San Diego County)
Otay Ranch
2017-2024
Villages 14
Community Builder Type 2017 2018 2019 2020 2021 2022 2023 2024 Total
MF
Jackson
Pendo MF 0 0 0 0 0 0 0 0 -
SF
Jackson
Pendo SF 0 0 0 0 25 25 25 50 125
0 0 0 0 25 25 25 50 125
MF 0 0 0 0 0 0 0 0 0
SF 0 0 0 0 25 25 25 50 125
Source: BIA, Hunsaker Assoc., land owners, builders & City of Chula Vista
Total
Projected Development Activity
Planning Areas 16 & 19
(Unincorporated San Diego County)
Otay Ranch
2017-2024
Villages16 & 19
Page 81 of 83
Project Developer Unit Type No. Units
Sweetwater Villas Douglas Wilson Townhomes 218
Sweetwater Village Lennar SFD 93
Sweetwater Place Mastercraft SFD 122
Total 433
Proposed Residential Development
Sweetwater Springs Areaas of March 2018
Page 82 of 83
Xpera Group is the West Coast’s most comprehensive team of construction consultants and strategic advisors for the built environment. Having started as a construction forensics firm in 2009, we have expanded our offerings over the years to deliver specialized expertise to clients at all phases of the development process.
Having assembled more than 50 highly experienced construction consulting professionals in virtually every specialty trade, we are uniquely qualified to serve a wide range of clients, including contractors, property owners, developers, legal and insurance professionals.
As a construction consulting company, we are able to customize service solutions to meet each client’s unique goals, whether it’s ensuring quality standards, avoiding costly construction delays and claims, or achieving successful resolution for troubled projects.
One of Xpera Group’s principal services is providing economic research, a category that includes market research studies, development strategies, forensic economics, fiscal and economic impact studies and valuations.
Page 83 of 83
Disclaimer
Although the results, conclusions and recommendations contained within this consultant’s report are based upon a thorough review and analysis of current competitive market conditions and the expertise of the author, Consultant does not in any way represent, warrant or guarantee that any reported results will be achieved as a result of various reasons, including but not limited to the sensitivity to ever-fluctuating market conditions and the efficiency of a Client and its representatives, agent, employees, successors and assigns.
Economic ForecastOtay Water District
2018-2024
Presented by Alan Nevin
Attachment F
U.S. ECONOMIC FORECAST2018‐2020
The population will continue to increase by more than 2.0 milllion annually;
Employment will continue to expand at a pace of 2.0-2.25 million jobs annually;
The unemployment rate will remain in the 4.0-4.5% range;
30-year mortgage rates will remain in the 4.0-5.0% range;
Oil prices per barrel will remain in the $50-60 range;
Construction will continue to strengthen, reaching an output of 1.3-1.4 million residential units, as millennials increase family formations; and
The non-residential construction market will continue to expand thanks to major increases in infrastructure and military spending


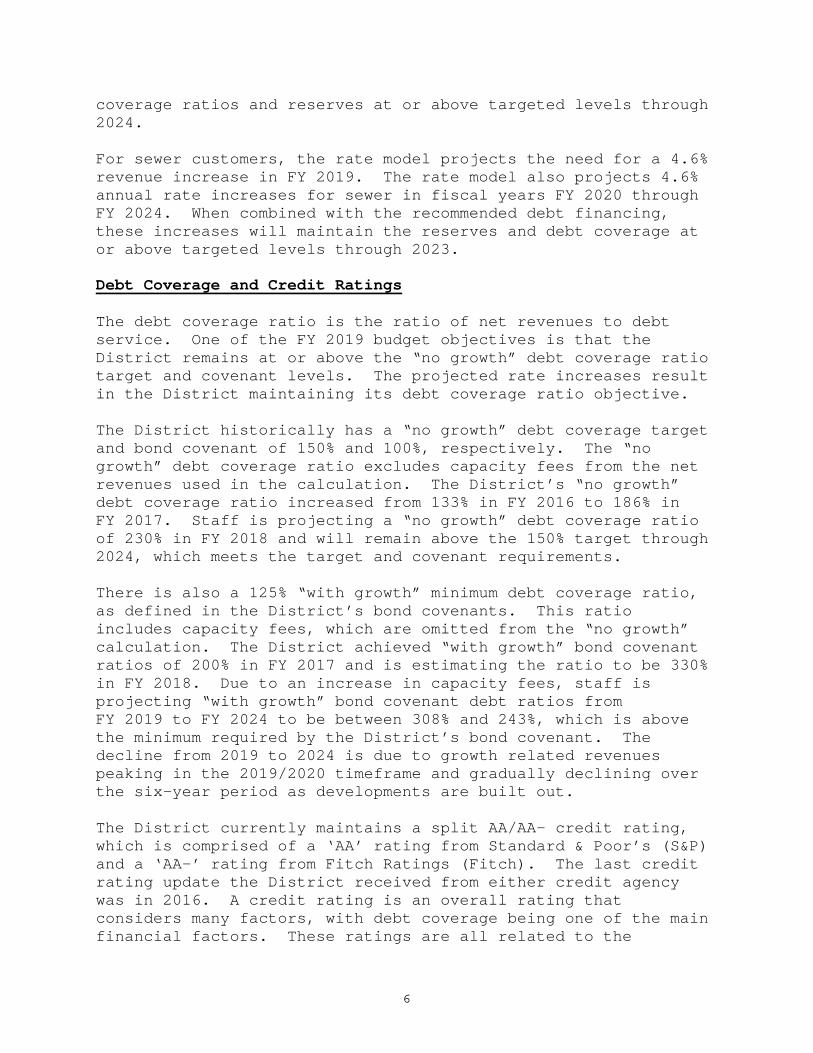


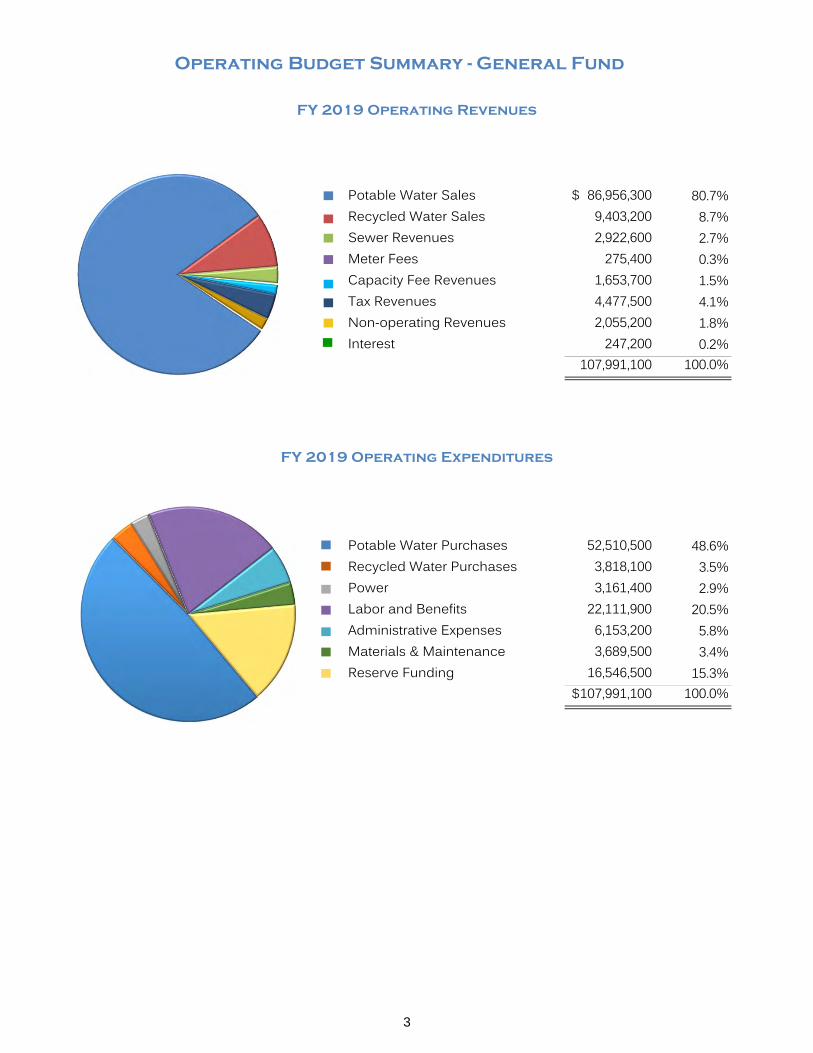


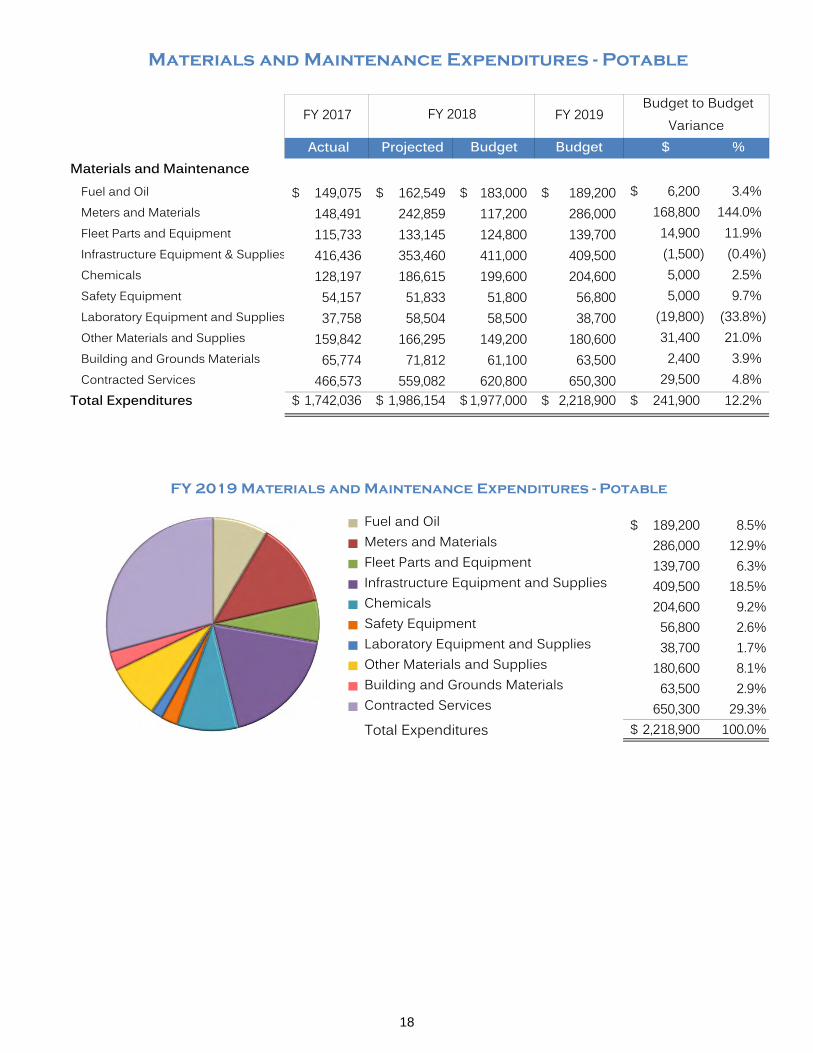


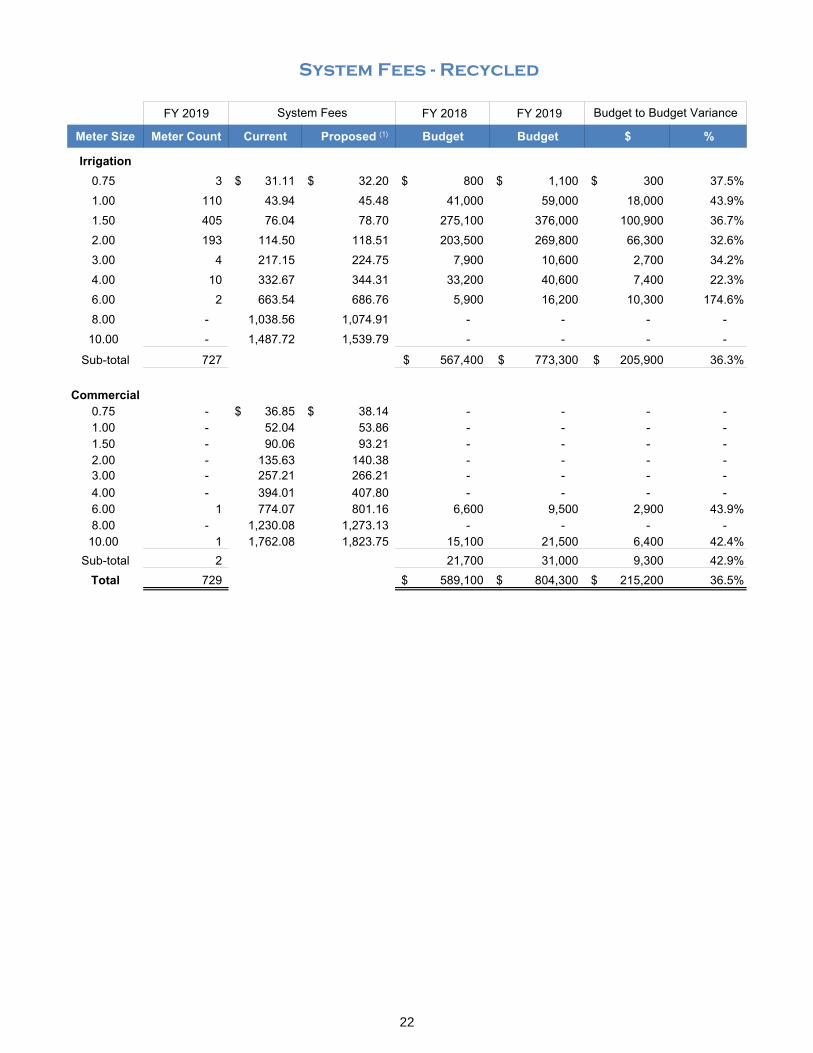


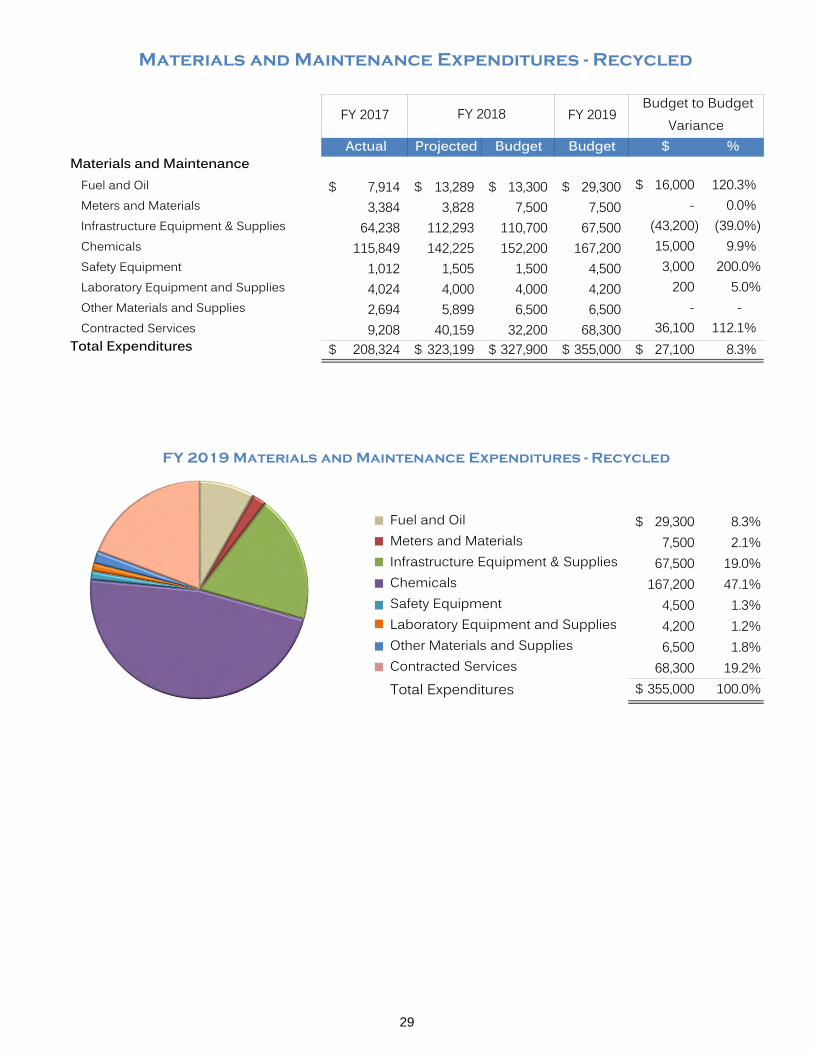


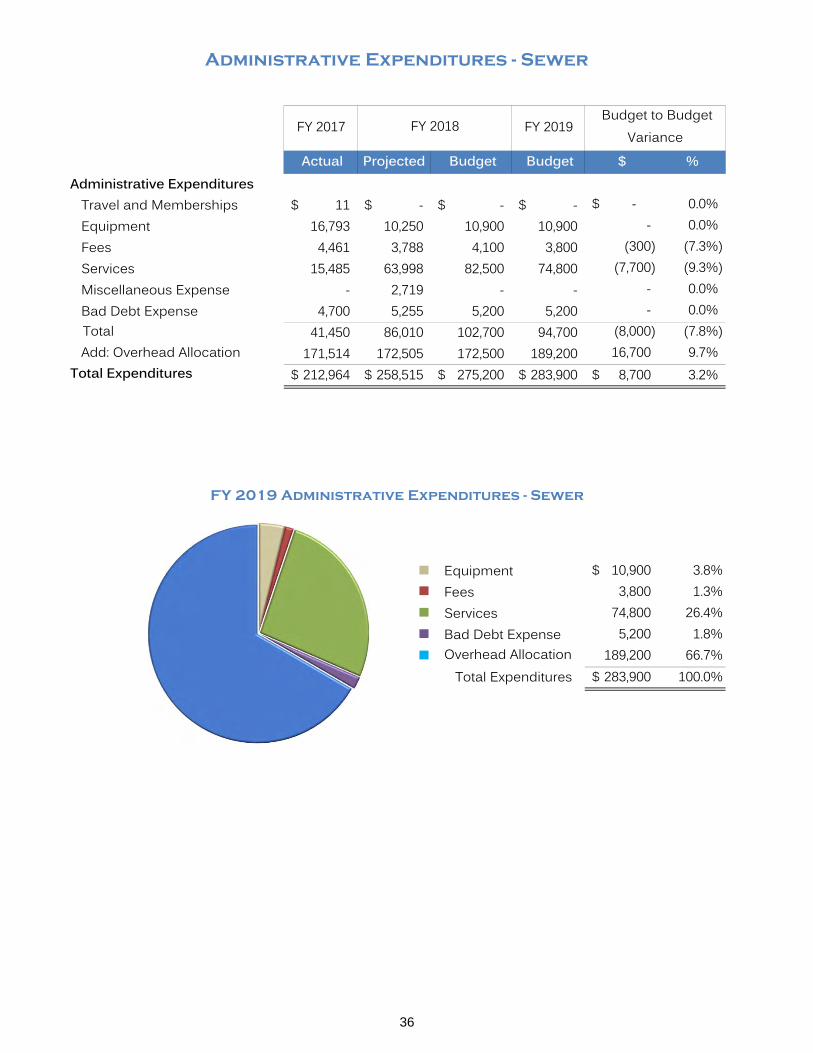


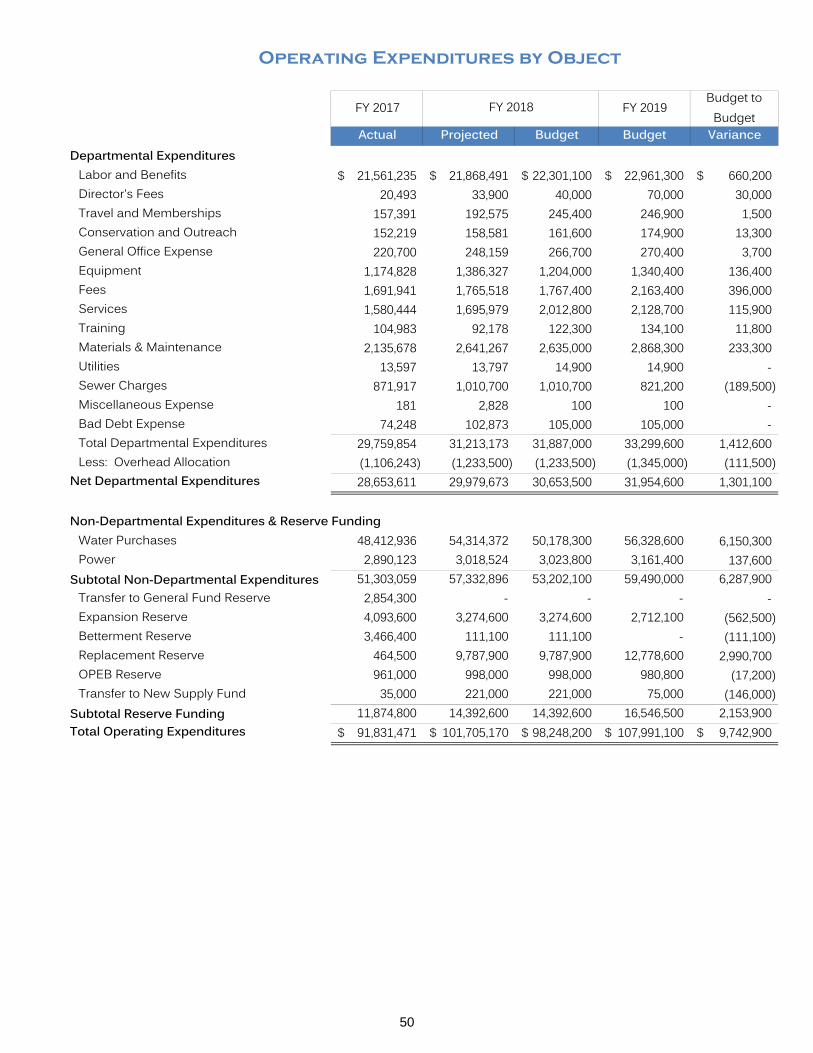


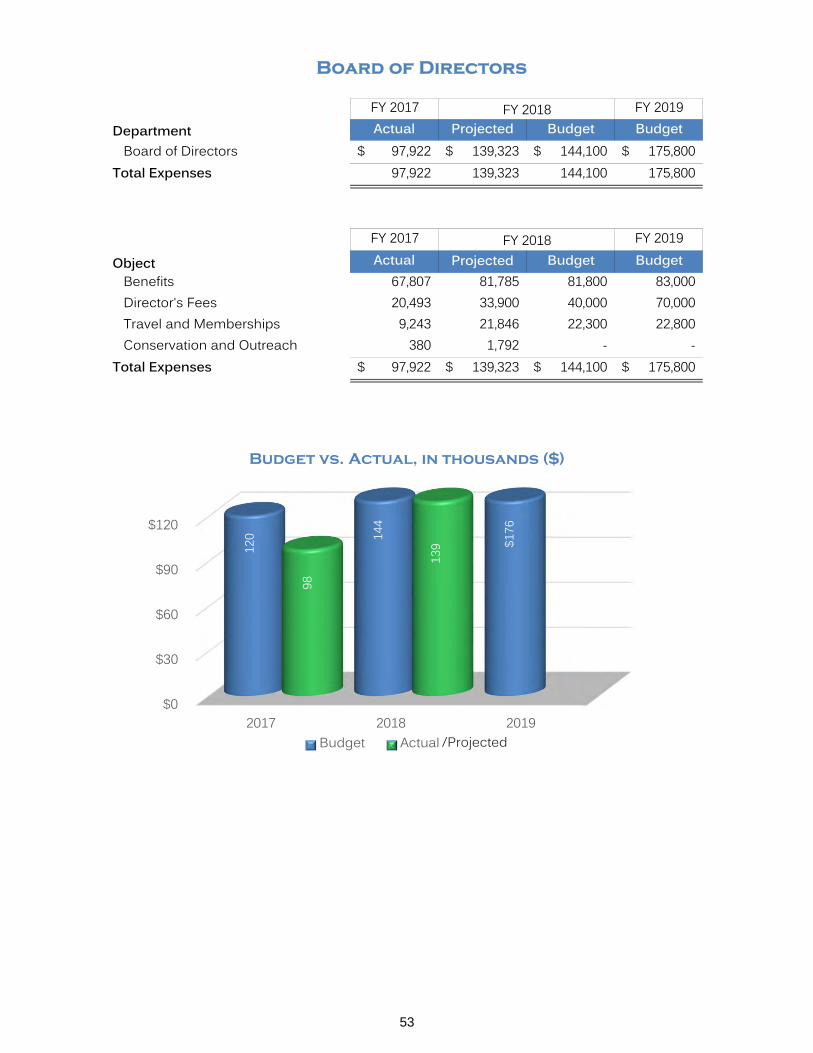


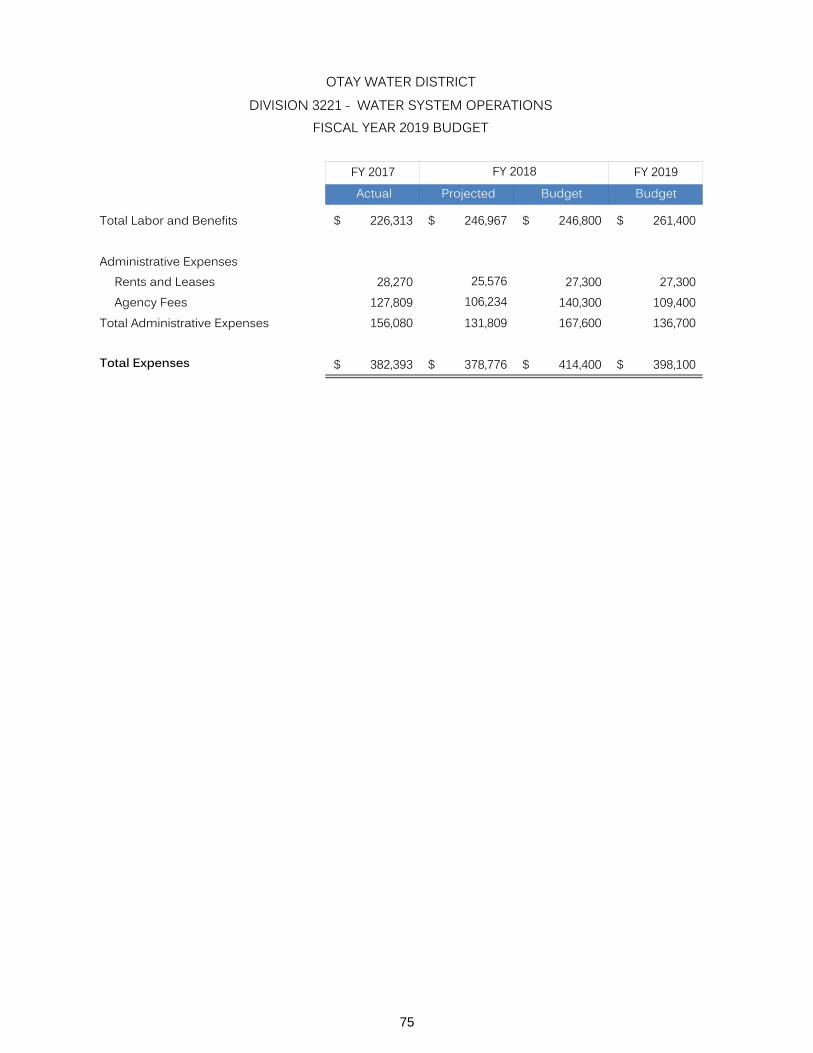


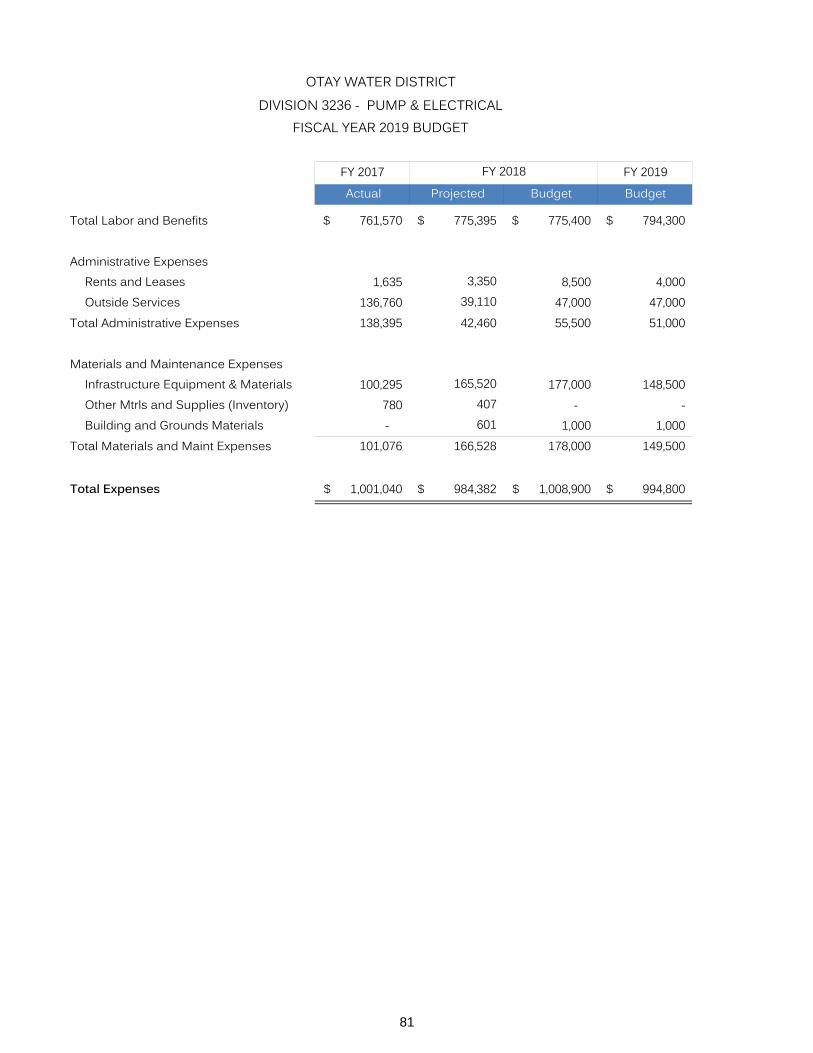


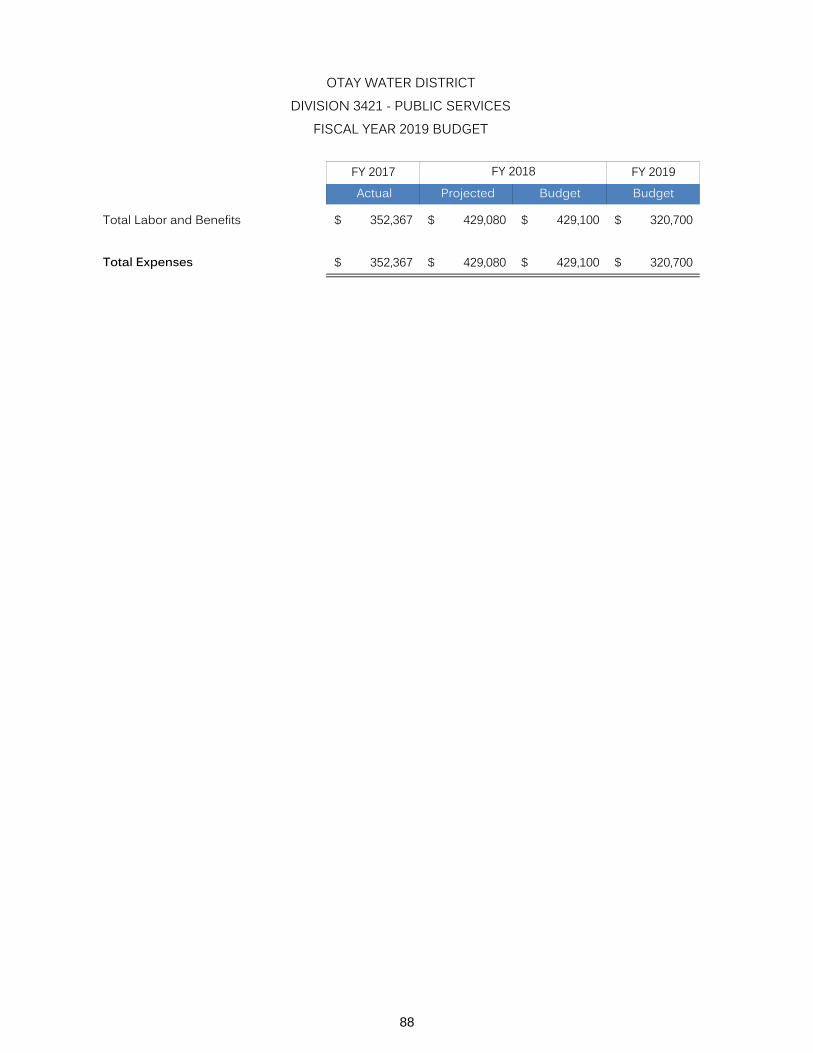


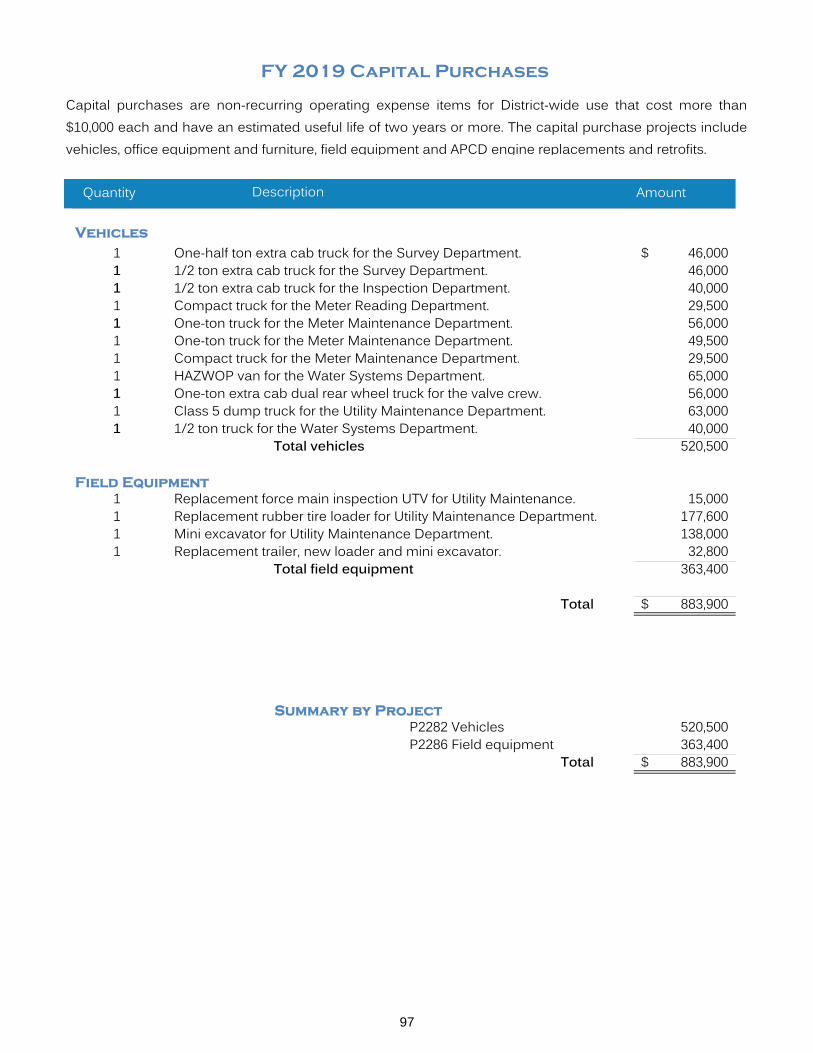


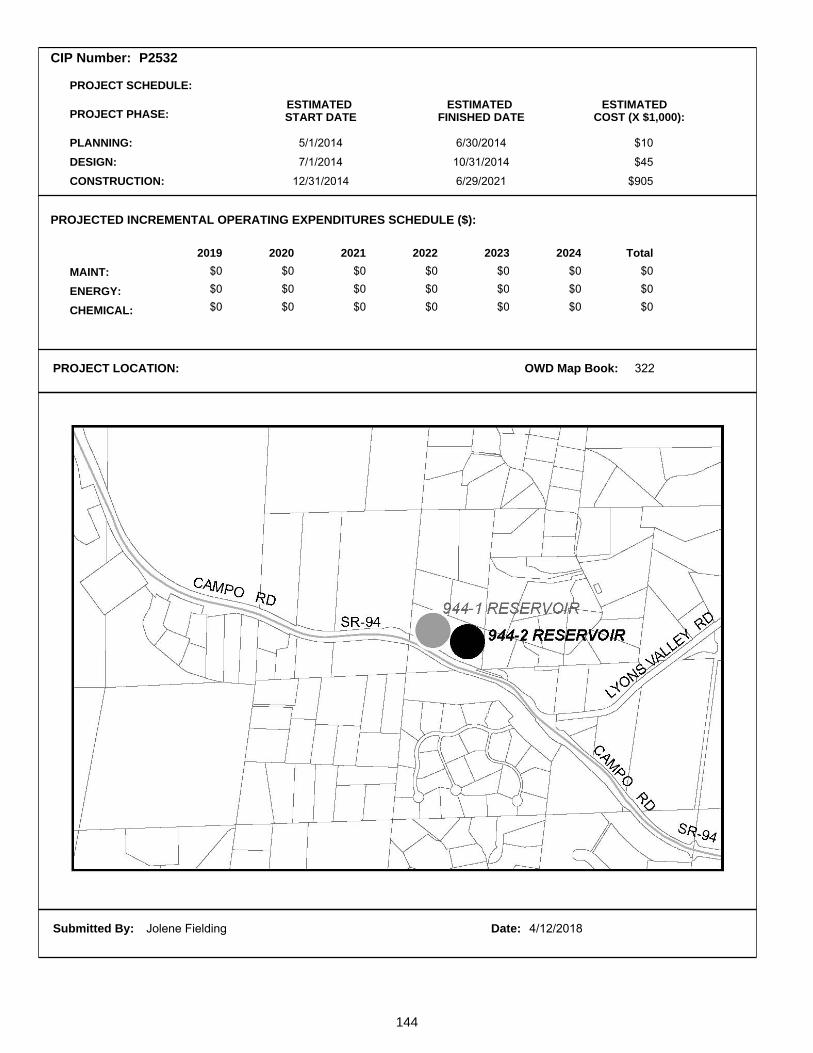


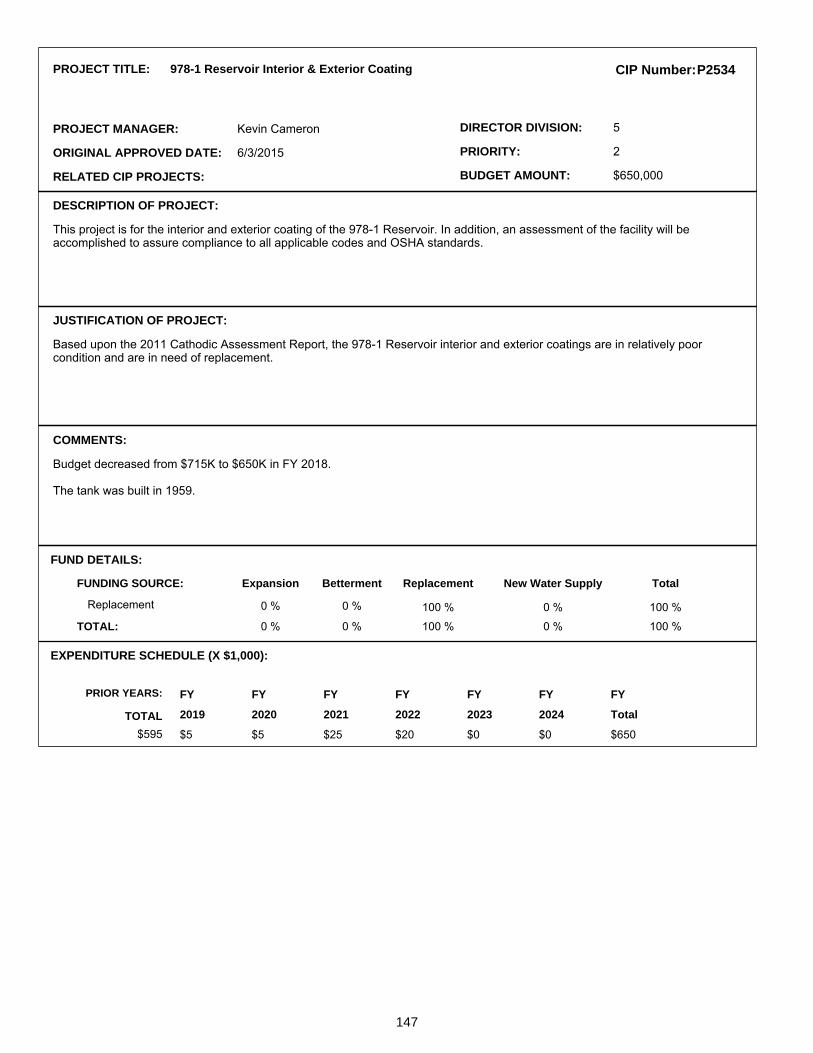


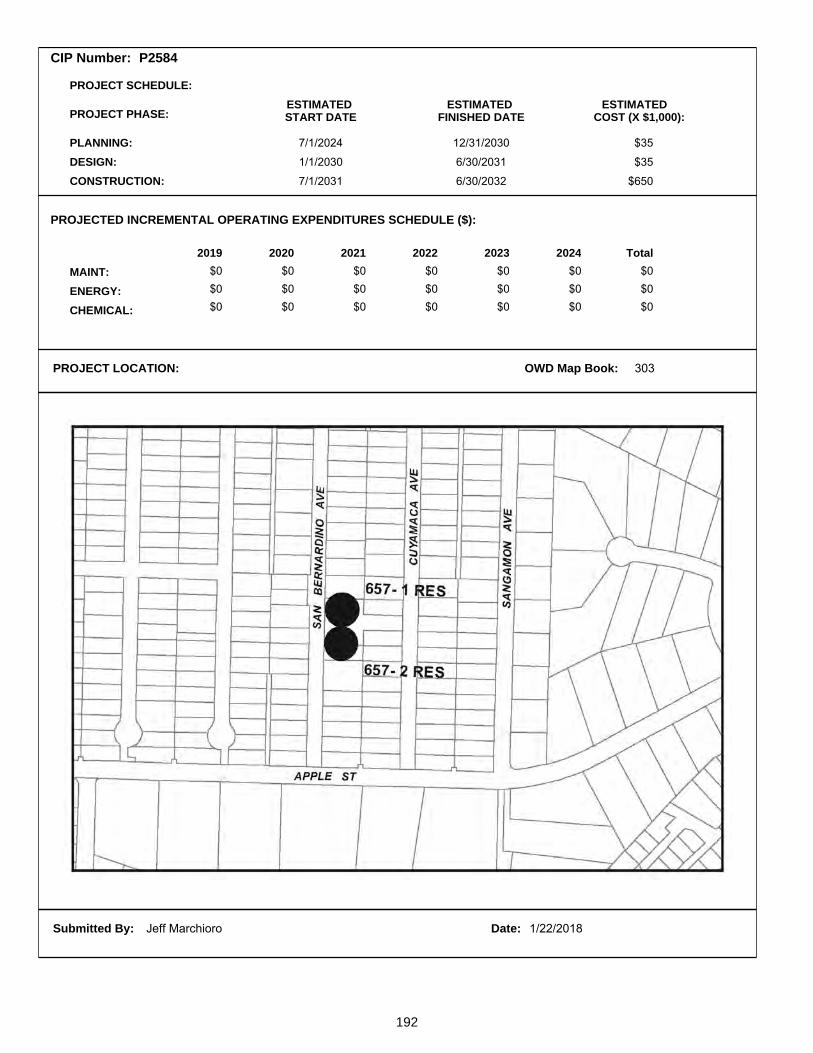


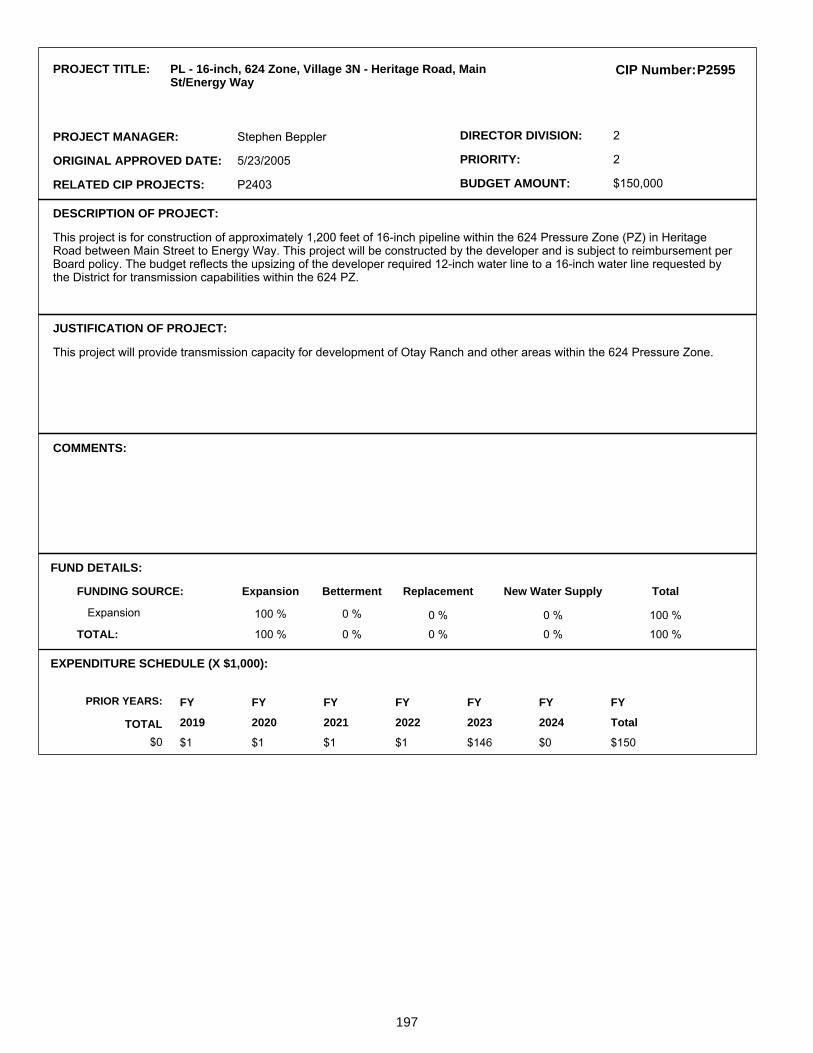


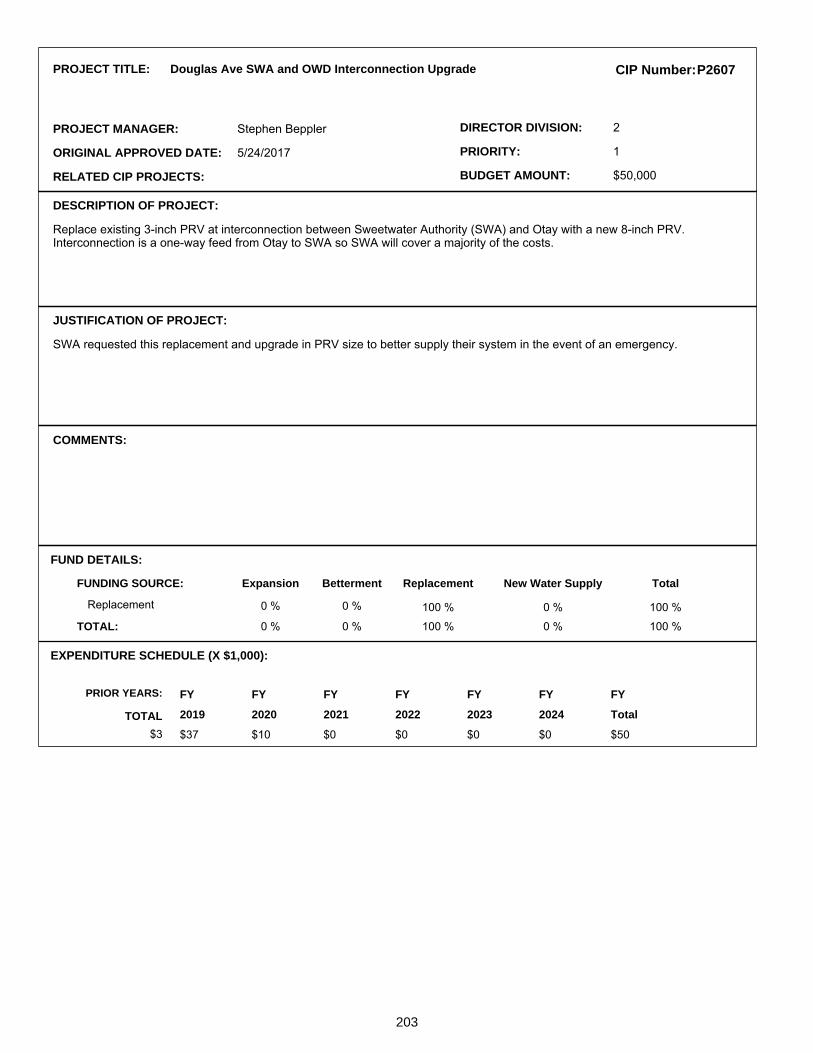
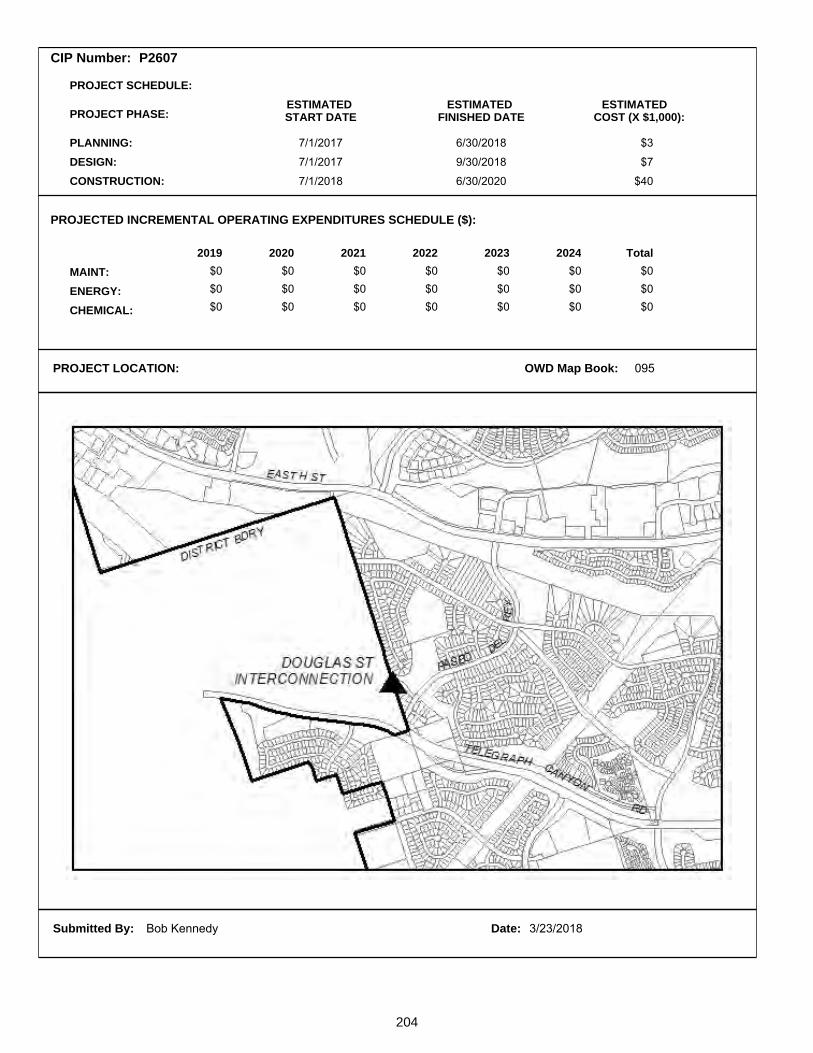


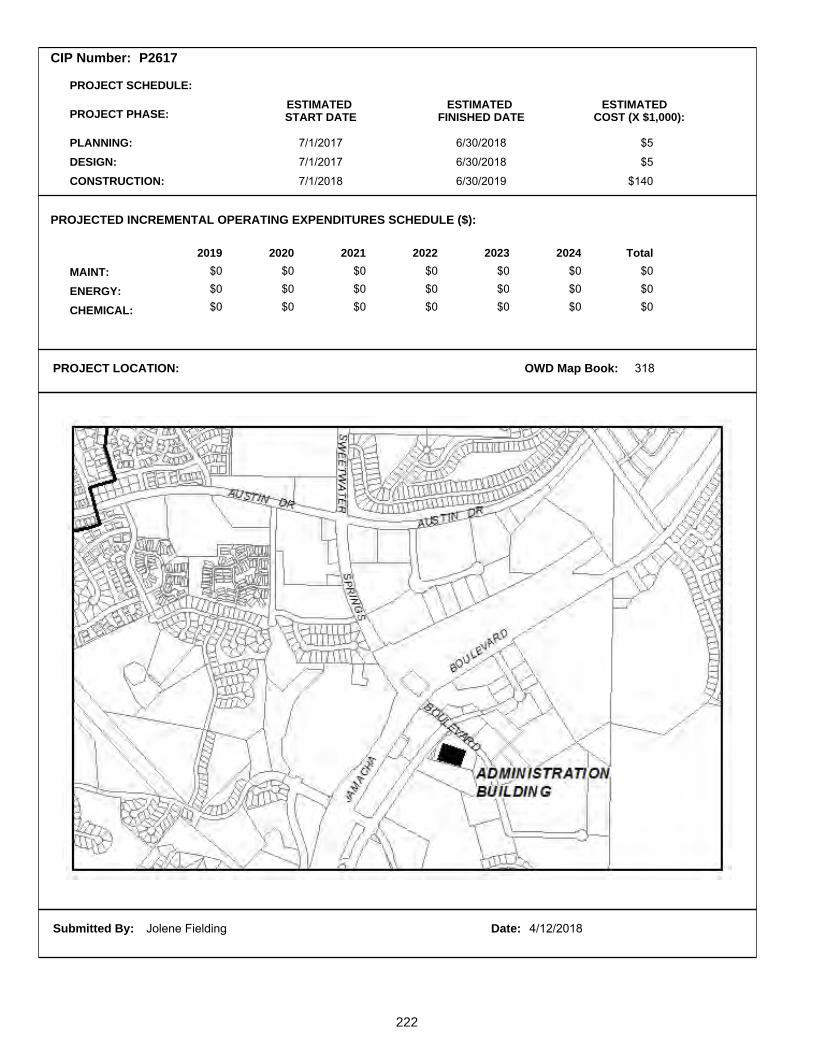


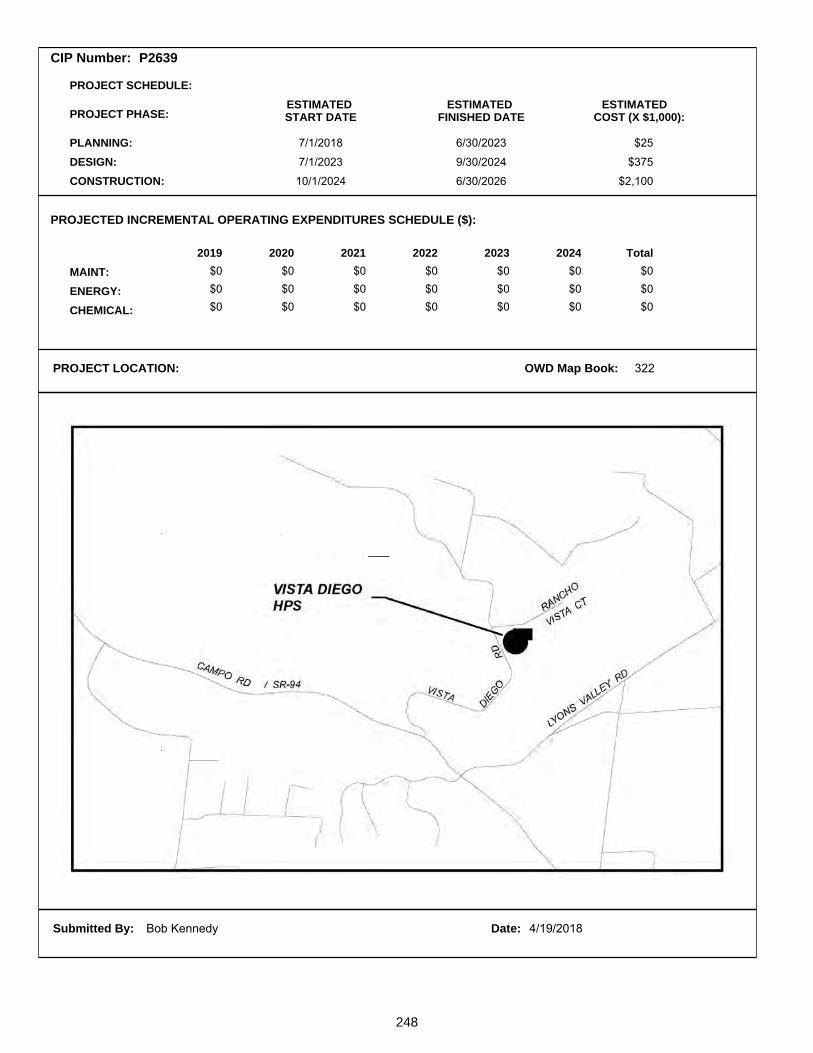


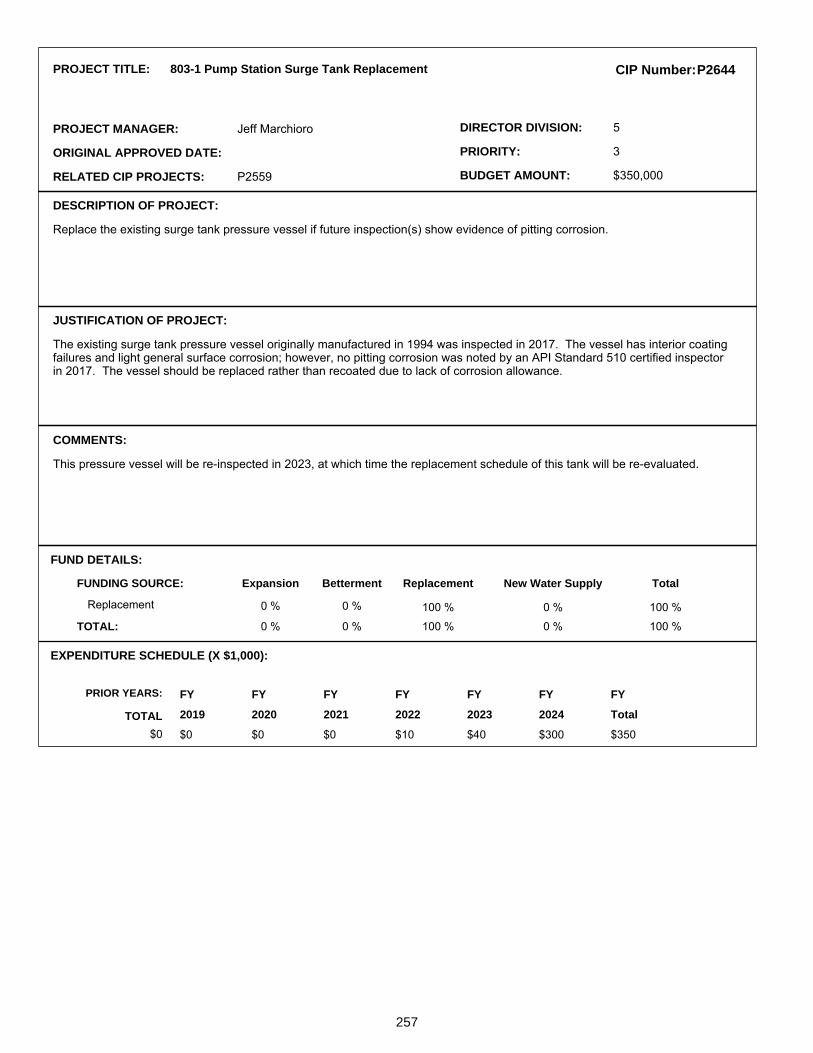


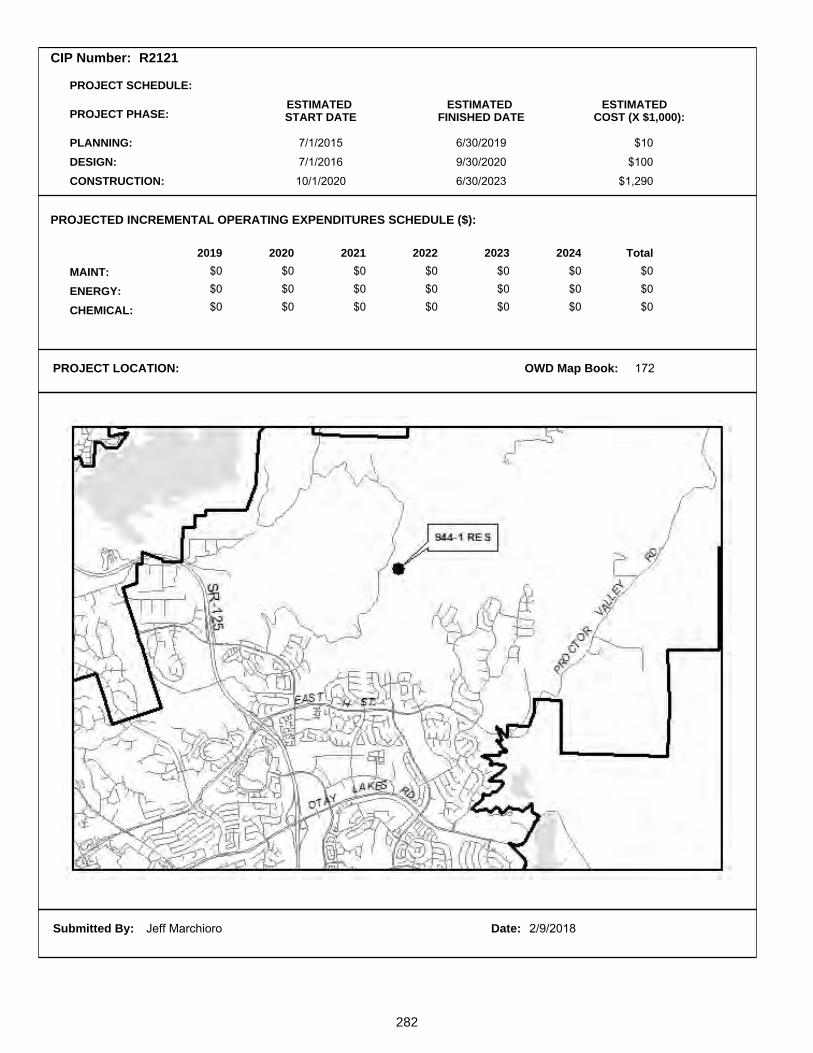


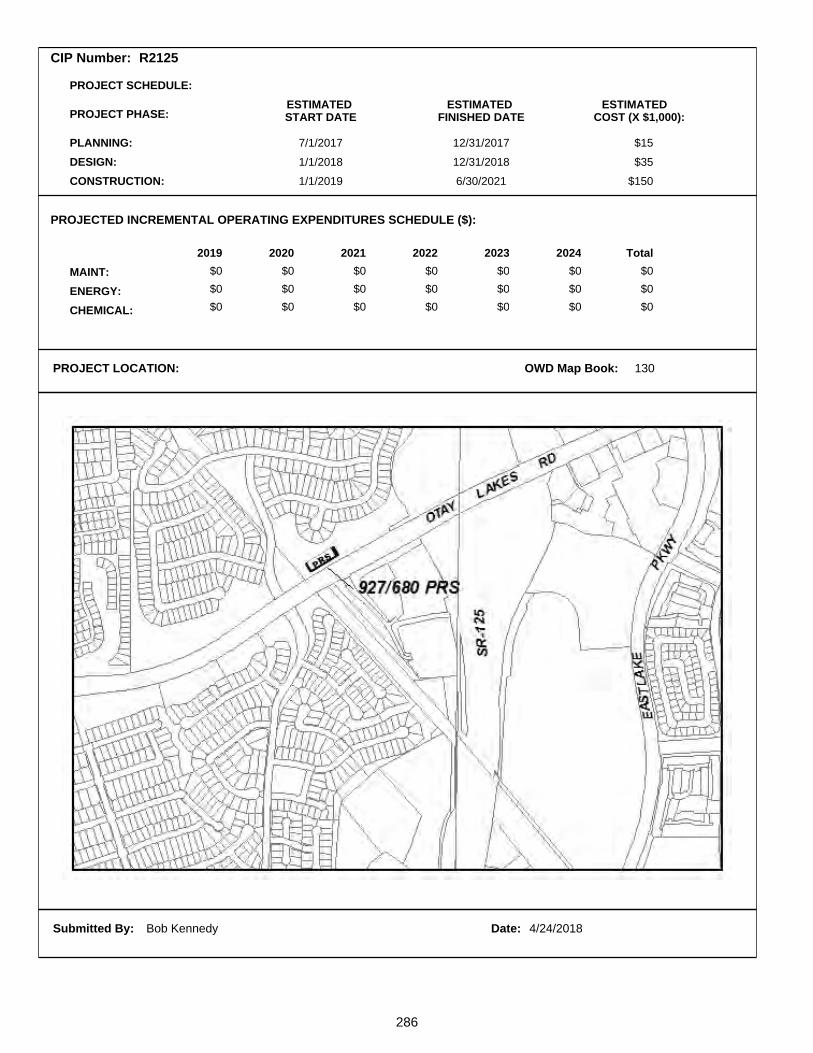


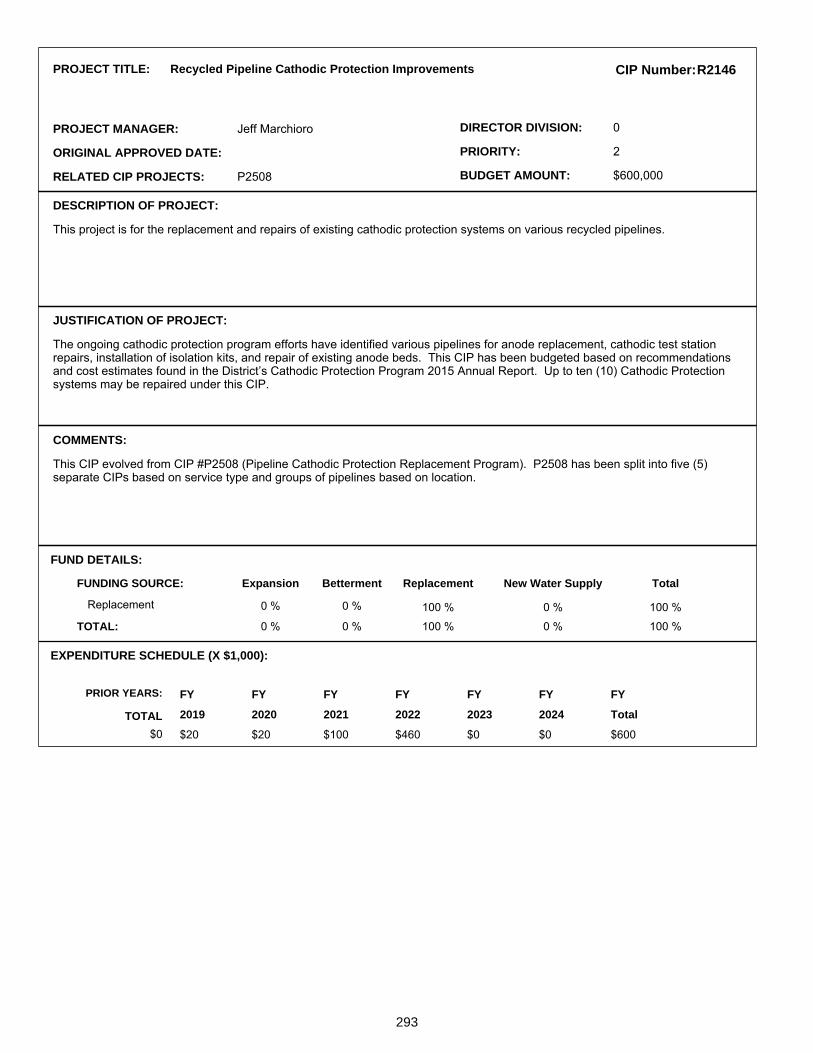

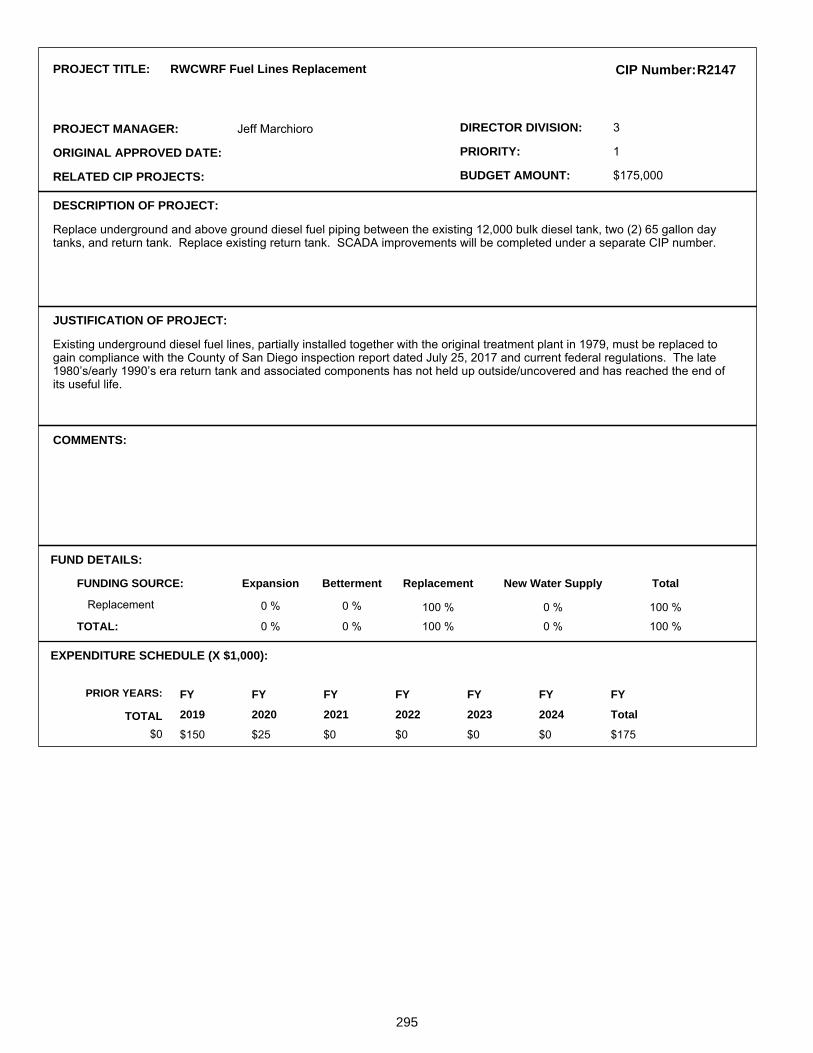


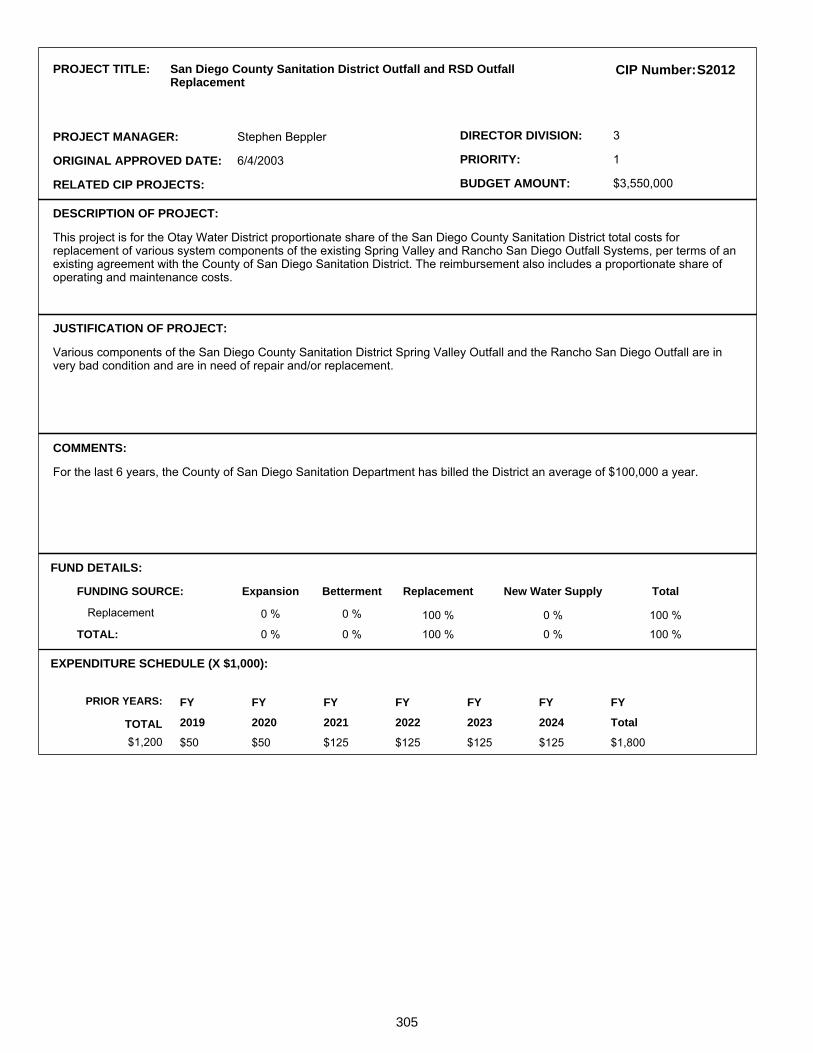


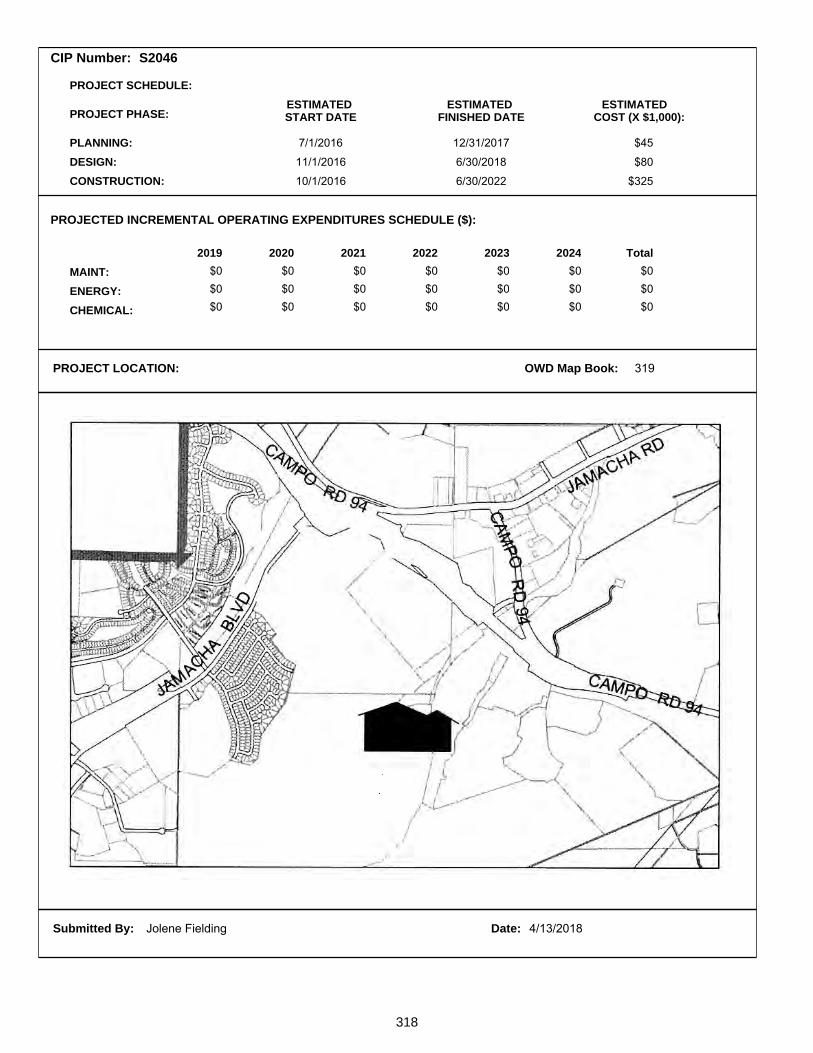


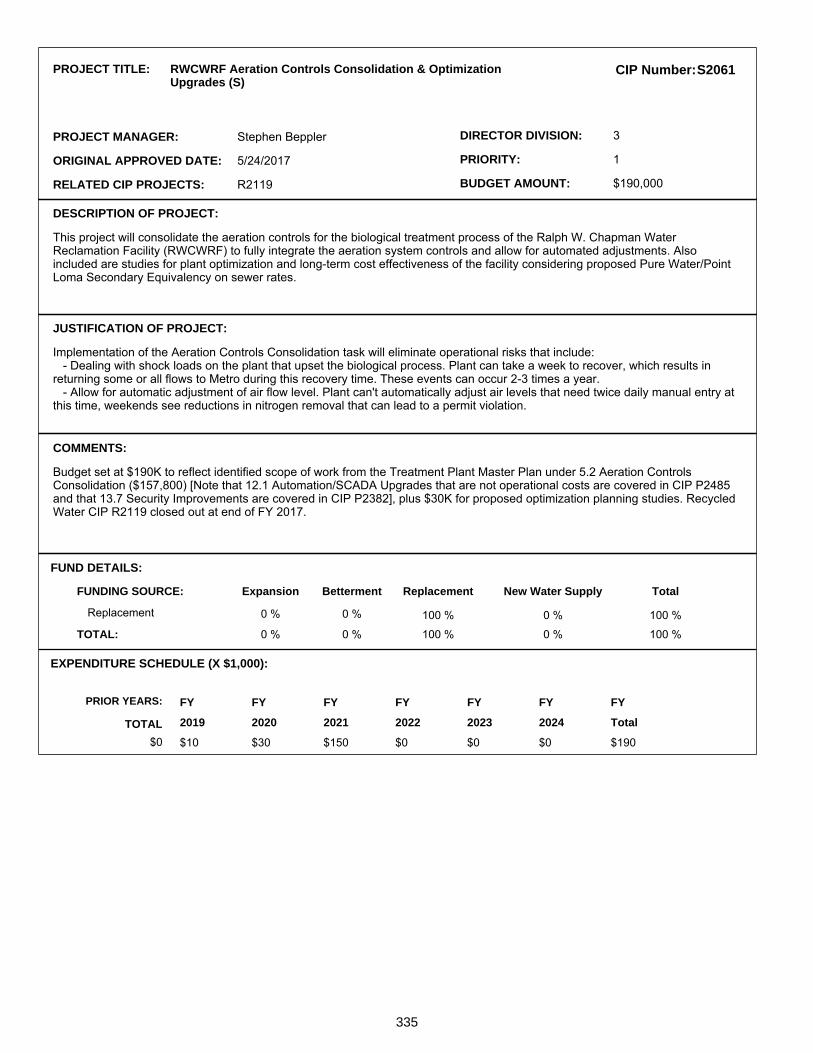


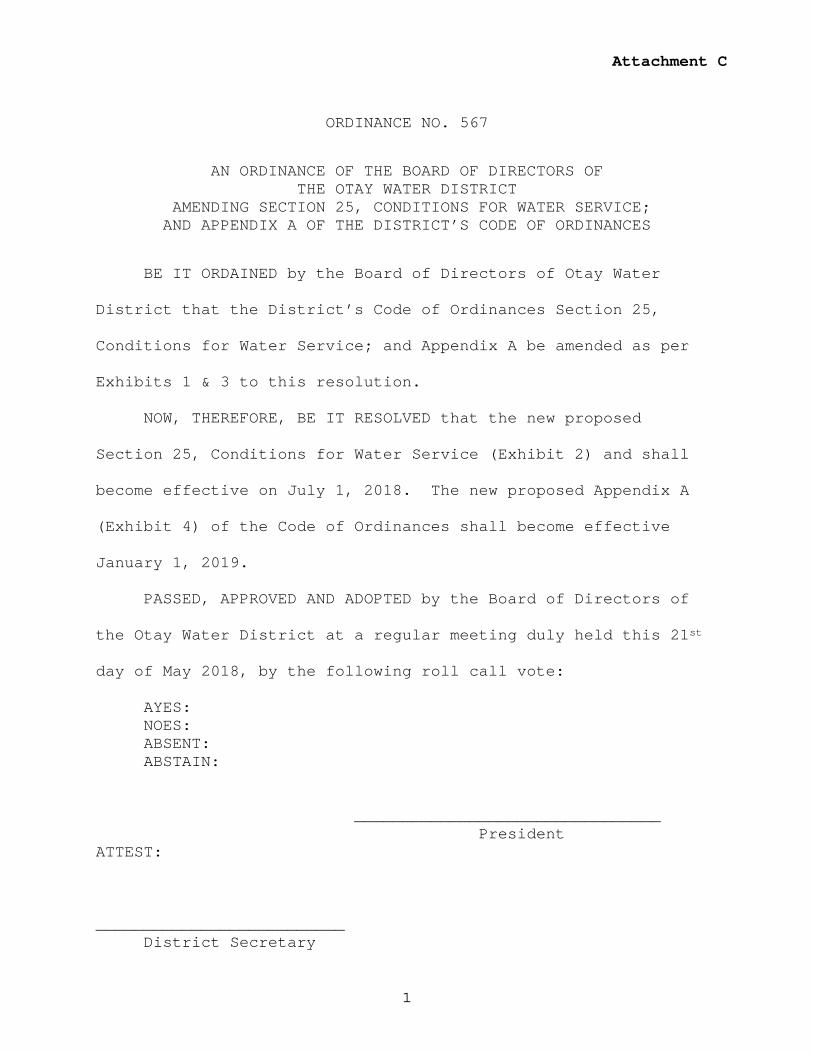


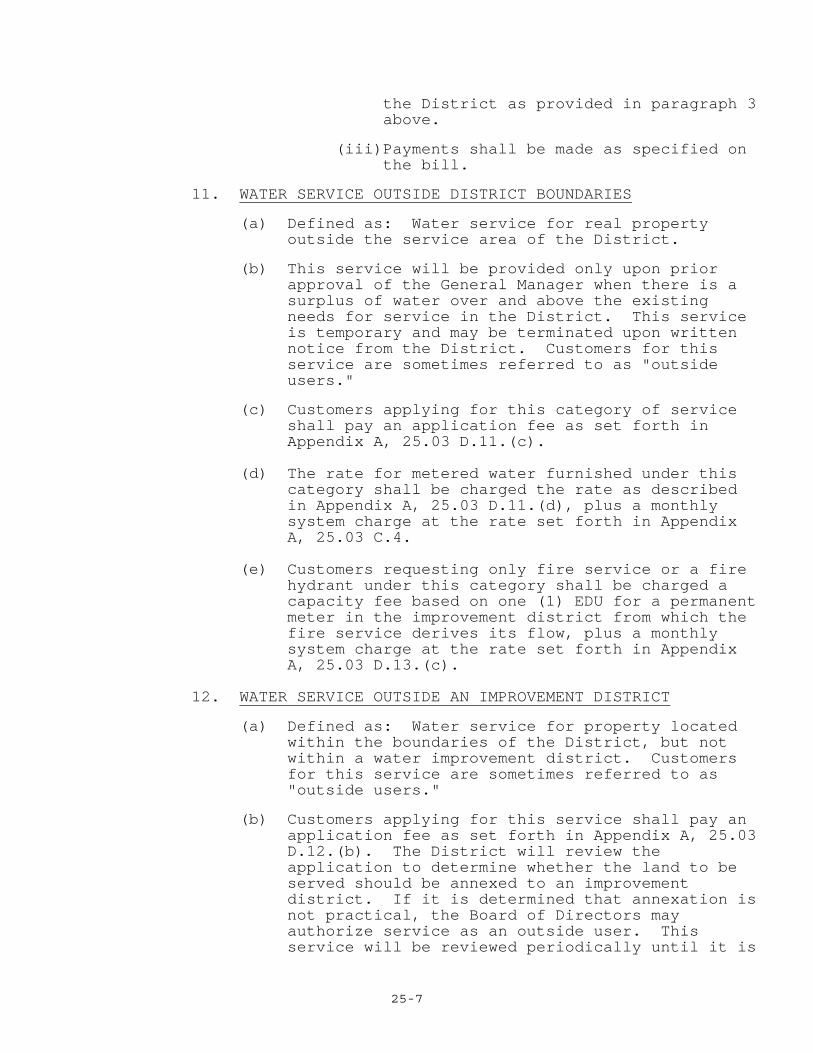


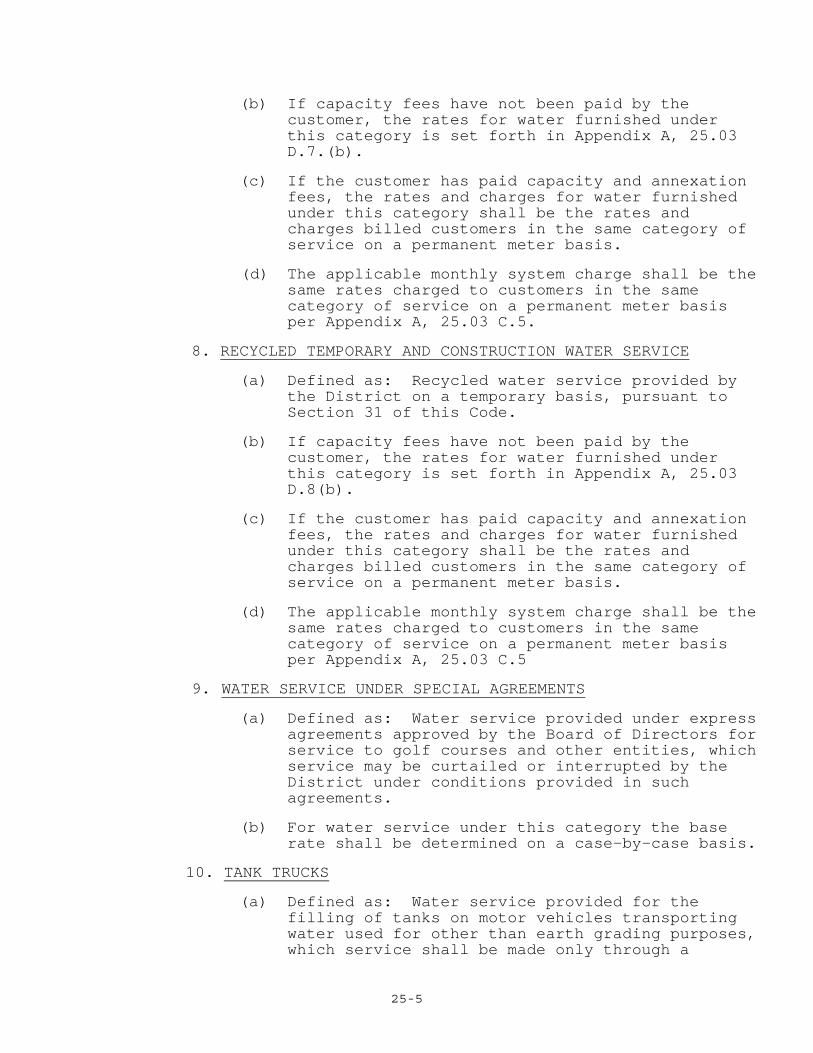


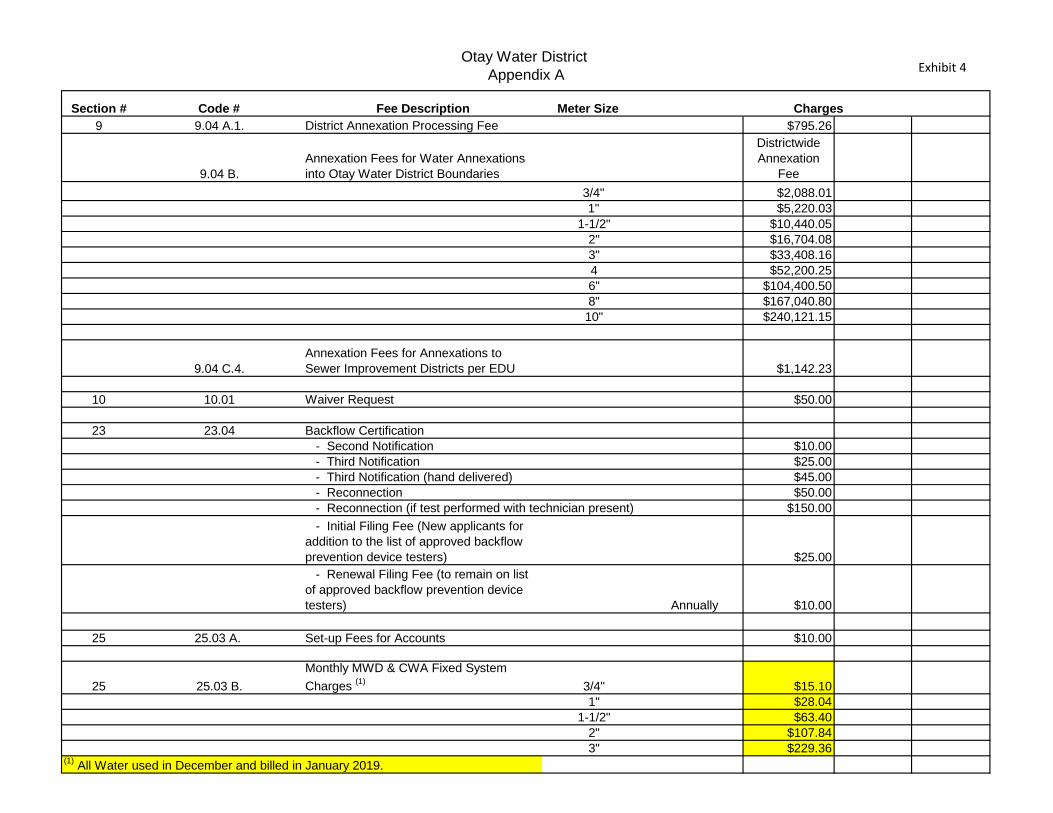


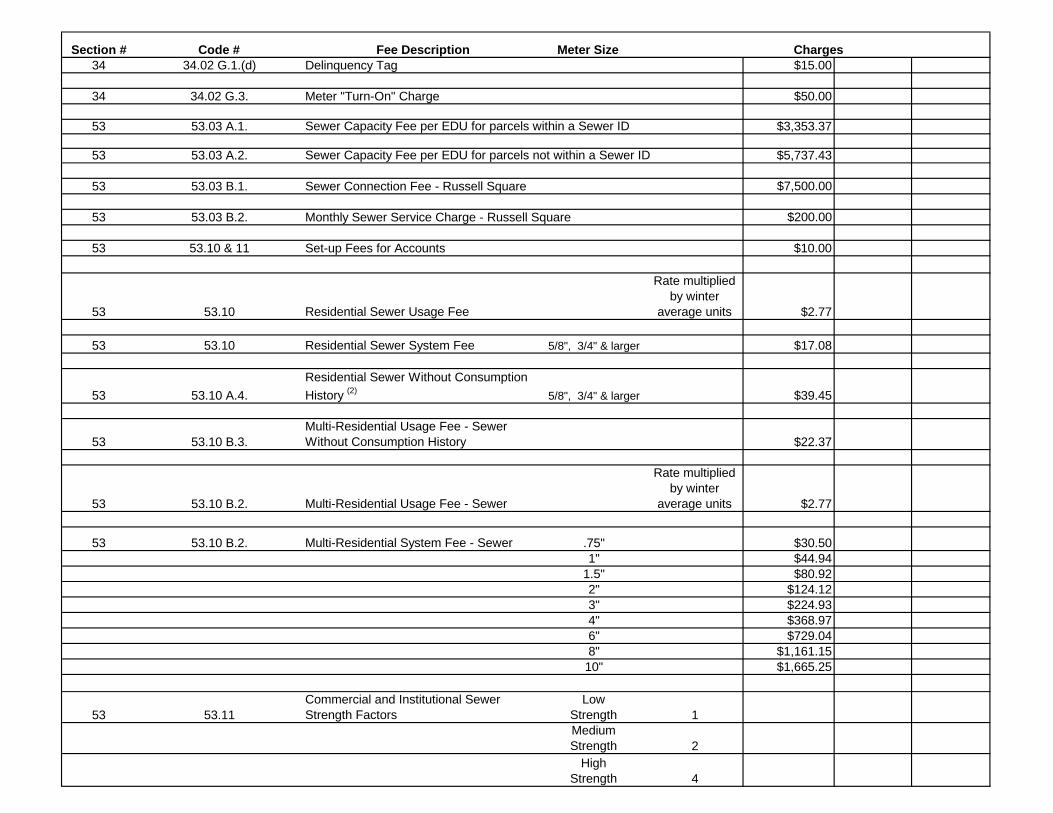


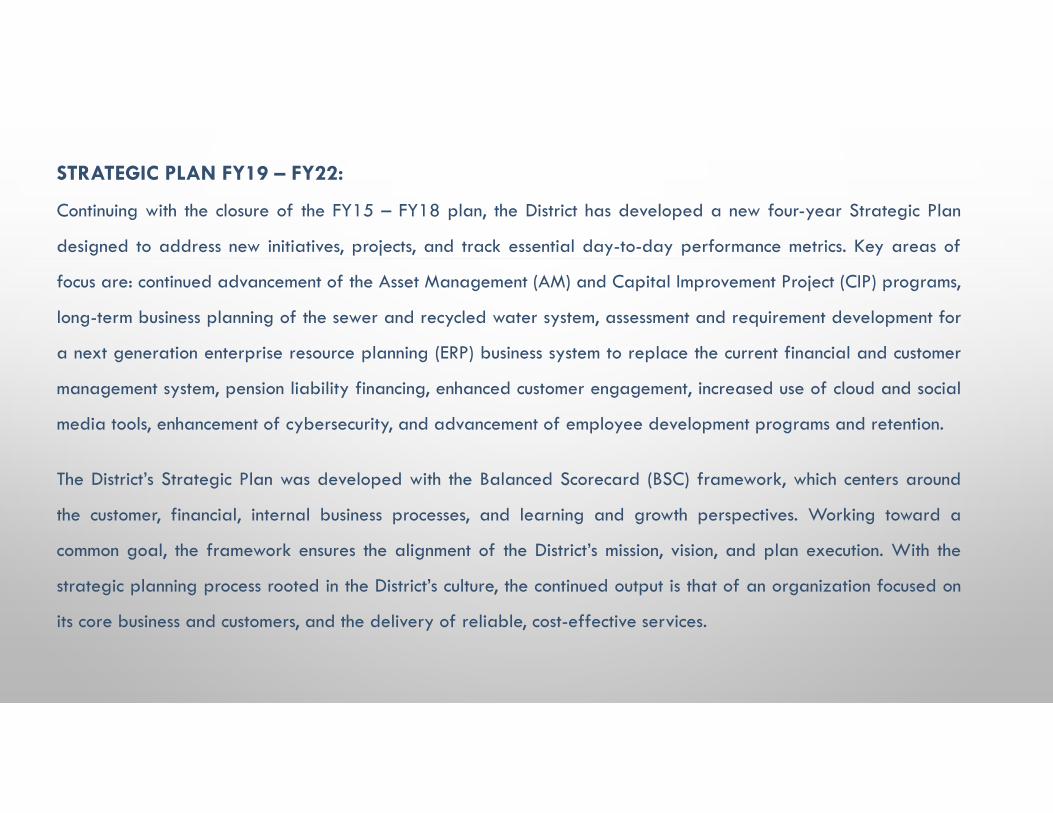


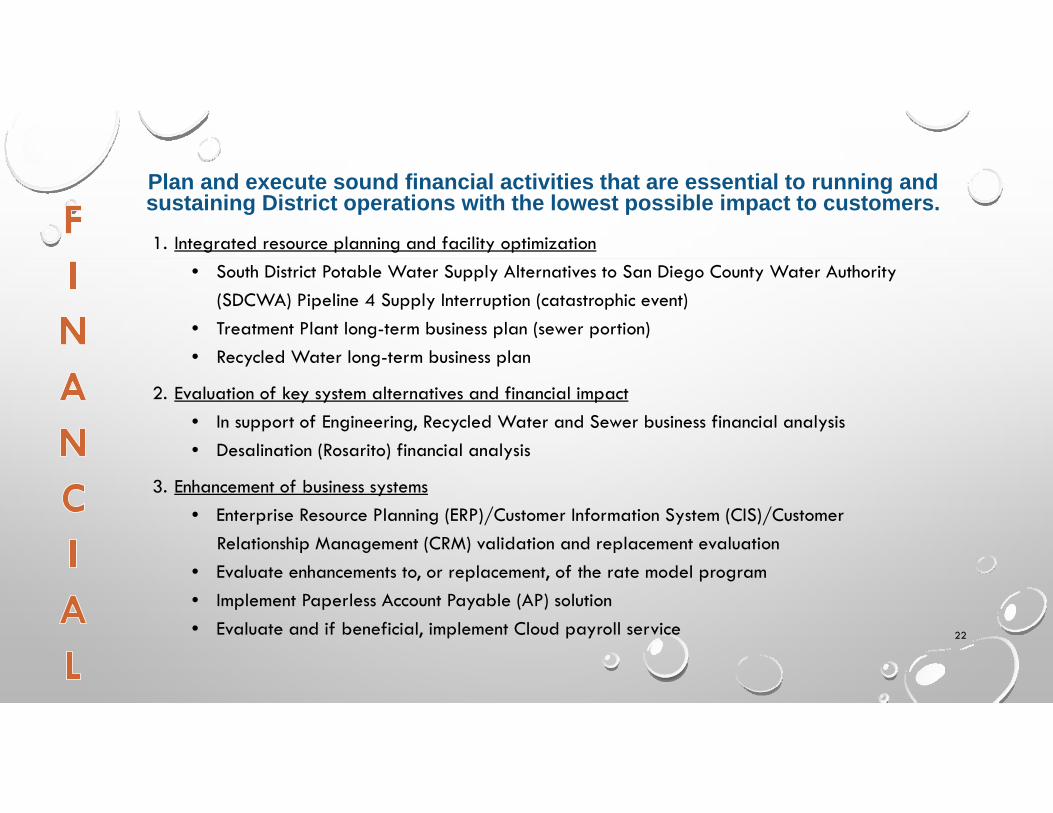


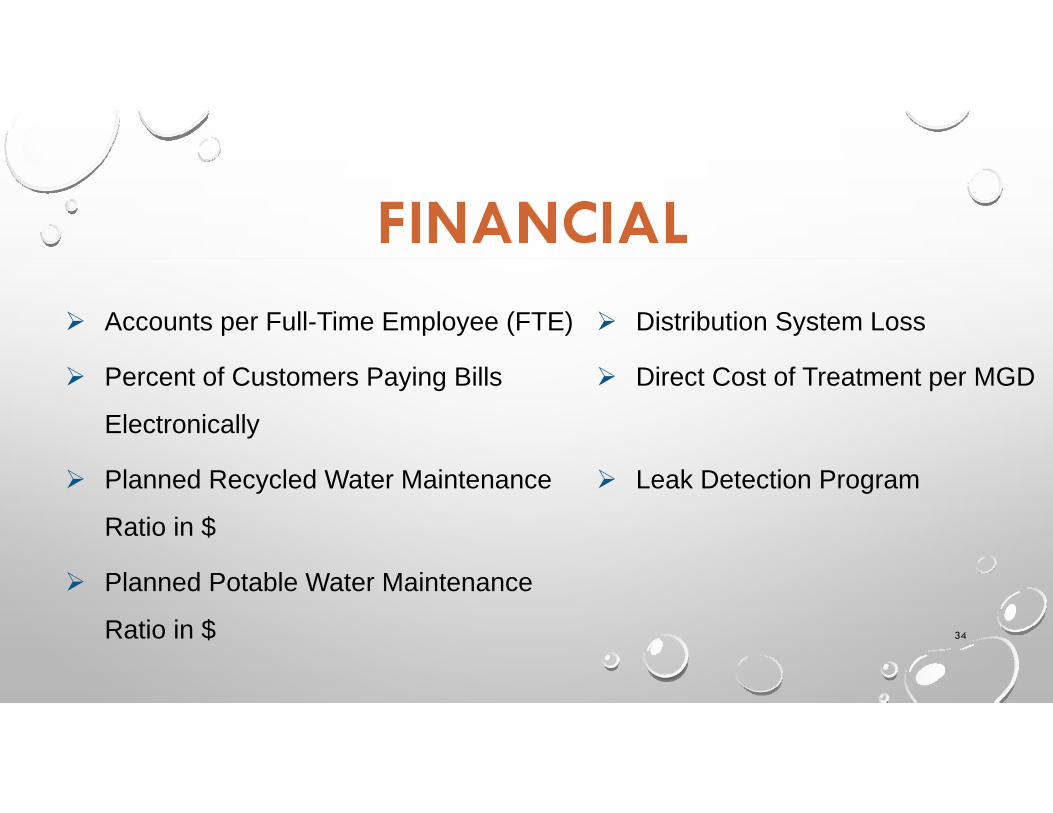


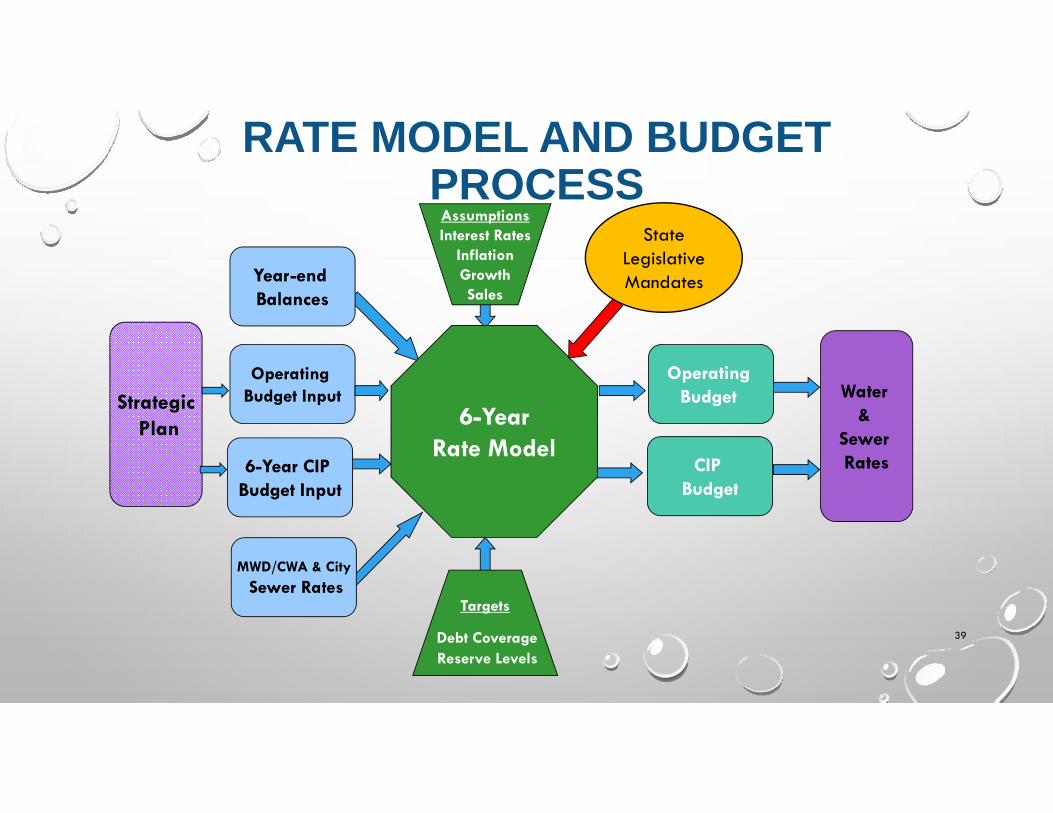


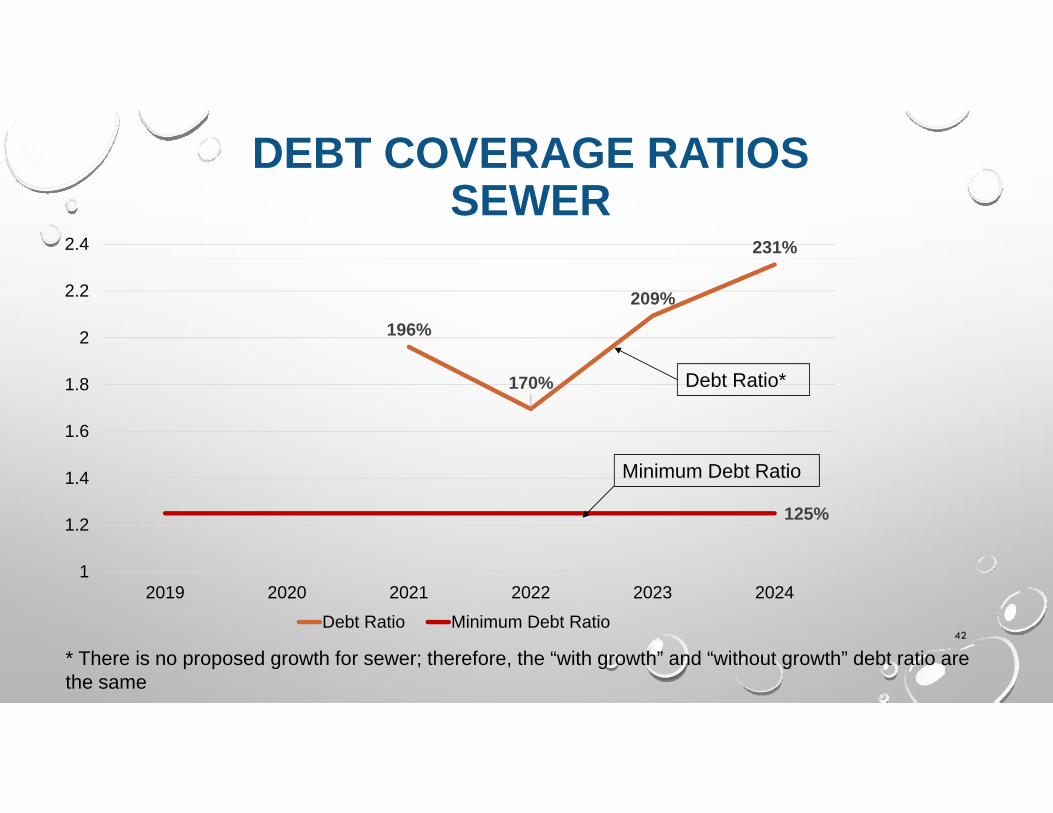


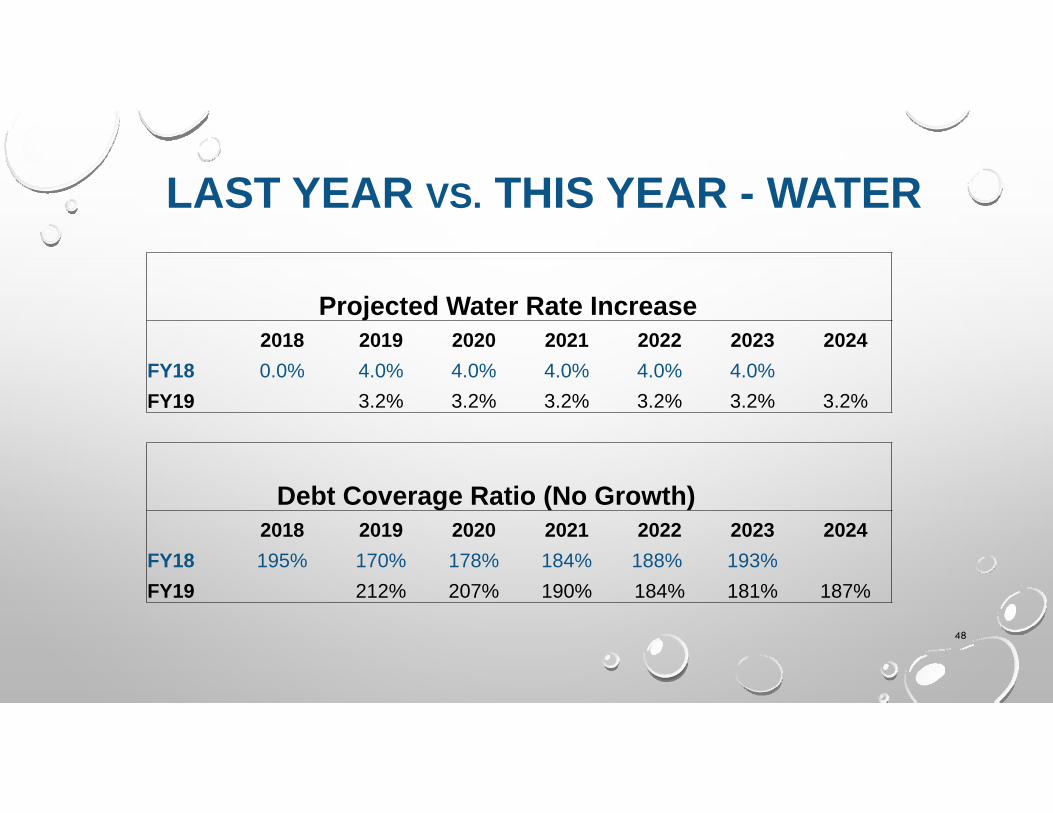


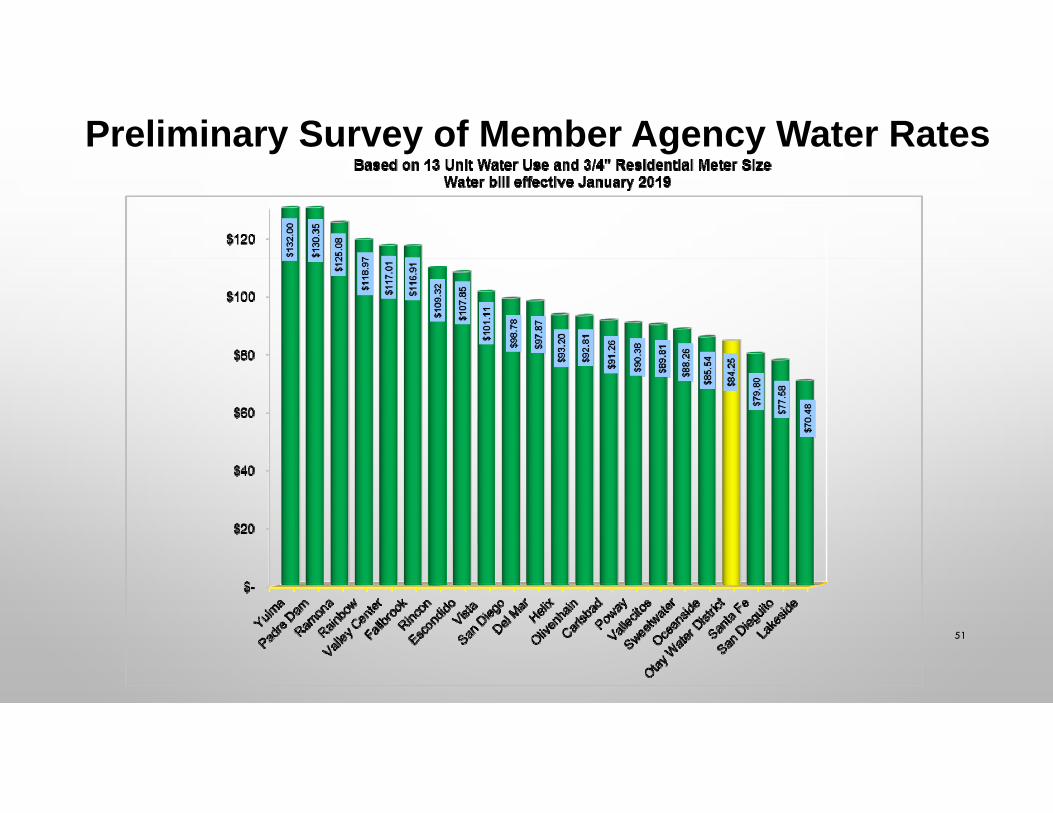


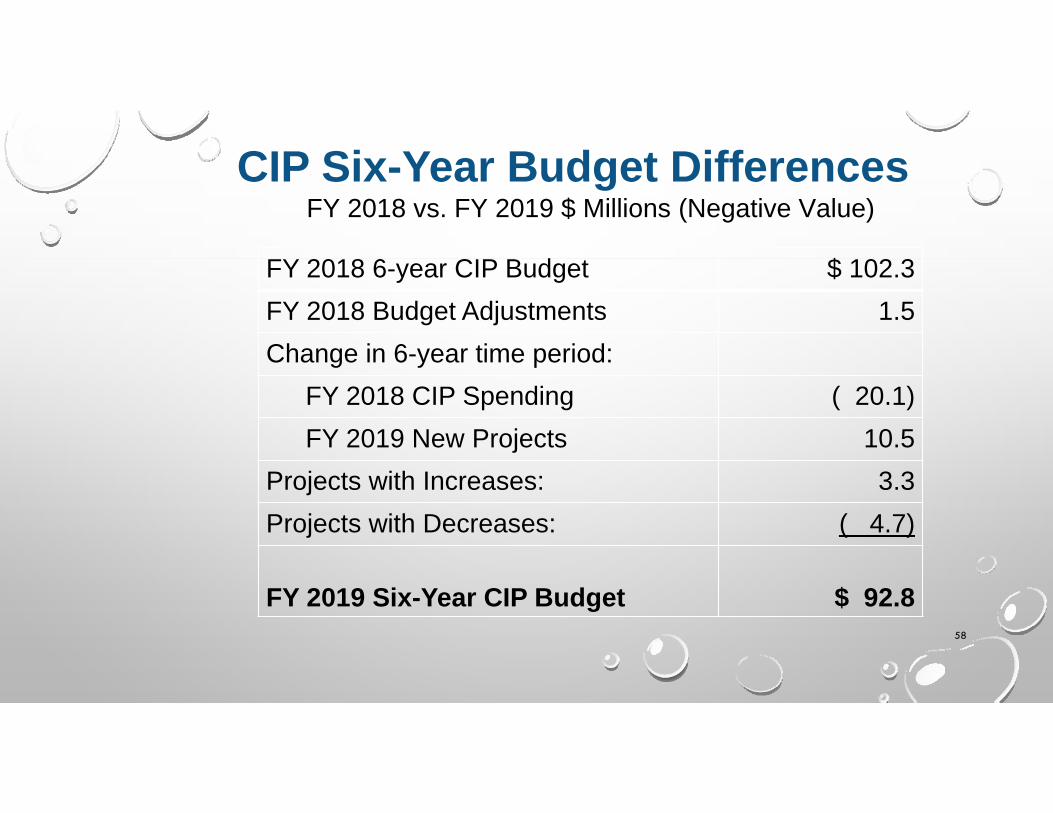


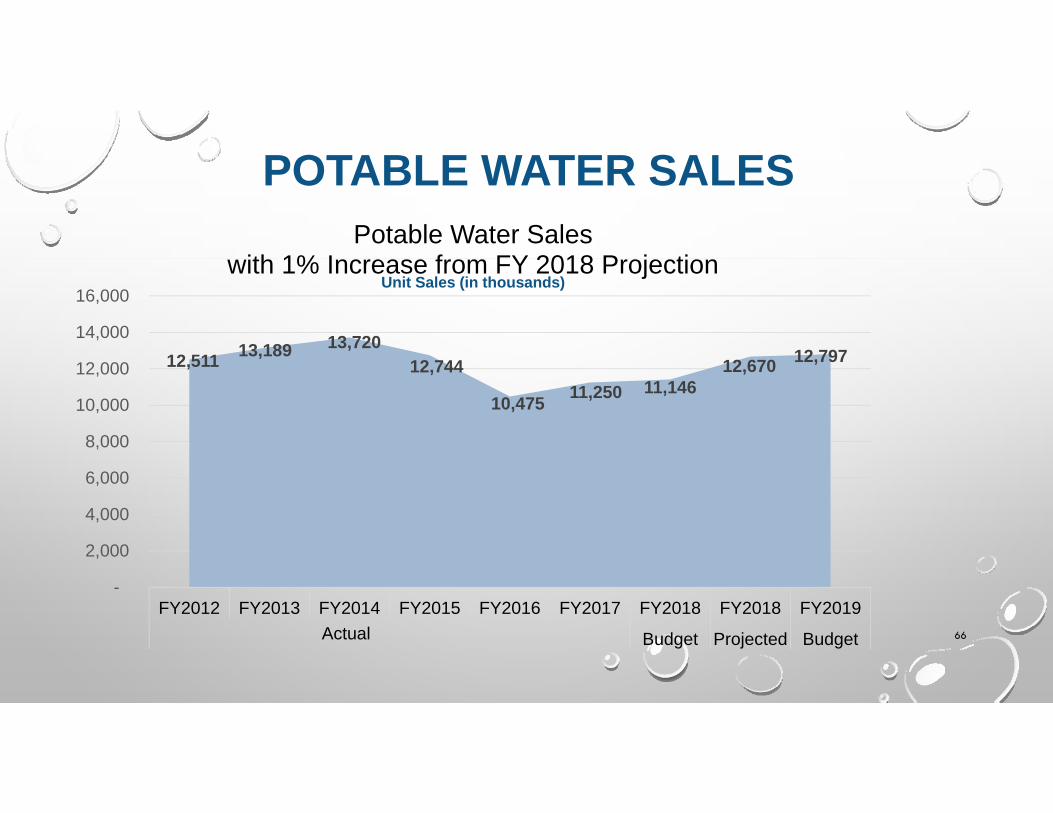


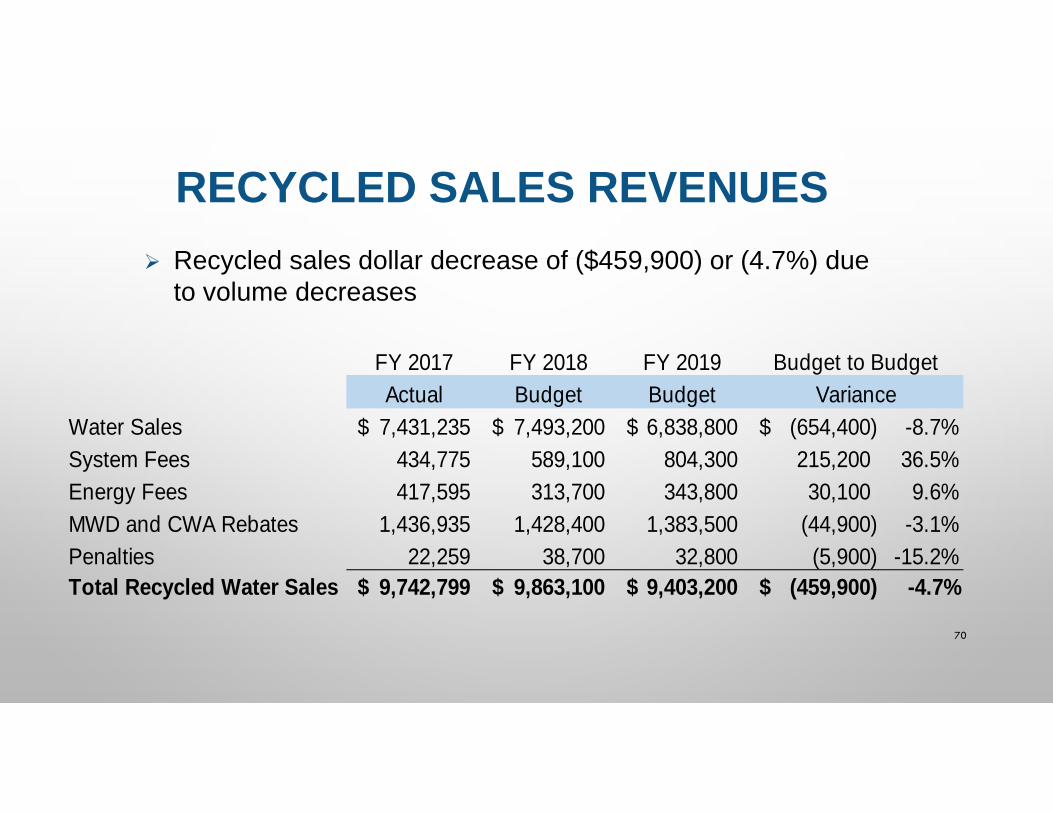


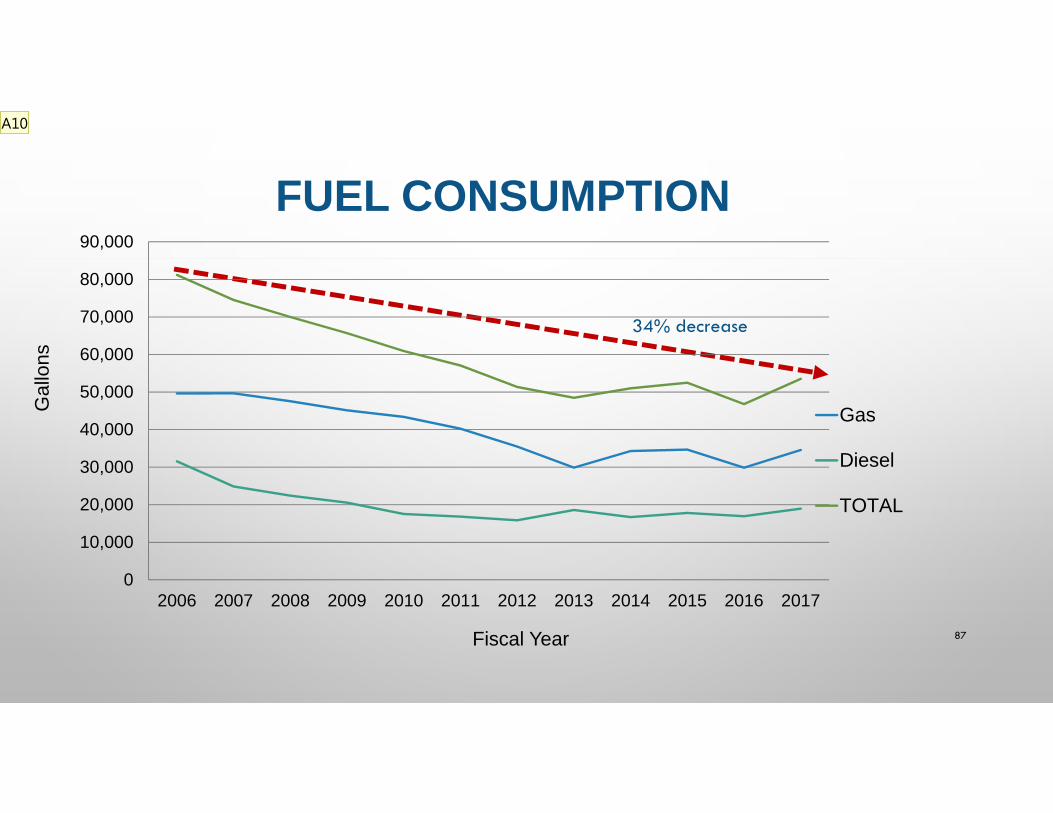


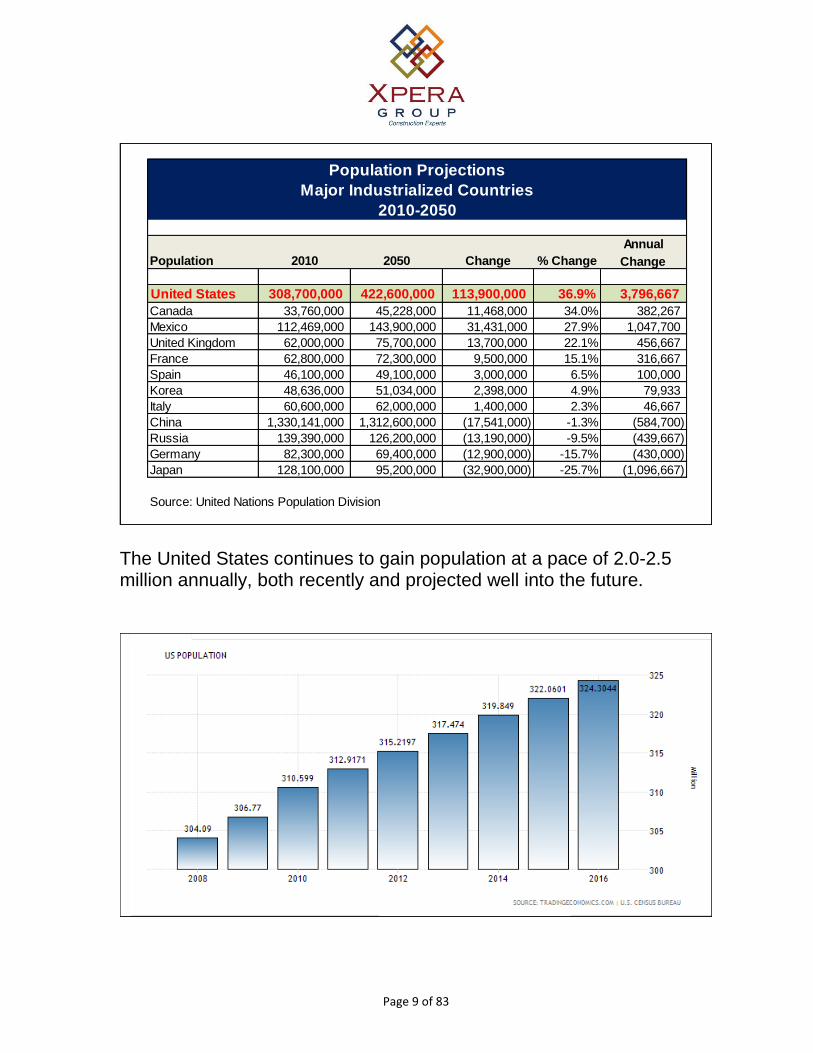


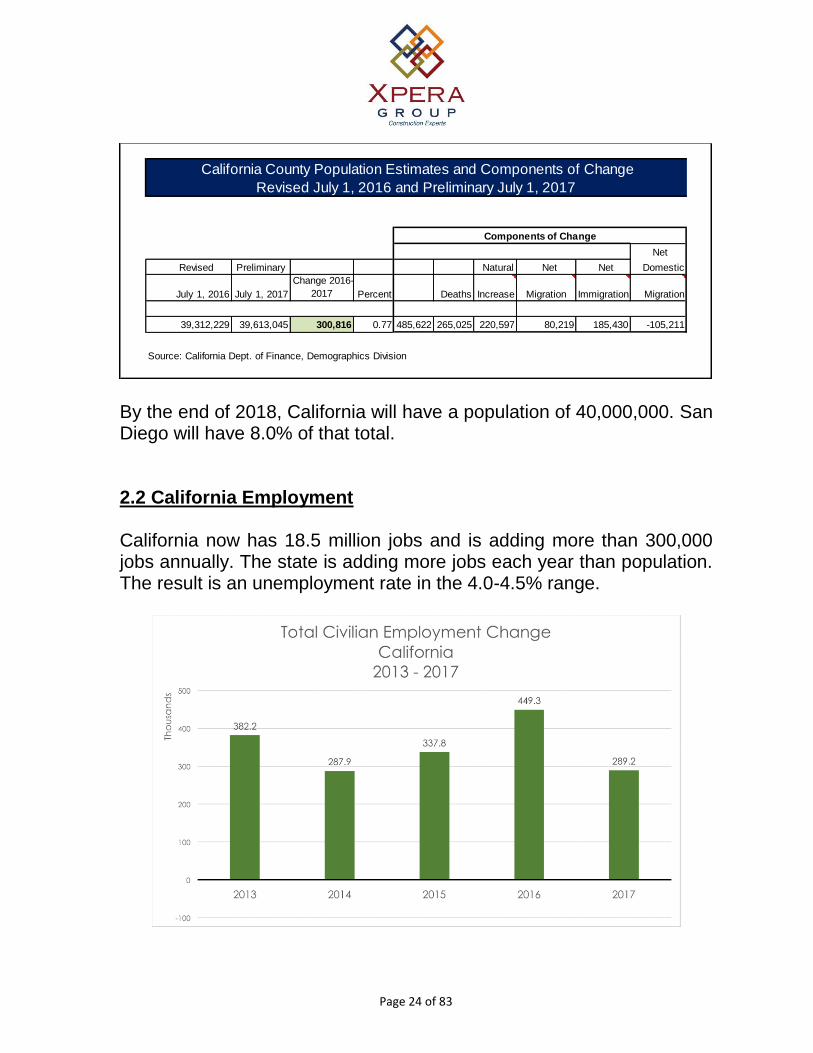


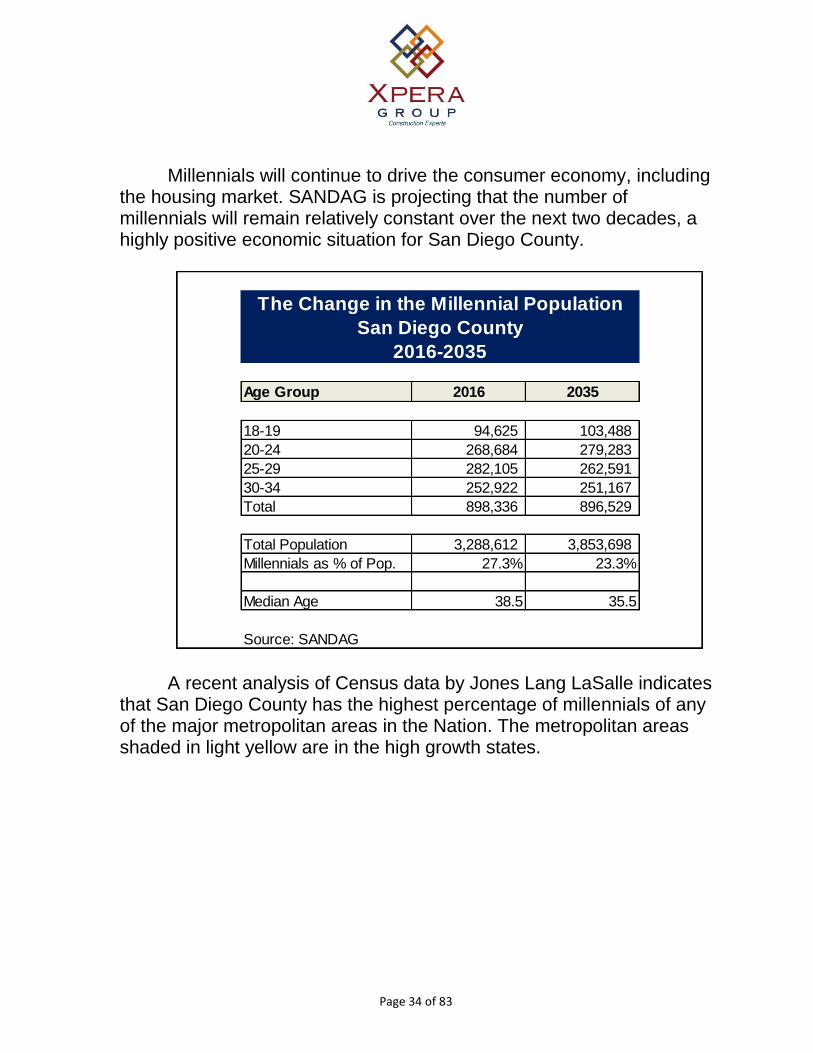
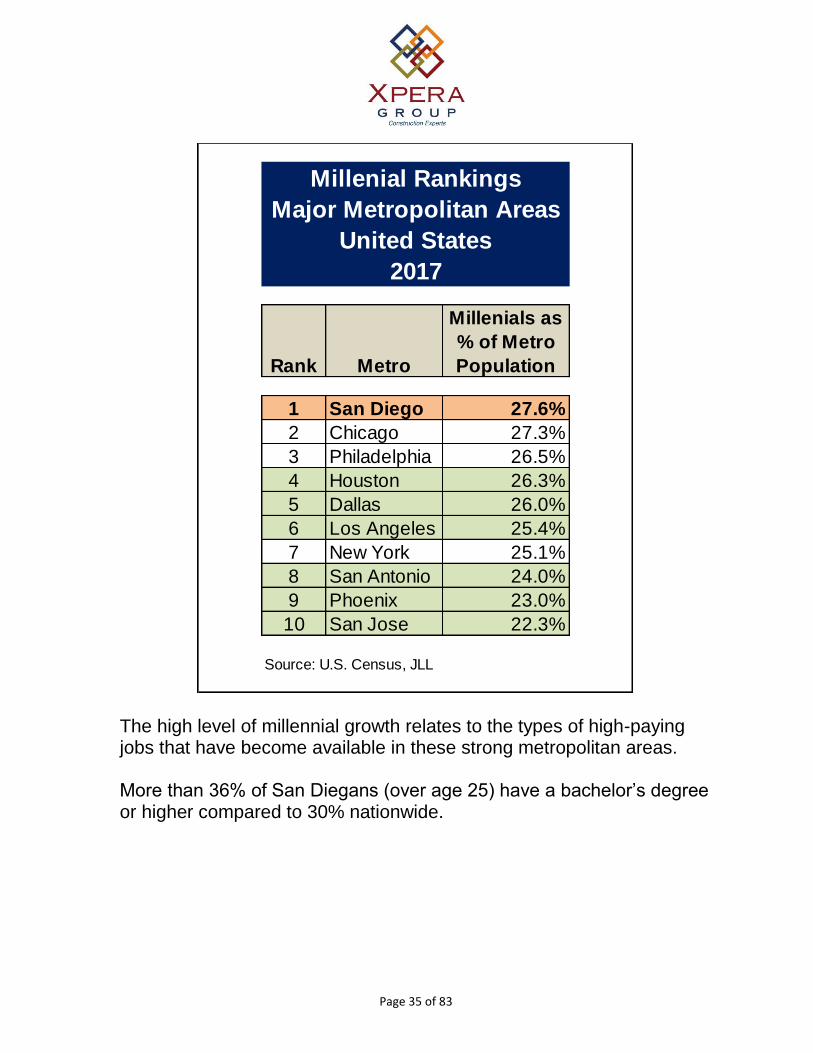


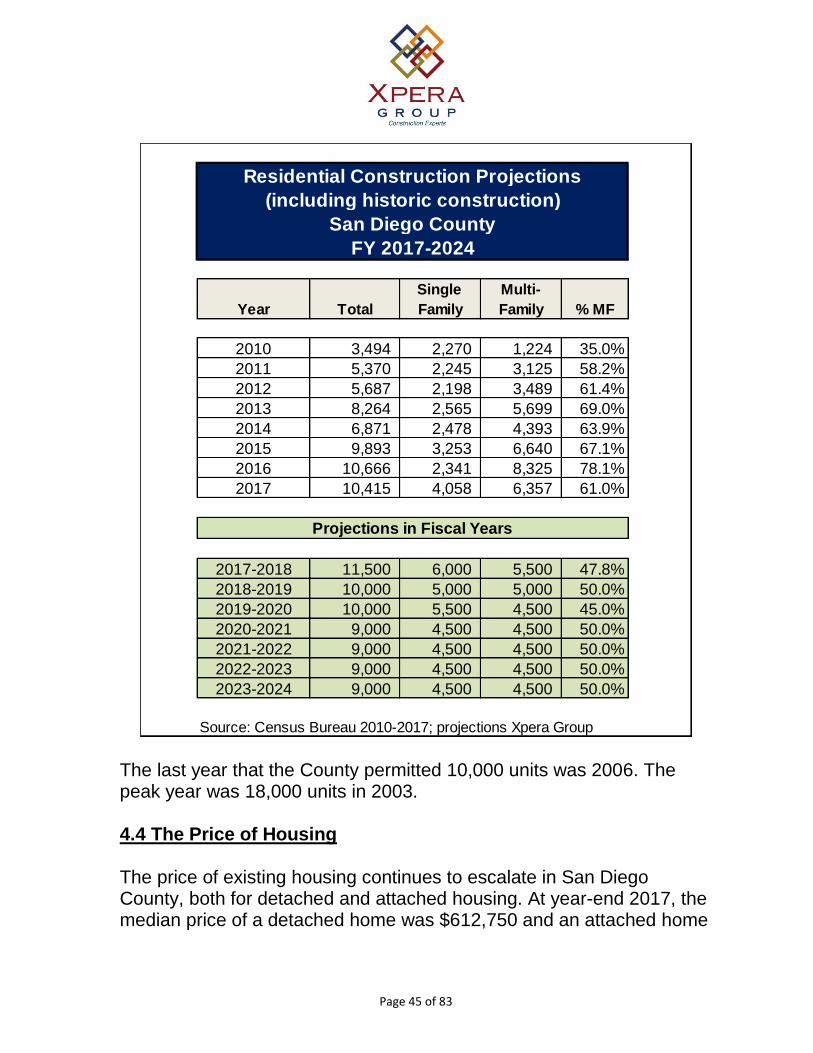


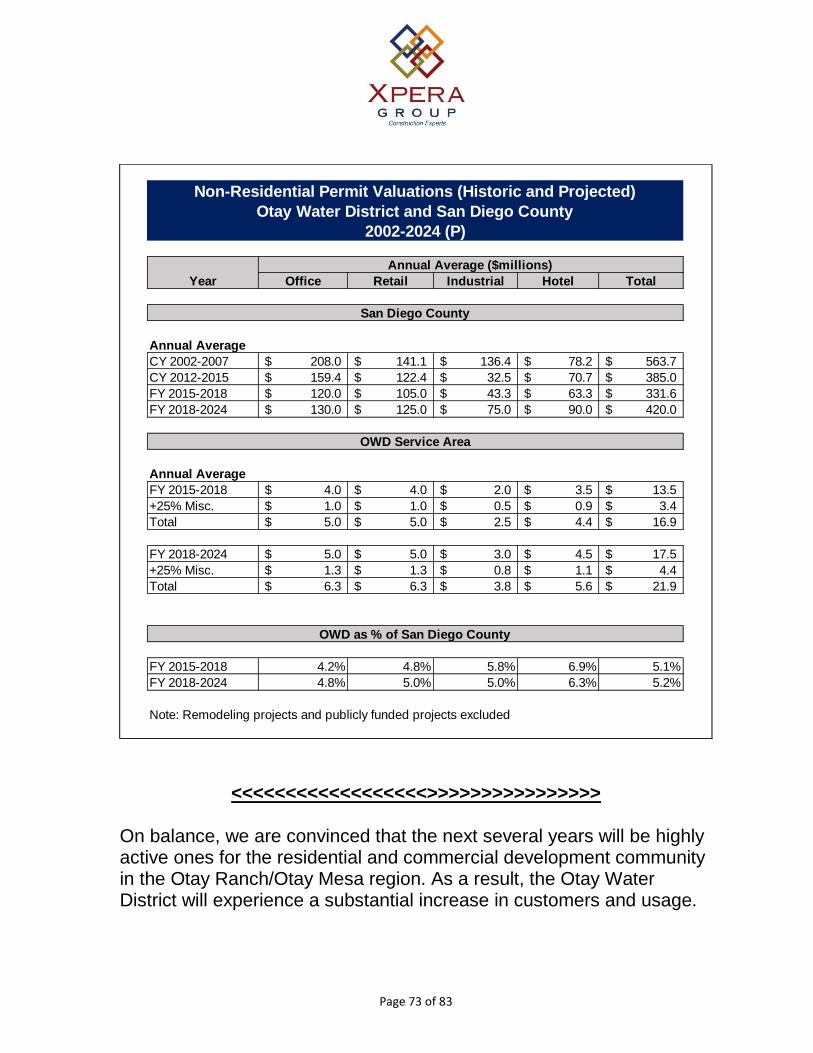

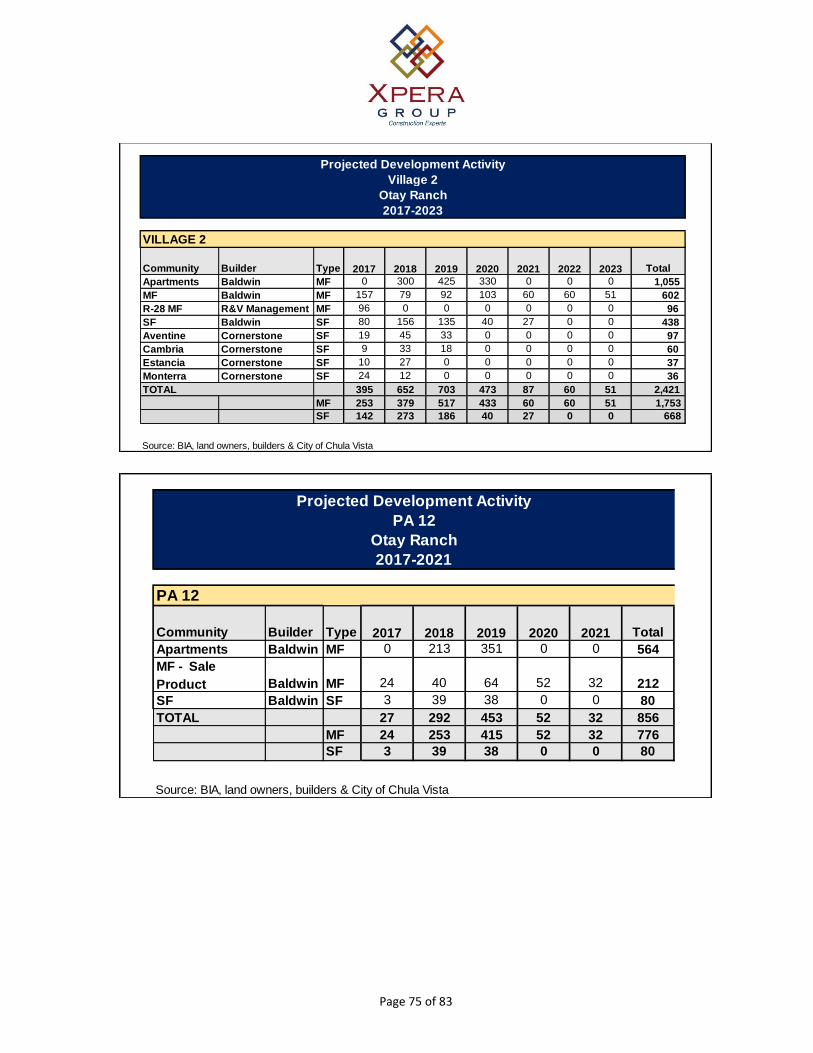
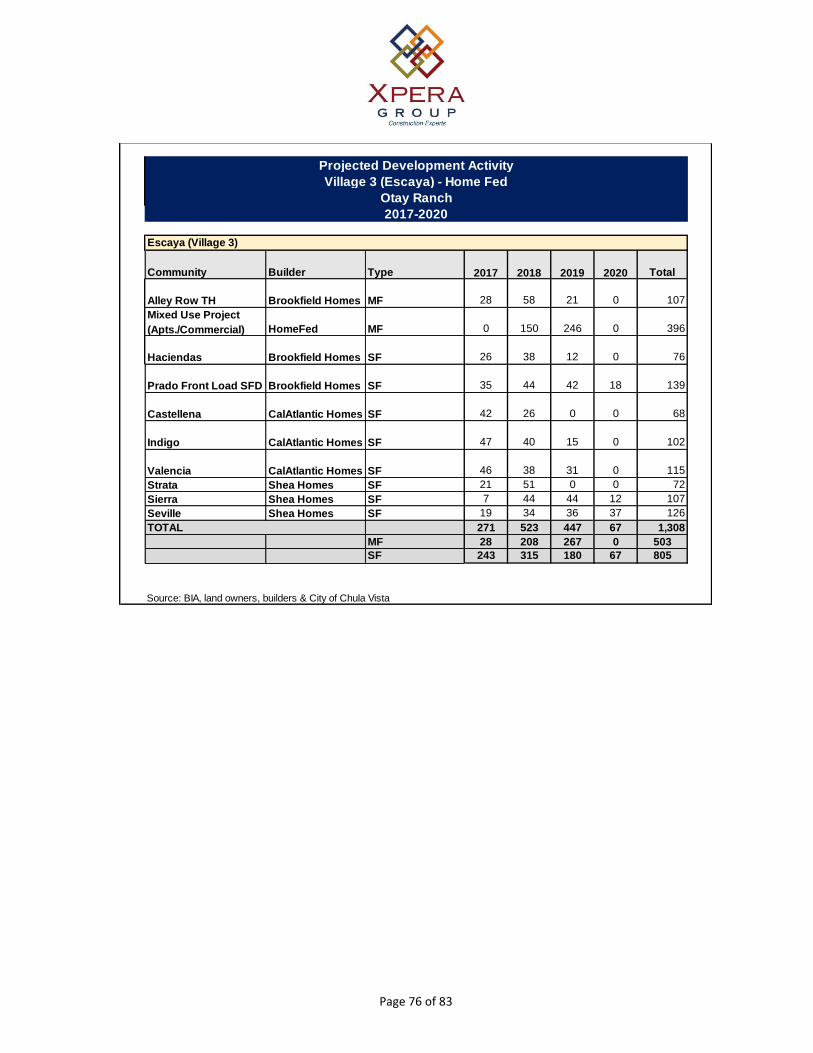

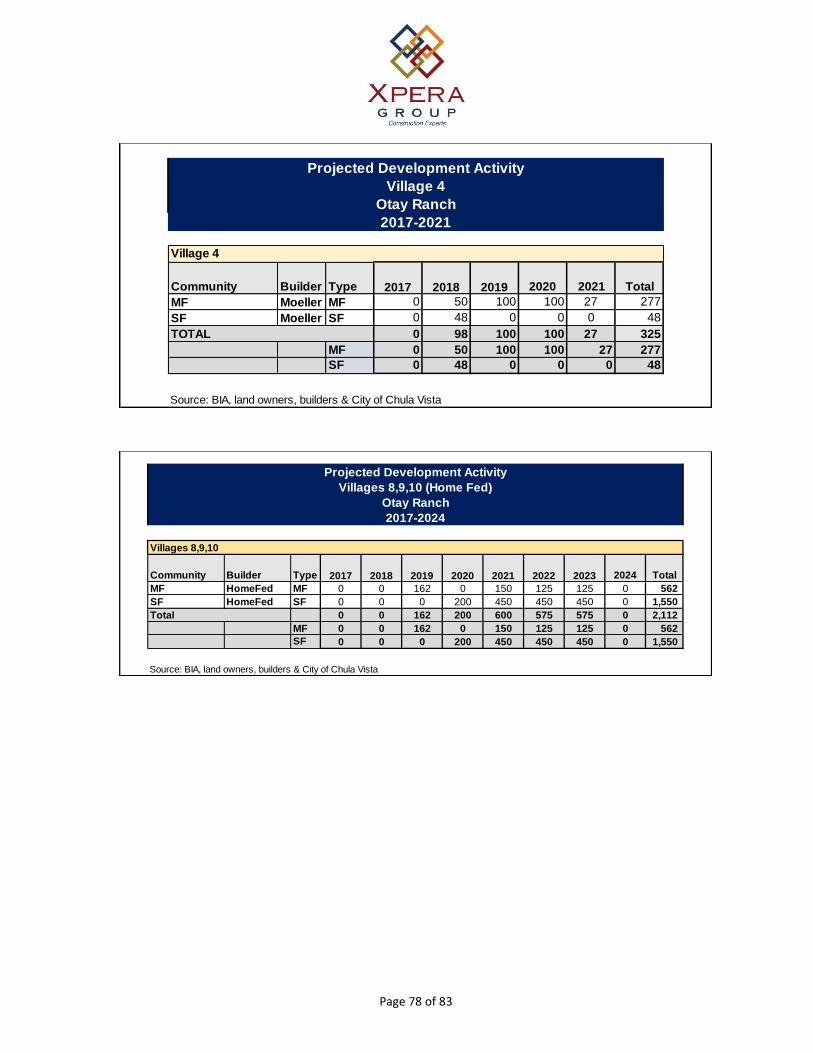

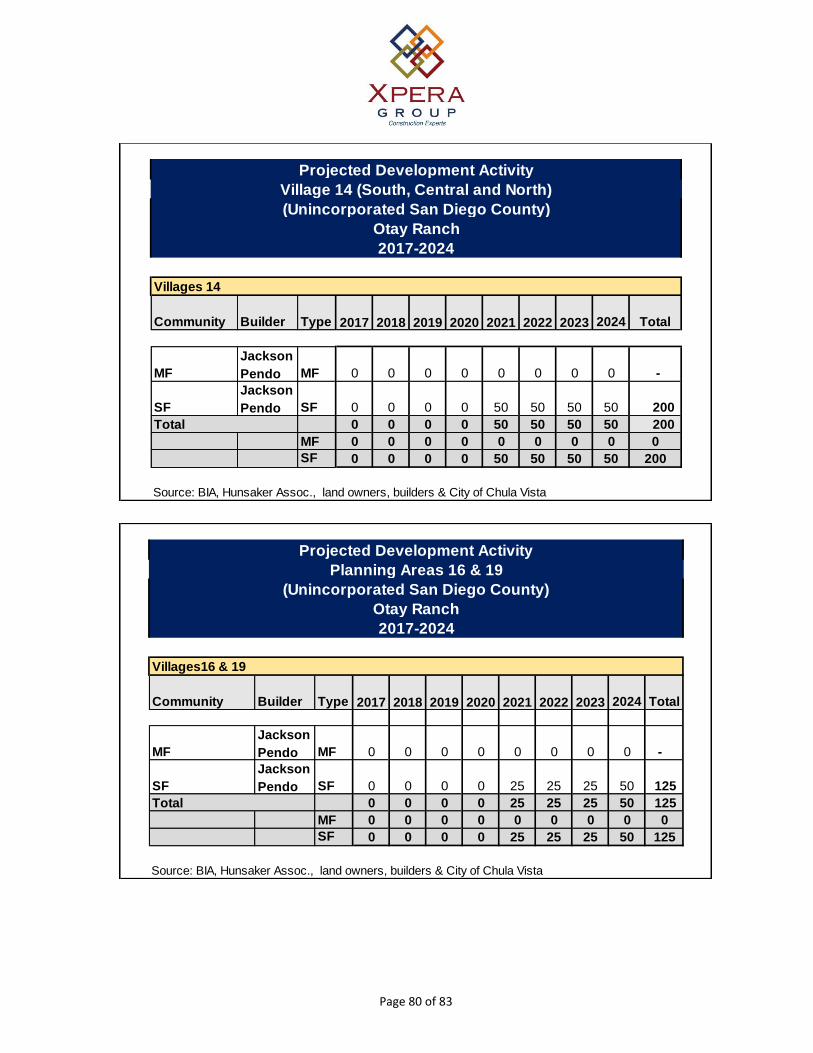


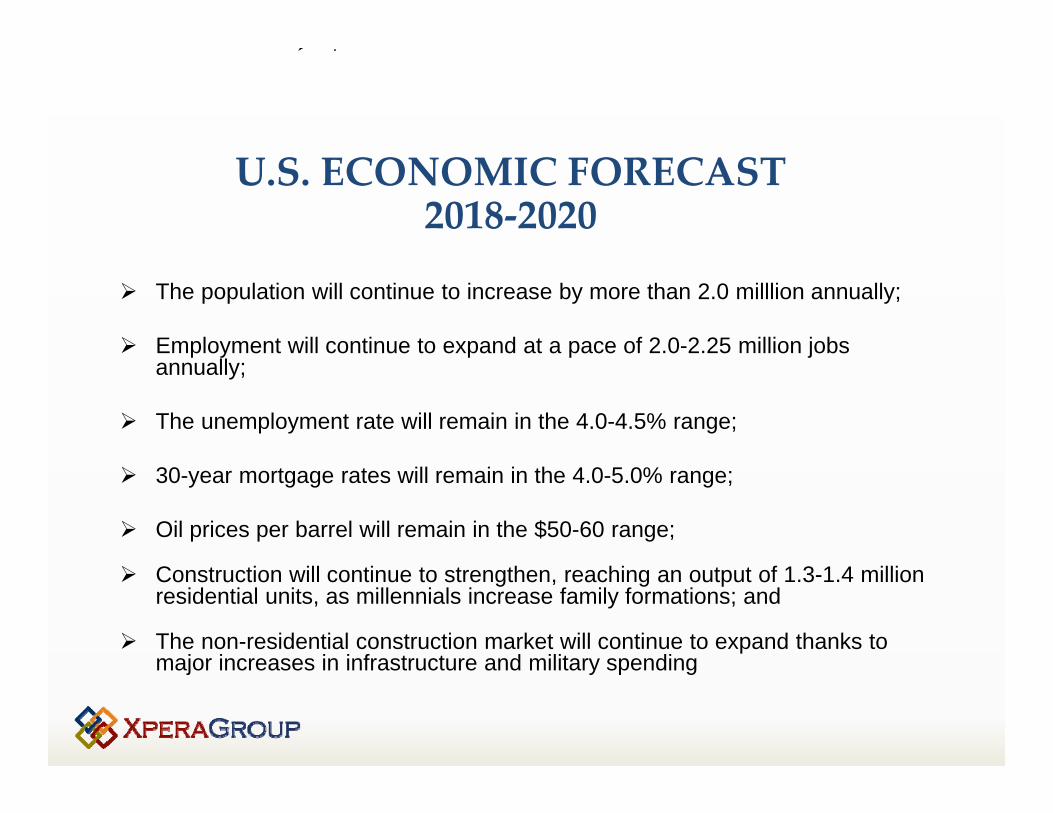


![ScanJob - math.sci.tu.ac.thmath.sci.tu.ac.th/file_pdf/54_05_5_Research[1].pdf · 0516.56/Q 409 1130 3 1 ifflî.02-5644440 1818 30 2554 2554 LitJu uu 2554 4 16 2554 "matJ) t ms-](https://static.documents.pub/doc/80x56/5e22a8d64b023f3ca330e172/scanjob-mathscituac-1pdf-051656q-409-1130-3-1-iffl02-5644440-1818.jpg)


