181

OVERVIEW
Page 1
Executive Summary _________________________________________________________________ 2
Snapshot of our City ________________________________________________________________ 4
Fast Facts about Charles Sturt in 2018/19 ________________________________________________ 5
Key Financials – Overview ____________________________________________________________ 6
About Council – Council Members _____________________________________________________ 8
Council and Committee Structure from July 2018 to November 2018 (pre-election) _____________ 12
Council and Committee Structure from November 2018 to June 2019 (post-election) ____________ 14
Committees from July 2018 to June 2019 (pre-election) ___________________________________ 16
Other Legislated Committees from July to November 2018 _________________________________ 26
Council Member Allowances _________________________________________________________ 29
Representation & Elections __________________________________________________________ 32
Management & Staffing _____________________________________________________________ 34
Leadership Team Salary Packages _____________________________________________________ 35
Corporate Indicators 2018/19 ________________________________________________________ 38
Finances & Accountability ___________________________________________________________ 71
OVERVIEW
Page 2
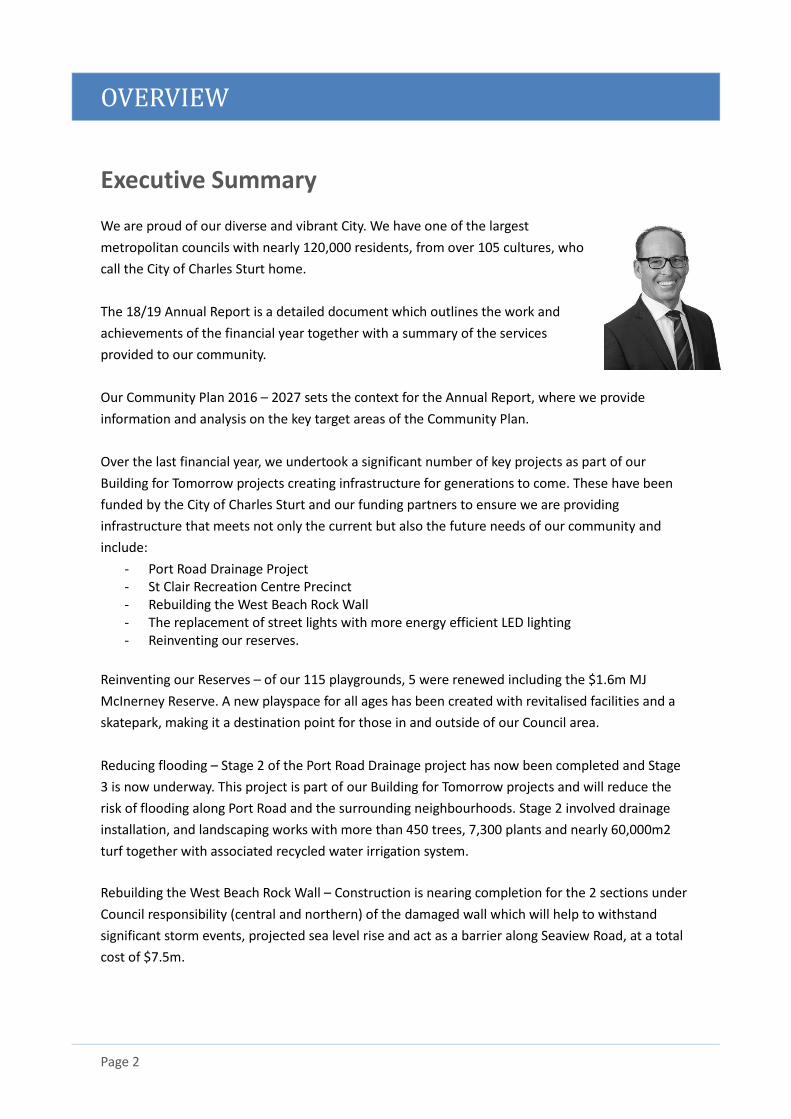
Executive Summary
We are proud of our diverse and vibrant City. We have one of the largest
metropolitan councils with nearly 120,000 residents, from over 105 cultures, who
call the City of Charles Sturt home.
The 18/19 Annual Report is a detailed document which outlines the work and
achievements of the financial year together with a summary of the services
provided to our community.
Our Community Plan 2016 – 2027 sets the context for the Annual Report, where we provide
information and analysis on the key target areas of the Community Plan.
Over the last financial year, we undertook a significant number of key projects as part of our
Building for Tomorrow projects creating infrastructure for generations to come. These have been
funded by the City of Charles Sturt and our funding partners to ensure we are providing
infrastructure that meets not only the current but also the future needs of our community and
include:
- Port Road Drainage Project - St Clair Recreation Centre Precinct - Rebuilding the West Beach Rock Wall - The replacement of street lights with more energy efficient LED lighting - Reinventing our reserves.
Reinventing our Reserves – of our 115 playgrounds, 5 were renewed including the $1.6m MJ
McInerney Reserve. A new playspace for all ages has been created with revitalised facilities and a
skatepark, making it a destination point for those in and outside of our Council area.
Reducing flooding – Stage 2 of the Port Road Drainage project has now been completed and Stage
3 is now underway. This project is part of our Building for Tomorrow projects and will reduce the
risk of flooding along Port Road and the surrounding neighbourhoods. Stage 2 involved drainage
installation, and landscaping works with more than 450 trees, 7,300 plants and nearly 60,000m2
turf together with associated recycled water irrigation system.
Rebuilding the West Beach Rock Wall – Construction is nearing completion for the 2 sections under
Council responsibility (central and northern) of the damaged wall which will help to withstand
significant storm events, projected sea level rise and act as a barrier along Seaview Road, at a total
cost of $7.5m.
OVERVIEW
Page 3
Revitalising St Clair Recreation Centre – the state-of-the-art Centre is now open and is home to a
number of clubs as well as sporting groups and activities. We are now looking forward to
completing the outdoor precinct works which include roads and footpaths, a nature play space,
event area, 6 tennis courts and a skatepark, set for 19/20.
Our capital works program has also seen a budgeted investment of $94m into roads and footpaths,
traffic management initiatives, playground renewals, and upgrades of local sporting clubs,
supporting safety and recreation facilities.
This financial year we also completed the $240K Changing Places at Henley Beach, a facility for
those with a disability and their carers at Henley Beach. Coupled with beach mats and the beach
wheelchairs, has realised our commitment to make our beaches accessible to all.
Our upgraded Waste Management Centre at Beverly has resulted in 40% more recycling diverted
from landfill, with $150k saved as well as 1,300 tonnes less of waste being disposed.
From a financial perspective, all this was achieved while delivering a rate rise of 2.0% and debt
levels that remain well within target parameters. We also continued with our strategy to again
deliver an operating surplus, ensuring Council remains financially sustainable over the long term.
Through community connections we provide five libraries, seven community centres with
programs, events and resources. This year we encouraged our local community to connect,
discover and be inspired by their local library.
We value our community’s contributions, whether it be our wonderful volunteers who have
contributed 23,000 hours, those who belong to a club, who visit and interact with one another at
our community centres, libraries and open spaces all help shape our community.
Thank you also to the Elected Council who have a continued vision to create such a wonderful
place, and to our staff who have worked passionately to deliver on that vision. Lastly thank you to
our community members, both residents and businesses for your contribution to making Charles
Sturt such an inclusive and desirable place to live, work or visit.
CEO PAUL SUTTON
ABOUT COUNCIL
Page 4
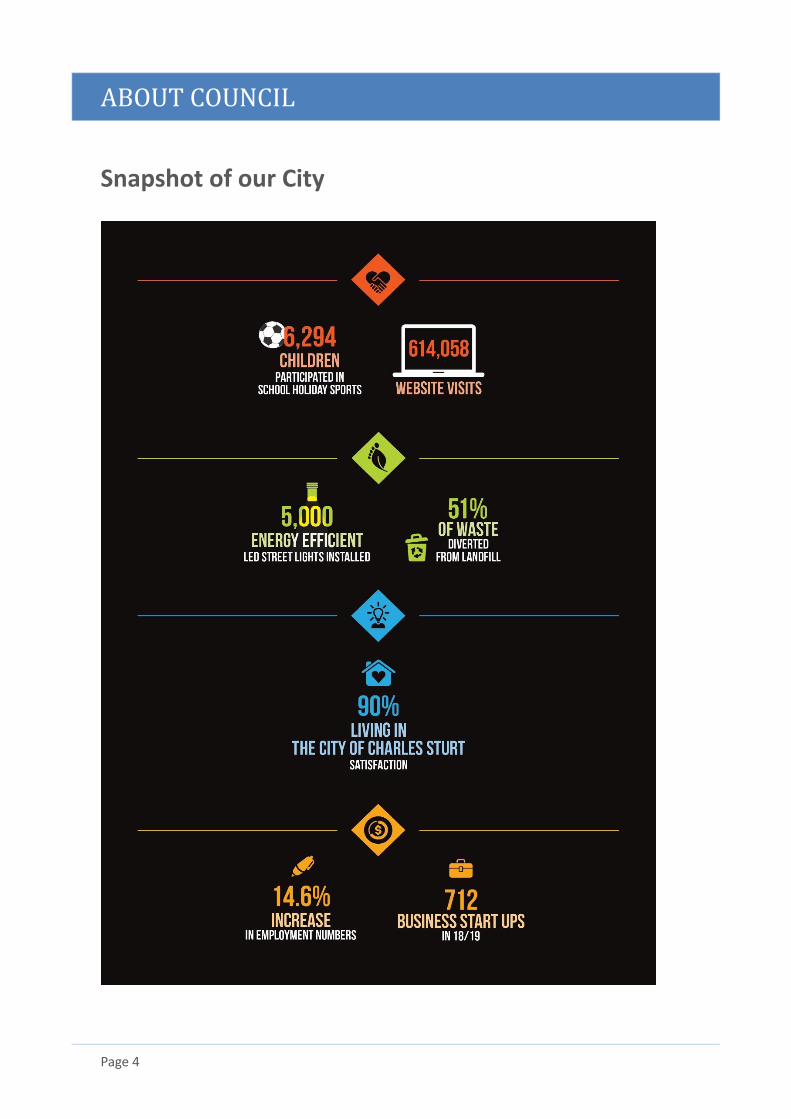
Snapshot of our City
ABOUT COUNCIL
Page 5
Fast Facts about Charles Sturt in 2018/19
Mayor Angela Evans
Chief Executive Officer Paul Sutton
Staff 441.33 full time equivalent (FTE) staff as at 30 June 2019. Key Statistics
• Total Area – 5,557 hectares
• Length of coast – 11.5km
• Length of roadway (approx.) – 557km of sealed
roads
• Open space (approx.) – 424 parks and reserves
contributing to a total 435.5 hectares of open space
Key Locations
• Civic Centre and Library
72 Woodville Road, Woodville 5011
• Beverley Centre
66 East Avenue, Beverley 5009
• Hindmarsh Library
149 Port Road, Hindmarsh 5007
• Henley Beach Library
378 Seaview Road, Henley Beach 5022
• Findon Library
Cnr Findon and Grange Roads, Findon 5023
• West Lakes Library
Cnr West Lakes Boulevard and Brebner Drive,
West Lakes 5021
• Seaton North Neighbourhood Centre
16 Cairns Avenue, Seaton 5023.
• Bower Cottages Community Centre Inc
200 Bower Road, Semaphore Park 5019
• Cheltenham Community Centre Inc
62 Stroud Street North, Cheltenham 5014
(Cheltenham Station)
• Findon Community Centre
222 Findon Road, Findon 5023
(Bus stop 214)
• Henley & Grange Community Centre
196A Military Road, Henley Beach 5022
• West Lakes Community Centre
Cnr Brebner Drive and West Lakes Boulevard,
West Lakes 5021
• Youth Central
The Brocas, 111 Woodville Road, St Clair
• 19 on Green
Bowden Brompton Community Centre
19 Green Street, Brompton 5007
ABOUT COUNCIL
Page 6
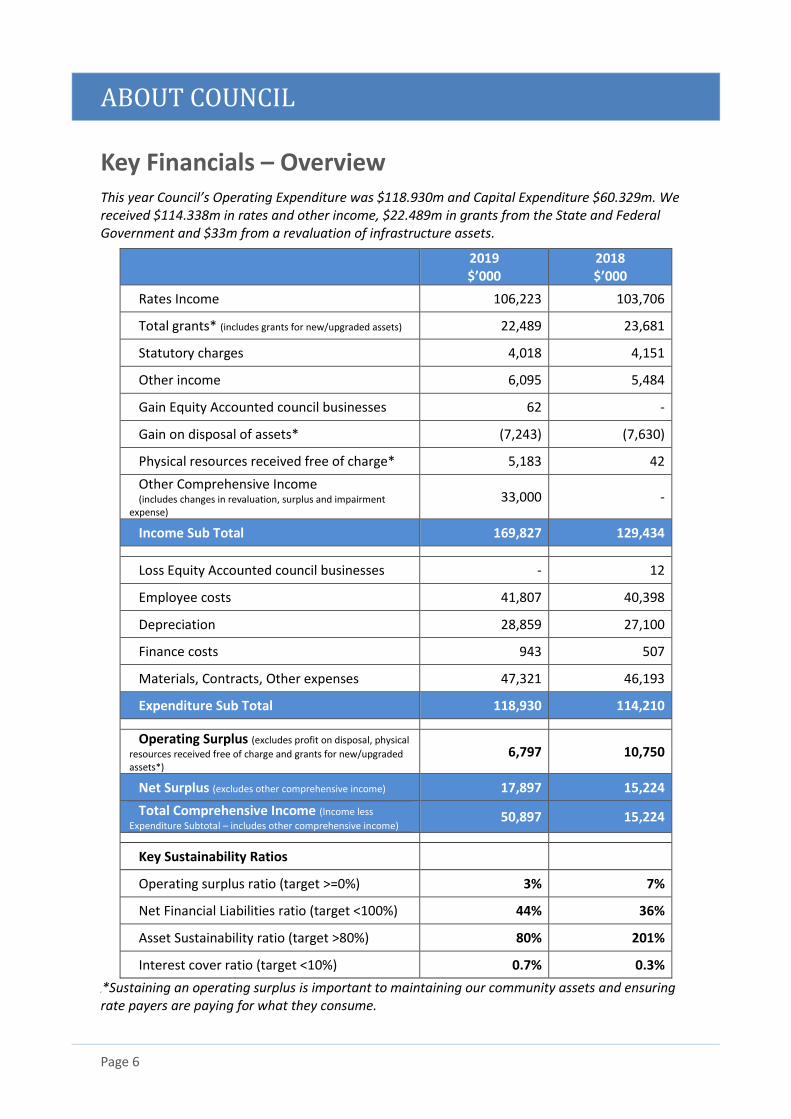
Key Financials – Overview This year Council’s Operating Expenditure was $118.930m and Capital Expenditure $60.329m. We received $114.338m in rates and other income, $22.489m in grants from the State and Federal Government and $33m from a revaluation of infrastructure assets.
2019 $’000
2018 $’000
Rates Income 106,223 103,706
Total grants* (includes grants for new/upgraded assets) 22,489 23,681
Statutory charges 4,018 4,151
Other income 6,095 5,484
Gain Equity Accounted council businesses 62 -
Gain on disposal of assets* (7,243) (7,630)
Physical resources received free of charge* 5,183 42
Other Comprehensive Income (includes changes in revaluation, surplus and impairment
expense)
33,000 -
Income Sub Total 169,827 129,434
Loss Equity Accounted council businesses - 12
Employee costs 41,807 40,398
Depreciation 28,859 27,100
Finance costs 943 507
Materials, Contracts, Other expenses 47,321 46,193
Expenditure Sub Total 118,930 114,210
Operating Surplus (excludes profit on disposal, physical
resources received free of charge and grants for new/upgraded assets*)
6,797 10,750
Net Surplus (excludes other comprehensive income) 17,897 15,224
Total Comprehensive Income (Income less
Expenditure Subtotal – includes other comprehensive income) 50,897 15,224
Key Sustainability Ratios
Operating surplus ratio (target >=0%) 3% 7%
Net Financial Liabilities ratio (target <100%) 44% 36%
Asset Sustainability ratio (target >80%) 80% 201%
Interest cover ratio (target <10%) 0.7% 0.3%
,*Sustaining an operating surplus is important to maintaining our community assets and ensuring rate payers are paying for what they consume.
ABOUT COUNCIL
Page 7
COUNCIL MEMBERS
Page 8
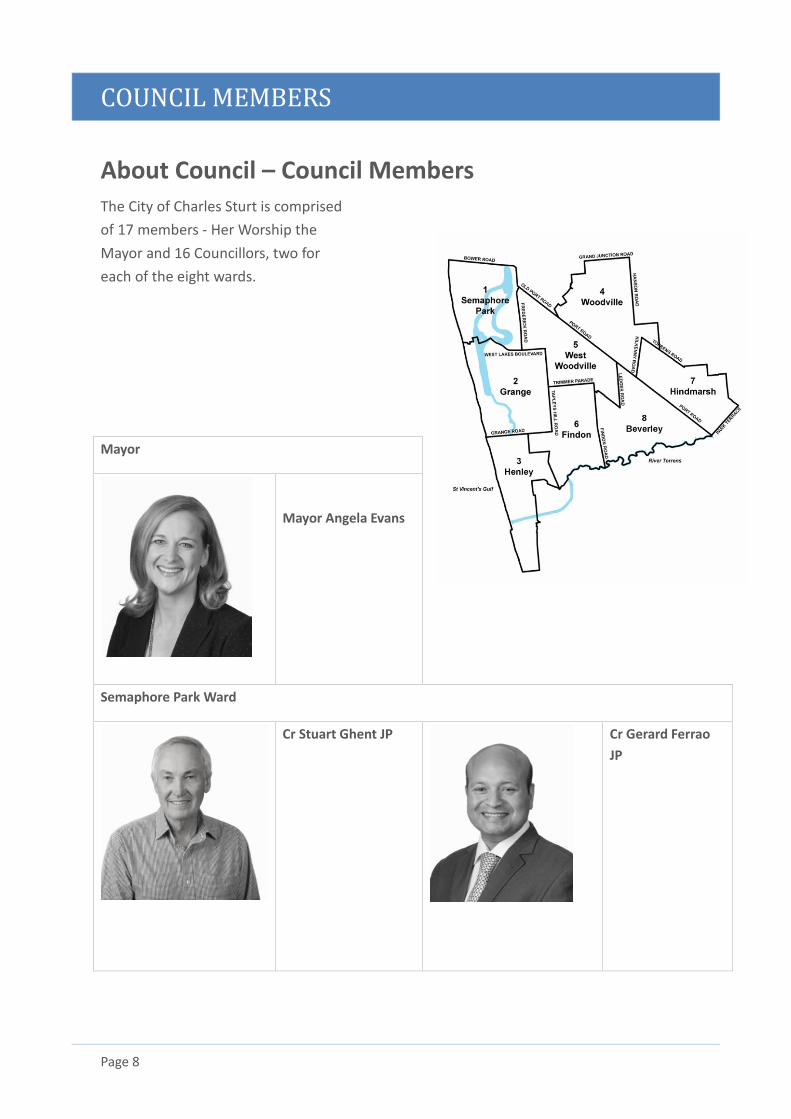
About Council – Council Members The City of Charles Sturt is comprised
of 17 members - Her Worship the
Mayor and 16 Councillors, two for
each of the eight wards.
Mayor
Mayor Angela Evans
Semaphore Park Ward
Cr Stuart Ghent JP
Cr Gerard Ferrao
JP
COUNCIL MEMBERS
Page 9
Grange Ward
Cr Tom Scheffler
Cr Sarah McGrath
Henley Ward
Cr Kenzie
van den Nieuwelaar
Cr Paul Sykes JP
Woodville Ward
Cr Oanh Nguyen
Cr Charlotte
Watson
COUNCIL MEMBERS
Page 10
West Woodville Ward
Cr Kelly Thomas
Cr Tolley Wasylenko JP
Findon Ward
Cr Helen Hibeljic
Cr George Turelli
Hindmarsh Ward
Cr Paul Alexandrides
Cr Alice Campbell
COUNCIL MEMBERS
Page 11
Beverley Ward
Cr Edgar Agius OAM,
JP
Cr Matt Mitchell
COUNCIL COMMITTEES & MEETINGS
Page 12
Council and Committee Structure from July 2018 to
November 2018 (pre-election)
Full Council
Presiding Member: Mayor Angela Evans
Membership: Mayor and all Councillors (Deputy Mayor elected)
Meets: Second and fourth Monday of each month at 7pm (except January and December where
only one meeting is held) to deal with:
• reports from Mayor, Council Members and Chief Executive;
• deputations, petitions, questions and motions on notice or without notice; and
• statutory business, committee reports and recommendations.
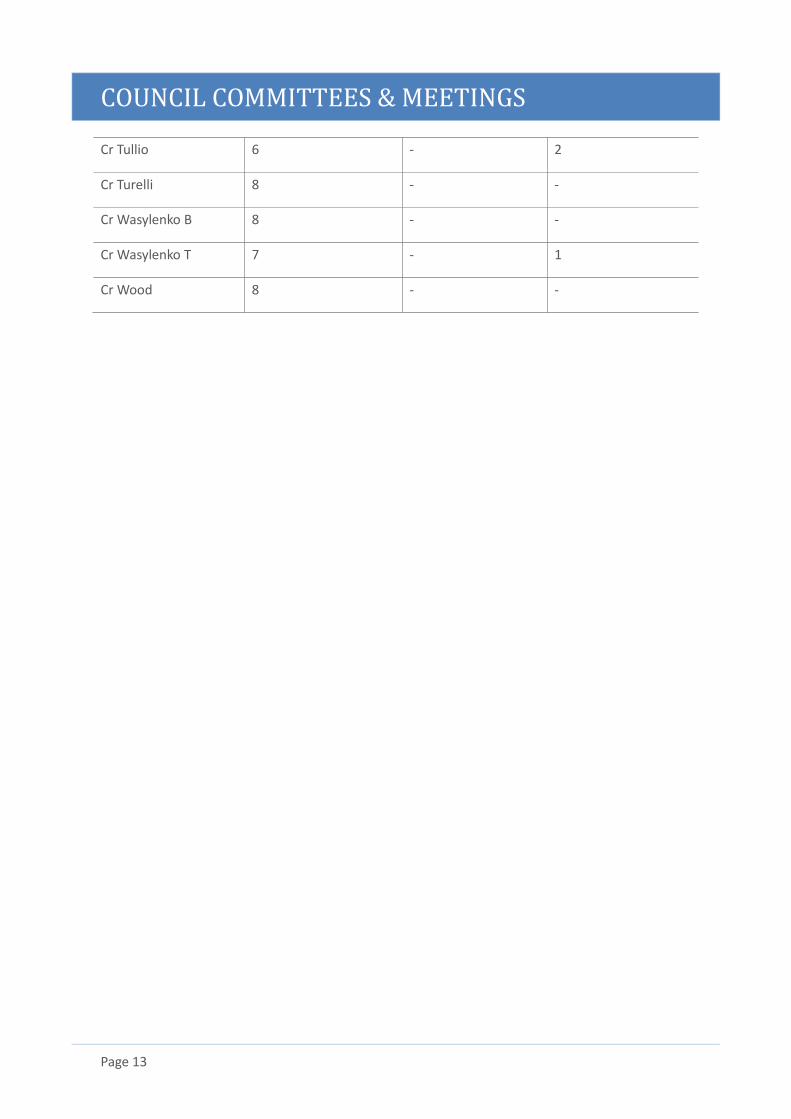
Full Council – Record of attendance from 1 July 2018 to 22 October 2018
Meetings attended
(of 8)
Leave of absence
granted
Apology recorded
Mayor Evans 8 - -
Cr Agius 7 - 1
Cr Alexandrides 5 - 3
Cr Campbell 7 - 1
Cr Ghent 8 - -
Cr Grant 5 1 2
Cr Harley 4 4 -
Cr Nguyen 8 - -
Cr Randall - 8 -
Cr Scheffler 5 3 -
Cr Sykes 6 - 2
Cr Thomas 8 - -
COUNCIL COMMITTEES & MEETINGS
Page 13
Cr Tullio 6 - 2
Cr Turelli 8 - -
Cr Wasylenko B 8 - -
Cr Wasylenko T 7 - 1
Cr Wood 8 - -

COUNCIL COMMITTEES & MEETINGS
Page 14
Council and Committee Structure from November
2018 to June 2019 (post-election)
Full Council
Presiding Member: Mayor Angela Evans
Membership: Mayor and all Councillors (Deputy Mayor elected)
Meets: Second and fourth Monday of each month at 7pm (except January and December where
only one meeting is held) to deal with:
• reports from Mayor, Council Members and Chief Executive;
• deputations, petitions, questions and motions on notice or without notice; and
• statutory business, committee reports and recommendations.
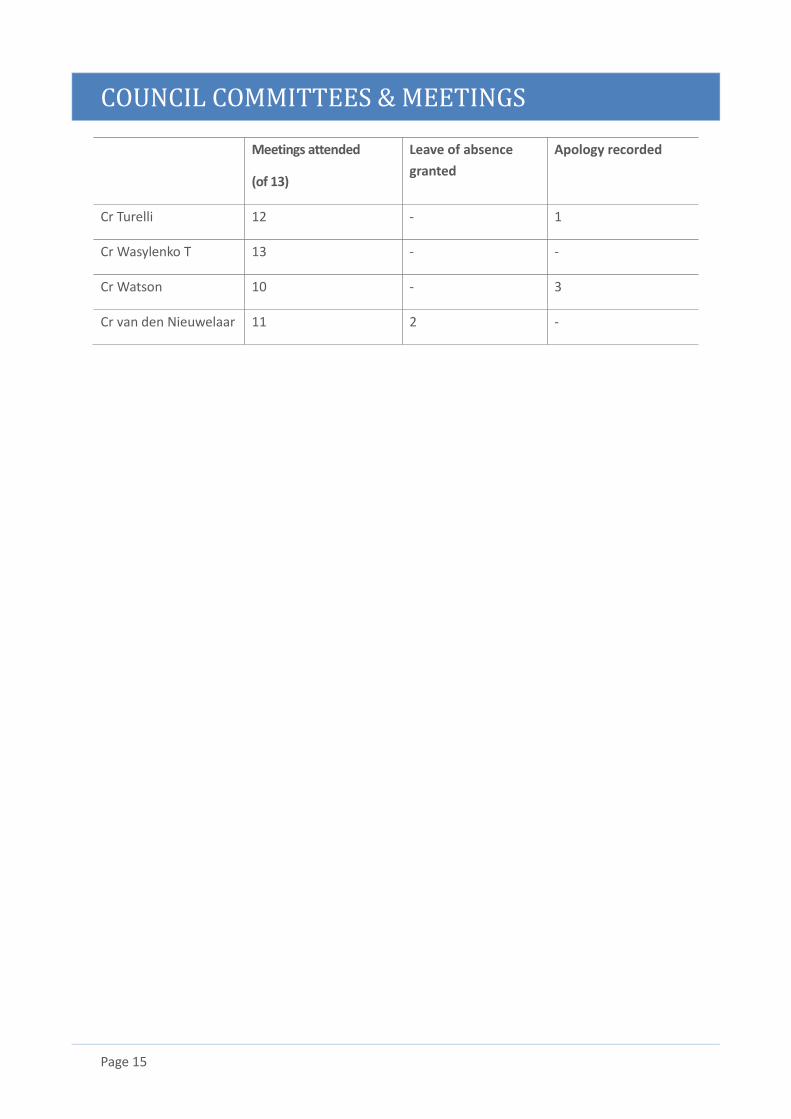
Full Council – Record of attendance from 26 November 2018 to 30 June 2019
Meetings attended
(of 13)
Leave of absence
granted
Apology recorded
Mayor Evans 13 - -
Cr Agius 12 - 1
Cr Alexandrides 11 - 2
Cr Campbell 9 - 4
Cr Ferrao 11 - 2
Cr Ghent 10 2 1
Cr Hibeljic 8 4 1
Cr McGrath 13 - -
Cr Mitchell 12 - 1
Cr Nguyen 13 - -
Cr Scheffler 11 2 -
Cr Sykes 11 - 2
Cr Thomas 13 - -
COUNCIL COMMITTEES & MEETINGS
Page 15
Meetings attended
(of 13)
Leave of absence
granted
Apology recorded
Cr Turelli 12 - 1
Cr Wasylenko T 13 - -
Cr Watson 10 - 3
Cr van den Nieuwelaar 11 2 -
COUNCIL COMMITTEES & MEETINGS
Page 16
Committees from July 2018 to June 2019
(pre-election)
Charles Sturt Council Assessment Panel CAP
Presiding Member: Ms S Johnston
Membership: Independent Presiding Member, three independent experts, one Council Member
and one Deputy Council Member (Deputy Council Member only required to attend in the absence
of the Council Member).
Meets: First and third Wednesday of each month at 6.30 pm to deal with:
• all development applications referred to it by Council officers for decision;
• applications for development where representors have requested to be heard in response
to a Category 2 or 3 notification;
• comments to the Development Assessment Commission on development that is significant,
controversial or contentious;
• category 2 or 3 non-complying development with representations;
• applications for development involving State or local heritage places or in Historic
Conservations Areas where:
• The officer’s recommendation is contrary to Council’s Heritage Advisor’s advice; or
• Council’s Heritage Advisor’s advice is at odds with the recommendation of State
Heritage;
• All refusals including declining to proceed with non-complying development
• Any form of new dwelling application in the Residential Zone or Residential Character Zone
that involves the establishment of a new site area 10% or more below the minimum area
specified for a semi-detached dwelling in the relevant Policy Area or Precinct but not
including those proposed on site areas appropriate for the relevant form of dwelling in the
Policy Area or Precinct; and
• Any dwelling of two or more stories located to the rear of another dwelling within the
Residential Zone or Residential Character Zone (except in Policy Areas 20, 22 and 23).
Operates with delegated authority from Council under the Development Act 1993
COUNCIL COMMITTEES & MEETINGS
Page 17
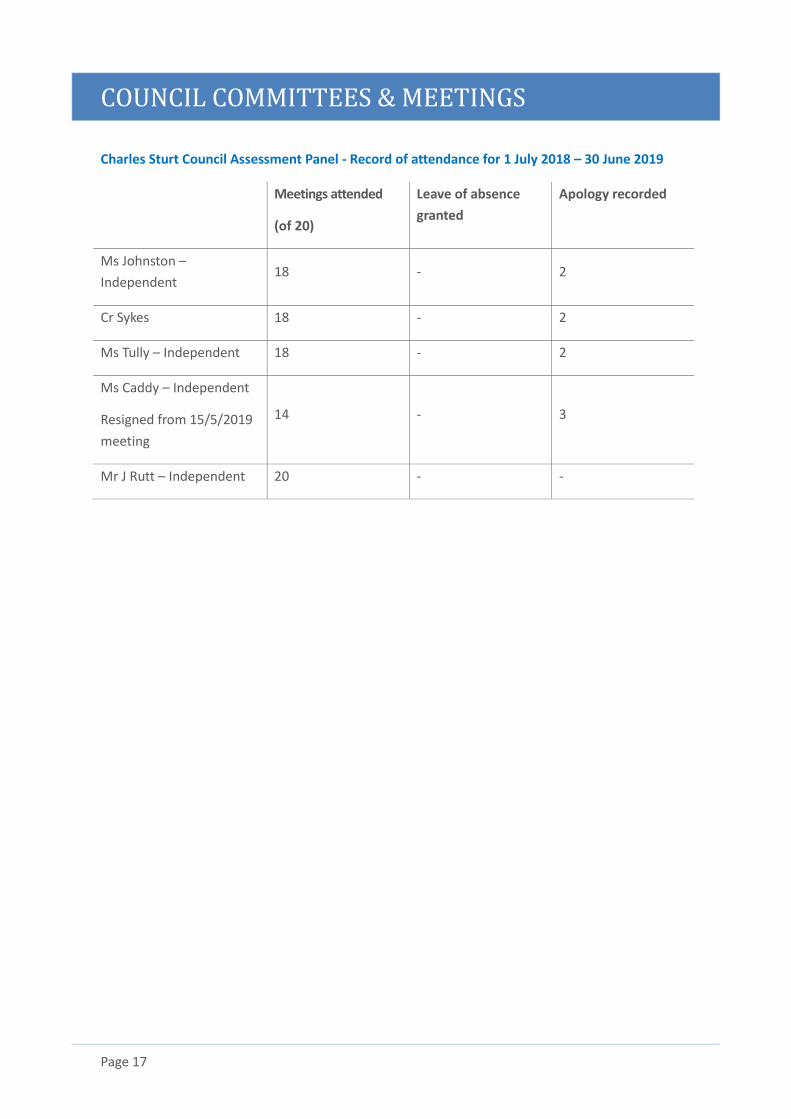
Charles Sturt Council Assessment Panel - Record of attendance for 1 July 2018 – 30 June 2019
Meetings attended
(of 20)
Leave of absence
granted
Apology recorded
Ms Johnston –
Independent 18 - 2
Cr Sykes 18 - 2
Ms Tully – Independent 18 - 2
Ms Caddy – Independent
Resigned from 15/5/2019
meeting
14 - 3
Mr J Rutt – Independent 20 - -
COUNCIL COMMITTEES & MEETINGS
Page 18
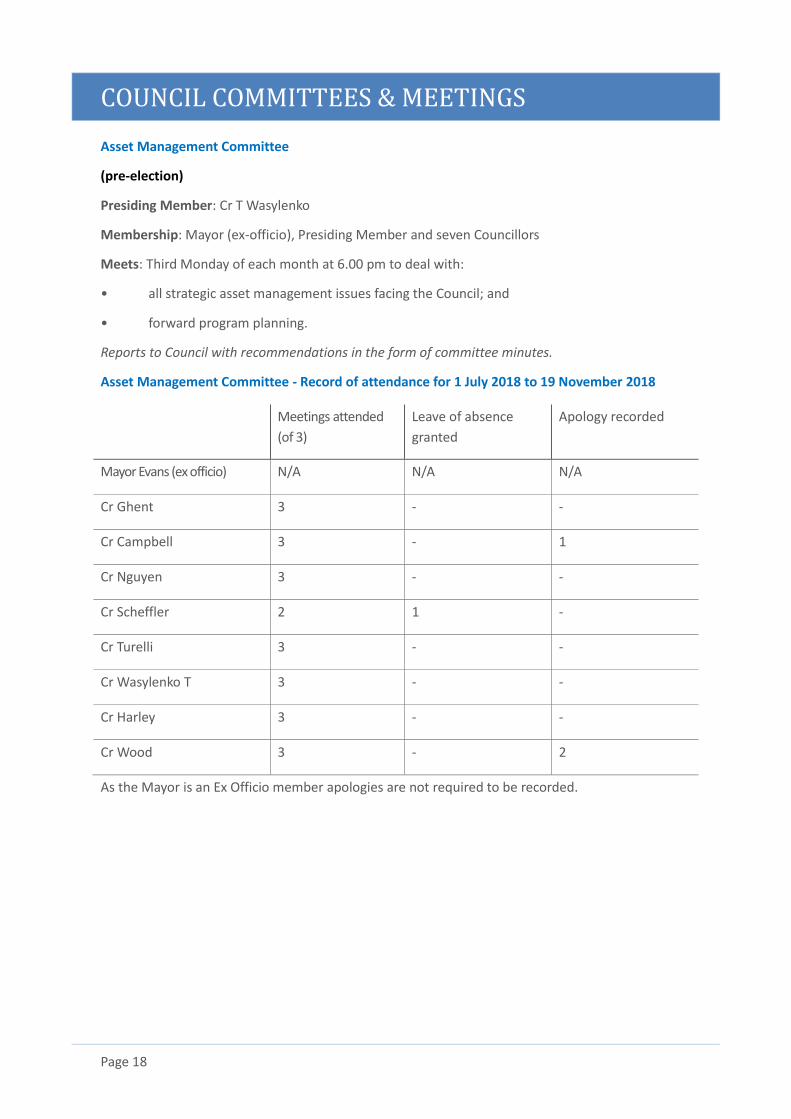
Asset Management Committee
(pre-election)
Presiding Member: Cr T Wasylenko
Membership: Mayor (ex-officio), Presiding Member and seven Councillors
Meets: Third Monday of each month at 6.00 pm to deal with:
• all strategic asset management issues facing the Council; and
• forward program planning.
Reports to Council with recommendations in the form of committee minutes.
Asset Management Committee - Record of attendance for 1 July 2018 to 19 November 2018
Meetings attended
(of 3)
Leave of absence
granted
Apology recorded
Mayor Evans (ex officio) N/A N/A N/A
Cr Ghent 3 - -
Cr Campbell 3 - 1
Cr Nguyen 3 - -
Cr Scheffler 2 1 -
Cr Turelli 3 - -
Cr Wasylenko T 3 - -
Cr Harley 3 - -
Cr Wood 3 - 2
As the Mayor is an Ex Officio member apologies are not required to be recorded.
COUNCIL COMMITTEES & MEETINGS
Page 19
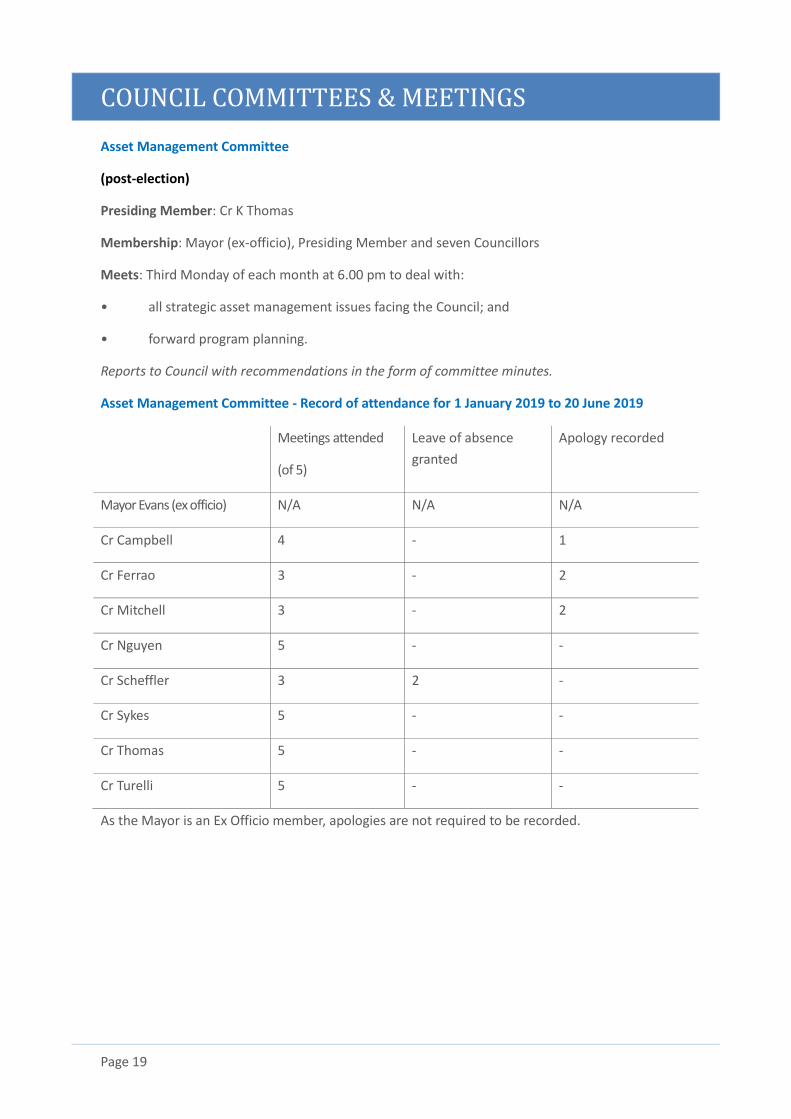
Asset Management Committee
(post-election)
Presiding Member: Cr K Thomas
Membership: Mayor (ex-officio), Presiding Member and seven Councillors
Meets: Third Monday of each month at 6.00 pm to deal with:
• all strategic asset management issues facing the Council; and
• forward program planning.
Reports to Council with recommendations in the form of committee minutes.
Asset Management Committee - Record of attendance for 1 January 2019 to 20 June 2019
Meetings attended
(of 5)
Leave of absence
granted
Apology recorded
Mayor Evans (ex officio) N/A N/A N/A
Cr Campbell 4 - 1
Cr Ferrao 3 - 2
Cr Mitchell 3 - 2
Cr Nguyen 5 - -
Cr Scheffler 3 2 -
Cr Sykes 5 - -
Cr Thomas 5 - -
Cr Turelli 5 - -
As the Mayor is an Ex Officio member, apologies are not required to be recorded.
COUNCIL COMMITTEES & MEETINGS
Page 20
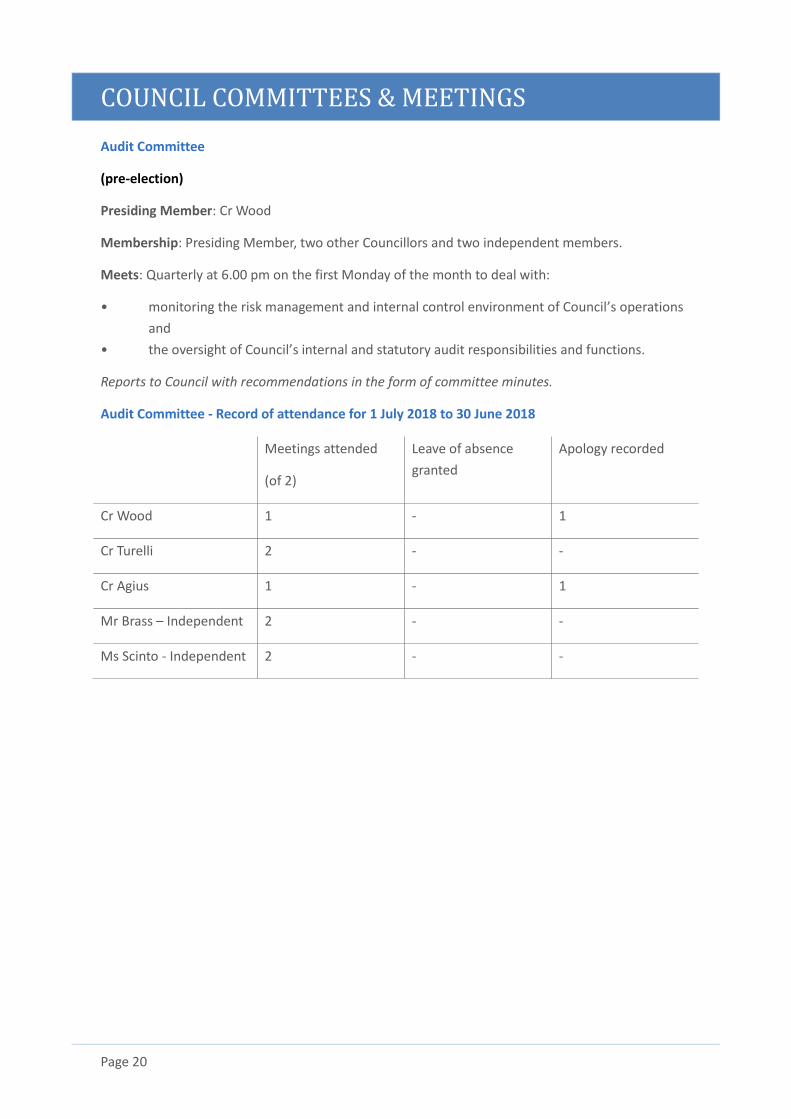
Audit Committee
(pre-election)
Presiding Member: Cr Wood
Membership: Presiding Member, two other Councillors and two independent members.
Meets: Quarterly at 6.00 pm on the first Monday of the month to deal with:
• monitoring the risk management and internal control environment of Council’s operations
and
• the oversight of Council’s internal and statutory audit responsibilities and functions.
Reports to Council with recommendations in the form of committee minutes.
Audit Committee - Record of attendance for 1 July 2018 to 30 June 2018
Meetings attended
(of 2)
Leave of absence
granted
Apology recorded
Cr Wood 1 - 1
Cr Turelli 2 - -
Cr Agius 1 - 1
Mr Brass – Independent 2 - -
Ms Scinto - Independent 2 - -
COUNCIL COMMITTEES & MEETINGS
Page 21
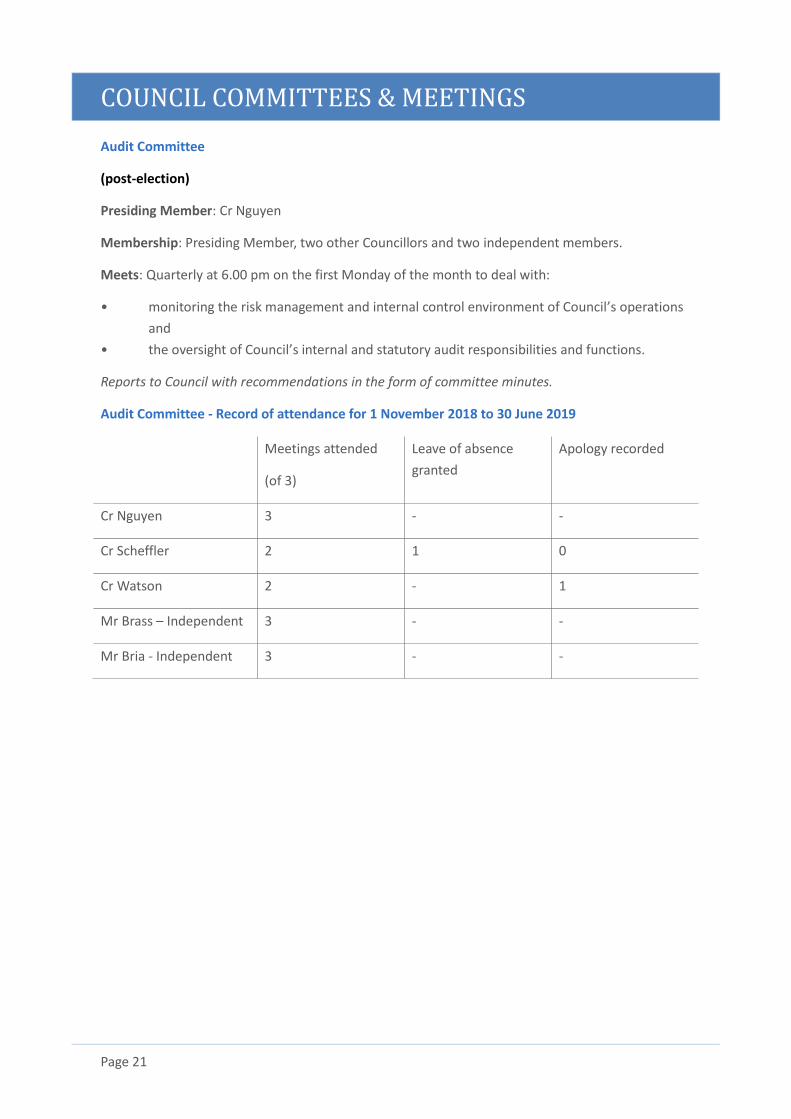
Audit Committee
(post-election)
Presiding Member: Cr Nguyen
Membership: Presiding Member, two other Councillors and two independent members.
Meets: Quarterly at 6.00 pm on the first Monday of the month to deal with:
• monitoring the risk management and internal control environment of Council’s operations
and
• the oversight of Council’s internal and statutory audit responsibilities and functions.
Reports to Council with recommendations in the form of committee minutes.
Audit Committee - Record of attendance for 1 November 2018 to 30 June 2019
Meetings attended
(of 3)
Leave of absence
granted
Apology recorded
Cr Nguyen 3 - -
Cr Scheffler 2 1 0
Cr Watson 2 - 1
Mr Brass – Independent 3 - -
Mr Bria - Independent 3 - -

COUNCIL COMMITTEES & MEETINGS
Page 22
City Services Committee
(pre-election)
Presiding Member: Cr Alexandrides
Membership: Mayor (ex-officio), Presiding Member and six Councillors (note there is one vacant
position).
Meets: Monthly at 6.00 pm on the third Monday of the month (commenced February 2016) to deal
with:
• All social and community services issues and framework.
• Strategic Planning
• Economic Development
• Development Policy.
Reports to Council with recommendations in the form of committee minutes
City Services Committee - Record of attendance for 1 July 2018 to 15 November 2018
Meetings
attended
(of 4)
Leave of absence
granted
Apology
recorded
Mayor Evans (ex officio) 3 - 1
Cr Alexandrides 4 - -
Cr Sykes 2 - 2
Cr Thomas 4 - -
Cr Tullio 2 - 2
Cr B Wasylenko 4 - -
Cr Agius 2 - 2
Cr Randall - 4 -
As the Mayor is an Ex Officio member, apologies are not required to be recorded.
COUNCIL COMMITTEES & MEETINGS
Page 23
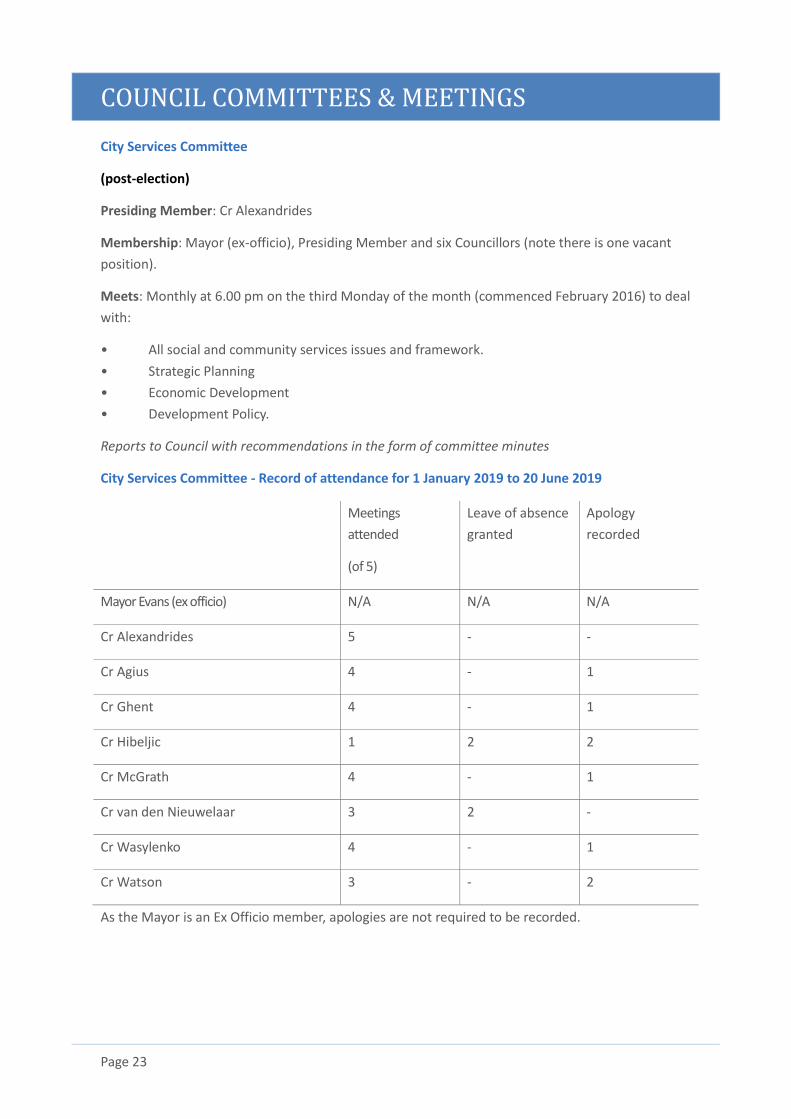
City Services Committee
(post-election)
Presiding Member: Cr Alexandrides
Membership: Mayor (ex-officio), Presiding Member and six Councillors (note there is one vacant
position).
Meets: Monthly at 6.00 pm on the third Monday of the month (commenced February 2016) to deal
with:
• All social and community services issues and framework.
• Strategic Planning
• Economic Development
• Development Policy.
Reports to Council with recommendations in the form of committee minutes
City Services Committee - Record of attendance for 1 January 2019 to 20 June 2019
Meetings
attended
(of 5)
Leave of absence
granted
Apology
recorded
Mayor Evans (ex officio) N/A N/A N/A
Cr Alexandrides 5 - -
Cr Agius 4 - 1
Cr Ghent 4 - 1
Cr Hibeljic 1 2 2
Cr McGrath 4 - 1
Cr van den Nieuwelaar 3 2 -
Cr Wasylenko 4 - 1
Cr Watson 3 - 2
As the Mayor is an Ex Officio member, apologies are not required to be recorded.
COUNCIL COMMITTEES & MEETINGS
Page 24
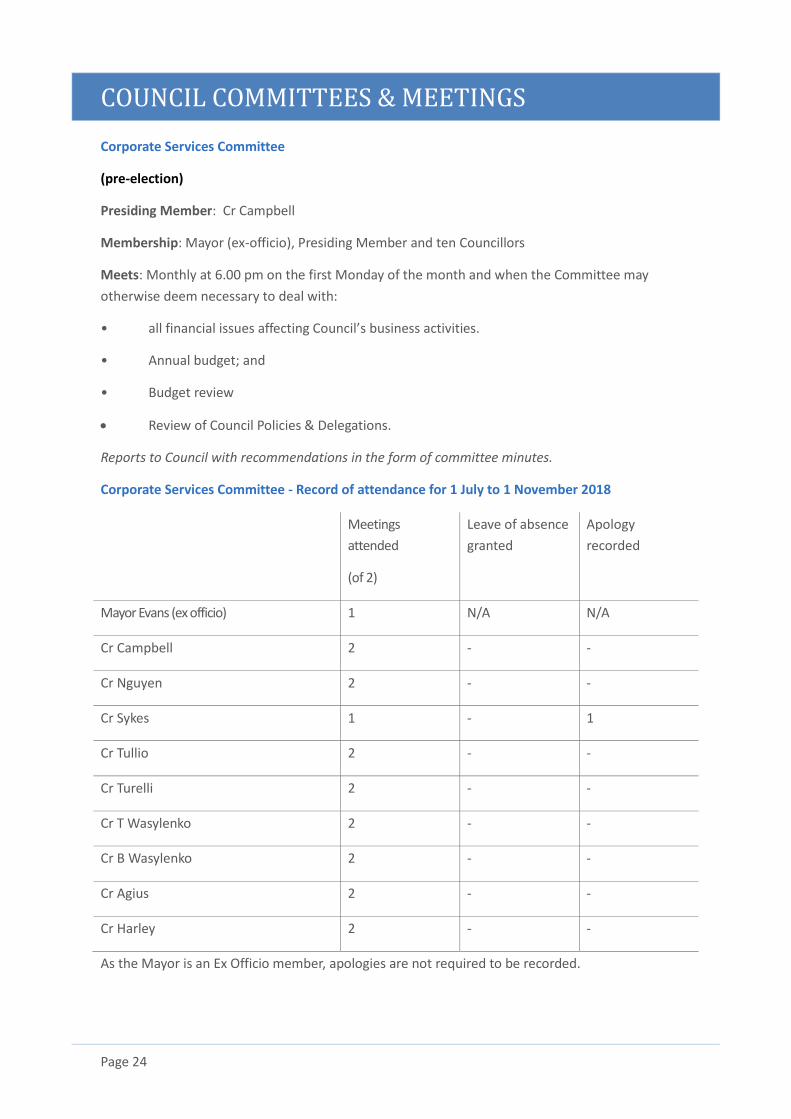
Corporate Services Committee
(pre-election)
Presiding Member: Cr Campbell
Membership: Mayor (ex-officio), Presiding Member and ten Councillors
Meets: Monthly at 6.00 pm on the first Monday of the month and when the Committee may
otherwise deem necessary to deal with:
• all financial issues affecting Council’s business activities.
• Annual budget; and
• Budget review
• Review of Council Policies & Delegations.
Reports to Council with recommendations in the form of committee minutes.
Corporate Services Committee - Record of attendance for 1 July to 1 November 2018
Meetings
attended
(of 2)
Leave of absence
granted
Apology
recorded
Mayor Evans (ex officio) 1 N/A N/A
Cr Campbell 2 - -
Cr Nguyen 2 - -
Cr Sykes 1 - 1
Cr Tullio 2 - -
Cr Turelli 2 - -
Cr T Wasylenko 2 - -
Cr B Wasylenko 2 - -
Cr Agius 2 - -
Cr Harley 2 - -
As the Mayor is an Ex Officio member, apologies are not required to be recorded.
COUNCIL COMMITTEES & MEETINGS
Page 25
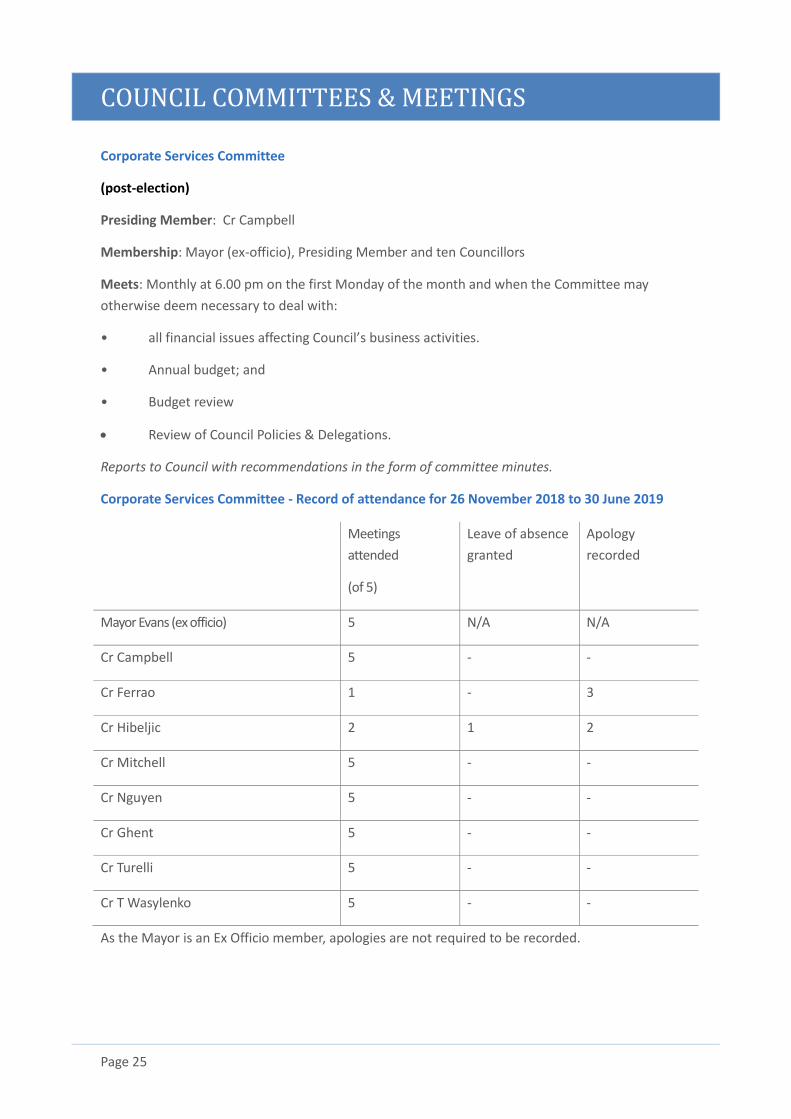
Corporate Services Committee
(post-election)
Presiding Member: Cr Campbell
Membership: Mayor (ex-officio), Presiding Member and ten Councillors
Meets: Monthly at 6.00 pm on the first Monday of the month and when the Committee may
otherwise deem necessary to deal with:
• all financial issues affecting Council’s business activities.
• Annual budget; and
• Budget review
• Review of Council Policies & Delegations.
Reports to Council with recommendations in the form of committee minutes.
Corporate Services Committee - Record of attendance for 26 November 2018 to 30 June 2019
Meetings
attended
(of 5)
Leave of absence
granted
Apology
recorded
Mayor Evans (ex officio) 5 N/A N/A
Cr Campbell 5 - -
Cr Ferrao 1 - 3
Cr Hibeljic 2 1 2
Cr Mitchell 5 - -
Cr Nguyen 5 - -
Cr Ghent 5 - -
Cr Turelli 5 - -
Cr T Wasylenko 5 - -
As the Mayor is an Ex Officio member, apologies are not required to be recorded.

COUNCIL COMMITTEES & MEETINGS
Page 26
Other Legislated Committees from July to November
2018 Charles Sturt Building Fire Safety Committee
The Building Fire Safety Committee was established in accordance with the requirements of Section
71 of the Development Act 1993. The purpose of the Building Fire Safety Committee is to maintain
proper levels of fire safety in all buildings within the Council area:
Membership: Council’s Building Surveyor and Assistant Building Surveyor and a representative from
the Metropolitan Fire Service.
Meets: Bi-monthly, usually on the first Tuesday.
Other Legislated Committees from 26 November
2018 to 30 June 2019 Charles Sturt Building Fire Safety Committee
The Building Fire Safety Committee was established in accordance with the requirements of Section
71 of the Development Act 1993. The purpose of the Building Fire Safety Committee is to maintain
proper levels of fire safety in all buildings within the Council area:
Membership: Council’s Building Surveyor and Assistant Building Surveyor and a representative from
the Metropolitan Fire Service.
Meets: Bi-monthly, usually on the first Tuesday.
COUNCIL MEMBER TRAINING & DEVELOPMENT
Page 27
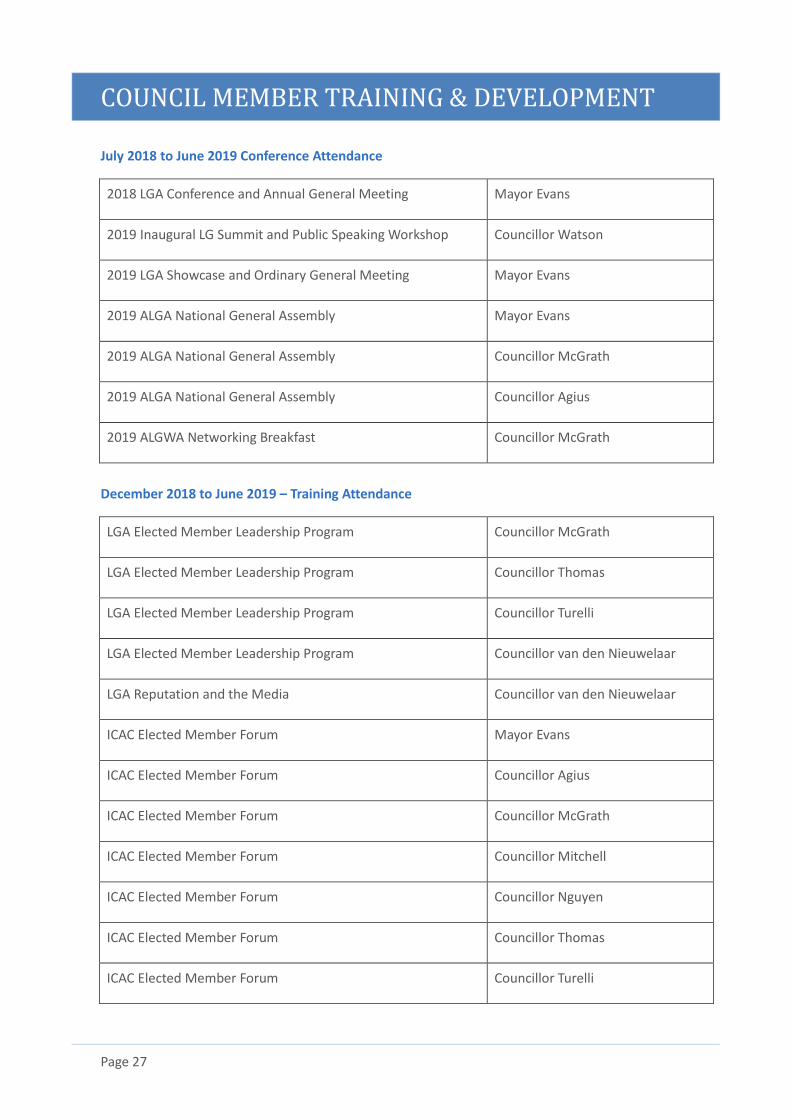
July 2018 to June 2019 Conference Attendance
2018 LGA Conference and Annual General Meeting Mayor Evans
2019 Inaugural LG Summit and Public Speaking Workshop Councillor Watson
2019 LGA Showcase and Ordinary General Meeting Mayor Evans
2019 ALGA National General Assembly Mayor Evans
2019 ALGA National General Assembly Councillor McGrath
2019 ALGA National General Assembly Councillor Agius
2019 ALGWA Networking Breakfast Councillor McGrath
December 2018 to June 2019 – Training Attendance
LGA Elected Member Leadership Program Councillor McGrath
LGA Elected Member Leadership Program Councillor Thomas
LGA Elected Member Leadership Program Councillor Turelli
LGA Elected Member Leadership Program Councillor van den Nieuwelaar
LGA Reputation and the Media Councillor van den Nieuwelaar
ICAC Elected Member Forum Mayor Evans
ICAC Elected Member Forum Councillor Agius
ICAC Elected Member Forum Councillor McGrath
ICAC Elected Member Forum Councillor Mitchell
ICAC Elected Member Forum Councillor Nguyen
ICAC Elected Member Forum Councillor Thomas
ICAC Elected Member Forum Councillor Turelli
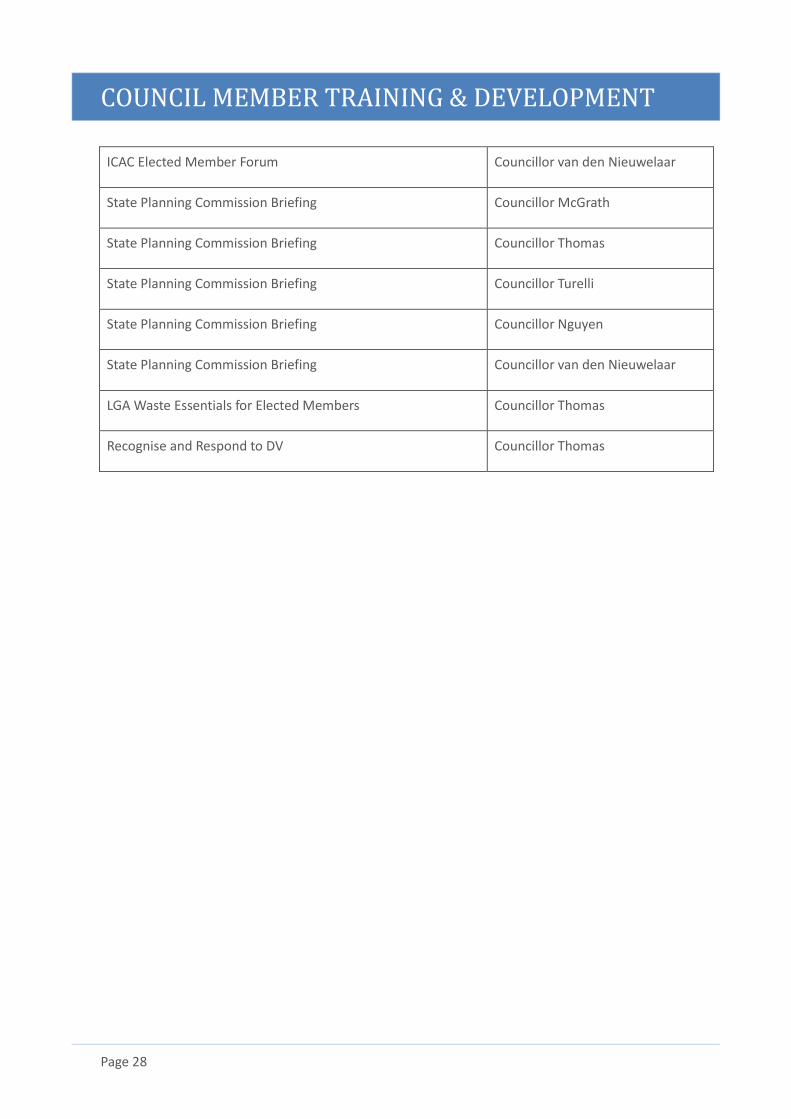
COUNCIL MEMBER TRAINING & DEVELOPMENT
Page 28
ICAC Elected Member Forum Councillor van den Nieuwelaar
State Planning Commission Briefing Councillor McGrath
State Planning Commission Briefing Councillor Thomas
State Planning Commission Briefing Councillor Turelli
State Planning Commission Briefing Councillor Nguyen
State Planning Commission Briefing Councillor van den Nieuwelaar
LGA Waste Essentials for Elected Members Councillor Thomas
Recognise and Respond to DV Councillor Thomas
COUNCIL MEMBER ALLOWANCES
Page 29
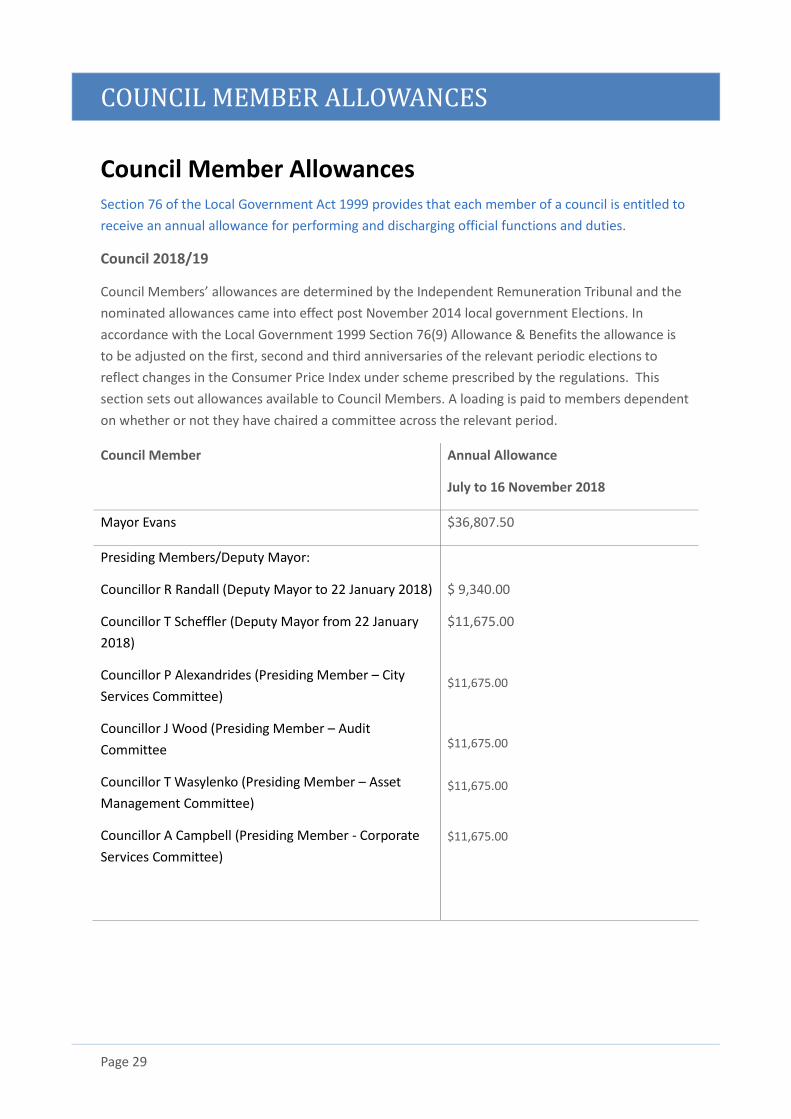
Council Member Allowances Section 76 of the Local Government Act 1999 provides that each member of a council is entitled to
receive an annual allowance for performing and discharging official functions and duties.
Council 2018/19
Council Members’ allowances are determined by the Independent Remuneration Tribunal and the
nominated allowances came into effect post November 2014 local government Elections. In
accordance with the Local Government 1999 Section 76(9) Allowance & Benefits the allowance is
to be adjusted on the first, second and third anniversaries of the relevant periodic elections to
reflect changes in the Consumer Price Index under scheme prescribed by the regulations. This
section sets out allowances available to Council Members. A loading is paid to members dependent
on whether or not they have chaired a committee across the relevant period.
Council Member Annual Allowance
July to 16 November 2018
Mayor Evans $36,807.50
Presiding Members/Deputy Mayor:
Councillor R Randall (Deputy Mayor to 22 January 2018)
Councillor T Scheffler (Deputy Mayor from 22 January
2018)
Councillor P Alexandrides (Presiding Member – City
Services Committee)
Councillor J Wood (Presiding Member – Audit
Committee
Councillor T Wasylenko (Presiding Member – Asset
Management Committee)
Councillor A Campbell (Presiding Member - Corporate
Services Committee)
$ 9,340.00
$11,675.00
$11,675.00
$11,675.00
$11,675.00
$11,675.00
COUNCIL MEMBER ALLOWANCES
Page 30
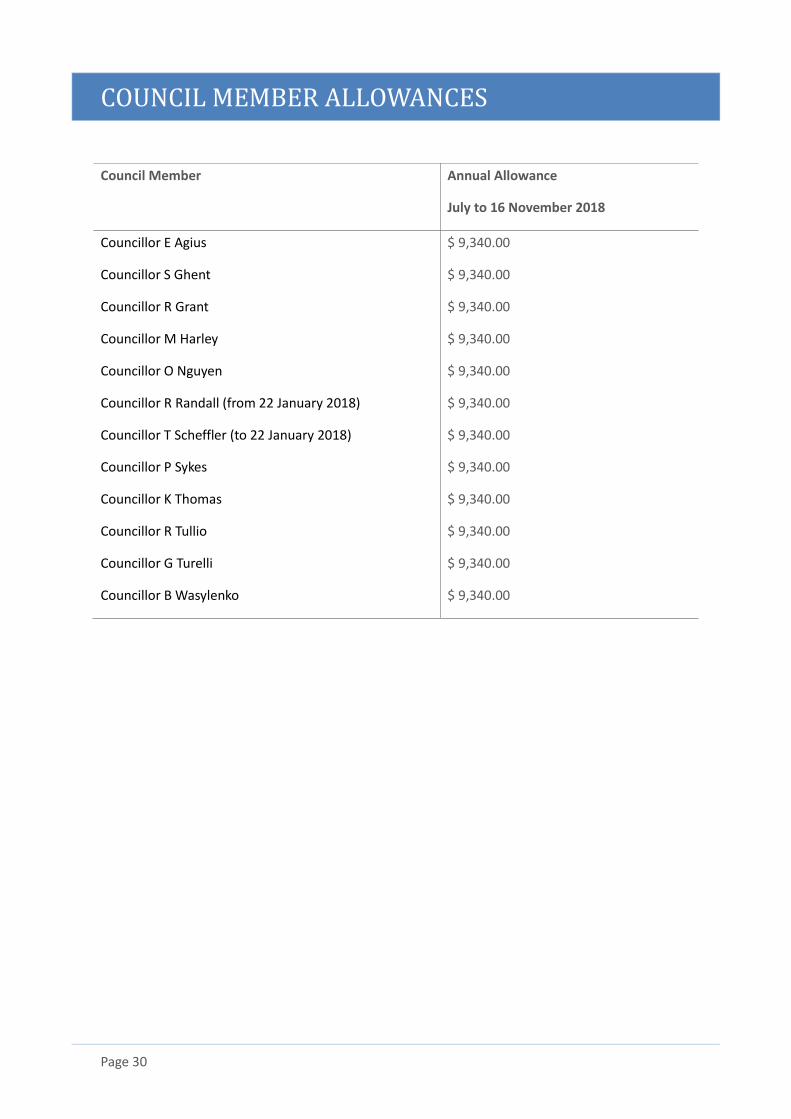
Council Member Annual Allowance
July to 16 November 2018
Councillor E Agius
Councillor S Ghent
Councillor R Grant
Councillor M Harley
Councillor O Nguyen
Councillor R Randall (from 22 January 2018)
Councillor T Scheffler (to 22 January 2018)
Councillor P Sykes
Councillor K Thomas
Councillor R Tullio
Councillor G Turelli
Councillor B Wasylenko
$ 9,340.00
$ 9,340.00
$ 9,340.00
$ 9,340.00
$ 9,340.00
$ 9,340.00
$ 9,340.00
$ 9,340.00
$ 9,340.00
$ 9,340.00
$ 9,340.00
$ 9,340.00
COUNCIL MEMBER ALLOWANCES
Page 31
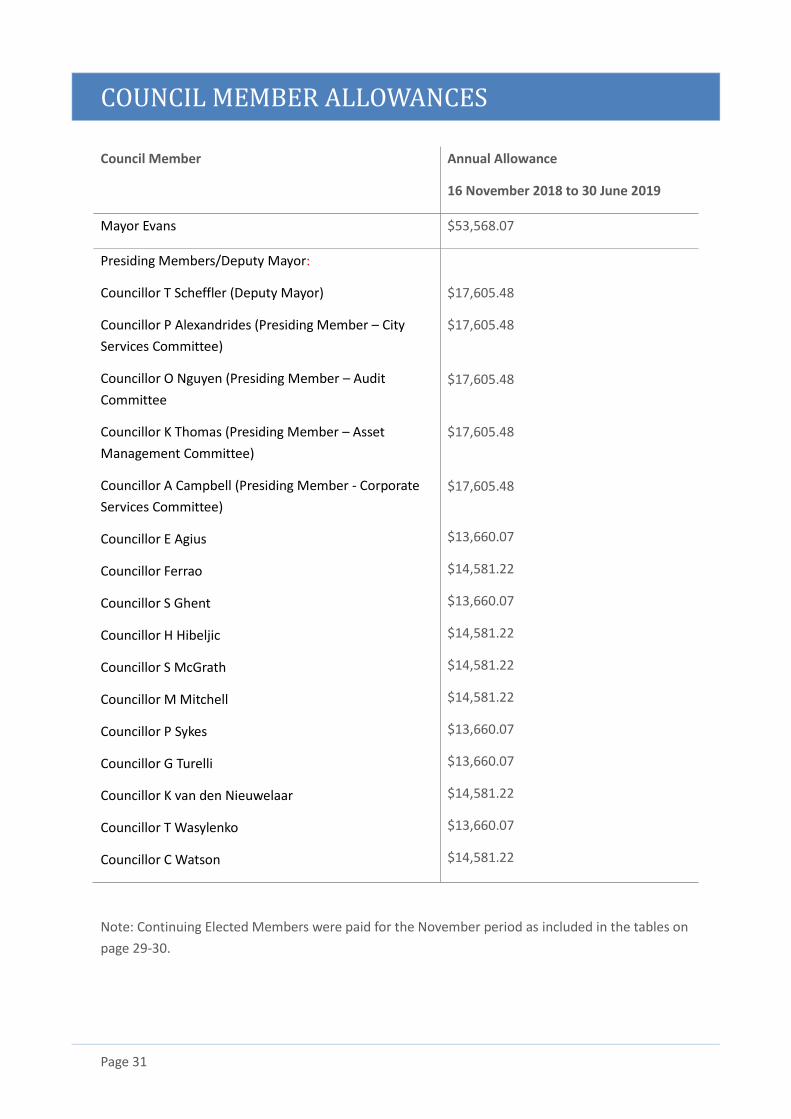
Council Member
Annual Allowance
16 November 2018 to 30 June 2019
Mayor Evans $53,568.07
Presiding Members/Deputy Mayor:
Councillor T Scheffler (Deputy Mayor)
Councillor P Alexandrides (Presiding Member – City
Services Committee)
Councillor O Nguyen (Presiding Member – Audit
Committee
Councillor K Thomas (Presiding Member – Asset
Management Committee)
Councillor A Campbell (Presiding Member - Corporate
Services Committee)
Councillor E Agius
Councillor Ferrao
Councillor S Ghent
Councillor H Hibeljic
Councillor S McGrath
Councillor M Mitchell
Councillor P Sykes
Councillor G Turelli
Councillor K van den Nieuwelaar
Councillor T Wasylenko
Councillor C Watson
$17,605.48
$17,605.48
$17,605.48
$17,605.48
$17,605.48
$13,660.07
$14,581.22
$13,660.07
$14,581.22
$14,581.22
$14,581.22
$13,660.07
$13,660.07
$14,581.22
$13,660.07
$14,581.22
Note: Continuing Elected Members were paid for the November period as included in the tables on
page 29-30.
REPRESENTATION & ELECTIONS
Page 32
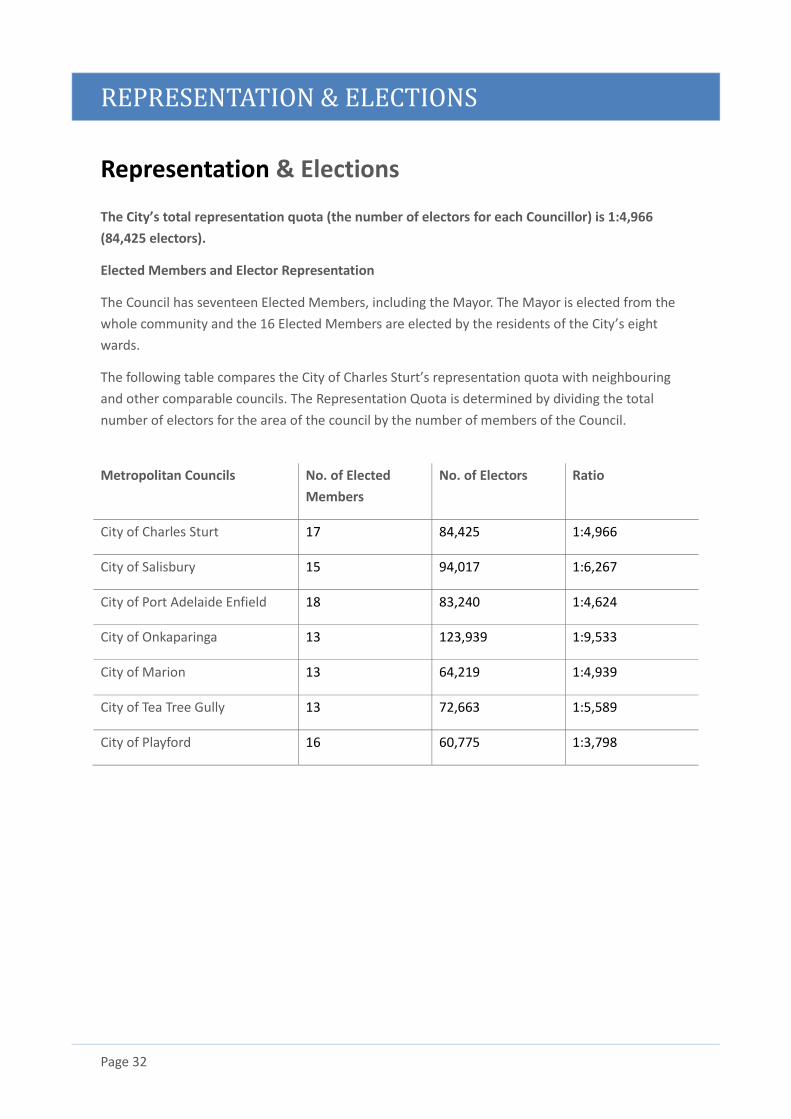
Representation & Elections
The City’s total representation quota (the number of electors for each Councillor) is 1:4,966
(84,425 electors).
Elected Members and Elector Representation
The Council has seventeen Elected Members, including the Mayor. The Mayor is elected from the
whole community and the 16 Elected Members are elected by the residents of the City’s eight
wards.
The following table compares the City of Charles Sturt’s representation quota with neighbouring
and other comparable councils. The Representation Quota is determined by dividing the total
number of electors for the area of the council by the number of members of the Council.
Metropolitan Councils No. of Elected
Members
No. of Electors Ratio
City of Charles Sturt 17 84,425 1:4,966
City of Salisbury 15 94,017 1:6,267
City of Port Adelaide Enfield 18 83,240 1:4,624
City of Onkaparinga 13 123,939 1:9,533
City of Marion 13 64,219 1:4,939
City of Tea Tree Gully 13 72,663 1:5,589
City of Playford 16 60,775 1:3,798
REPRESENTATION & ELECTIONS
Page 33
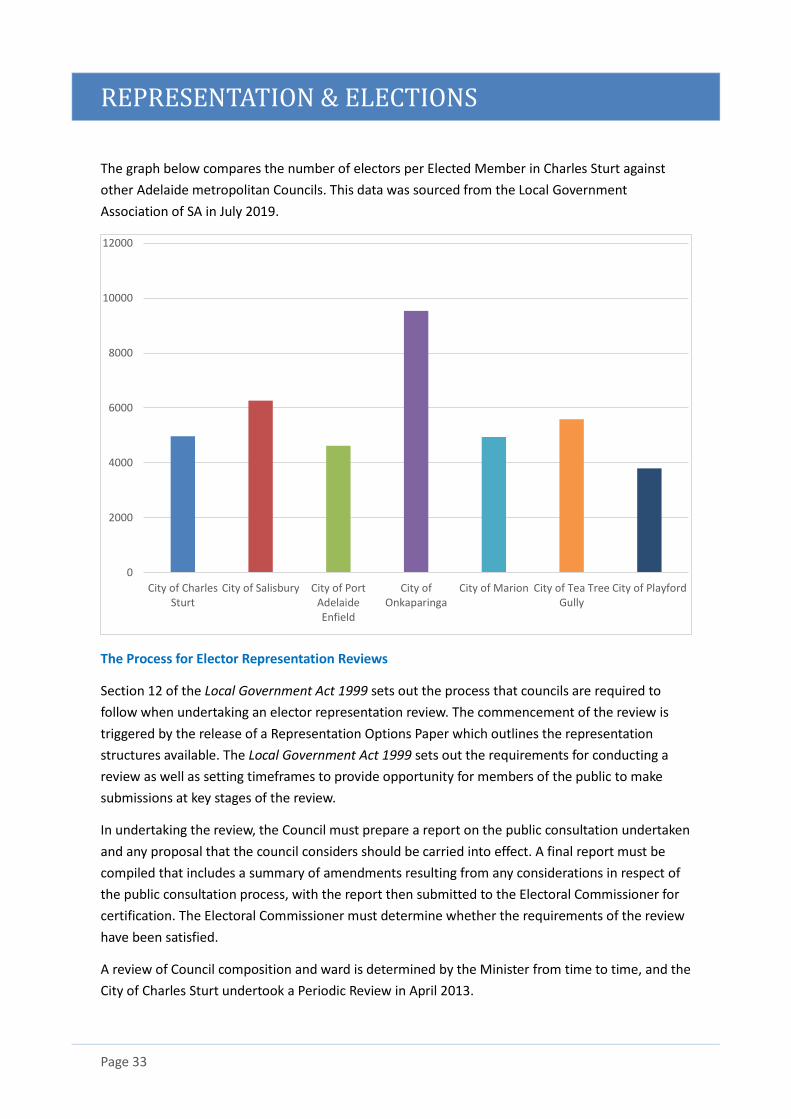
The graph below compares the number of electors per Elected Member in Charles Sturt against
other Adelaide metropolitan Councils. This data was sourced from the Local Government
Association of SA in July 2019.
The Process for Elector Representation Reviews
Section 12 of the Local Government Act 1999 sets out the process that councils are required to
follow when undertaking an elector representation review. The commencement of the review is
triggered by the release of a Representation Options Paper which outlines the representation
structures available. The Local Government Act 1999 sets out the requirements for conducting a
review as well as setting timeframes to provide opportunity for members of the public to make
submissions at key stages of the review.
In undertaking the review, the Council must prepare a report on the public consultation undertaken
and any proposal that the council considers should be carried into effect. A final report must be
compiled that includes a summary of amendments resulting from any considerations in respect of
the public consultation process, with the report then submitted to the Electoral Commissioner for
certification. The Electoral Commissioner must determine whether the requirements of the review
have been satisfied.
A review of Council composition and ward is determined by the Minister from time to time, and the
City of Charles Sturt undertook a Periodic Review in April 2013.
0
2000
4000
6000
8000
10000
12000
City of CharlesSturt
City of Salisbury City of PortAdelaideEnfield
City ofOnkaparinga
City of Marion City of Tea TreeGully
City of Playford
MANAGEMENT & STAFFING
Page 34
Management & Staffing
Staff and management at the City of Charles Sturt work for and on behalf of the community and
implement policies and directions set by the Council.
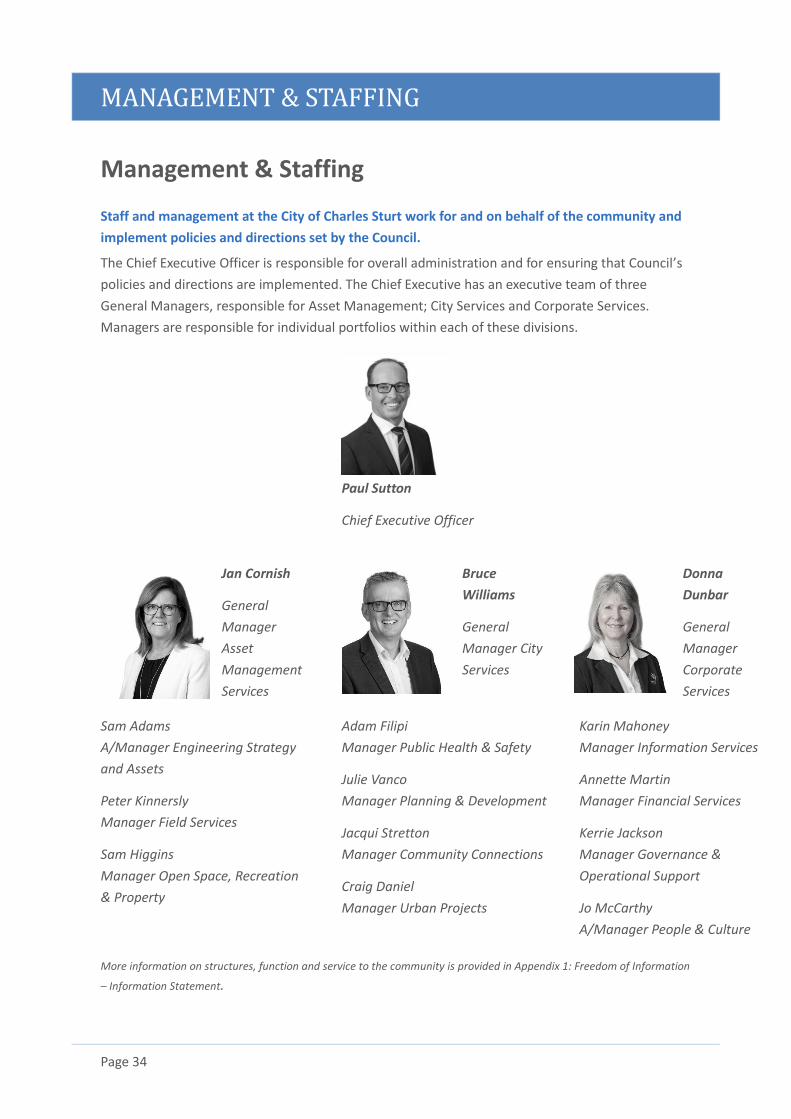
The Chief Executive Officer is responsible for overall administration and for ensuring that Council’s
policies and directions are implemented. The Chief Executive has an executive team of three
General Managers, responsible for Asset Management; City Services and Corporate Services.
Managers are responsible for individual portfolios within each of these divisions.
Paul Sutton
Chief Executive Officer
Jan Cornish
General
Manager
Asset
Management
Services
Bruce
Williams
General
Manager City
Services
Donna
Dunbar
General
Manager
Corporate
Services
Sam Adams
A/Manager Engineering Strategy
and Assets
Peter Kinnersly
Manager Field Services
Sam Higgins
Manager Open Space, Recreation
& Property
Adam Filipi
Manager Public Health & Safety
Julie Vanco
Manager Planning & Development
Jacqui Stretton
Manager Community Connections
Craig Daniel
Manager Urban Projects
Karin Mahoney
Manager Information Services
Annette Martin
Manager Financial Services
Kerrie Jackson
Manager Governance &
Operational Support
Jo McCarthy
A/Manager People & Culture
More information on structures, function and service to the community is provided in Appendix 1: Freedom of Information
– Information Statement.
MANAGEMENT & STAFFING
Page 35
Leadership Team Salary Packages
The 18 members of the Leadership Team are paid a salary package which varies from individual to
individual. These packages are summarised below.
• All packages included the 9.5% compulsory superannuation.
• 12 packages include the provision of a motor vehicle for unrestricted private use on a salary
sacrifice basis.
People and Culture Programs
1. The Leadership and People & Culture Teams have worked in partnership to
implement a Culture Roadmap 2018-2021 across the organisation. The outdoor
workforce was reintroduced back in the culture program having not
participated in the culture survey for several years. Our strategy for focusing on
our Culture in 2019 incorporates our ‘Working on We’ internal campaign,
‘Living Blue’ culture program and alignment with the Customer Experience
strategy which is our commitment to build a high performing organisation for
our culture and employees and our customers and community. As part of the
program Organisational Culture Inventory (OCI) surveys were completed in
March with 89% response rate for the administration workforce and 91%
response rate for the outdoor workforce. 93% of teams have had their results
debriefed and many teams have commenced culture action planning, working
through key areas for improvement in our ‘Living Blue’ Culture program.
2. Culture Education has been the key focus for leaders in the Dare to Lead 2020
leadership development program. An external consultant was engaged to facilitate
workshops with the Executive, Managers, the Leadership Team and Team
Leaders/Coordinators to prepare them in debriefing their team culture results, with
outcomes identified and key actions committed to improving the culture at a senior
leadership level.
3. Charles Sturt’s participation in the Ageing and Work Health Pilot project concluded on
30 June 2019 resulting in several resources and guidelines being developed for Field
Services leaders and employees. Organisational Health Services (Aust), in partnership
with the Local Government Association Workers Compensation Scheme (LGAWCS) have
project managed the Ageing and Work Health Pilot project with the aim of supporting
employees in high physical demanding roles as they age, particularly those aged 45+,
through trialling the effectiveness of a range of strategies.
MANAGEMENT & STAFFING
Page 36
4. The facilitation of an Early Retirement initiative for field employees was offered as part
of Council’s commitment to the Active Ageing project and workforce strategy.
Statewide Super attended an overview session with eligible employees which resulted
in a number of individuals attending follow up appointments for retirement planning
and financial advice, providing them greater awareness in relation to their retirement
options.
5. A review of the Operations Classification Structure was undertaken in relation to
relativity of pay and conditions, roles and responsibilities and capabilities for leadership
roles. Following a comprehensive benchmarking process, a consultant was engaged to
facilitate the development of additional levels and associated definitions at Field
leadership levels. In addition, the non-supervisory levels have been modernised and
simplified, with the view of the proposed Classification Structure forming part of the
next Enterprise Bargaining (Operations) Agreement.
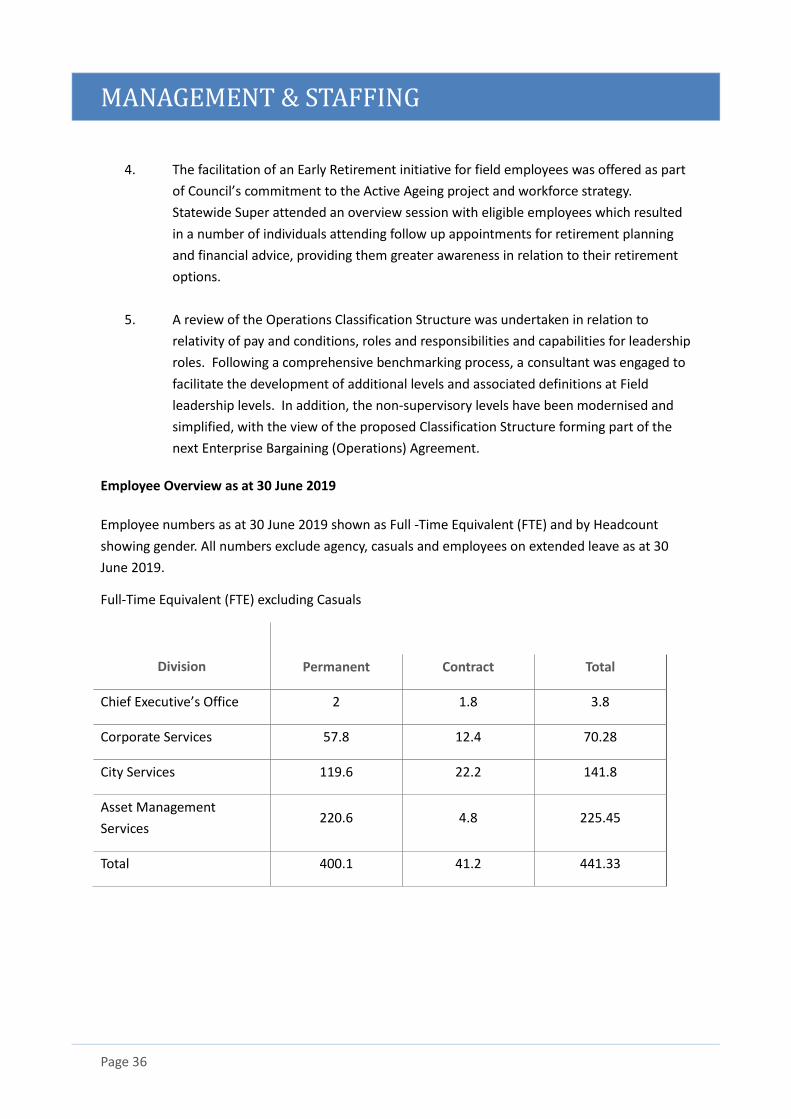
Employee Overview as at 30 June 2019
Employee numbers as at 30 June 2019 shown as Full -Time Equivalent (FTE) and by Headcount
showing gender. All numbers exclude agency, casuals and employees on extended leave as at 30
June 2019.
Full-Time Equivalent (FTE) excluding Casuals
Division Permanent Contract Total
Chief Executive’s Office 2 1.8 3.8
Corporate Services 57.8 12.4 70.28
City Services 119.6 22.2 141.8
Asset Management
Services 220.6 4.8 225.45
Total 400.1 41.2 441.33
MANAGEMENT & STAFFING
Page 37
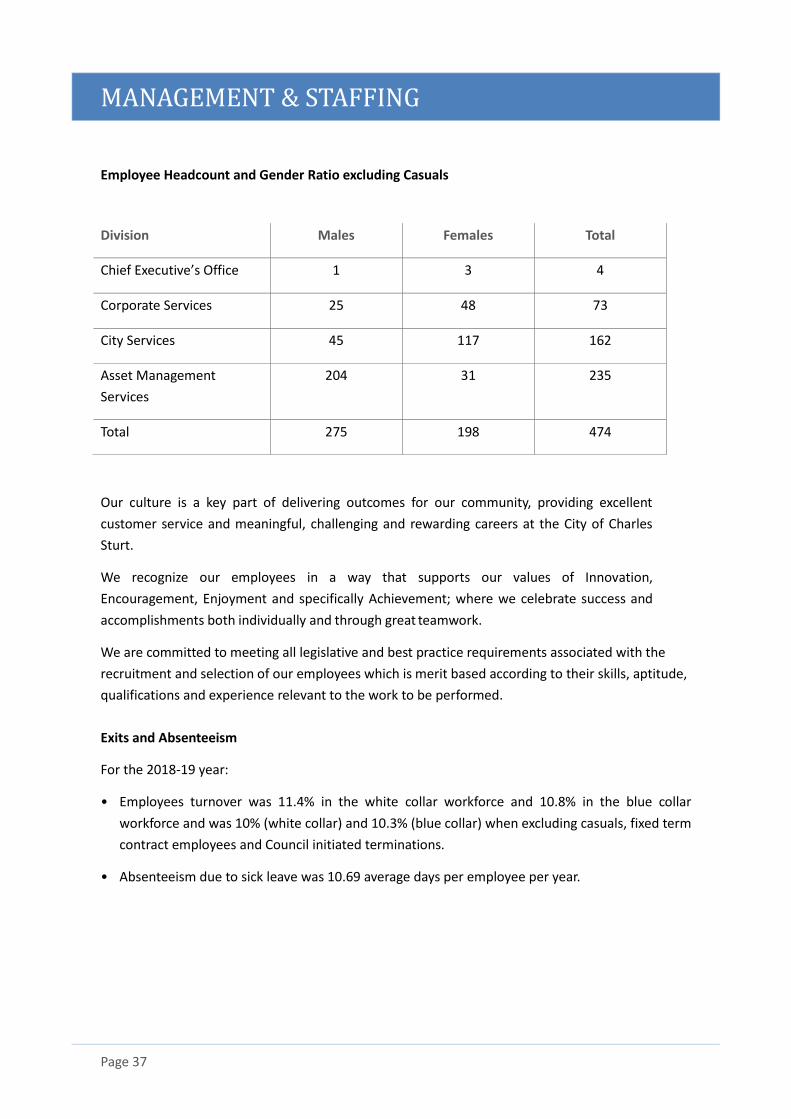
Employee Headcount and Gender Ratio excluding Casuals
Division Males Females Total
Chief Executive’s Office 1 3 4
Corporate Services 25 48 73
City Services 45 117 162
Asset Management
Services
204 31 235
Total 275 198 474
Our culture is a key part of delivering outcomes for our community, providing excellent
customer service and meaningful, challenging and rewarding careers at the City of Charles
Sturt.
We recognize our employees in a way that supports our values of Innovation,
Encouragement, Enjoyment and specifically Achievement; where we celebrate success and
accomplishments both individually and through great teamwork.
We are committed to meeting all legislative and best practice requirements associated with the
recruitment and selection of our employees which is merit based according to their skills, aptitude,
qualifications and experience relevant to the work to be performed.
Exits and Absenteeism
For the 2018-19 year:
• Employees turnover was 11.4% in the white collar workforce and 10.8% in the blue collar
workforce and was 10% (white collar) and 10.3% (blue collar) when excluding casuals, fixed term
contract employees and Council initiated terminations.
• Absenteeism due to sick leave was 10.69 average days per employee per year.
STRATEGIES & PERFORMANCE | CORPORATE INDICATORS
Page 38
Corporate Indicators 2018/19
The City of Charles Sturt’s Community Plan 2016-2027 and Corporate Plan 2016-2020 are the
leading strategy documents in Council’s strategic planning framework. The plans identify 5
Theme Areas that were developed in consultation with our residents. These themes are:
• Our Community – A strong and connected community
• Our Liveability – A liveable City of great places
• Our Environment – An environmentally responsible and sustainable City
• Our Economy – An economically thriving City
• Our Leadership – A leading and transformational Local Government Organisation
Indicators and measures are identified to enable monitoring of performance and key
priorities within the themes. Significant projects have been identified that will be delivered
over the 4 year period of the Corporate Plan.
The following pages report on our indicators and progress towards our key priorities. Each
Theme has its own section with:
1) A table identifying progress on key priorities.
2) Statistical information and/or commentary on each indicator.
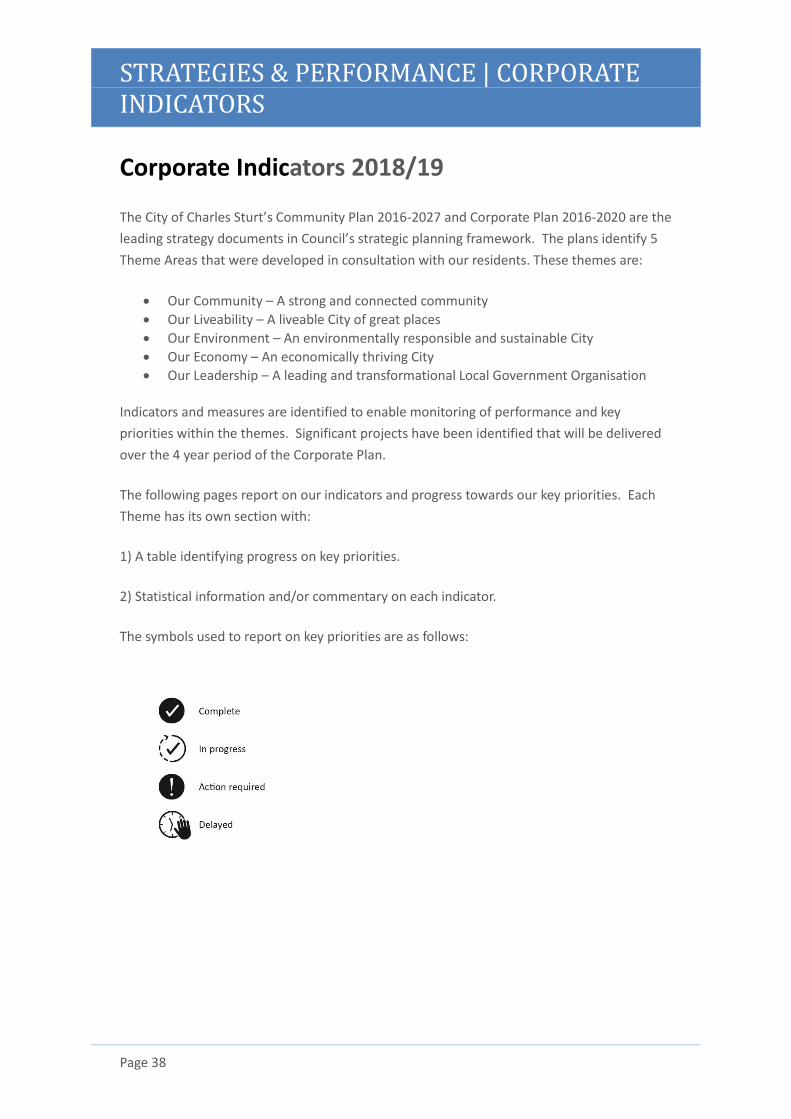
The symbols used to report on key priorities are as follows:
STRATEGIES & PERFORMANCE | CORPORATE INDICATORS
Page 39
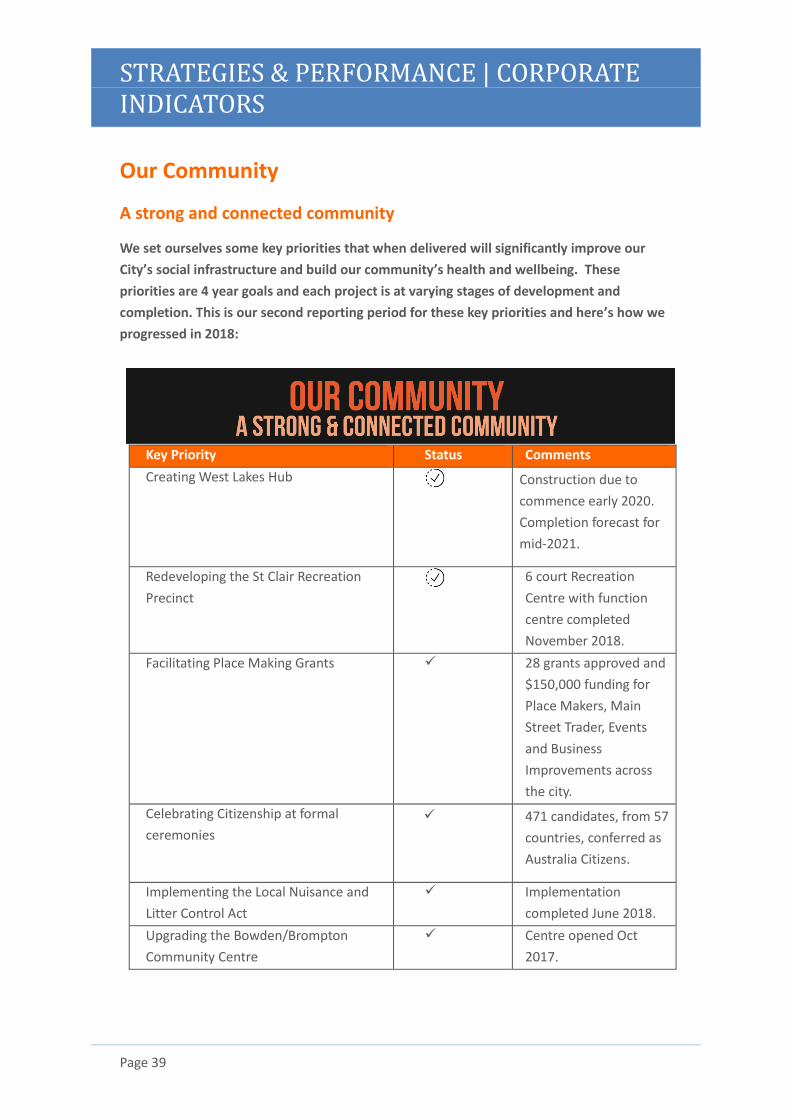
Our Community
A strong and connected community
We set ourselves some key priorities that when delivered will significantly improve our
City’s social infrastructure and build our community’s health and wellbeing. These
priorities are 4 year goals and each project is at varying stages of development and
completion. This is our second reporting period for these key priorities and here’s how we
progressed in 2018:
Key Priority Status Comments
Creating West Lakes Hub Construction due to
commence early 2020.
Completion forecast for
mid-2021.
Redeveloping the St Clair Recreation
Precinct
6 court Recreation
Centre with function
centre completed
November 2018.
Facilitating Place Making Grants ✓ 28 grants approved and
$150,000 funding for
Place Makers, Main
Street Trader, Events
and Business
Improvements across
the city.
Celebrating Citizenship at formal
ceremonies
✓ 471 candidates, from 57
countries, conferred as
Australia Citizens.
Implementing the Local Nuisance and
Litter Control Act
✓ Implementation
completed June 2018.
Upgrading the Bowden/Brompton
Community Centre
✓ Centre opened Oct
2017.
STRATEGIES & PERFORMANCE | CORPORATE INDICATORS
Page 40
Indicator 1 - Our social infrastructure and services are highly valued
and engaging
We will know this by:
Our community positively rates the provision of services and facilities. % of Charles Sturt residents that are active library members. Membership of sporting facilities provided by the City of Charles Sturt as a % of our
population. The number of participant contacts at Council’s Community Centres. The number of Community Care service outputs compared to our Commonwealth
funding targets. The utilisation of Council owned halls is growing with an increase of 20% by 2020. Number of people participating in community programs.
Our community positively rates the provision of services and facilities
We surveyed our community to gain some insight into satisfaction with our social
infrastructure including libraries, community centres, sporting clubs and halls. 56% of our
survey respondents had recently used one or more of these facilities and overall 89% of
these people indicated that they were satisfied or very satisfied.
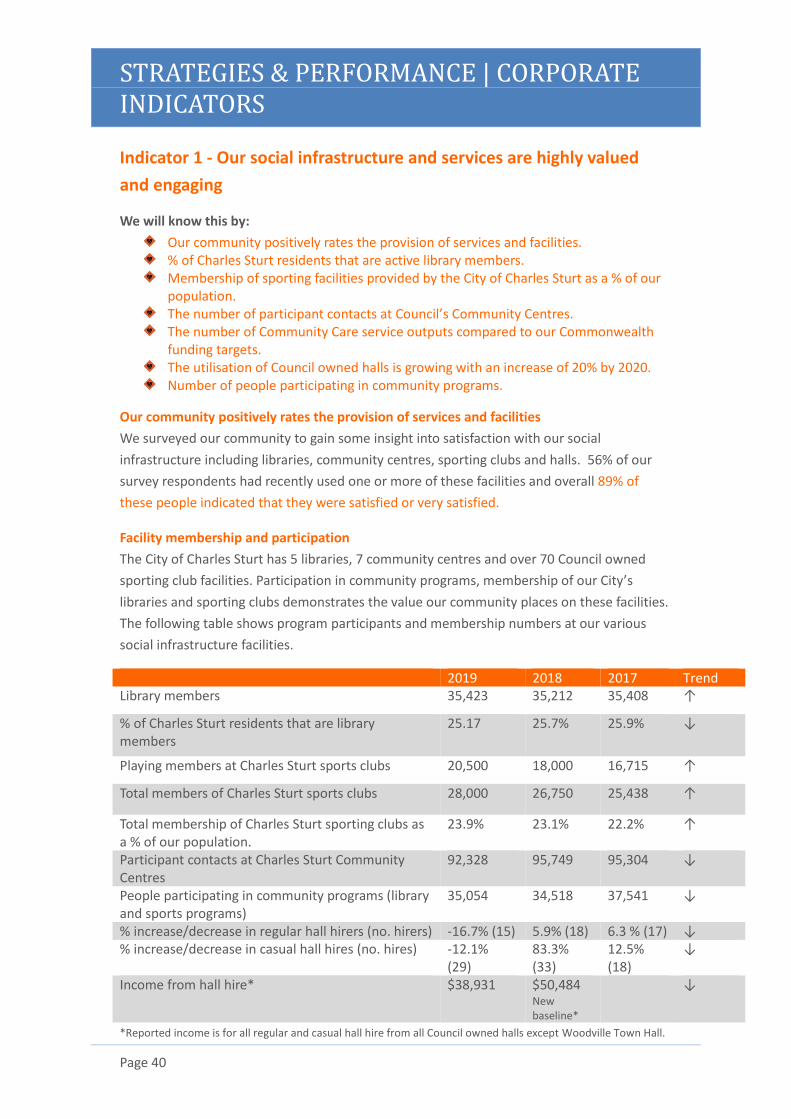
Facility membership and participation
The City of Charles Sturt has 5 libraries, 7 community centres and over 70 Council owned
sporting club facilities. Participation in community programs, membership of our City’s
libraries and sporting clubs demonstrates the value our community places on these facilities.
The following table shows program participants and membership numbers at our various
social infrastructure facilities.
2019 2018 2017 Trend Library members
35,423 35,212 35,408 ↑
% of Charles Sturt residents that are library members
25.17 25.7% 25.9% ↓
Playing members at Charles Sturt sports clubs
20,500 18,000 16,715 ↑
Total members of Charles Sturt sports clubs
28,000 26,750 25,438 ↑
Total membership of Charles Sturt sporting clubs as a % of our population.
23.9% 23.1% 22.2% ↑
Participant contacts at Charles Sturt Community Centres
92,328 95,749 95,304 ↓
People participating in community programs (library and sports programs)
35,054 34,518 37,541 ↓
% increase/decrease in regular hall hirers (no. hirers) -16.7% (15) 5.9% (18) 6.3 % (17) ↓ % increase/decrease in casual hall hires (no. hires) -12.1%
(29) 83.3% (33)
12.5% (18)
↓
Income from hall hire* $38,931 $50,484 New baseline*
↓
*Reported income is for all regular and casual hall hire from all Council owned halls except Woodville Town Hall.
STRATEGIES & PERFORMANCE | CORPORATE INDICATORS
Page 41
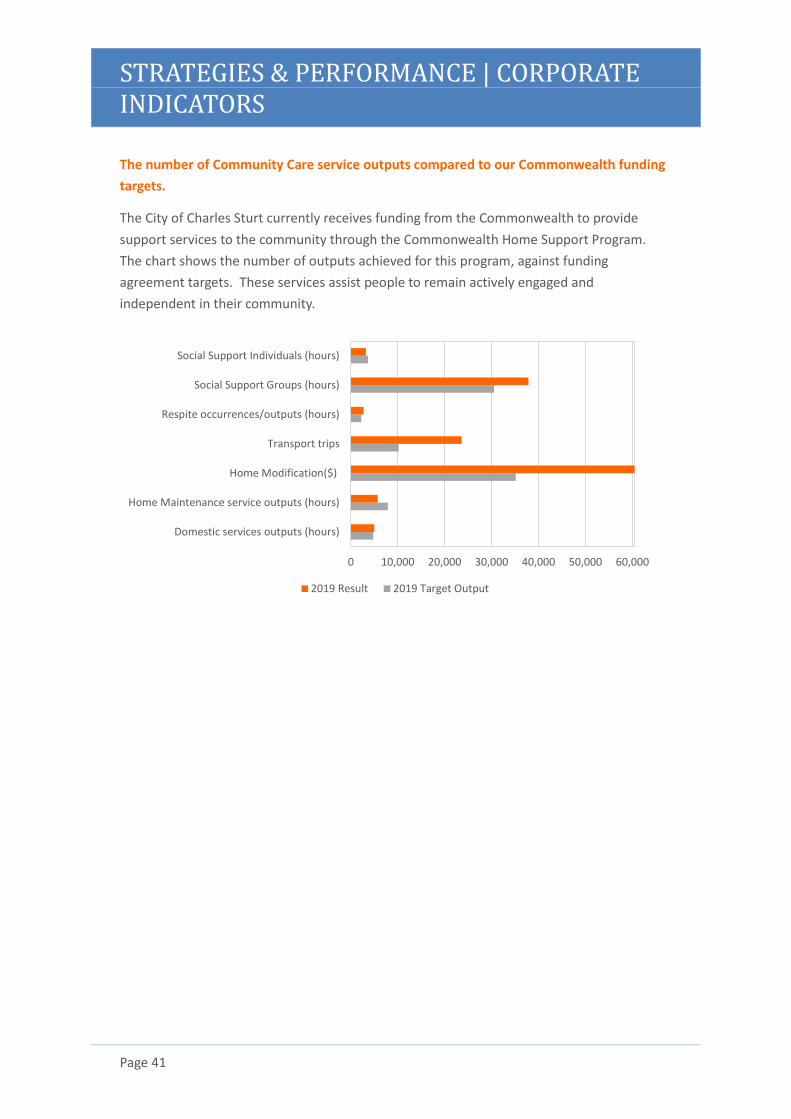
The number of Community Care service outputs compared to our Commonwealth funding
targets.
The City of Charles Sturt currently receives funding from the Commonwealth to provide
support services to the community through the Commonwealth Home Support Program.
The chart shows the number of outputs achieved for this program, against funding
agreement targets. These services assist people to remain actively engaged and
independent in their community.
0 10,000 20,000 30,000 40,000 50,000 60,000
Domestic services outputs (hours)
Home Maintenance service outputs (hours)
Home Modification($)
Transport trips
Respite occurrences/outputs (hours)
Social Support Groups (hours)
Social Support Individuals (hours)
2019 Result 2019 Target Output
STRATEGIES & PERFORMANCE | CORPORATE INDICATORS
Page 42
Indicator 2 - Our community feels connected and supported.
We will know this by: % of volunteer positions occupied. Number of website visits and disengagement rate within social media platforms. People have strong networks of support from family, friends and neighbours.
Volunteer positions occupied
A strong level of volunteering in a community is an indicator of community engagement and social connectedness. Our registered volunteers contribute to vibrant community life in Charles Sturt. In 2018/19, we had 340 volunteer positions and we partnered with 322 volunteers to deliver valued programs and services to our community. The % of volunteer positions occupied was 95% and our volunteer program delivered over 29,128 hours of volunteer service.
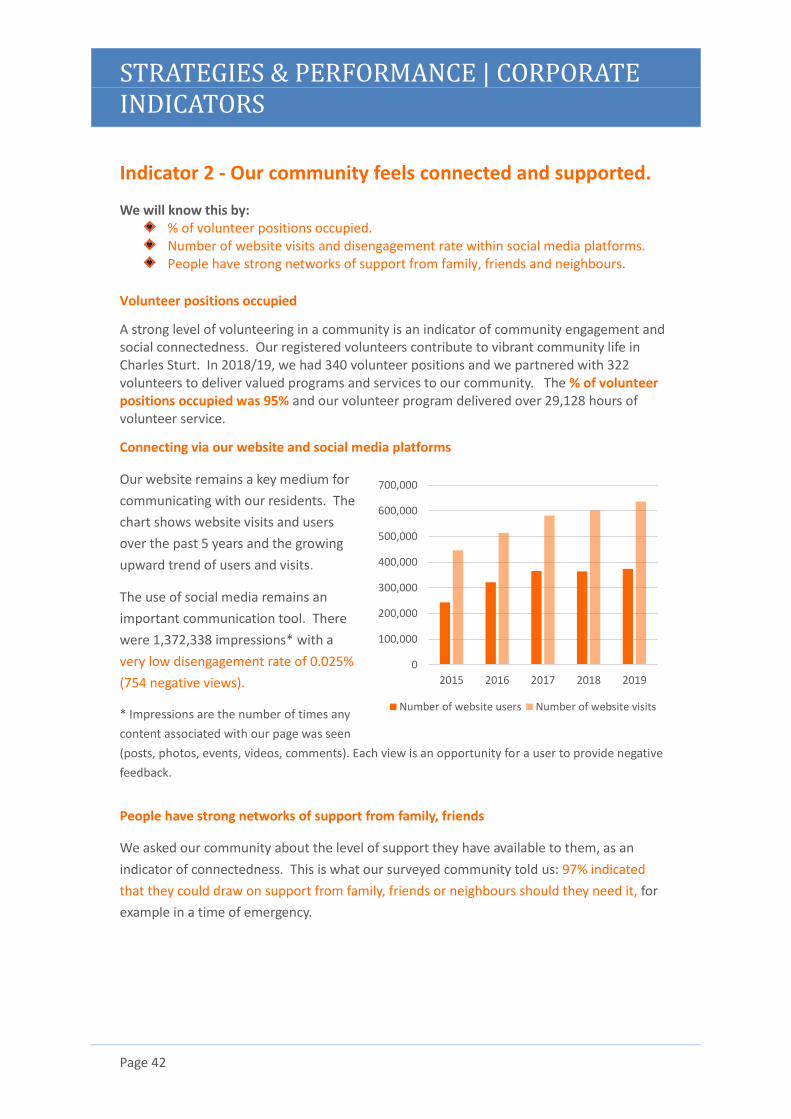
Connecting via our website and social media platforms
Our website remains a key medium for
communicating with our residents. The
chart shows website visits and users
over the past 5 years and the growing
upward trend of users and visits.
The use of social media remains an
important communication tool. There
were 1,372,338 impressions* with a
very low disengagement rate of 0.025%
(754 negative views).
* Impressions are the number of times any
content associated with our page was seen
(posts, photos, events, videos, comments). Each view is an opportunity for a user to provide negative
feedback.
People have strong networks of support from family, friends
We asked our community about the level of support they have available to them, as an
indicator of connectedness. This is what our surveyed community told us: 97% indicated
that they could draw on support from family, friends or neighbours should they need it, for
example in a time of emergency.
0
100,000
200,000
300,000
400,000
500,000
600,000
700,000
2015 2016 2017 2018 2019
Number of website users Number of website visits
STRATEGIES & PERFORMANCE | CORPORATE INDICATORS
Page 43
Indicator 3 - Our community members are participating in active
citizenship.
We will know this by:
Number of new Australian Citizens conferred in CCS Number of people participating in consultation projects. % of sports clubs participating in Council’s professional development program. Voter turnout Number of people and projects supported through Young Changemakers program.
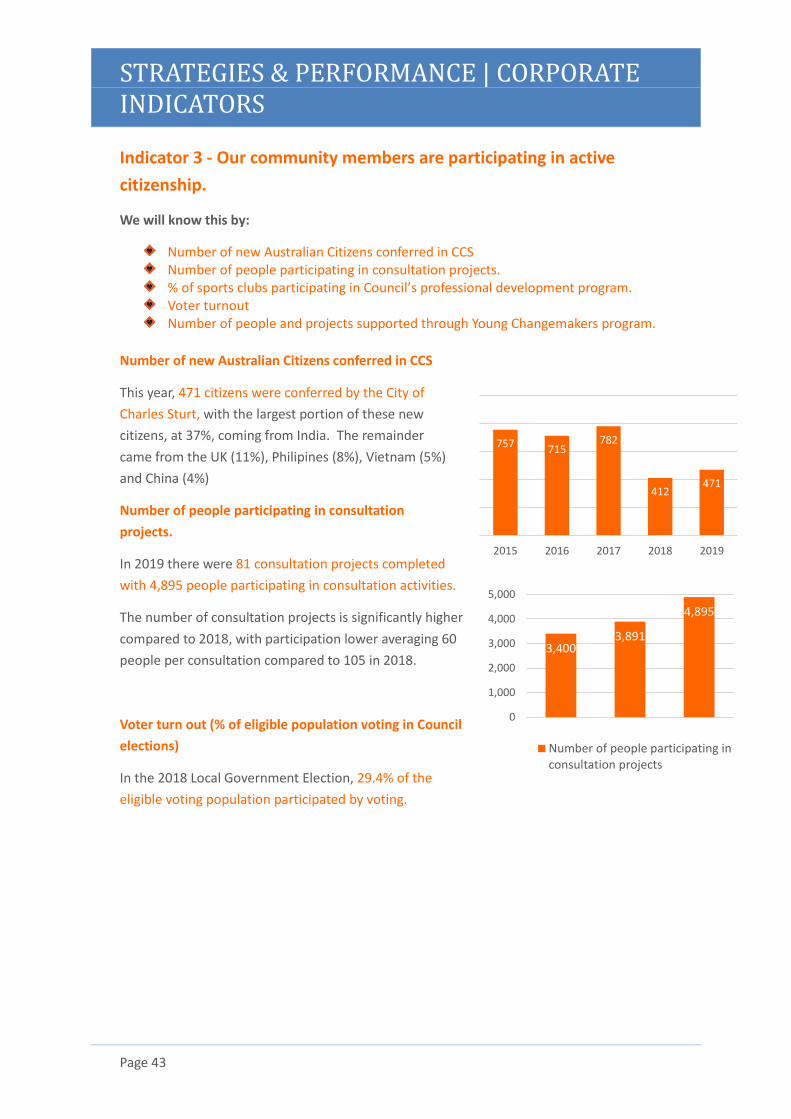
Number of new Australian Citizens conferred in CCS
This year, 471 citizens were conferred by the City of
Charles Sturt, with the largest portion of these new
citizens, at 37%, coming from India. The remainder
came from the UK (11%), Philipines (8%), Vietnam (5%)
and China (4%)
Number of people participating in consultation
projects.
In 2019 there were 81 consultation projects completed
with 4,895 people participating in consultation activities.
The number of consultation projects is significantly higher
compared to 2018, with participation lower averaging 60
people per consultation compared to 105 in 2018.
Voter turn out (% of eligible population voting in Council
elections)
In the 2018 Local Government Election, 29.4% of the
eligible voting population participated by voting.
3,4003,891
4,895
0
1,000
2,000
3,000
4,000
5,000
Number of people participating inconsultation projects
757 715782
412471
2015 2016 2017 2018 2019
STRATEGIES & PERFORMANCE | CORPORATE INDICATORS
Page 44
Sports club professional development program and Young Changemakers program 2019 2018 2017 Trend Clubs participating in Council's professional development program
65 45 45 ↑
% of sports clubs participating in professional development program
58% 60% 60% ↓
Number of projects supported through Young Changemakers program
10 8 2 ↑
Number of people supported through Young Changemakers program
670 365 184 ↑
Indicator 4 - Our proactive and compliance activities support
positive health and safety outcomes.
We will know this by:
Our citizens feel safe in their neighbourhood. % of immunisation coverage in Charles Sturt. % of dogs desexed compared to State average. % of building inspection policy quotas completed. % of food premises inspections that resulted in an
Improvement Notice being issued.
Our citizens feel safe in their neighbourhood.
We asked our community about how safe they felt in their neighbourhood. This is what our
surveyed community told us: 69% of residents feel safe in their neighbourhood day or night.
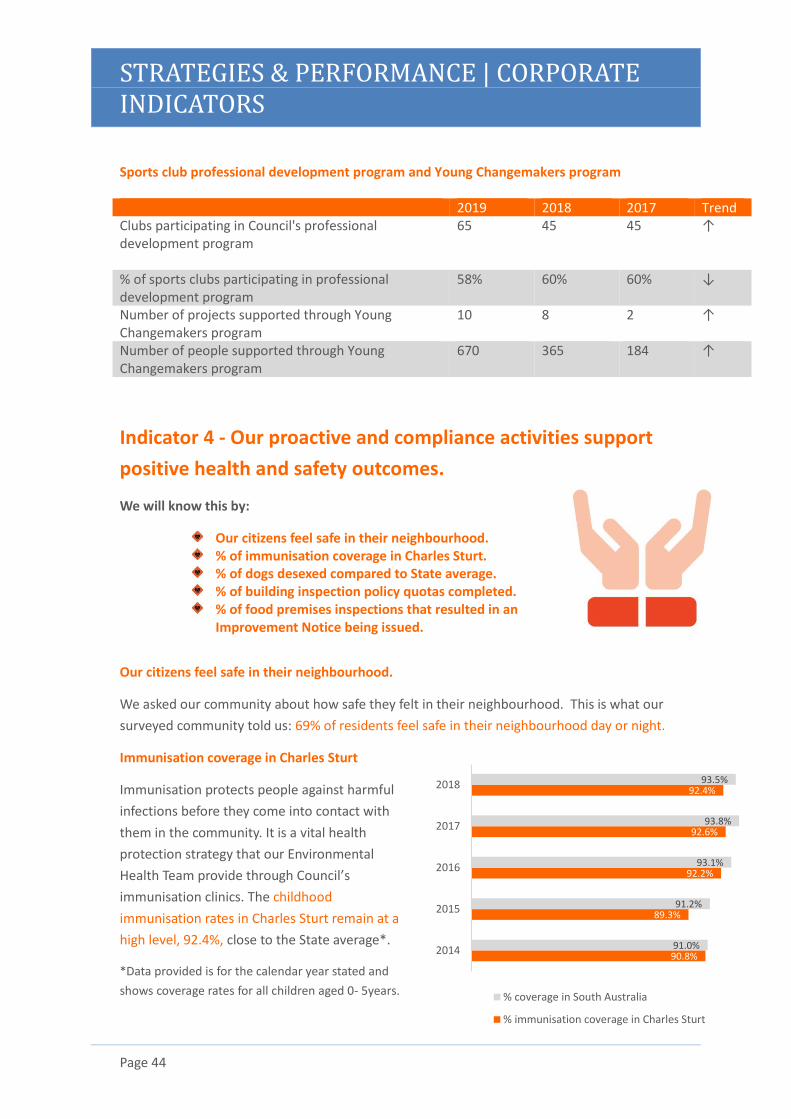
Immunisation coverage in Charles Sturt
Immunisation protects people against harmful
infections before they come into contact with
them in the community. It is a vital health
protection strategy that our Environmental
Health Team provide through Council’s
immunisation clinics. The childhood
immunisation rates in Charles Sturt remain at a
high level, 92.4%, close to the State average*.
*Data provided is for the calendar year stated and
shows coverage rates for all children aged 0- 5years.
90.8%
89.3%
92.2%
92.6%
92.4%
91.0%
91.2%
93.1%
93.8%
93.5%
2014
2015
2016
2017
2018
% coverage in South Australia
% immunisation coverage in Charles Sturt
STRATEGIES & PERFORMANCE | CORPORATE INDICATORS
Page 45
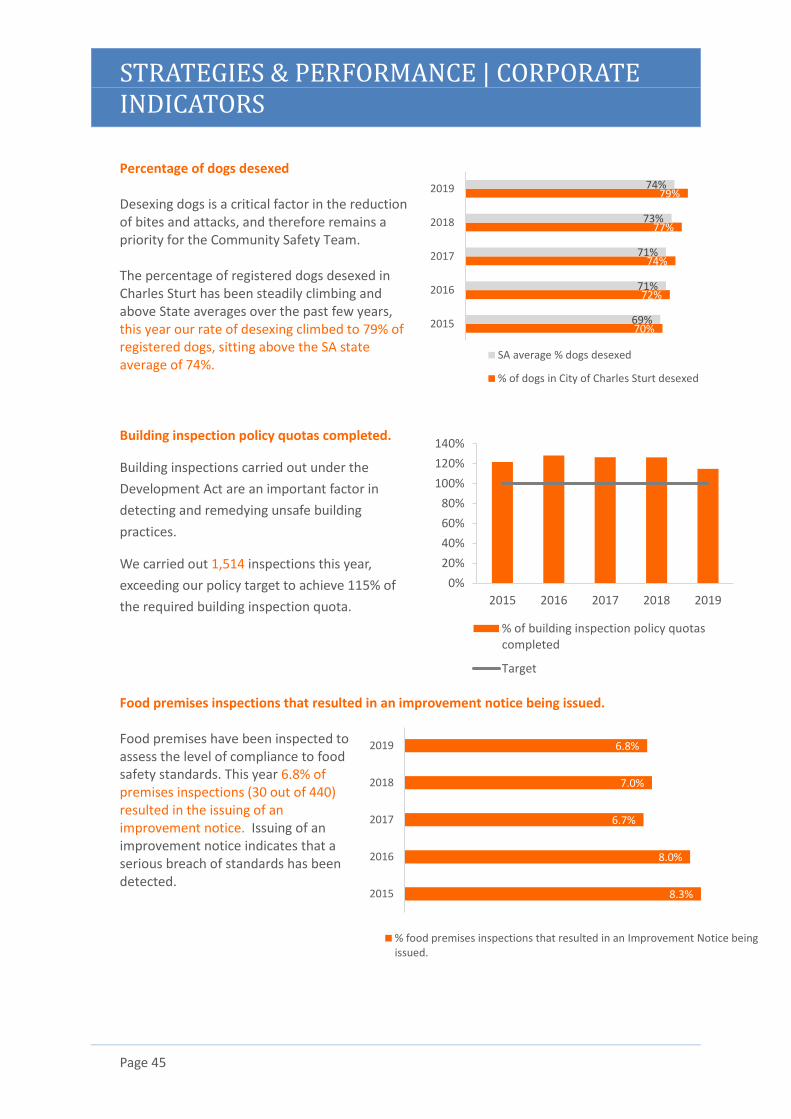
Percentage of dogs desexed Desexing dogs is a critical factor in the reduction of bites and attacks, and therefore remains a priority for the Community Safety Team. The percentage of registered dogs desexed in Charles Sturt has been steadily climbing and above State averages over the past few years, this year our rate of desexing climbed to 79% of registered dogs, sitting above the SA state average of 74%.
Building inspection policy quotas completed.
Building inspections carried out under the
Development Act are an important factor in
detecting and remedying unsafe building
practices.
We carried out 1,514 inspections this year,
exceeding our policy target to achieve 115% of
the required building inspection quota.
Food premises inspections that resulted in an improvement notice being issued. Food premises have been inspected to assess the level of compliance to food safety standards. This year 6.8% of premises inspections (30 out of 440) resulted in the issuing of an improvement notice. Issuing of an improvement notice indicates that a serious breach of standards has been detected.
70%
72%
74%
77%
79%
69%
71%
71%
73%
74%
2015
2016
2017
2018
2019
SA average % dogs desexed
% of dogs in City of Charles Sturt desexed
0%
20%
40%
60%
80%
100%
120%
140%
2015 2016 2017 2018 2019
% of building inspection policy quotascompleted
Target
8.3%
8.0%
6.7%
7.0%
6.8%
2015
2016
2017
2018
2019
% food premises inspections that resulted in an Improvement Notice beingissued.
STRATEGIES & PERFORMANCE | CORPORATE INDICATORS
Page 46
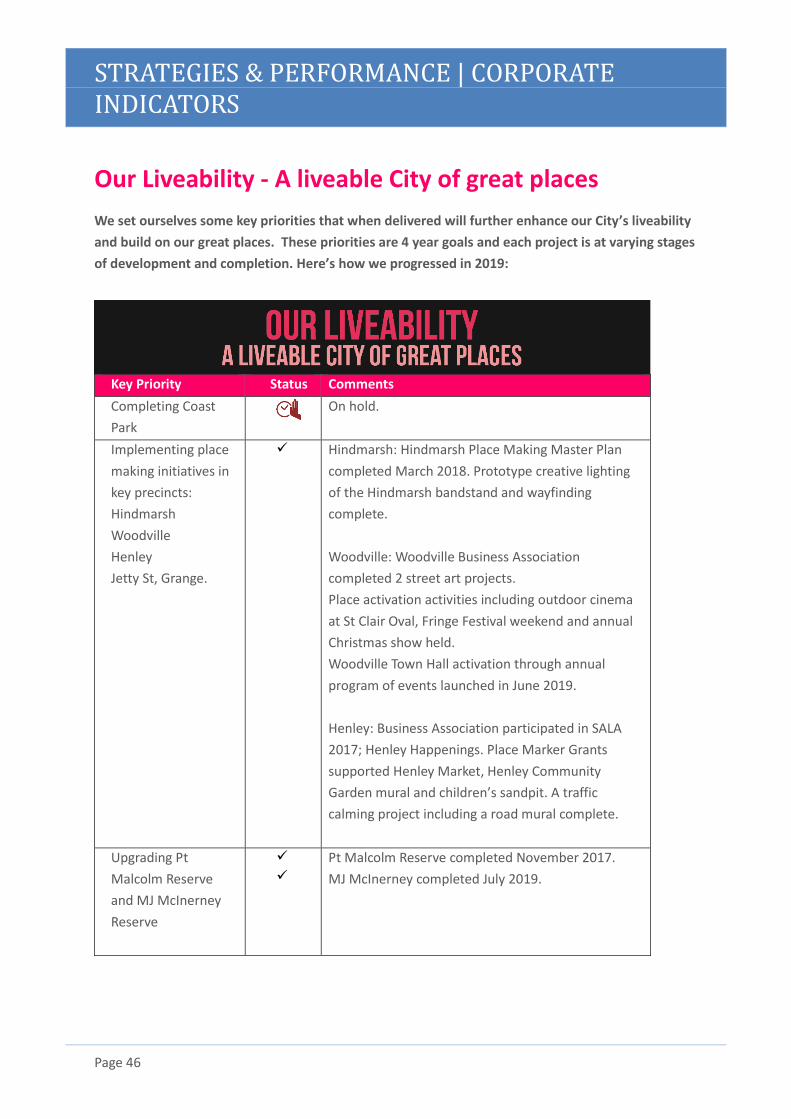
Our Liveability - A liveable City of great places
We set ourselves some key priorities that when delivered will further enhance our City’s liveability
and build on our great places. These priorities are 4 year goals and each project is at varying stages
of development and completion. Here’s how we progressed in 2019:
Key Priority Status Comments
Completing Coast
Park
On hold.
Implementing place
making initiatives in
key precincts:
Hindmarsh
Woodville
Henley
Jetty St, Grange.
✓ Hindmarsh: Hindmarsh Place Making Master Plan
completed March 2018. Prototype creative lighting
of the Hindmarsh bandstand and wayfinding
complete.
Woodville: Woodville Business Association
completed 2 street art projects.
Place activation activities including outdoor cinema
at St Clair Oval, Fringe Festival weekend and annual
Christmas show held.
Woodville Town Hall activation through annual
program of events launched in June 2019.
Henley: Business Association participated in SALA
2017; Henley Happenings. Place Marker Grants
supported Henley Market, Henley Community
Garden mural and children’s sandpit. A traffic
calming project including a road mural complete.
Upgrading Pt
Malcolm Reserve
and MJ McInerney
Reserve
✓
✓
Pt Malcolm Reserve completed November 2017.
MJ McInerney completed July 2019.
STRATEGIES & PERFORMANCE | CORPORATE INDICATORS
Page 47
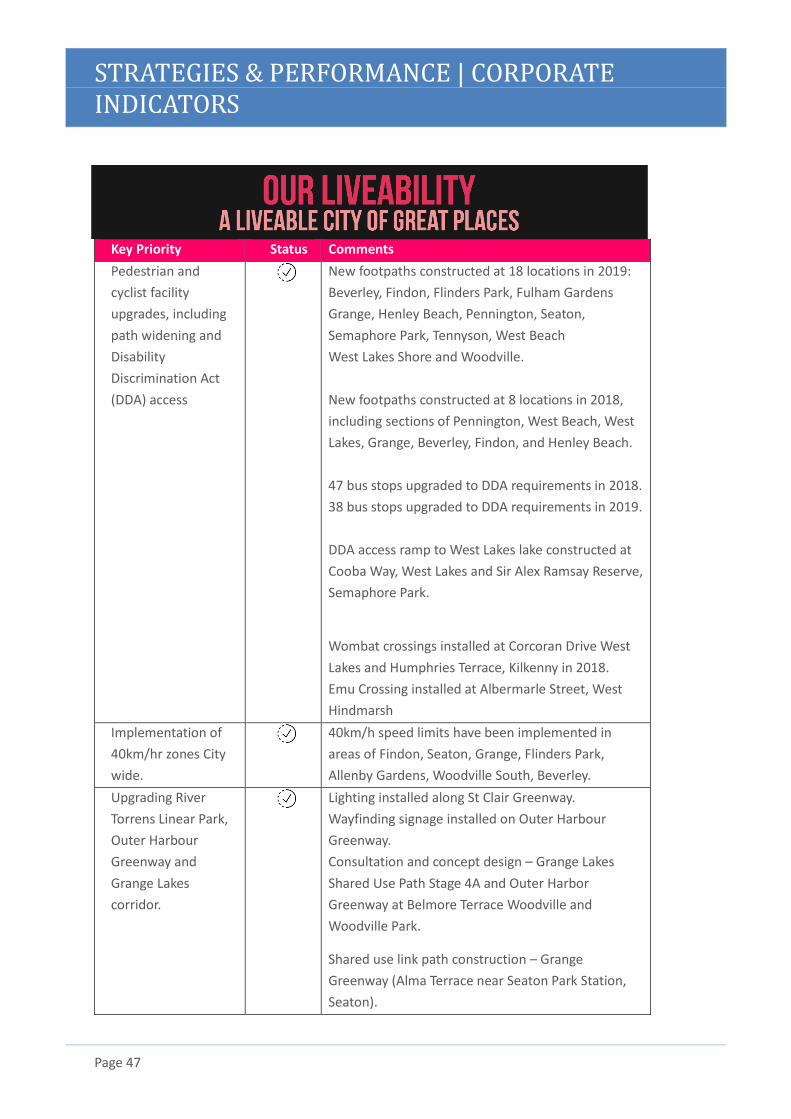
Key Priority Status Comments
Pedestrian and
cyclist facility
upgrades, including
path widening and
Disability
Discrimination Act
(DDA) access
New footpaths constructed at 18 locations in 2019:
Beverley, Findon, Flinders Park, Fulham Gardens
Grange, Henley Beach, Pennington, Seaton,
Semaphore Park, Tennyson, West Beach
West Lakes Shore and Woodville.
New footpaths constructed at 8 locations in 2018,
including sections of Pennington, West Beach, West
Lakes, Grange, Beverley, Findon, and Henley Beach.
47 bus stops upgraded to DDA requirements in 2018.
38 bus stops upgraded to DDA requirements in 2019.
DDA access ramp to West Lakes lake constructed at
Cooba Way, West Lakes and Sir Alex Ramsay Reserve,
Semaphore Park.
Wombat crossings installed at Corcoran Drive West
Lakes and Humphries Terrace, Kilkenny in 2018.
Emu Crossing installed at Albermarle Street, West
Hindmarsh
Implementation of
40km/hr zones City
wide.
40km/h speed limits have been implemented in
areas of Findon, Seaton, Grange, Flinders Park,
Allenby Gardens, Woodville South, Beverley.
Upgrading River
Torrens Linear Park,
Outer Harbour
Greenway and
Grange Lakes
corridor.
Lighting installed along St Clair Greenway.
Wayfinding signage installed on Outer Harbour
Greenway.
Consultation and concept design – Grange Lakes
Shared Use Path Stage 4A and Outer Harbor
Greenway at Belmore Terrace Woodville and
Woodville Park.
Shared use link path construction – Grange
Greenway (Alma Terrace near Seaton Park Station,
Seaton).
STRATEGIES & PERFORMANCE | CORPORATE INDICATORS
Page 48
Key Priority Status Comments
Supporting the
completion of major
developments,
including WEST, St
Clair, Bowden,
Seaton and ROSAS
✓
West development stages 1 and 2 complete, Stage 3
advanced and Stage 4 is now on market.
St Clair Commonwealth Local Government Housing
Affordability fund completed in June 2018 delivering
220 dwellings over a 9 year period.
Bowden Stages 1 and 2 complete, advanced planning
for third Street and Origin site commenced.
Seaton not progressed by Renewal SA
Indicator 1 – Our City is meeting the needs of a changing
community.
We will know this by:
✓ Monitoring our City’s population growth ✓ The number of new dwellings that deliver housing choice in the City. ✓ Number of (%increase/decrease) development applications lodged.
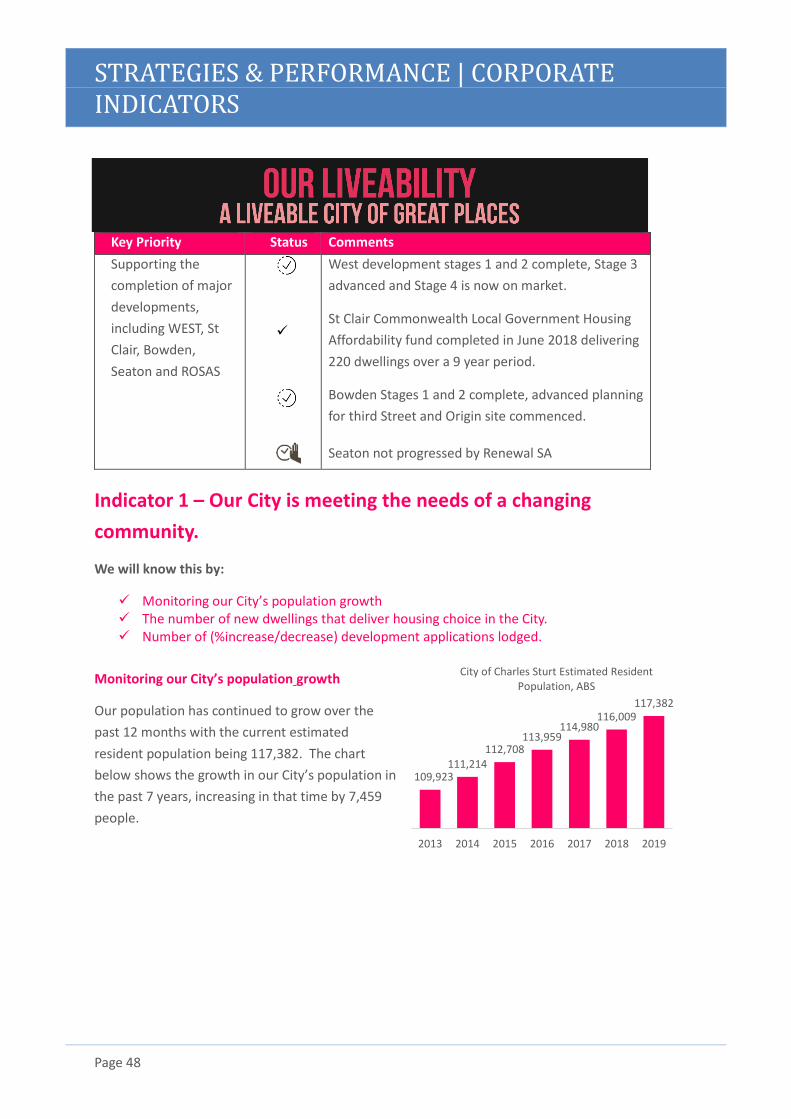
Monitoring our City’s population growth
Our population has continued to grow over the
past 12 months with the current estimated
resident population being 117,382. The chart
below shows the growth in our City’s population in
the past 7 years, increasing in that time by 7,459
people.
109,923111,214
112,708113,959
114,980116,009
117,382
2013 2014 2015 2016 2017 2018 2019
City of Charles Sturt Estimated Resident Population, ABS
STRATEGIES & PERFORMANCE | CORPORATE INDICATORS
Page 49
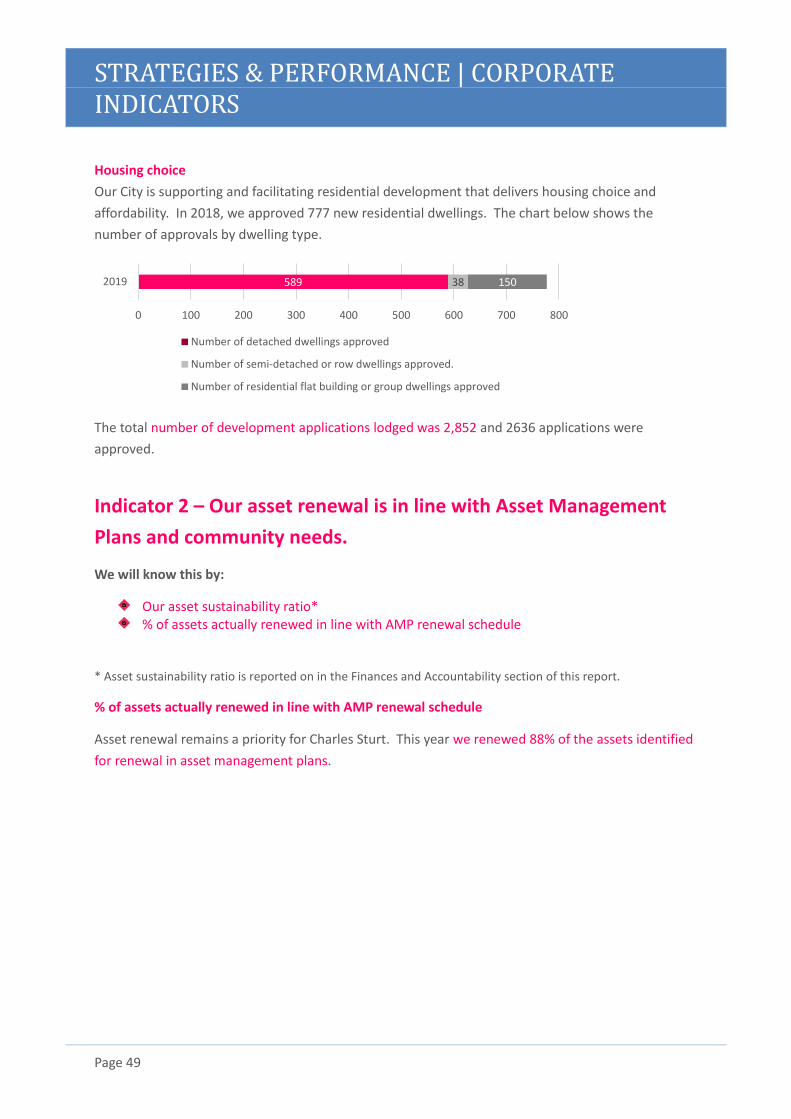
Housing choice
Our City is supporting and facilitating residential development that delivers housing choice and
affordability. In 2018, we approved 777 new residential dwellings. The chart below shows the
number of approvals by dwelling type.
The total number of development applications lodged was 2,852 and 2636 applications were
approved.
Indicator 2 – Our asset renewal is in line with Asset Management
Plans and community needs.
We will know this by:
Our asset sustainability ratio* % of assets actually renewed in line with AMP renewal schedule
* Asset sustainability ratio is reported on in the Finances and Accountability section of this report.
% of assets actually renewed in line with AMP renewal schedule
Asset renewal remains a priority for Charles Sturt. This year we renewed 88% of the assets identified
for renewal in asset management plans.
589 38 150
0 100 200 300 400 500 600 700 800
2019
Number of detached dwellings approved
Number of semi-detached or row dwellings approved.
Number of residential flat building or group dwellings approved
STRATEGIES & PERFORMANCE | CORPORATE INDICATORS
Page 50
Indicator 3 - Our City comprises vibrant and unique precincts.
We will know this by:
Number of collaborative partners involved in delivering events funded by the Strategic Events Partnership budget.
Average participation in business association meetings. Designated place community satisfaction survey.
2019 2018 2017 Trend Number of collaborative partners involved in delivering events funded by the Strategic Events Partnership budget
3 4* 2* ↓
Participation in Woodville business association meetings
0** 3 8 ↓
Participation in Henley business association meetings
0** 5 2 ↓
* figures for 2018 and 2017 have been corrected to reflect an improved reporting process.
** The business associations were inactive during 2018-2019.
Designated place community satisfaction survey
This has not been completed. Measurement of place metrics continues to be investigated.
Indicator 4 - Our roads are safe and our citizens are exercising choice
of travel mode.
We will know this by:
% of population utilising non-car travel modes to travel to work. Public transport patronage*. Number of motor vehicles per household. % of local roads with a 40km/hr speed limit. Number of road crashes is reducing.
* Public transport patronage is no longer being tracked.
STRATEGIES & PERFORMANCE | CORPORATE INDICATORS
Page 51
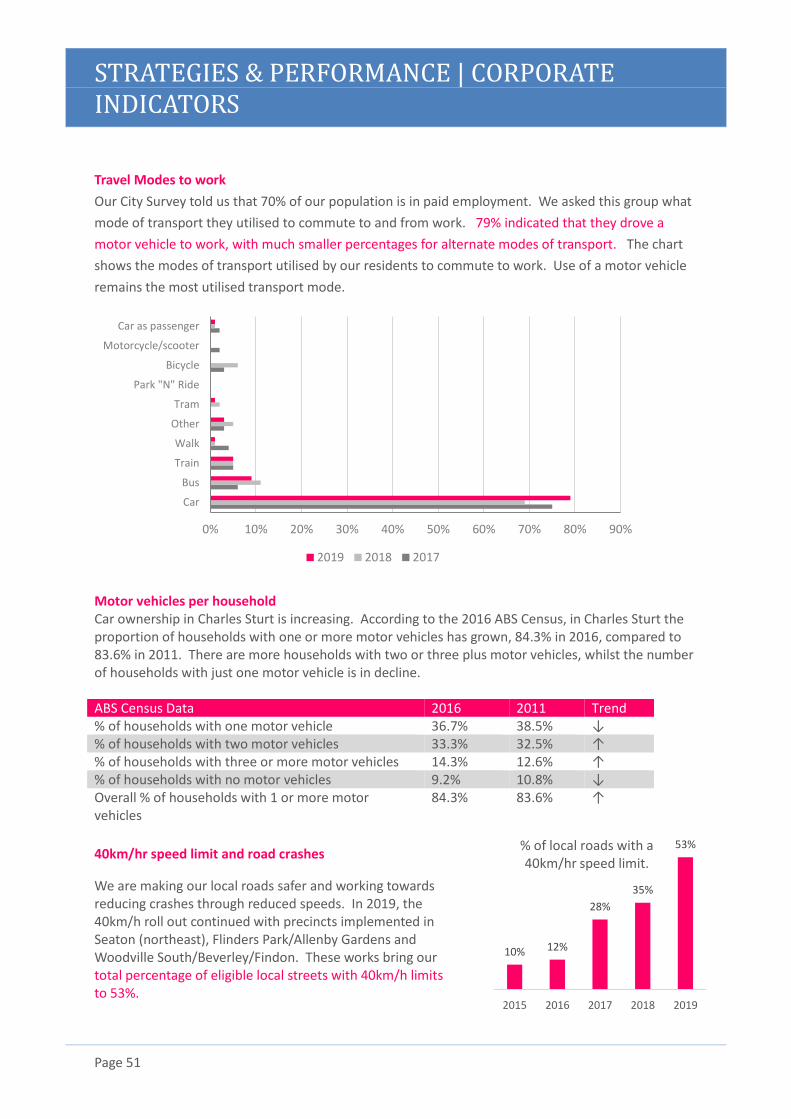
Travel Modes to work
Our City Survey told us that 70% of our population is in paid employment. We asked this group what
mode of transport they utilised to commute to and from work. 79% indicated that they drove a
motor vehicle to work, with much smaller percentages for alternate modes of transport. The chart
shows the modes of transport utilised by our residents to commute to work. Use of a motor vehicle
remains the most utilised transport mode.
Motor vehicles per household Car ownership in Charles Sturt is increasing. According to the 2016 ABS Census, in Charles Sturt the proportion of households with one or more motor vehicles has grown, 84.3% in 2016, compared to 83.6% in 2011. There are more households with two or three plus motor vehicles, whilst the number of households with just one motor vehicle is in decline. ABS Census Data 2016 2011 Trend % of households with one motor vehicle 36.7% 38.5% ↓ % of households with two motor vehicles 33.3% 32.5% ↑ % of households with three or more motor vehicles 14.3% 12.6% ↑ % of households with no motor vehicles 9.2% 10.8% ↓ Overall % of households with 1 or more motor vehicles
84.3% 83.6% ↑
40km/hr speed limit and road crashes
We are making our local roads safer and working towards reducing crashes through reduced speeds. In 2019, the 40km/h roll out continued with precincts implemented in Seaton (northeast), Flinders Park/Allenby Gardens and Woodville South/Beverley/Findon. These works bring our total percentage of eligible local streets with 40km/h limits to 53%.
0% 10% 20% 30% 40% 50% 60% 70% 80% 90%
Car
Bus
Train
Walk
Other
Tram
Park "N" Ride
Bicycle
Motorcycle/scooter
Car as passenger
2019 2018 2017
10% 12%
28%
35%
53%
2015 2016 2017 2018 2019
% of local roads with a 40km/hr speed limit.
STRATEGIES & PERFORMANCE | CORPORATE INDICATORS
Page 52
Crash statistics for 2019 recorded 322 crashes resulting in a casualty/fatality on roads in our City, 60 of those crashes being on Council owned local roads. This is a reduction of 21 crashes compared to 2018, where there were 343 crashes in total (260 non-local, 83 local). The most significant reduction of crashes occurred on Council owned local roads, down to 60 compared to 83 in the previous year. Council is currently undertaking a detailed review of the outcomes of the recently installed 40km/h Area Speed Limits to determine the impact they have had on road users, expected to be complete late 2020.
Indicator 5 - Our public and open spaces are well maintained and utilised.
We will know this by: % of surveyed residents positively rating their satisfaction with our public spaces. % of residents that live within 300m of quality open space. % programmed tree pruning completed. % programmed reserve mowing completed.
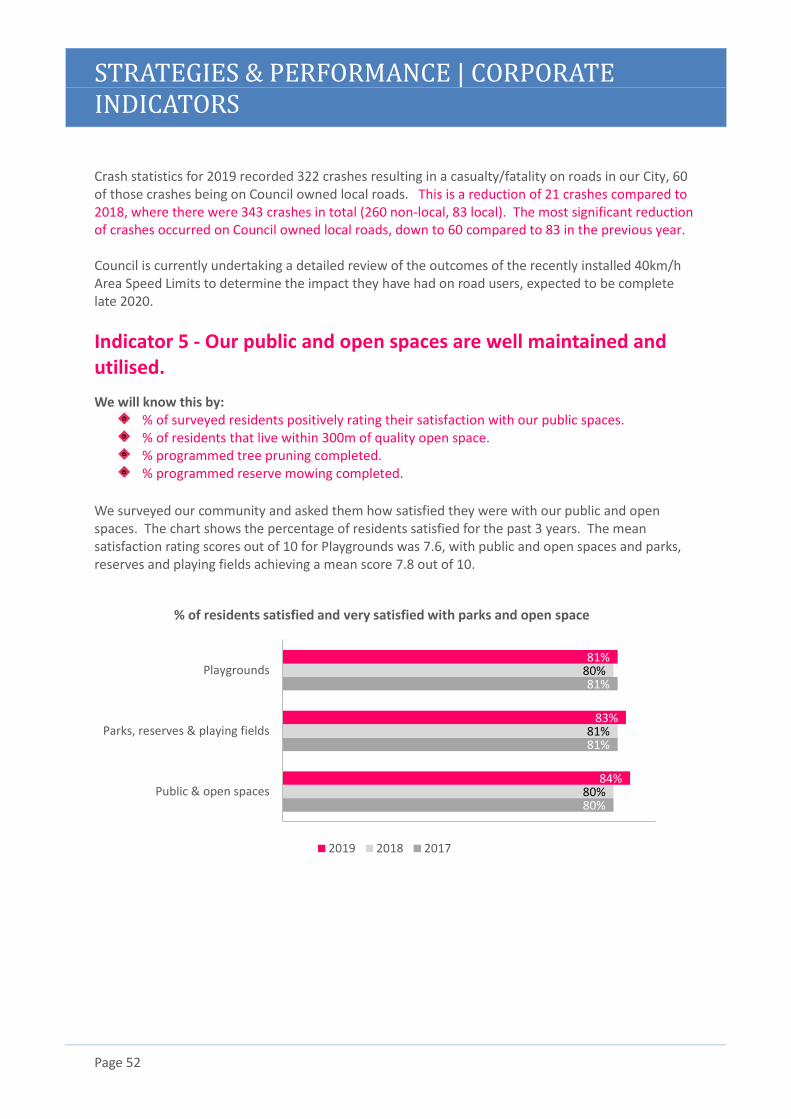
We surveyed our community and asked them how satisfied they were with our public and open spaces. The chart shows the percentage of residents satisfied for the past 3 years. The mean satisfaction rating scores out of 10 for Playgrounds was 7.6, with public and open spaces and parks, reserves and playing fields achieving a mean score 7.8 out of 10.
80%
81%
81%
80%
81%
80%
84%
83%
81%
Public & open spaces
Parks, reserves & playing fields
Playgrounds
% of residents satisfied and very satisfied with parks and open space
2019 2018 2017
STRATEGIES & PERFORMANCE | CORPORATE INDICATORS
Page 53
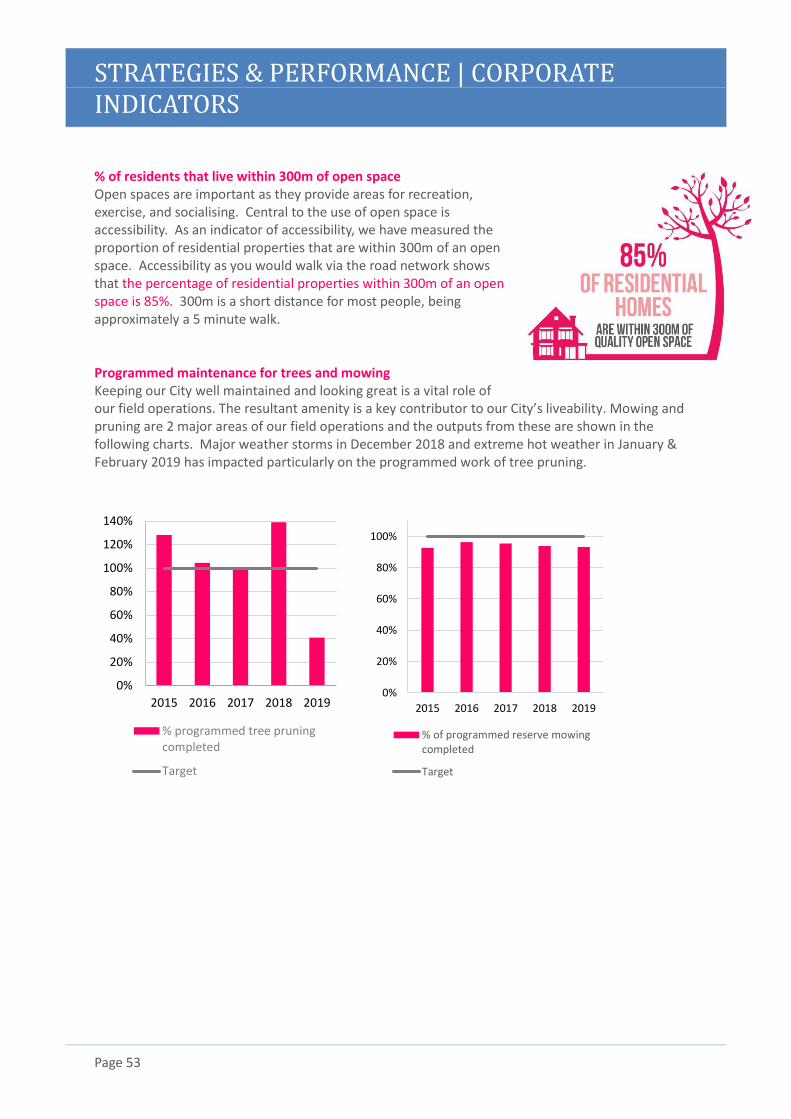
% of residents that live within 300m of open space Open spaces are important as they provide areas for recreation, exercise, and socialising. Central to the use of open space is accessibility. As an indicator of accessibility, we have measured the proportion of residential properties that are within 300m of an open space. Accessibility as you would walk via the road network shows that the percentage of residential properties within 300m of an open space is 85%. 300m is a short distance for most people, being approximately a 5 minute walk. Programmed maintenance for trees and mowing Keeping our City well maintained and looking great is a vital role of our field operations. The resultant amenity is a key contributor to our City’s liveability. Mowing and pruning are 2 major areas of our field operations and the outputs from these are shown in the following charts. Major weather storms in December 2018 and extreme hot weather in January & February 2019 has impacted particularly on the programmed work of tree pruning.
0%
20%
40%
60%
80%
100%
120%
140%
2015 2016 2017 2018 2019
% programmed tree pruningcompleted
Target
0%
20%
40%
60%
80%
100%
2015 2016 2017 2018 2019
% of programmed reserve mowingcompleted
Target
STRATEGIES & PERFORMANCE | CORPORATE INDICATORS
Page 54
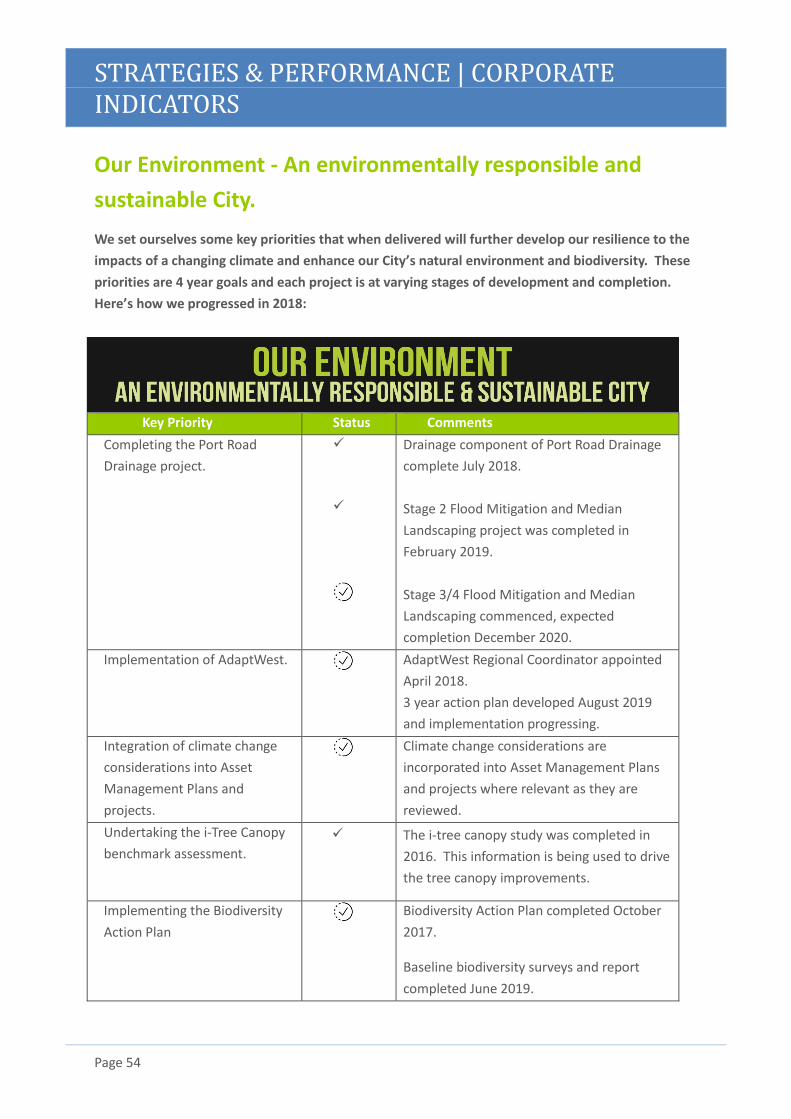
Our Environment - An environmentally responsible and
sustainable City.
We set ourselves some key priorities that when delivered will further develop our resilience to the
impacts of a changing climate and enhance our City’s natural environment and biodiversity. These
priorities are 4 year goals and each project is at varying stages of development and completion.
Here’s how we progressed in 2018:
Key Priority Status Comments
Completing the Port Road
Drainage project.
✓
✓
Drainage component of Port Road Drainage
complete July 2018.
Stage 2 Flood Mitigation and Median
Landscaping project was completed in
February 2019.
Stage 3/4 Flood Mitigation and Median
Landscaping commenced, expected
completion December 2020.
Implementation of AdaptWest.
AdaptWest Regional Coordinator appointed
April 2018.
3 year action plan developed August 2019
and implementation progressing.
Integration of climate change
considerations into Asset
Management Plans and
projects.
Climate change considerations are
incorporated into Asset Management Plans
and projects where relevant as they are
reviewed.
Undertaking the i-Tree Canopy
benchmark assessment.
✓ The i-tree canopy study was completed in
2016. This information is being used to drive
the tree canopy improvements.
Implementing the Biodiversity
Action Plan
Biodiversity Action Plan completed October
2017.
Baseline biodiversity surveys and report
completed June 2019.
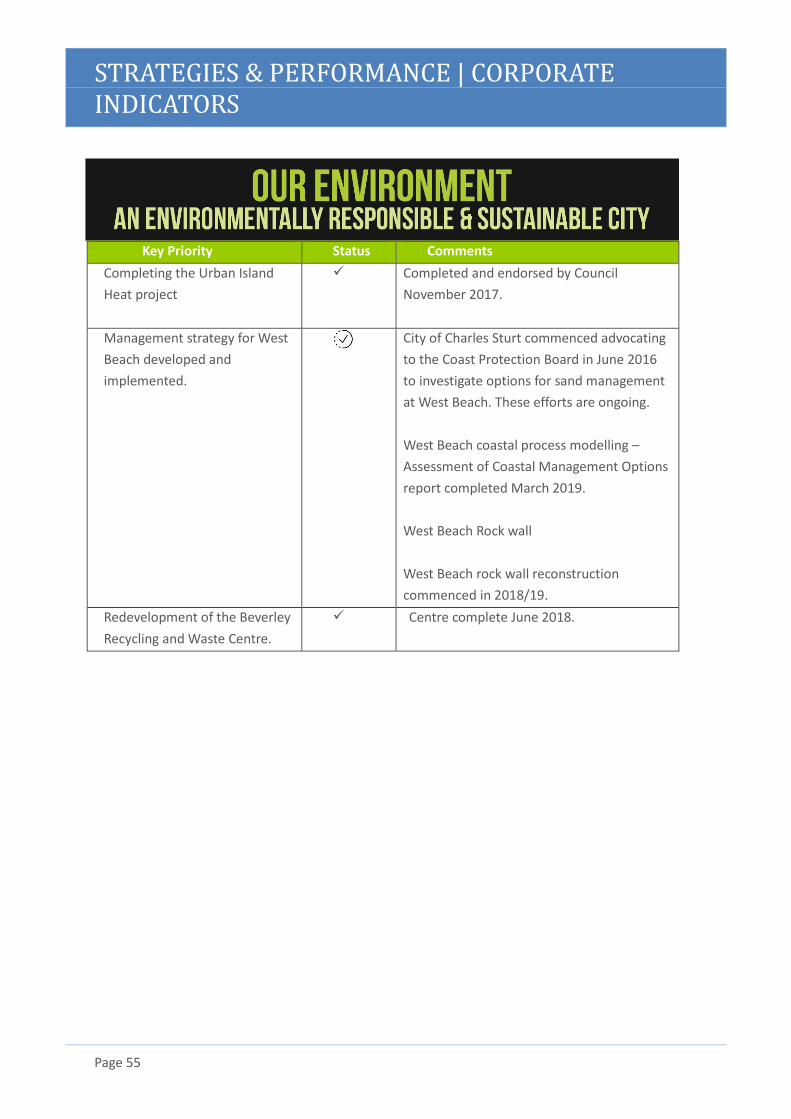
STRATEGIES & PERFORMANCE | CORPORATE INDICATORS
Page 55
Key Priority Status Comments
Completing the Urban Island
Heat project
✓ Completed and endorsed by Council
November 2017.
Management strategy for West
Beach developed and
implemented.
City of Charles Sturt commenced advocating
to the Coast Protection Board in June 2016
to investigate options for sand management
at West Beach. These efforts are ongoing.
West Beach coastal process modelling –
Assessment of Coastal Management Options
report completed March 2019.
West Beach Rock wall
West Beach rock wall reconstruction
commenced in 2018/19.
Redevelopment of the Beverley
Recycling and Waste Centre.
✓ Centre complete June 2018.
STRATEGIES & PERFORMANCE | CORPORATE INDICATORS
Page 56
Indicator 1 - Our adaption and resilience projects are progressing
We will know this by:
The Urban Heat Island project stage 1 is complete.
Integration of climate change considerations into Asset Management Plans.
Stage 3 Adapt West is complete and adaption pathways considered.
The Urban Heat Island project stage 1 is complete
The Urban Heat Island project is complete. The project provides insight into how urban design, green
infrastructure and different materials may affect temperatures at the local scale. The final report,
endorsed by Council in November 2017, and the heat mapping is helping to inform key decisions,
strategies and operations across Council, as well as to raise community awareness about urban heat
and climate change adaptation.
Integration of climate change considerations into Asset Management Plans
As Asset Management Plans come up for review, climate change considerations are being considered
for inclusion.
Stage 3 Adapt West is complete and adaption pathways considered
Stage 3 of the AdaptWest program was completed in 2016, upon adoption of the final Western
Adelaide (AdaptWest) Regional Climate Change Adaptation Plan.
The project entered into the implementation phase (AdaptWest in Action) in 2017/18. With support
from the State Government and AdaptWest partners (Cities of Port Adelaide Enfield and West
Torrens), an AdaptWest Regional Coordinator commenced in April 2018. Initiatives to date include
the establishment of a new website (www.adaptwest.com.au), trials considering the use of irrigation
for urban cooling in Council reserves, research into the cooling effects of garden treatments (based
on previous Urban Heat Island study), and grant funding received for preliminary investigations into
funding to improve climate change preparedness in homes of disadvantaged and vulnerable
residents.
STRATEGIES & PERFORMANCE | CORPORATE INDICATORS
Page 57
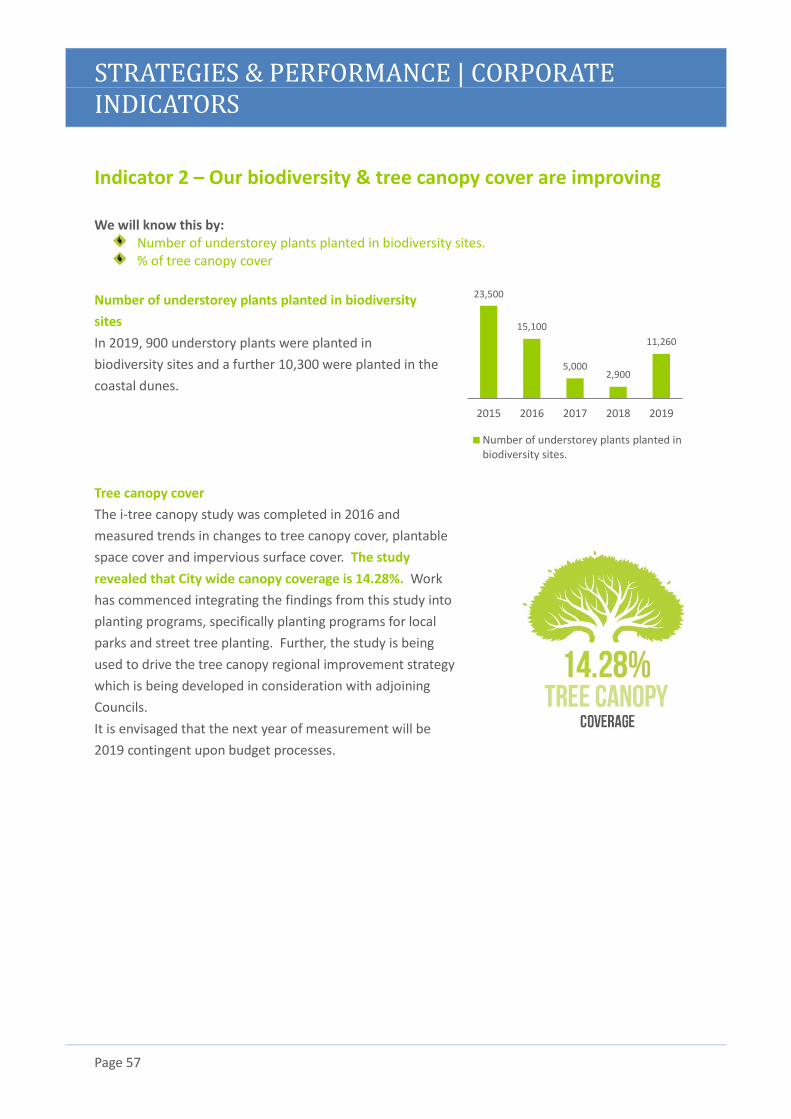
Indicator 2 – Our biodiversity & tree canopy cover are improving We will know this by:
Number of understorey plants planted in biodiversity sites. % of tree canopy cover
Number of understorey plants planted in biodiversity
sites
In 2019, 900 understory plants were planted in
biodiversity sites and a further 10,300 were planted in the
coastal dunes.
Tree canopy cover
The i-tree canopy study was completed in 2016 and
measured trends in changes to tree canopy cover, plantable
space cover and impervious surface cover. The study
revealed that City wide canopy coverage is 14.28%. Work
has commenced integrating the findings from this study into
planting programs, specifically planting programs for local
parks and street tree planting. Further, the study is being
used to drive the tree canopy regional improvement strategy
which is being developed in consideration with adjoining
Councils.
It is envisaged that the next year of measurement will be
2019 contingent upon budget processes.
23,500
15,100
5,0002,900
11,260
2015 2016 2017 2018 2019
Number of understorey plants planted inbiodiversity sites.
STRATEGIES & PERFORMANCE | CORPORATE INDICATORS
Page 58
Indicator 3 - Our environmental management & efficiency is
improving We will know this by:
Decrease in reliance of potable water. Decrease in waste sent to landfill. Stability or a reduction in our Greenhouse Gas emissions.
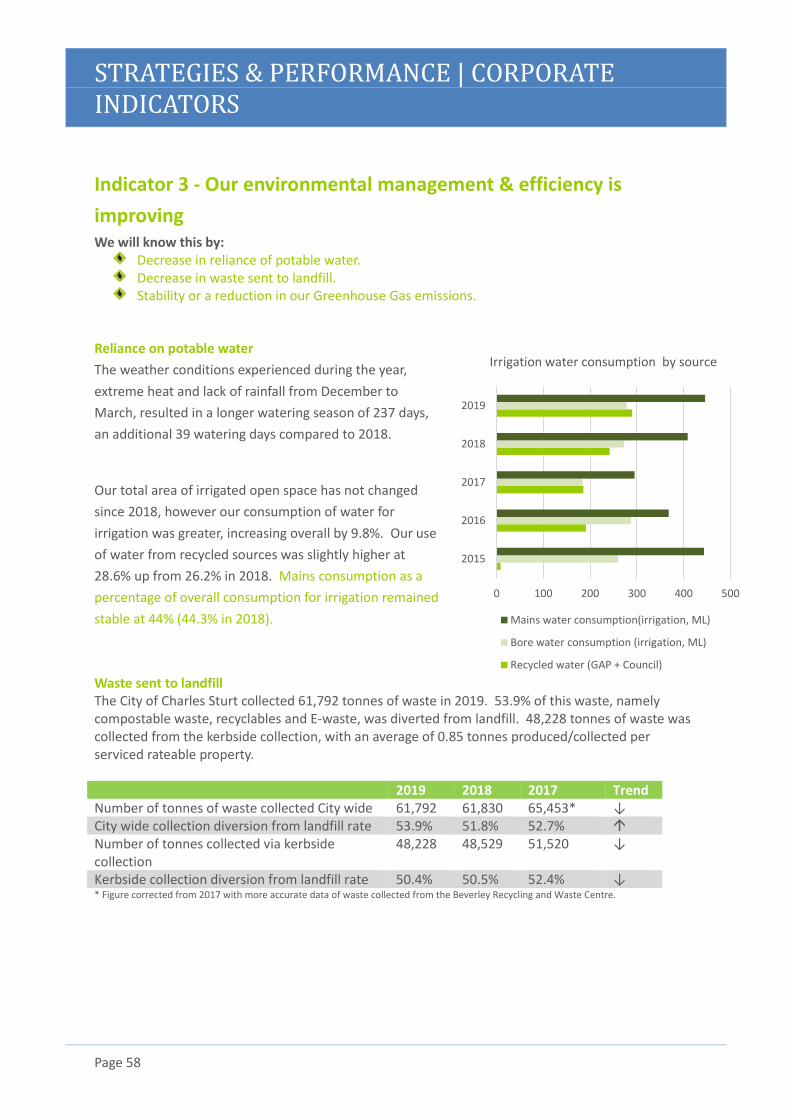
Reliance on potable water
The weather conditions experienced during the year,
extreme heat and lack of rainfall from December to
March, resulted in a longer watering season of 237 days,
an additional 39 watering days compared to 2018.
Our total area of irrigated open space has not changed
since 2018, however our consumption of water for
irrigation was greater, increasing overall by 9.8%. Our use
of water from recycled sources was slightly higher at
28.6% up from 26.2% in 2018. Mains consumption as a
percentage of overall consumption for irrigation remained
stable at 44% (44.3% in 2018).
Waste sent to landfill The City of Charles Sturt collected 61,792 tonnes of waste in 2019. 53.9% of this waste, namely compostable waste, recyclables and E-waste, was diverted from landfill. 48,228 tonnes of waste was collected from the kerbside collection, with an average of 0.85 tonnes produced/collected per serviced rateable property. 2019 2018 2017 Trend Number of tonnes of waste collected City wide 61,792 61,830 65,453* ↓ City wide collection diversion from landfill rate 53.9% 51.8% 52.7%
Number of tonnes collected via kerbside collection
48,228 48,529 51,520 ↓
Kerbside collection diversion from landfill rate 50.4% 50.5% 52.4% ↓ * Figure corrected from 2017 with more accurate data of waste collected from the Beverley Recycling and Waste Centre.
0 100 200 300 400 500
2015
2016
2017
2018
2019
Irrigation water consumption by source
Mains water consumption(irrigation, ML)
Bore water consumption (irrigation, ML)
Recycled water (GAP + Council)
STRATEGIES & PERFORMANCE | CORPORATE INDICATORS
Page 59
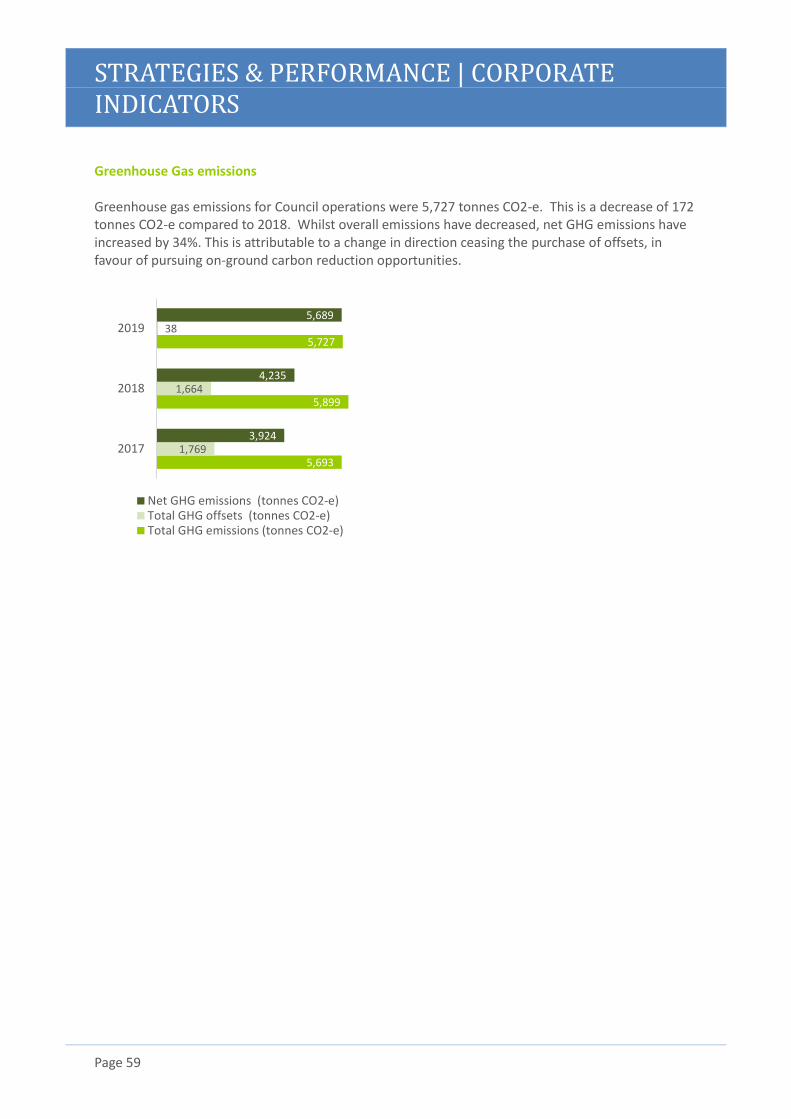
Greenhouse Gas emissions Greenhouse gas emissions for Council operations were 5,727 tonnes CO2-e. This is a decrease of 172 tonnes CO2-e compared to 2018. Whilst overall emissions have decreased, net GHG emissions have increased by 34%. This is attributable to a change in direction ceasing the purchase of offsets, in favour of pursuing on-ground carbon reduction opportunities.
5,693
5,899
5,727
1,769
1,664
38
3,924
4,235
5,689
2017
2018
2019
Net GHG emissions (tonnes CO2-e)Total GHG offsets (tonnes CO2-e)Total GHG emissions (tonnes CO2-e)
STRATEGIES & PERFORMANCE | CORPORATE INDICATORS
Page 60
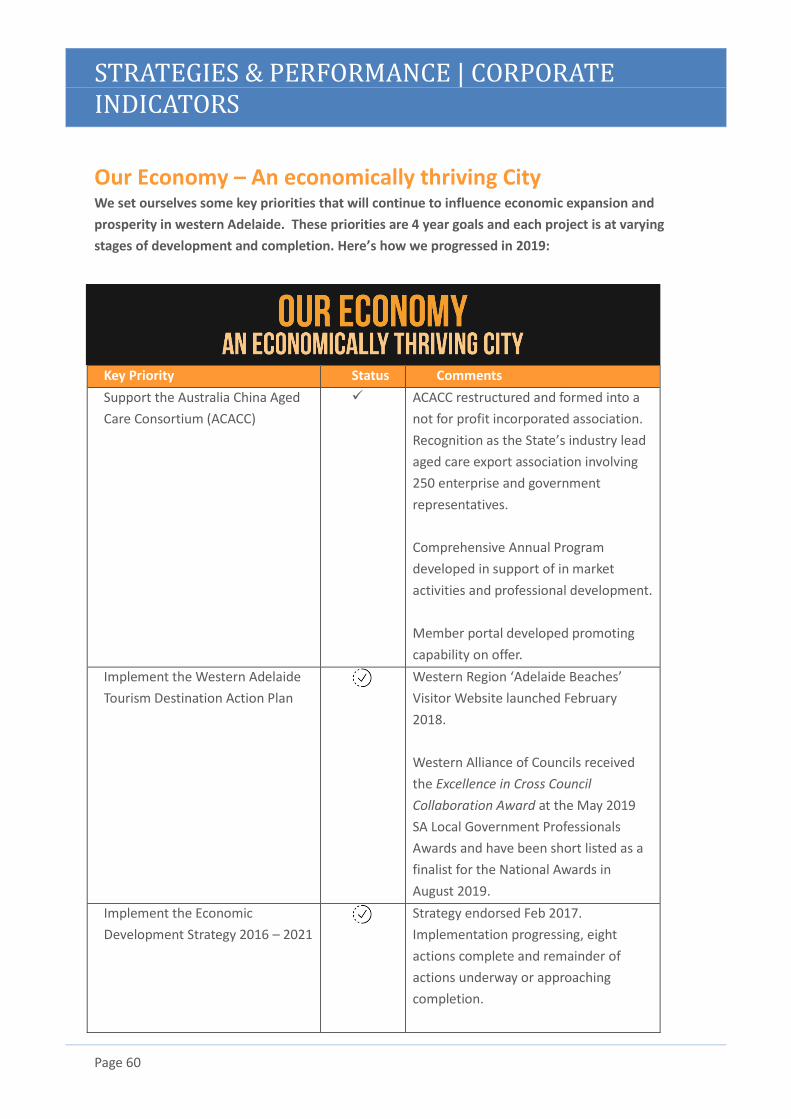
Our Economy – An economically thriving City We set ourselves some key priorities that will continue to influence economic expansion and
prosperity in western Adelaide. These priorities are 4 year goals and each project is at varying
stages of development and completion. Here’s how we progressed in 2019:
Key Priority Status Comments
Support the Australia China Aged
Care Consortium (ACACC)
✓ ACACC restructured and formed into a
not for profit incorporated association.
Recognition as the State’s industry lead
aged care export association involving
250 enterprise and government
representatives.
Comprehensive Annual Program
developed in support of in market
activities and professional development.
Member portal developed promoting
capability on offer.
Implement the Western Adelaide
Tourism Destination Action Plan
Western Region ‘Adelaide Beaches’
Visitor Website launched February
2018.
Western Alliance of Councils received
the Excellence in Cross Council
Collaboration Award at the May 2019
SA Local Government Professionals
Awards and have been short listed as a
finalist for the National Awards in
August 2019.
Implement the Economic
Development Strategy 2016 – 2021
Strategy endorsed Feb 2017.
Implementation progressing, eight
actions complete and remainder of
actions underway or approaching
completion.
STRATEGIES & PERFORMANCE | CORPORATE INDICATORS
Page 61
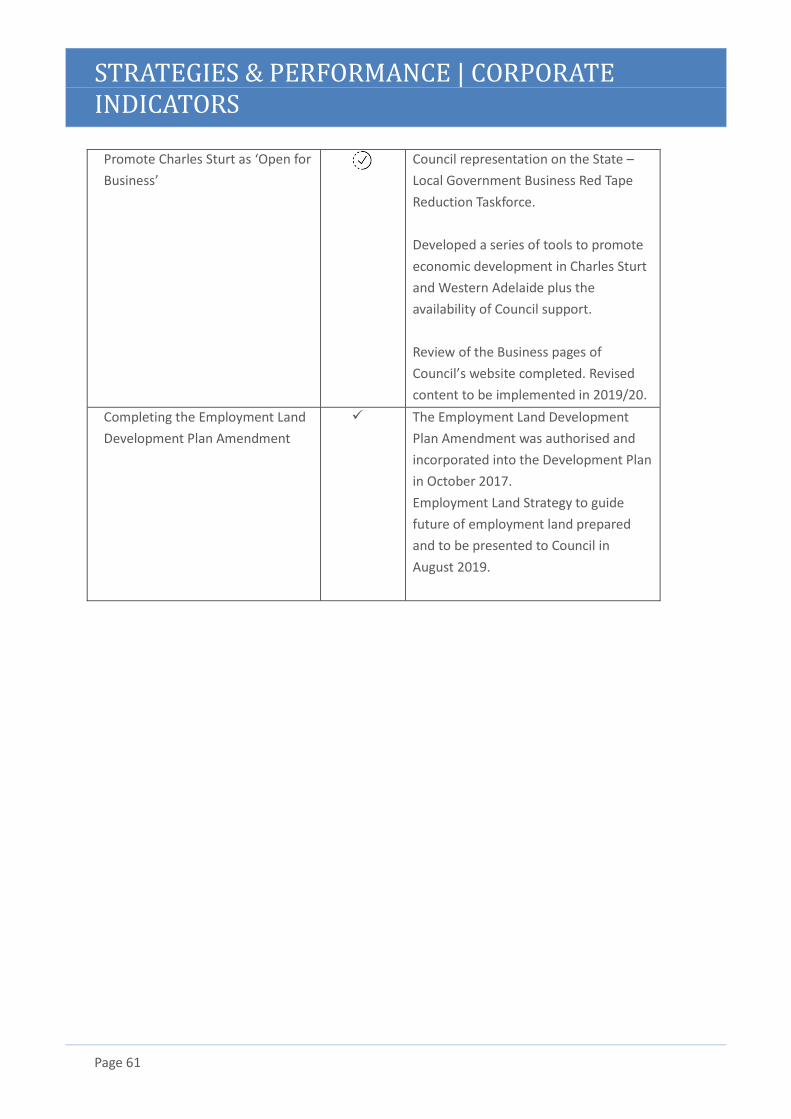
Promote Charles Sturt as ‘Open for
Business’
Council representation on the State –
Local Government Business Red Tape
Reduction Taskforce.
Developed a series of tools to promote
economic development in Charles Sturt
and Western Adelaide plus the
availability of Council support.
Review of the Business pages of
Council’s website completed. Revised
content to be implemented in 2019/20.
Completing the Employment Land
Development Plan Amendment
✓ The Employment Land Development
Plan Amendment was authorised and
incorporated into the Development Plan
in October 2017.
Employment Land Strategy to guide
future of employment land prepared
and to be presented to Council in
August 2019.
STRATEGIES & PERFORMANCE | CORPORATE INDICATORS
Page 62
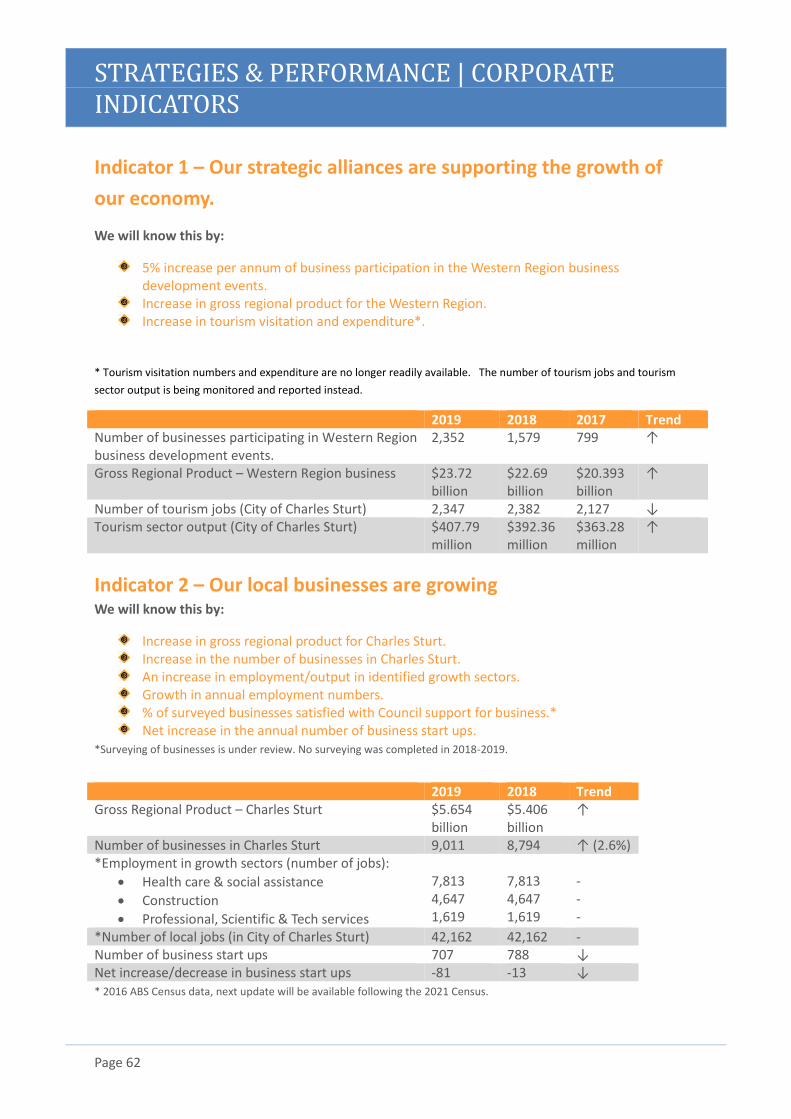
Indicator 1 – Our strategic alliances are supporting the growth of
our economy.
We will know this by:
5% increase per annum of business participation in the Western Region business development events.
Increase in gross regional product for the Western Region. Increase in tourism visitation and expenditure*.
* Tourism visitation numbers and expenditure are no longer readily available. The number of tourism jobs and tourism
sector output is being monitored and reported instead.
2019 2018 2017 Trend Number of businesses participating in Western Region business development events.
2,352 1,579 799 ↑
Gross Regional Product – Western Region business $23.72 billion
$22.69 billion
$20.393 billion
↑
Number of tourism jobs (City of Charles Sturt) 2,347 2,382 2,127 ↓ Tourism sector output (City of Charles Sturt) $407.79
million $392.36 million
$363.28 million
↑
Indicator 2 – Our local businesses are growing
We will know this by:
Increase in gross regional product for Charles Sturt. Increase in the number of businesses in Charles Sturt. An increase in employment/output in identified growth sectors. Growth in annual employment numbers. % of surveyed businesses satisfied with Council support for business.* Net increase in the annual number of business start ups.
*Surveying of businesses is under review. No surveying was completed in 2018-2019.
2019 2018 Trend Gross Regional Product – Charles Sturt $5.654
billion $5.406 billion
↑
Number of businesses in Charles Sturt 9,011 8,794 ↑ (2.6%) *Employment in growth sectors (number of jobs):
• Health care & social assistance
• Construction
• Professional, Scientific & Tech services
7,813 4,647 1,619
7,813 4,647 1,619
- - -
*Number of local jobs (in City of Charles Sturt) 42,162 42,162 - Number of business start ups 707 788 ↓ Net increase/decrease in business start ups -81 -13 ↓ * 2016 ABS Census data, next update will be available following the 2021 Census.
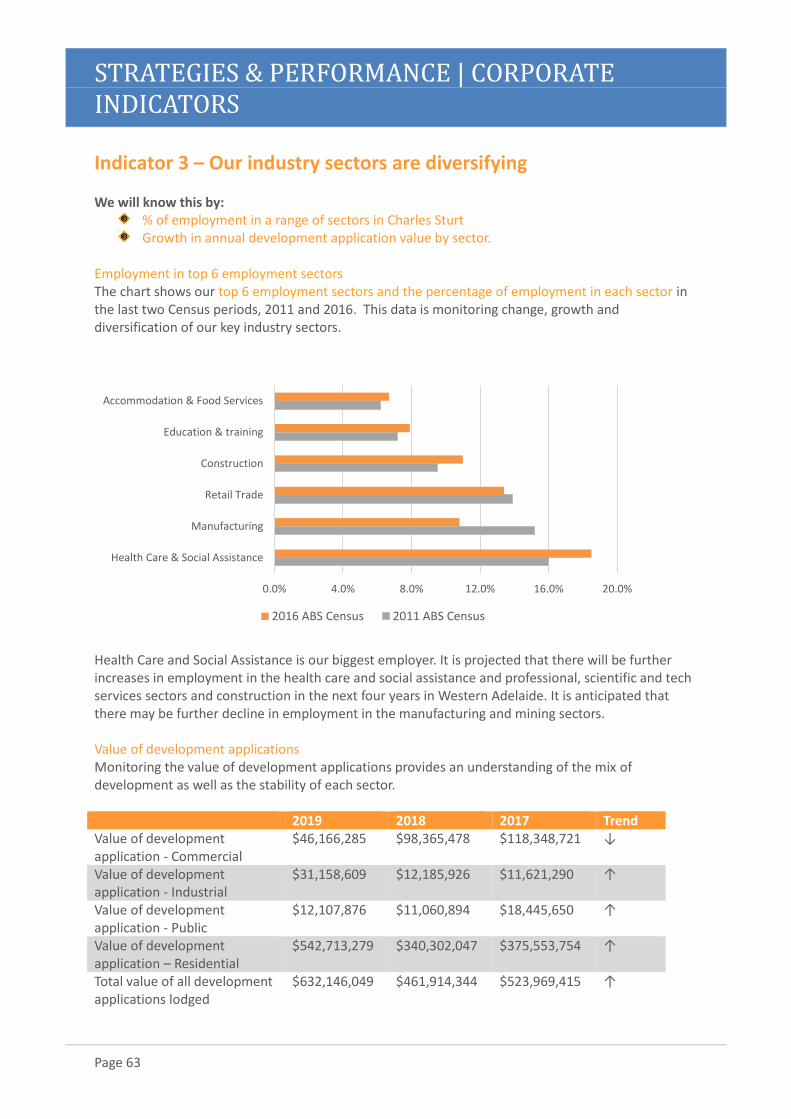
STRATEGIES & PERFORMANCE | CORPORATE INDICATORS
Page 63
Indicator 3 – Our industry sectors are diversifying We will know this by:
% of employment in a range of sectors in Charles Sturt Growth in annual development application value by sector.
Employment in top 6 employment sectors The chart shows our top 6 employment sectors and the percentage of employment in each sector in the last two Census periods, 2011 and 2016. This data is monitoring change, growth and diversification of our key industry sectors.
Health Care and Social Assistance is our biggest employer. It is projected that there will be further increases in employment in the health care and social assistance and professional, scientific and tech services sectors and construction in the next four years in Western Adelaide. It is anticipated that there may be further decline in employment in the manufacturing and mining sectors. Value of development applications Monitoring the value of development applications provides an understanding of the mix of development as well as the stability of each sector. 2019 2018 2017 Trend Value of development application - Commercial
$46,166,285
$98,365,478 $118,348,721 ↓
Value of development application - Industrial
$31,158,609 $12,185,926 $11,621,290
↑
Value of development application - Public
$12,107,876 $11,060,894 $18,445,650
↑
Value of development application – Residential
$542,713,279 $340,302,047 $375,553,754
↑
Total value of all development applications lodged
$632,146,049 $461,914,344 $523,969,415 ↑
0.0% 4.0% 8.0% 12.0% 16.0% 20.0%
Health Care & Social Assistance
Manufacturing
Retail Trade
Construction
Education & training
Accommodation & Food Services
2016 ABS Census 2011 ABS Census
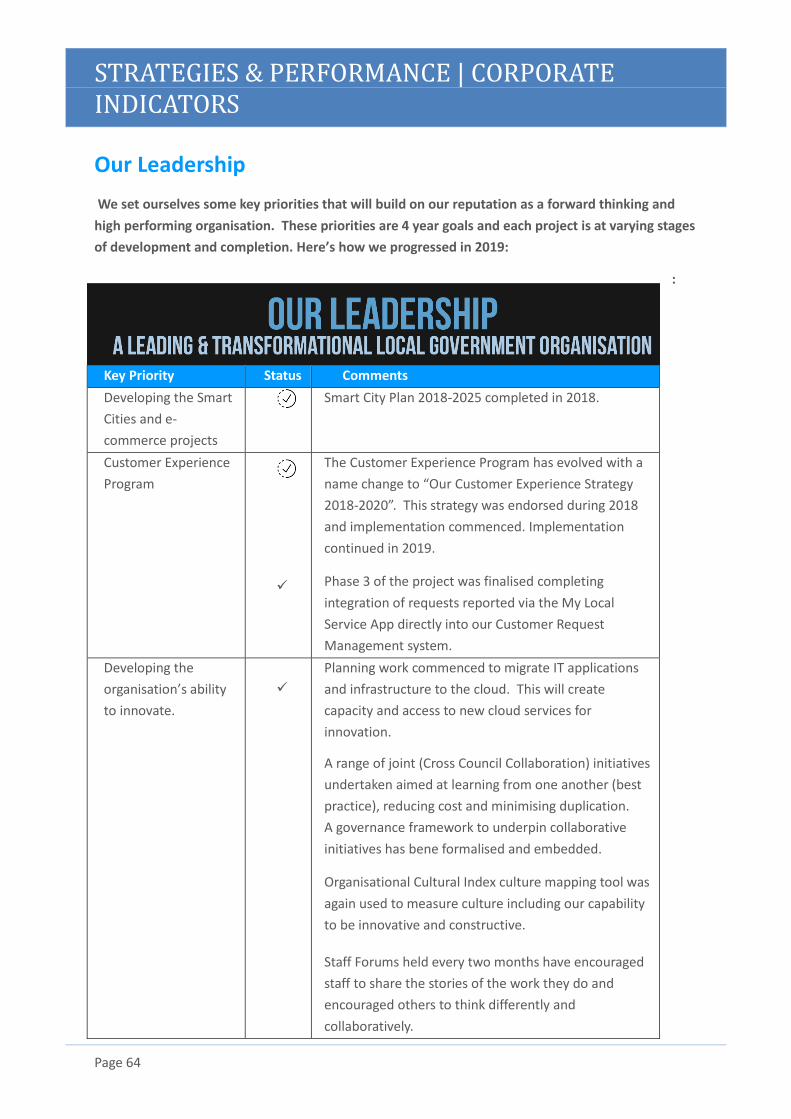
STRATEGIES & PERFORMANCE | CORPORATE INDICATORS
Page 64
Our Leadership
We set ourselves some key priorities that will build on our reputation as a forward thinking and
high performing organisation. These priorities are 4 year goals and each project is at varying stages
of development and completion. Here’s how we progressed in 2019:
:
Key Priority Status Comments
Developing the Smart
Cities and e-
commerce projects
Smart City Plan 2018-2025 completed in 2018.
Customer Experience
Program
✓
The Customer Experience Program has evolved with a
name change to “Our Customer Experience Strategy
2018-2020”. This strategy was endorsed during 2018
and implementation commenced. Implementation
continued in 2019.
Phase 3 of the project was finalised completing
integration of requests reported via the My Local
Service App directly into our Customer Request
Management system.
Developing the
organisation’s ability
to innovate.
✓ Planning work commenced to migrate IT applications
and infrastructure to the cloud. This will create
capacity and access to new cloud services for
innovation.
A range of joint (Cross Council Collaboration) initiatives
undertaken aimed at learning from one another (best
practice), reducing cost and minimising duplication.
A governance framework to underpin collaborative
initiatives has bene formalised and embedded.
Organisational Cultural Index culture mapping tool was
again used to measure culture including our capability
to be innovative and constructive.
Staff Forums held every two months have encouraged
staff to share the stories of the work they do and
encouraged others to think differently and
collaboratively.
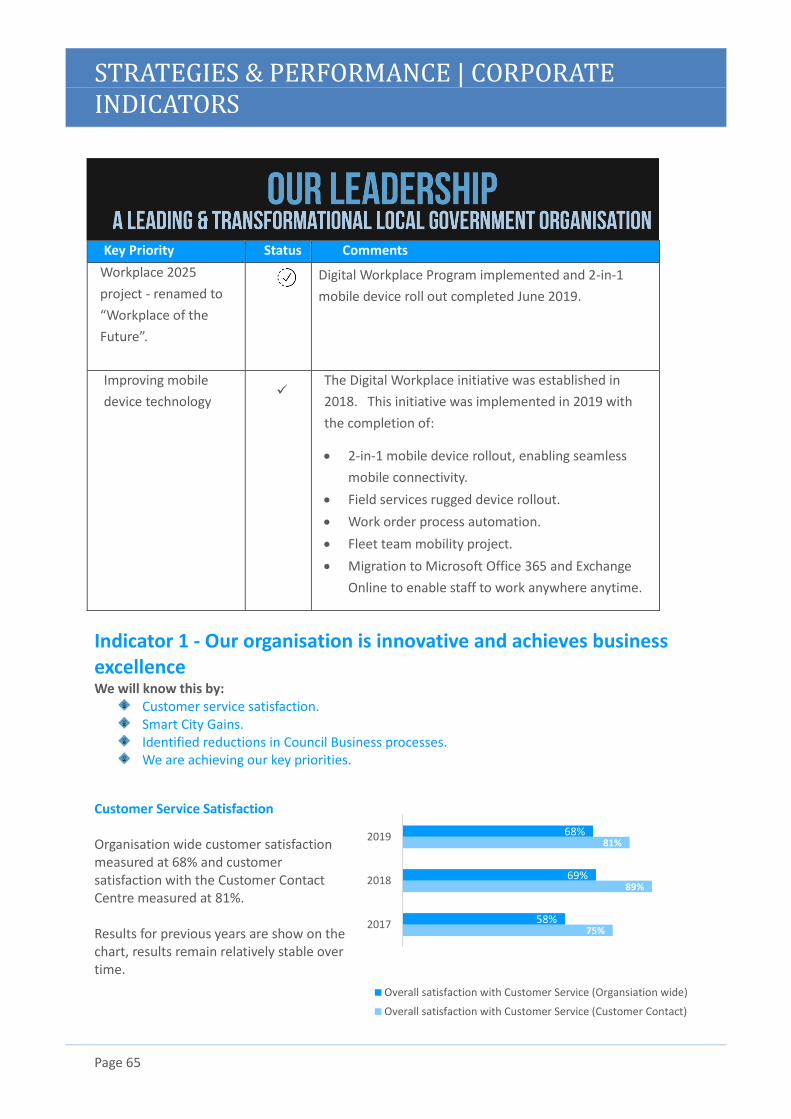
STRATEGIES & PERFORMANCE | CORPORATE INDICATORS
Page 65
Key Priority Status Comments
Workplace 2025
project - renamed to
“Workplace of the
Future”.
Digital Workplace Program implemented and 2-in-1
mobile device roll out completed June 2019.
Improving mobile
device technology
✓ The Digital Workplace initiative was established in
2018. This initiative was implemented in 2019 with
the completion of:
• 2-in-1 mobile device rollout, enabling seamless
mobile connectivity.
• Field services rugged device rollout.
• Work order process automation.
• Fleet team mobility project.
• Migration to Microsoft Office 365 and Exchange
Online to enable staff to work anywhere anytime.
Indicator 1 - Our organisation is innovative and achieves business excellence We will know this by:
Customer service satisfaction. Smart City Gains. Identified reductions in Council Business processes. We are achieving our key priorities.
Customer Service Satisfaction Organisation wide customer satisfaction measured at 68% and customer satisfaction with the Customer Contact Centre measured at 81%. Results for previous years are show on the chart, results remain relatively stable over time.
75%
89%
81%
58%
69%
68%
2017
2018
2019
Overall satisfaction with Customer Service (Organsiation wide)
Overall satisfaction with Customer Service (Customer Contact)
STRATEGIES & PERFORMANCE | CORPORATE INDICATORS
Page 66
Smart City Gains The City of Charles Sturt is keen to see our City continue to grow and develop to be the best it can be.
We are implementing our new strategy; Smart City Plan 2018-2025 which defines what Smart City
means for Charles Sturt and identifies objectives and actions that will be implemented. Here’s some
of our progress and projects in 2018/19:
• Development of a new City Futures role to capitalise on potential synergies across the City.
• Automated notifications solution for customer requests (non-work orders) implemented, closing the customer feedback loop and enhancing the customer experience.
• My Local Services app streamlined to improve the customer experience.
• Completed the open data policy to enhance transparency and enable data driven decision-making.
• ‘Smart’ parking sign installed at entrance to Henley Square (North) car park.
• State Government funding obtained to undertake a trial of ‘smart’ lighting along the Outer Harbor Greenway through St Clair.
• Leveraged the recycled water solution and extended it for Operational Intelligence trials to provide a cloud enterprise data platform for SCADA recycled water data, weather, PV generation, lab files, stormwater management (water levels) and digital meter readings for Beverly.
Identified reductions in Council Business processes Here’s some of the business improvements for 2019, each aiming to achieve business excellence and great customer service: City of Charles Sturt Cross Council Collaboration Collaborative partnership initiatives have been undertaken including:
• Service review analysis and benchmarking across partner Councils.
• Establishment of an Irrigation Team to service the irrigation systems across the Cities of Charles Sturt, Port Adelaide Enfield and Marion.
• Establishment of a joint ICT Project delivery initiative.
• Analysis of Fleet Procurement and Management.
• Service review of utilities management and business case development.
• Undertaking collaborative approach with PAE and Marion Councils and DPTI regarding the introduction of the new State Government Planning Code and electronic lodgement portal.
• A staff exchange with the City of Port Adelaide Enfield to facilitate social media skills and systems improvements.
• Implementation of E-Meetings to assist in the distribution of Council and Committee Agendas.
• Integration of requests reported via the My Local Service App directly into our Customer Request Management system creating a significant processing efficiency and ultimately improves the customer experience.
STRATEGIES & PERFORMANCE | CORPORATE INDICATORS
Page 67
LED street lighting rollout In 2018/19 there was a 10% reduction in street light electricity use due to Council changing an additional 3,000 street lights to LEDs. The energy efficiency street light project has currently replaced 5,700 inefficient lights with ones that use less energy. Charles Sturt’s War on Waste Impacts of the Chinese National Sword, and related waste issues and challenges, have been a major focus for Council in 2018/19. This emphasis has included a series of ‘Charles Sturt’s War on Waste’ Council workshops on key topics, with work continuing into 2019/20. Solar compacting public place bins 5 of these bins were installed in June 2018 in the Bowden Square precinct. These solar bins compact waste by a factor of up to 8 times, reducing the frequency with which litter bins must be emptied. This improves services to residents by reducing the likelihood of overfull and overflowing bins. ‘Smart’ bin caps are also being installed on a number of other (non-compacting) street litter bins, to monitor fullness and provide additional information to Council on efficient timing of bin emptying and frequency. AdaptWest – irrigation efficiencies trial with SA Water The 3 partner AdaptWest Councils have nominated one trial reserve each, and 1 control reserve each, to test the effects of carefully timed irrigation in achieving urban cooling effects in Council reserves. Temperature sensors were installed in late 2018 and early 2019. Trial outcomes will be made available following the 2019/20 summer period. CoolSeal Trial A trial to investigate the potential cooling benefits of using CoolSeal on roads has been completed. CoolSeal is an asphalt treatment that is grey in colour, far lighter than the traditional black road surface. Trial results have identified significant cooling benefits on the road surface, with further work recommended. Funding was secured from the LGA to assist with trial monitoring. Council Solutions Waste Tender process This tender involved a collaboration between 4 Councils – City of Charles Sturt, Port Adelaide Enfield, Marion and Adelaide City Council. The four Councils have worked together for several years to establish a joint tender process to ensure best services and pricing was secured for the Councils’ waste and recycling contracts. Streamlining of Property Search and incoming mail functions Process reviews were completed for the Property Search and incoming mail processing functions resulting in the implementation of actions to streamline and improve service delivery. IT Applications fitness reviews Application fitness reviews were completed to determine the future direction for various applications, including Contracts module, Electronic Document and Records Management System, online forms, and Digital Asset Management software.
STRATEGIES & PERFORMANCE | CORPORATE INDICATORS
Page 68
Ezybill electronic rates notices Ezybill implementation continued, providing ratepayers with the option to receive and store quarterly rates notice electronically, accessible on any electronic device (phone, tablet, laptop or desktop), 24 hours a day, seven days a week. An increase of 103% on 2017/18 in ratepayers now receiving their rates notices electronically was achieved, providing convenience, saving paper and reduces waste.
Asset Management improvements Review and consolidation of Asset Management Plans. Review and consolidation of rolling infrastructure condition audit and revaluation schedule. Transition to One Council data structure for infrastructure assets and adoption of Ci Anywhere. Implementation of Strategic Asset Management predictive modelling for Road & Path assets. We are achieving our key priorities Achievement towards our key priorities has been reported at the beginning of each theme reporting section. These key priorities are for the 4 year period of the City of Charles Sturt Corporate Plan 2016-2020 and progress will be tracked and reported for the duration.
STRATEGIES & PERFORMANCE | CORPORATE INDICATORS
Page 69
Indicator 2 - Our finances are sustainable. We will know this by:
Operating surplus ratio is >0% and <15%.* Net financial liabilities ratio is >100%.* Asset sustainability ratio is >80%.* $ value of grants and co-funding received. Resident acceptance of Council rates as value for money.
* These indicators are reported on in the Finances and Accountability section of this report.
Grants and co-funding received It is our desire to ensure that the City’s finances are well managed and that our ratepayers are receiving good value for their rates. We are vigorously pursuing grant and co-funding opportunities to help fund projects in our City. This year, we successfully obtained $24,885,824 in grants and co-funding. Value for money We asked our residents to indicate how satisfied they are that their rates provide value for money. 43% of residents indicated that they were satisfied that they received value for money in exchange for their rates. This is a slight decrease on the results from 2018, where 47% of residents were satisfied with value for money.
Indicator 3 - Our Organisational culture is collaborative, agile and
high performing
We will know this by:
% of our Portfolios demonstrating the benchmark level of constructive culture.
Charles Sturt is aiming to continue building a constructive culture in our workforce. We aspire to be a
high performing organisation of passionate people who work with resilience and confidence in
responding to and adapting to our community’s needs. The benchmark level of constructive culture
is to have our actual culture results measuring at the 50th percentile or above in four constructive
work styles. Our cultural surveying in 2019 showed that 14% of our Portfolios are demonstrating the
benchmark level of constructive culture.
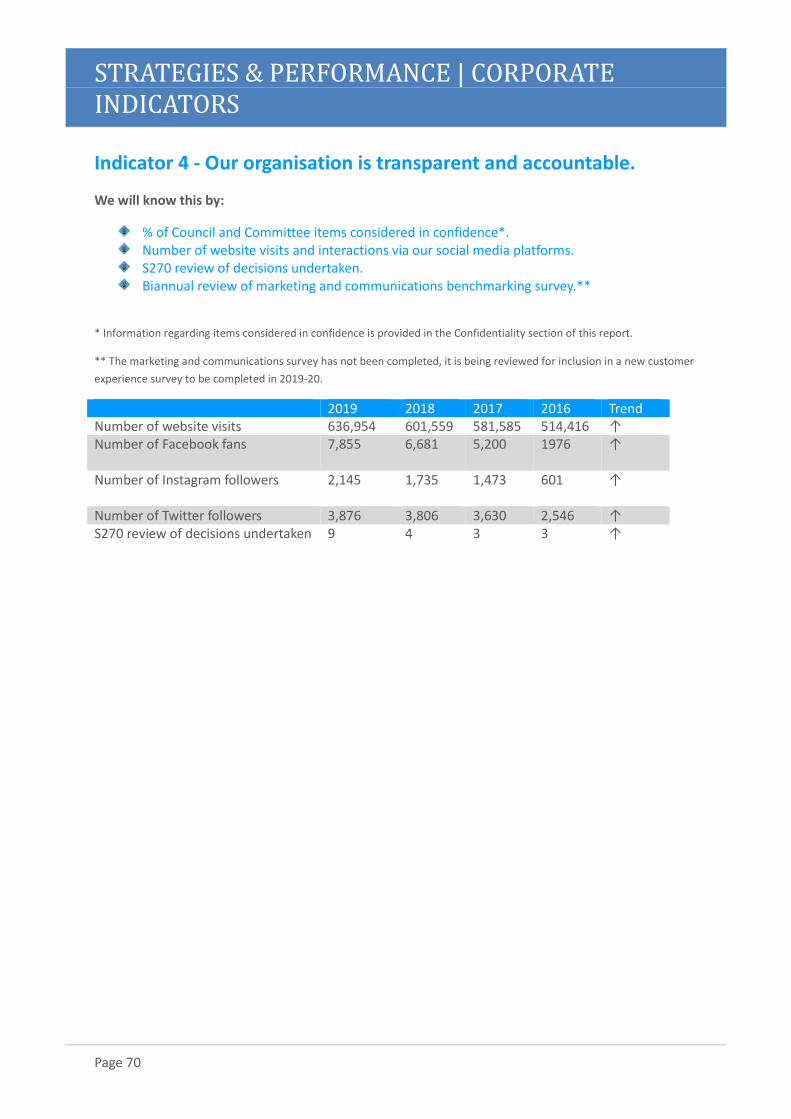
STRATEGIES & PERFORMANCE | CORPORATE INDICATORS
Page 70
Indicator 4 - Our organisation is transparent and accountable.
We will know this by:
% of Council and Committee items considered in confidence*. Number of website visits and interactions via our social media platforms. S270 review of decisions undertaken. Biannual review of marketing and communications benchmarking survey.**
* Information regarding items considered in confidence is provided in the Confidentiality section of this report.
** The marketing and communications survey has not been completed, it is being reviewed for inclusion in a new customer
experience survey to be completed in 2019-20.
2019 2018 2017 2016 Trend Number of website visits 636,954 601,559 581,585 514,416 ↑ Number of Facebook fans 7,855
6,681 5,200 1976 ↑
Number of Instagram followers 2,145
1,735 1,473 601 ↑
Number of Twitter followers 3,876 3,806 3,630 2,546 ↑ S270 review of decisions undertaken 9 4 3 3 ↑
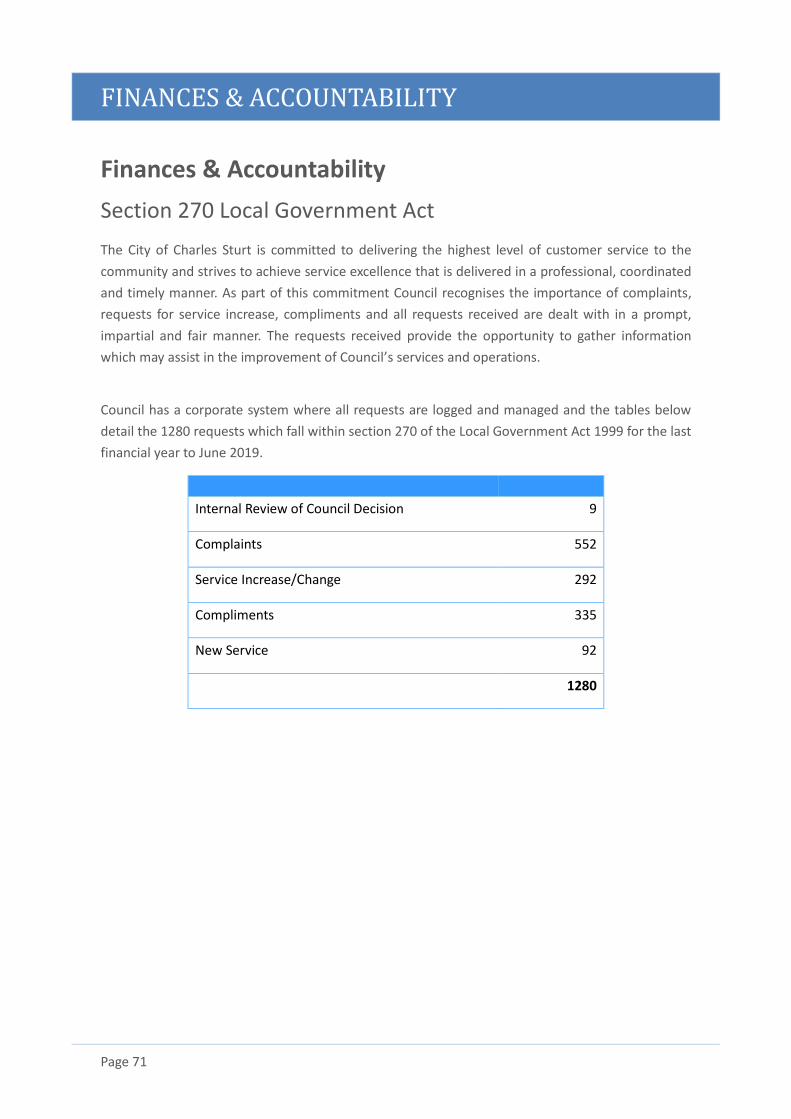
FINANCES & ACCOUNTABILITY
Page 71
Finances & Accountability
Section 270 Local Government Act
The City of Charles Sturt is committed to delivering the highest level of customer service to the
community and strives to achieve service excellence that is delivered in a professional, coordinated
and timely manner. As part of this commitment Council recognises the importance of complaints,
requests for service increase, compliments and all requests received are dealt with in a prompt,
impartial and fair manner. The requests received provide the opportunity to gather information
which may assist in the improvement of Council’s services and operations.
Council has a corporate system where all requests are logged and managed and the tables below
detail the 1280 requests which fall within section 270 of the Local Government Act 1999 for the last
financial year to June 2019.
Internal Review of Council Decision 9
Complaints 552
Service Increase/Change 292
Compliments 335
New Service 92
1280
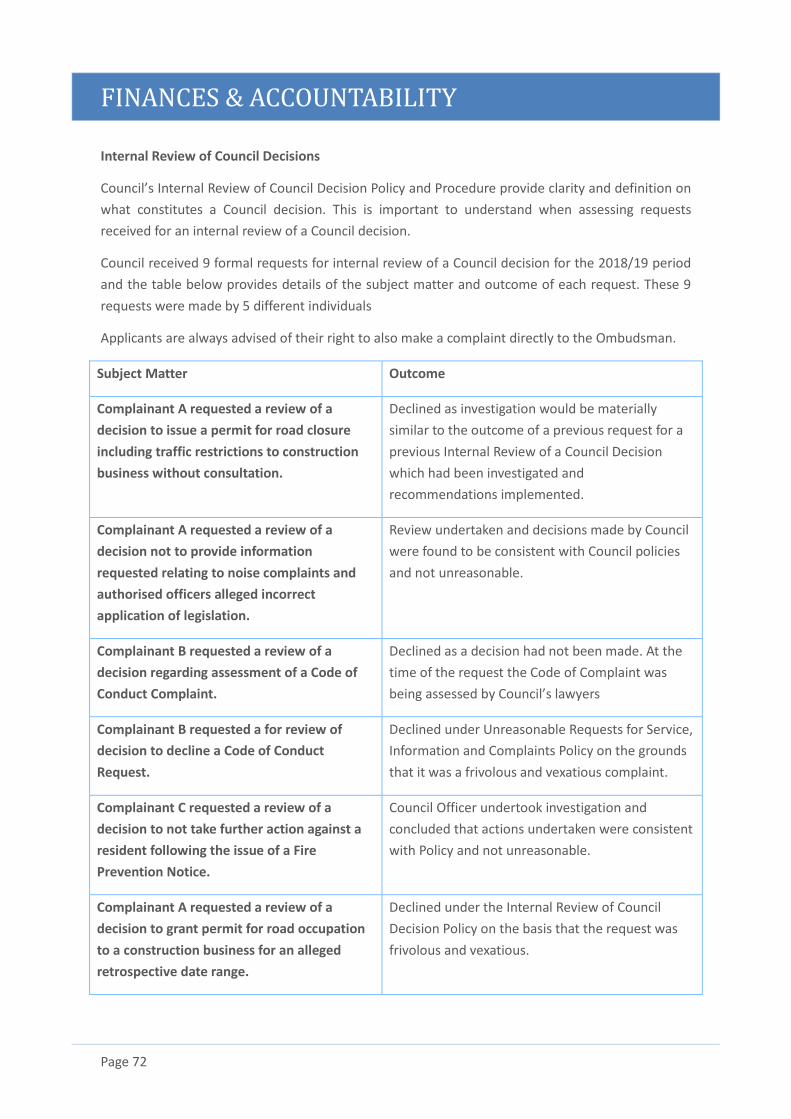
FINANCES & ACCOUNTABILITY
Page 72
Internal Review of Council Decisions
Council’s Internal Review of Council Decision Policy and Procedure provide clarity and definition on
what constitutes a Council decision. This is important to understand when assessing requests
received for an internal review of a Council decision.
Council received 9 formal requests for internal review of a Council decision for the 2018/19 period
and the table below provides details of the subject matter and outcome of each request. These 9
requests were made by 5 different individuals
Applicants are always advised of their right to also make a complaint directly to the Ombudsman.
Subject Matter Outcome
Complainant A requested a review of a
decision to issue a permit for road closure
including traffic restrictions to construction
business without consultation.
Declined as investigation would be materially
similar to the outcome of a previous request for a
previous Internal Review of a Council Decision
which had been investigated and
recommendations implemented.
Complainant A requested a review of a
decision not to provide information
requested relating to noise complaints and
authorised officers alleged incorrect
application of legislation.
Review undertaken and decisions made by Council
were found to be consistent with Council policies
and not unreasonable.
Complainant B requested a review of a
decision regarding assessment of a Code of
Conduct Complaint.
Declined as a decision had not been made. At the
time of the request the Code of Complaint was
being assessed by Council’s lawyers
Complainant B requested a for review of
decision to decline a Code of Conduct
Request.
Declined under Unreasonable Requests for Service,
Information and Complaints Policy on the grounds
that it was a frivolous and vexatious complaint.
Complainant C requested a review of a
decision to not take further action against a
resident following the issue of a Fire
Prevention Notice.
Council Officer undertook investigation and
concluded that actions undertaken were consistent
with Policy and not unreasonable.
Complainant A requested a review of a
decision to grant permit for road occupation
to a construction business for an alleged
retrospective date range.
Declined under the Internal Review of Council
Decision Policy on the basis that the request was
frivolous and vexatious.
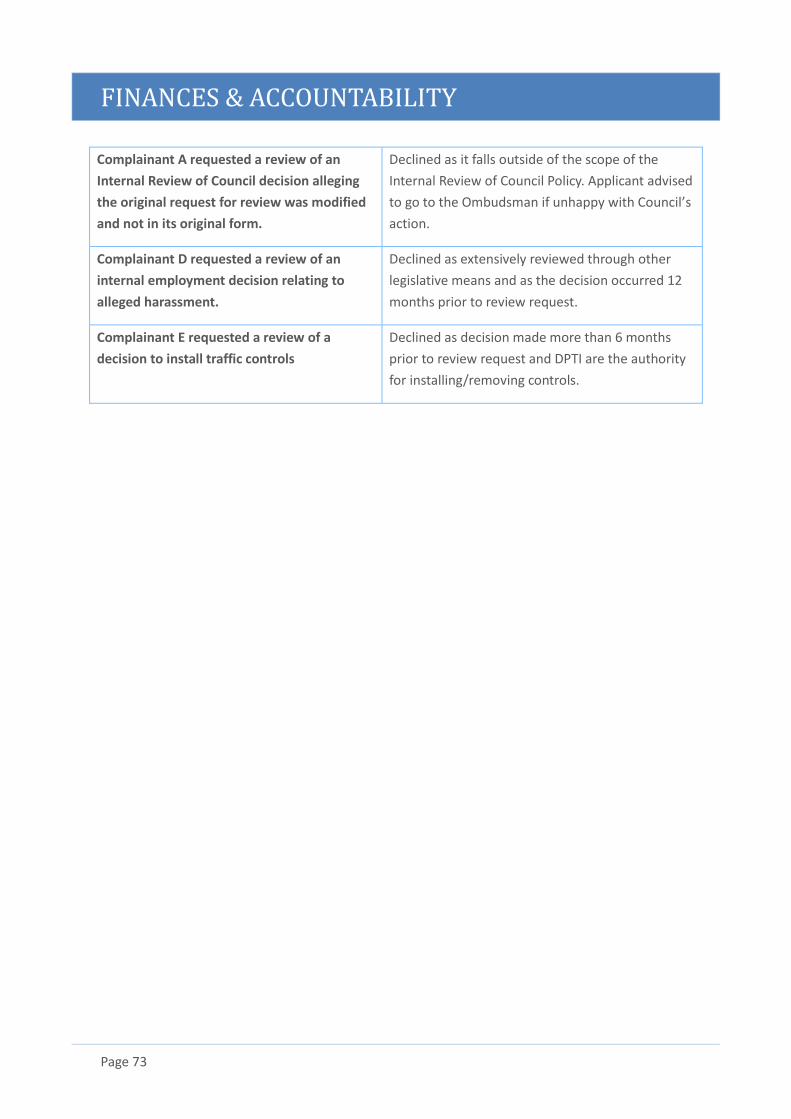
FINANCES & ACCOUNTABILITY
Page 73
Complainant A requested a review of an
Internal Review of Council decision alleging
the original request for review was modified
and not in its original form.
Declined as it falls outside of the scope of the
Internal Review of Council Policy. Applicant advised
to go to the Ombudsman if unhappy with Council’s
action.
Complainant D requested a review of an
internal employment decision relating to
alleged harassment.
Declined as extensively reviewed through other
legislative means and as the decision occurred 12
months prior to review request.
Complainant E requested a review of a
decision to install traffic controls
Declined as decision made more than 6 months
prior to review request and DPTI are the authority
for installing/removing controls.
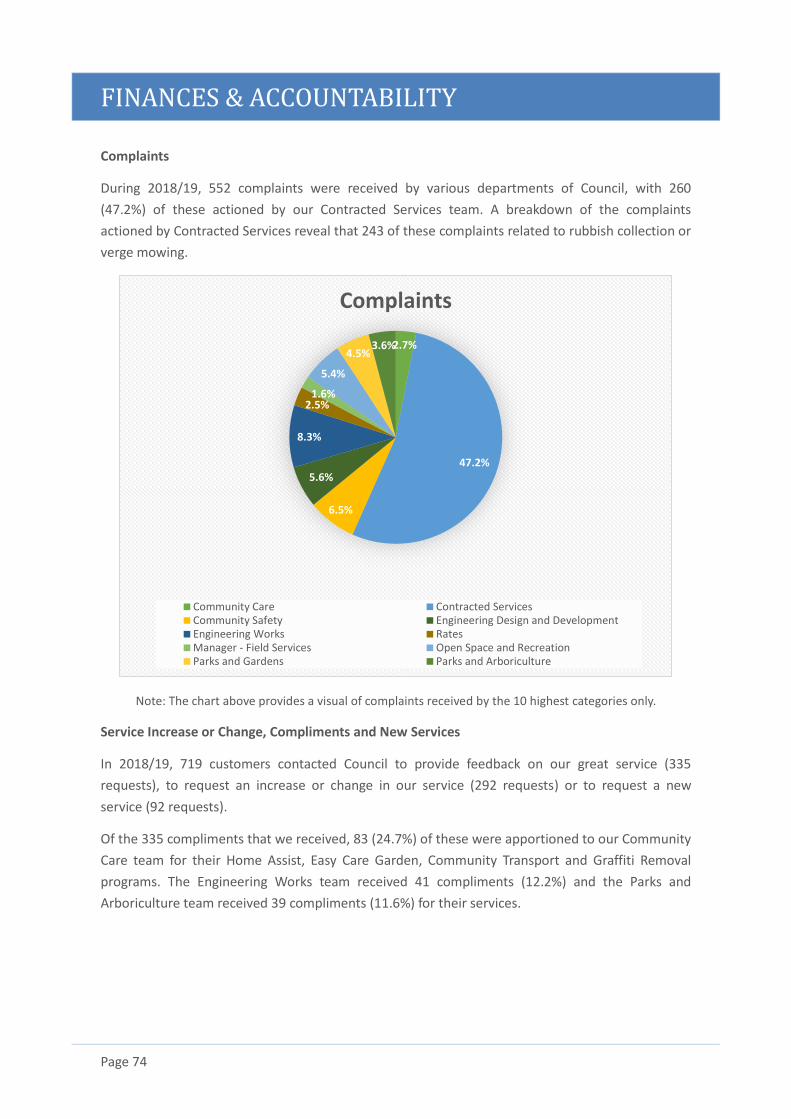
FINANCES & ACCOUNTABILITY
Page 74
Complaints
During 2018/19, 552 complaints were received by various departments of Council, with 260
(47.2%) of these actioned by our Contracted Services team. A breakdown of the complaints
actioned by Contracted Services reveal that 243 of these complaints related to rubbish collection or
verge mowing.
Note: The chart above provides a visual of complaints received by the 10 highest categories only.
Service Increase or Change, Compliments and New Services
In 2018/19, 719 customers contacted Council to provide feedback on our great service (335
requests), to request an increase or change in our service (292 requests) or to request a new
service (92 requests).
Of the 335 compliments that we received, 83 (24.7%) of these were apportioned to our Community
Care team for their Home Assist, Easy Care Garden, Community Transport and Graffiti Removal
programs. The Engineering Works team received 41 compliments (12.2%) and the Parks and
Arboriculture team received 39 compliments (11.6%) for their services.
2.7%
47.2%
6.5%
5.6%
8.3%
2.5%1.6%
5.4%
4.5%3.6%
Complaints
Community Care Contracted ServicesCommunity Safety Engineering Design and DevelopmentEngineering Works RatesManager - Field Services Open Space and RecreationParks and Gardens Parks and Arboriculture
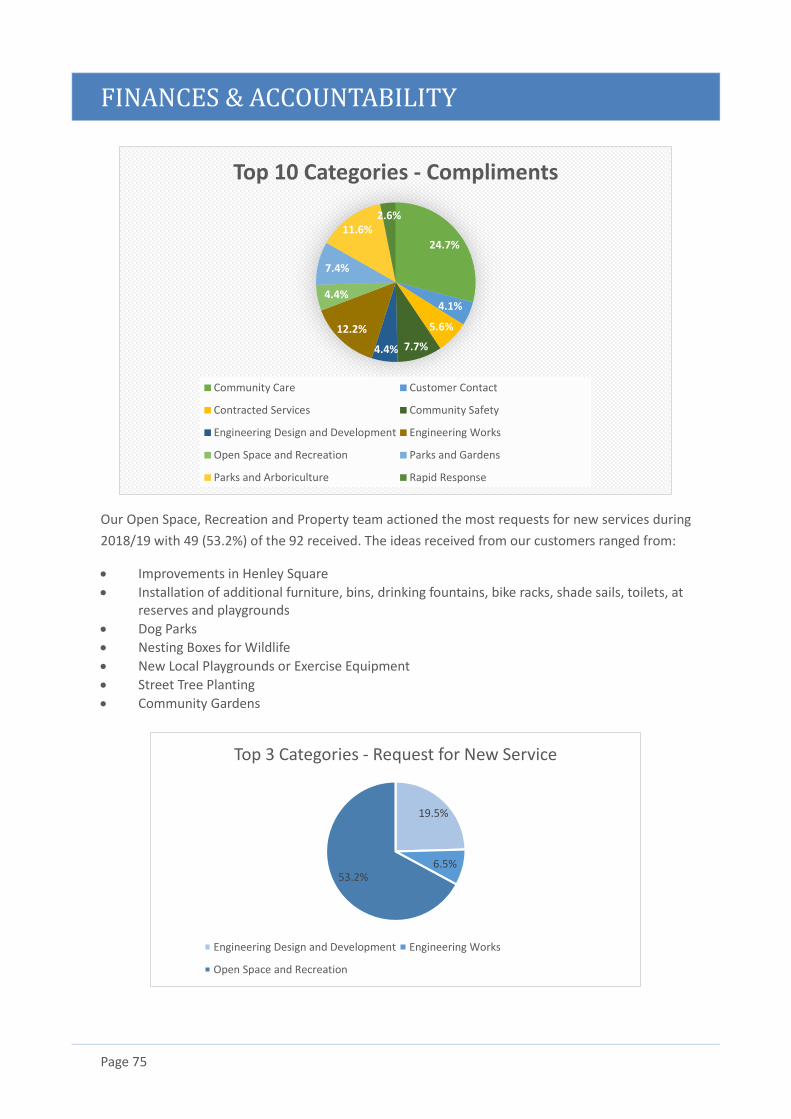
FINANCES & ACCOUNTABILITY
Page 75
Our Open Space, Recreation and Property team actioned the most requests for new services during
2018/19 with 49 (53.2%) of the 92 received. The ideas received from our customers ranged from:
• Improvements in Henley Square
• Installation of additional furniture, bins, drinking fountains, bike racks, shade sails, toilets, at reserves and playgrounds
• Dog Parks
• Nesting Boxes for Wildlife
• New Local Playgrounds or Exercise Equipment
• Street Tree Planting
• Community Gardens
24.7%
4.1%
5.6%
7.7%4.4%
12.2%
4.4%
7.4%
11.6%2.6%
Top 10 Categories - Compliments
Community Care Customer Contact
Contracted Services Community Safety
Engineering Design and Development Engineering Works
Open Space and Recreation Parks and Gardens
Parks and Arboriculture Rapid Response
19.5%
6.5%53.2%
Top 3 Categories - Request for New Service
Engineering Design and Development Engineering Works
Open Space and Recreation
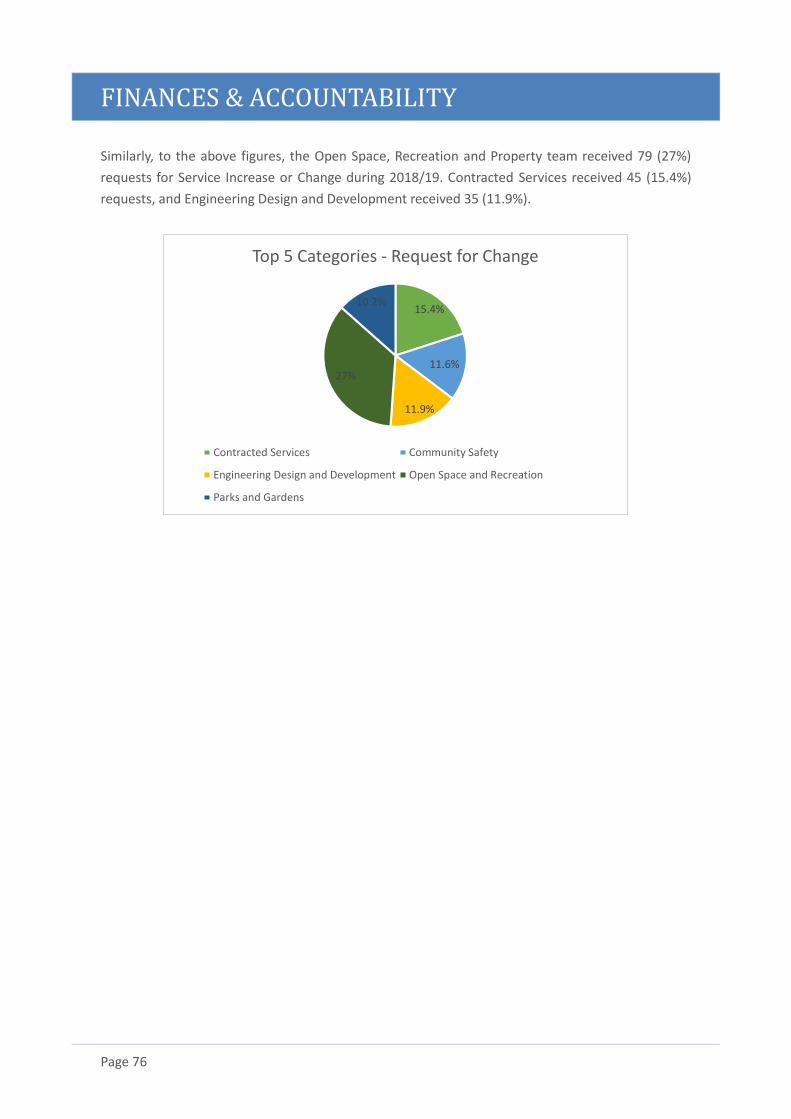
FINANCES & ACCOUNTABILITY
Page 76
Similarly, to the above figures, the Open Space, Recreation and Property team received 79 (27%)
requests for Service Increase or Change during 2018/19. Contracted Services received 45 (15.4%)
requests, and Engineering Design and Development received 35 (11.9%).
15.4%
11.6%
11.9%
27%
10.2%
Top 5 Categories - Request for Change
Contracted Services Community Safety
Engineering Design and Development Open Space and Recreation
Parks and Gardens
FINANCES & ACCOUNTABILITY
Page 77
Finances & Accountability
Confidentiality Summary
Business conducted by Council and its Committees
The following table shows the number of items considered by Council and its various Committees
during 2018/19, compared with figures from the previous three years.
` Number of items considered
2018/19 2017/18 2016/17 2015/16
Council (1) 147 168 161 156
Asset Management 88 75 119 122
City Services Committee 81 86 80 72
Audit Committee 31 26 21 25
Development Assessment Panel (2) - 11 79 70
Council Assessment Panel (2) 69 46 - -
Corporate Services Committee 42 56 53 72
Total 458 468 513 517
Notes:
(1) This does not include the consideration and adoption of the reports and minutes of Council’s standing committees,
Deputations, Petitions, Notices of Motion/ Motions without Notice or Questions on/without Notice.
(2) Under changes to the Development Act 1993 and introduction of Planning, Development and Infrastructure Act 2016
the Development Assessment Panel ceased to exist as of September 2017 and was replaced by the Council
Assessment Panel.
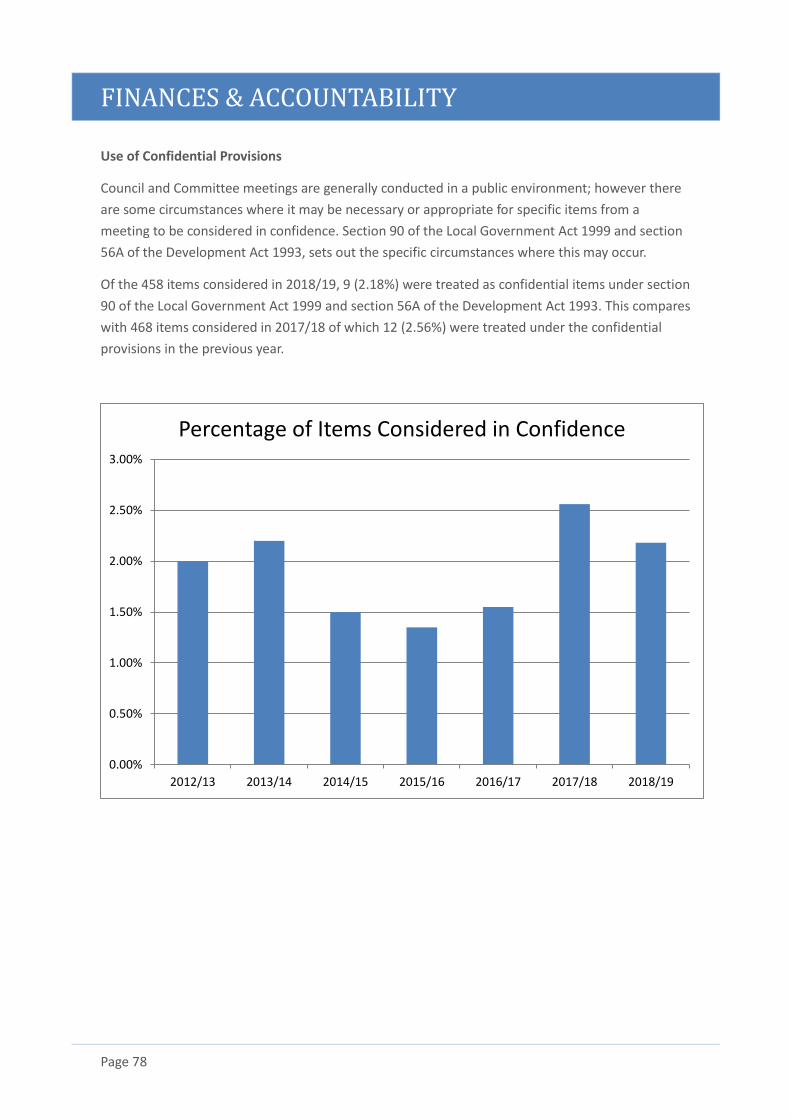
FINANCES & ACCOUNTABILITY
Page 78
Use of Confidential Provisions
Council and Committee meetings are generally conducted in a public environment; however there
are some circumstances where it may be necessary or appropriate for specific items from a
meeting to be considered in confidence. Section 90 of the Local Government Act 1999 and section
56A of the Development Act 1993, sets out the specific circumstances where this may occur.
Of the 458 items considered in 2018/19, 9 (2.18%) were treated as confidential items under section
90 of the Local Government Act 1999 and section 56A of the Development Act 1993. This compares
with 468 items considered in 2017/18 of which 12 (2.56%) were treated under the confidential
provisions in the previous year.
0.00%
0.50%
1.00%
1.50%
2.00%
2.50%
3.00%
2012/13 2013/14 2014/15 2015/16 2016/17 2017/18 2018/19
Percentage of Items Considered in Confidence
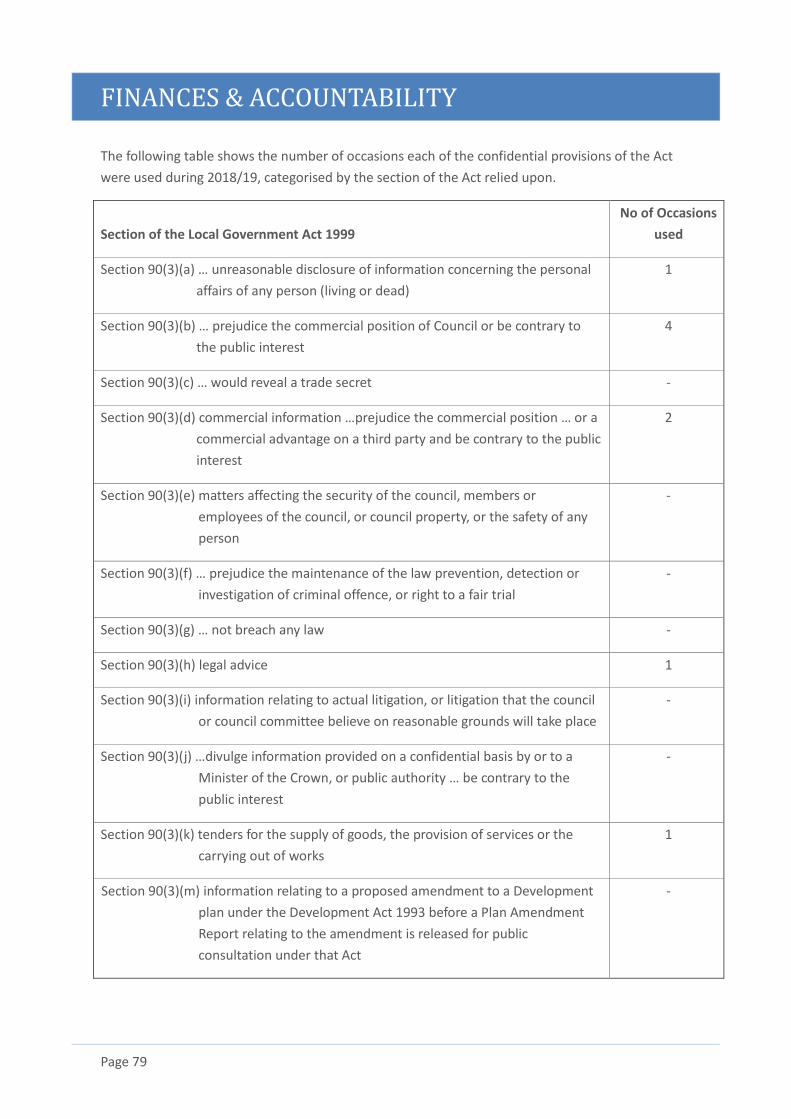
FINANCES & ACCOUNTABILITY
Page 79
The following table shows the number of occasions each of the confidential provisions of the Act
were used during 2018/19, categorised by the section of the Act relied upon.
Section of the Local Government Act 1999
No of Occasions
used
Section 90(3)(a) … unreasonable disclosure of information concerning the personal
affairs of any person (living or dead)
1
Section 90(3)(b) … prejudice the commercial position of Council or be contrary to
the public interest
4
Section 90(3)(c) … would reveal a trade secret -
Section 90(3)(d) commercial information …prejudice the commercial position … or a
commercial advantage on a third party and be contrary to the public
interest
2
Section 90(3)(e) matters affecting the security of the council, members or
employees of the council, or council property, or the safety of any
person
-
Section 90(3)(f) … prejudice the maintenance of the law prevention, detection or
investigation of criminal offence, or right to a fair trial
-
Section 90(3)(g) … not breach any law -
Section 90(3)(h) legal advice 1
Section 90(3)(i) information relating to actual litigation, or litigation that the council
or council committee believe on reasonable grounds will take place
-
Section 90(3)(j) …divulge information provided on a confidential basis by or to a
Minister of the Crown, or public authority … be contrary to the
public interest
-
Section 90(3)(k) tenders for the supply of goods, the provision of services or the
carrying out of works
1
Section 90(3)(m) information relating to a proposed amendment to a Development
plan under the Development Act 1993 before a Plan Amendment
Report relating to the amendment is released for public
consultation under that Act
-
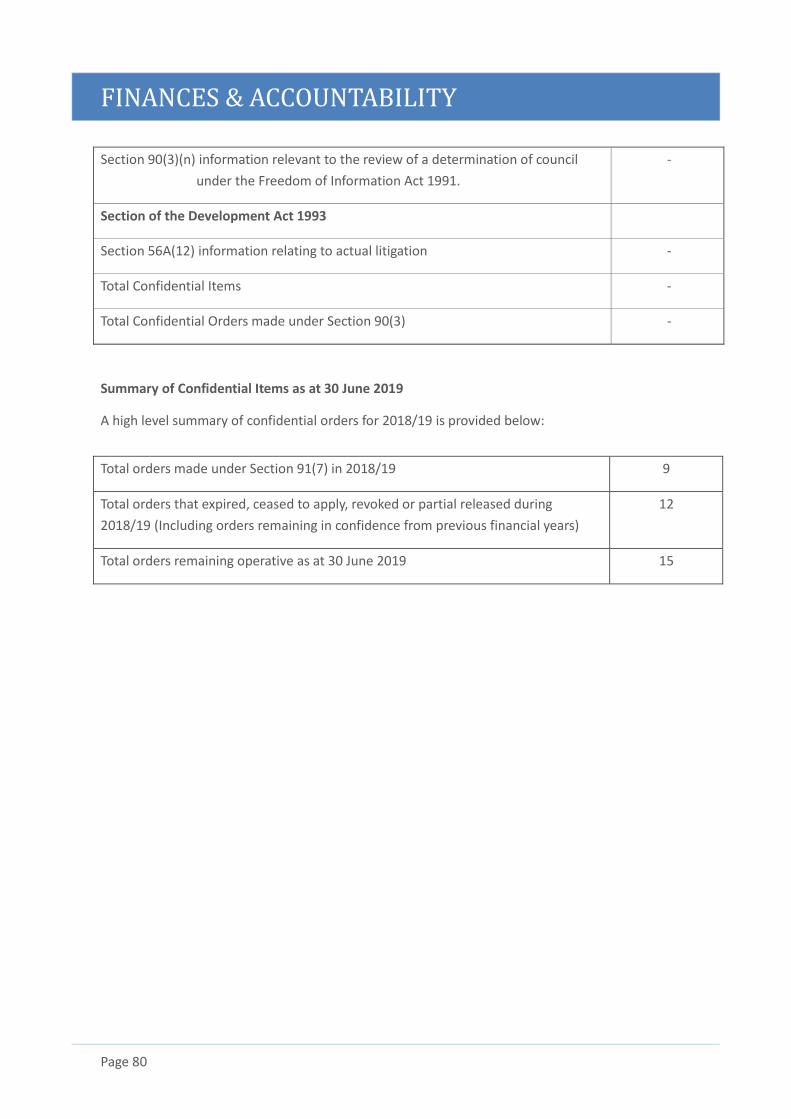
FINANCES & ACCOUNTABILITY
Page 80
Section 90(3)(n) information relevant to the review of a determination of council
under the Freedom of Information Act 1991.
-
Section of the Development Act 1993
Section 56A(12) information relating to actual litigation -
Total Confidential Items -
Total Confidential Orders made under Section 90(3) -
Summary of Confidential Items as at 30 June 2019
A high level summary of confidential orders for 2018/19 is provided below:
Total orders made under Section 91(7) in 2018/19 9
Total orders that expired, ceased to apply, revoked or partial released during
2018/19 (Including orders remaining in confidence from previous financial years)
12
Total orders remaining operative as at 30 June 2019 15
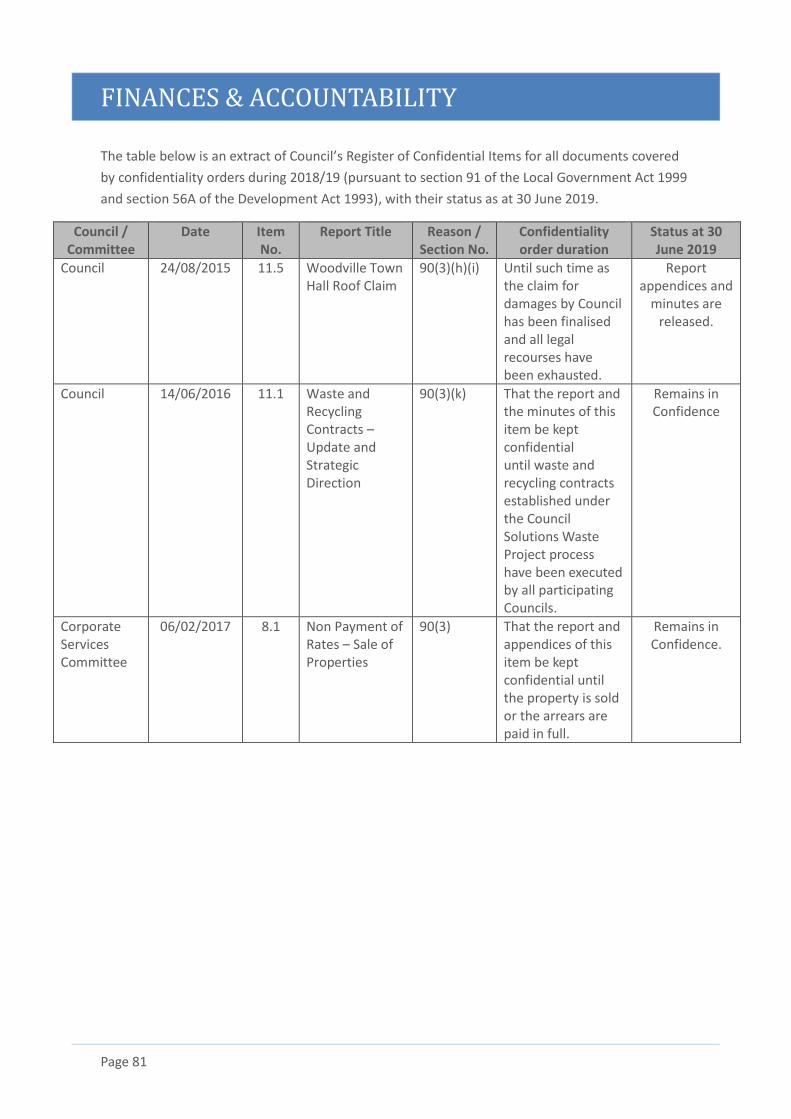
FINANCES & ACCOUNTABILITY
Page 81
The table below is an extract of Council’s Register of Confidential Items for all documents covered
by confidentiality orders during 2018/19 (pursuant to section 91 of the Local Government Act 1999
and section 56A of the Development Act 1993), with their status as at 30 June 2019.
Council / Committee
Date Item No.
Report Title Reason / Section No.
Confidentiality order duration
Status at 30 June 2019
Council 24/08/2015 11.5 Woodville Town Hall Roof Claim
90(3)(h)(i) Until such time as the claim for damages by Council has been finalised and all legal recourses have been exhausted.
Report appendices and
minutes are released.
Council 14/06/2016 11.1 Waste and Recycling Contracts – Update and Strategic Direction
90(3)(k) That the report and the minutes of this item be kept confidential until waste and recycling contracts established under the Council Solutions Waste Project process have been executed by all participating Councils.
Remains in Confidence
Corporate Services Committee
06/02/2017 8.1 Non Payment of Rates – Sale of Properties
90(3) That the report and appendices of this item be kept confidential until the property is sold or the arrears are paid in full.
Remains in Confidence.
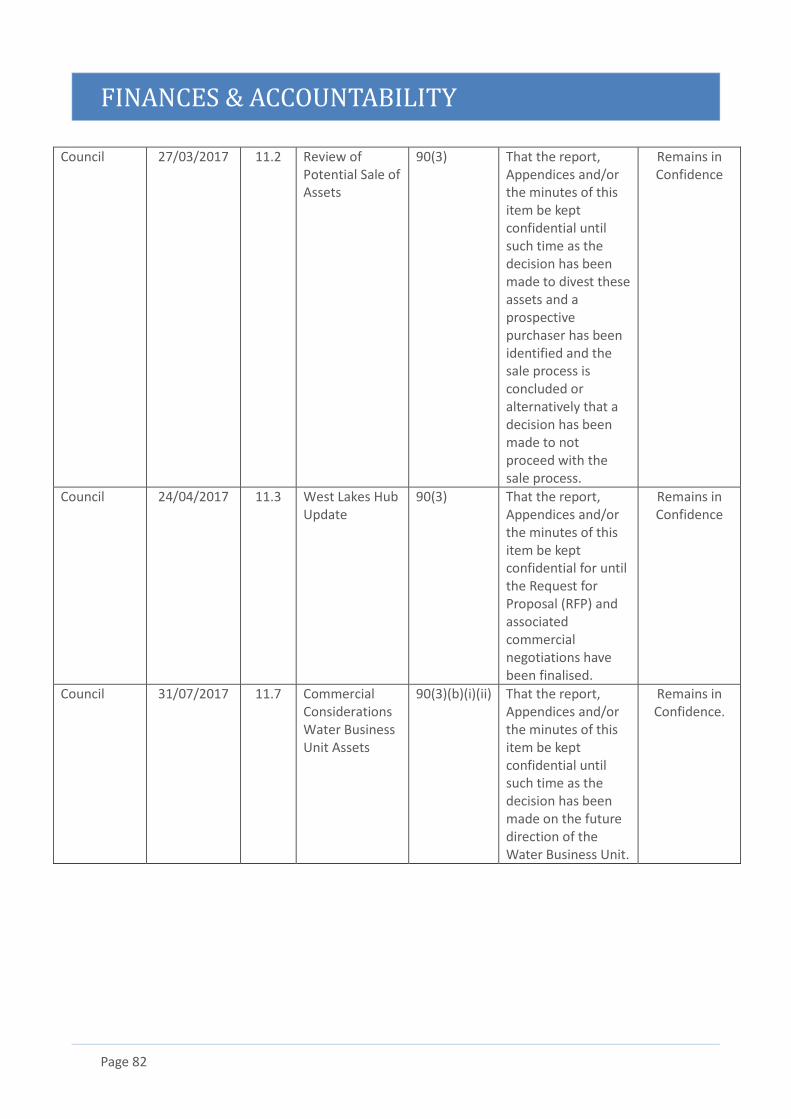
FINANCES & ACCOUNTABILITY
Page 82
Council 27/03/2017 11.2 Review of Potential Sale of Assets
90(3) That the report, Appendices and/or the minutes of this item be kept confidential until such time as the decision has been made to divest these assets and a prospective purchaser has been identified and the sale process is concluded or alternatively that a decision has been made to not proceed with the sale process.
Remains in Confidence
Council 24/04/2017 11.3 West Lakes Hub Update
90(3) That the report, Appendices and/or the minutes of this item be kept confidential for until the Request for Proposal (RFP) and associated commercial negotiations have been finalised.
Remains in Confidence
Council 31/07/2017 11.7 Commercial Considerations Water Business Unit Assets
90(3)(b)(i)(ii) That the report, Appendices and/or the minutes of this item be kept confidential until such time as the decision has been made on the future direction of the Water Business Unit.
Remains in Confidence.
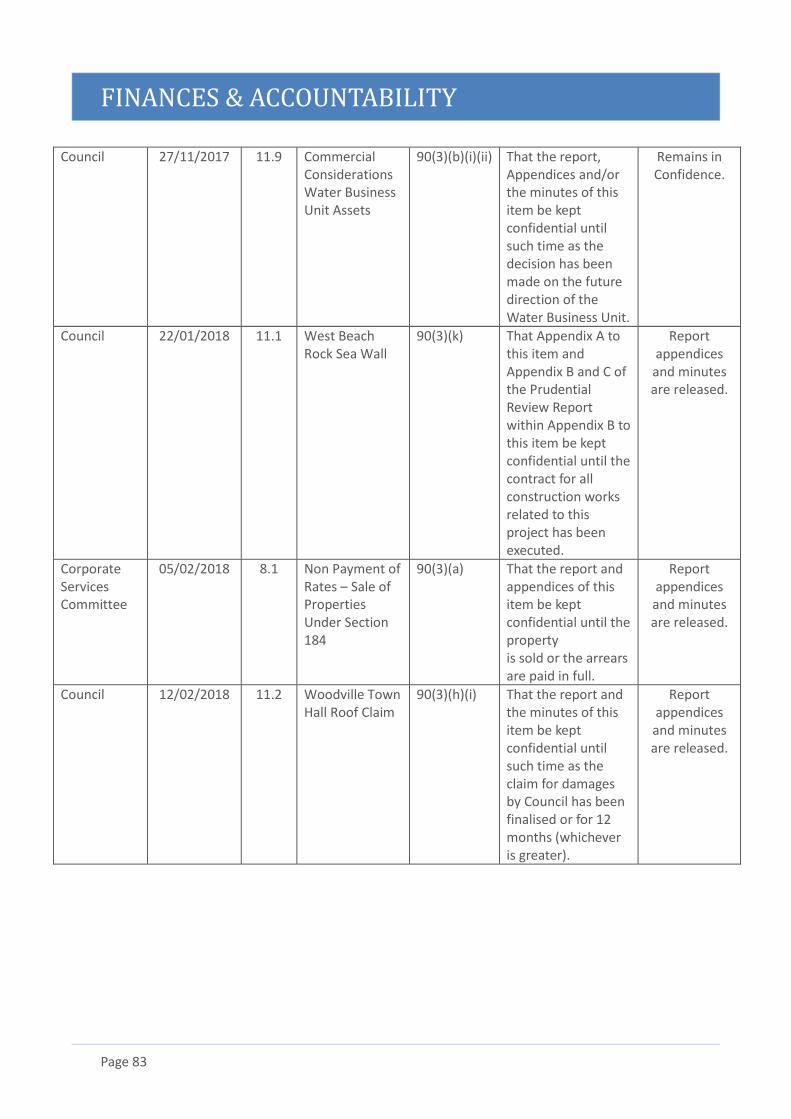
FINANCES & ACCOUNTABILITY
Page 83
Council 27/11/2017 11.9 Commercial Considerations Water Business Unit Assets
90(3)(b)(i)(ii) That the report, Appendices and/or the minutes of this item be kept confidential until such time as the decision has been made on the future direction of the Water Business Unit.
Remains in Confidence.
Council 22/01/2018 11.1 West Beach Rock Sea Wall
90(3)(k) That Appendix A to this item and Appendix B and C of the Prudential Review Report within Appendix B to this item be kept confidential until the contract for all construction works related to this project has been executed.
Report appendices and minutes are released.
Corporate Services Committee
05/02/2018 8.1 Non Payment of Rates – Sale of Properties Under Section 184
90(3)(a) That the report and appendices of this item be kept confidential until the property is sold or the arrears are paid in full.
Report appendices and minutes are released.
Council 12/02/2018 11.2 Woodville Town Hall Roof Claim
90(3)(h)(i) That the report and the minutes of this item be kept confidential until such time as the claim for damages by Council has been finalised or for 12 months (whichever is greater).
Report appendices and minutes are released.
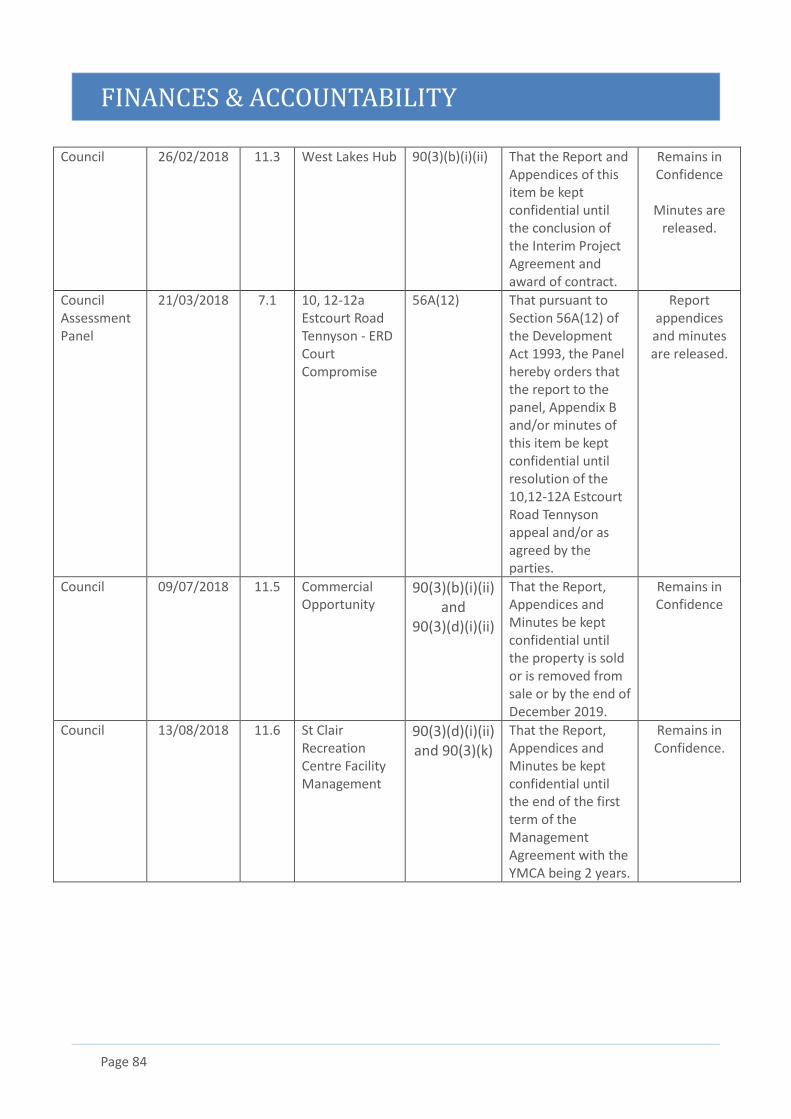
FINANCES & ACCOUNTABILITY
Page 84
Council 26/02/2018 11.3 West Lakes Hub 90(3)(b)(i)(ii) That the Report and Appendices of this item be kept confidential until the conclusion of the Interim Project Agreement and award of contract.
Remains in Confidence
Minutes are
released.
Council Assessment Panel
21/03/2018 7.1 10, 12-12a Estcourt Road Tennyson - ERD Court Compromise
56A(12) That pursuant to Section 56A(12) of the Development Act 1993, the Panel hereby orders that the report to the panel, Appendix B and/or minutes of this item be kept confidential until resolution of the 10,12-12A Estcourt Road Tennyson appeal and/or as agreed by the parties.
Report appendices and minutes are released.
Council 09/07/2018 11.5 Commercial Opportunity
90(3)(b)(i)(ii) and
90(3)(d)(i)(ii)
That the Report, Appendices and Minutes be kept confidential until the property is sold or is removed from sale or by the end of December 2019.
Remains in Confidence
Council 13/08/2018 11.6 St Clair Recreation Centre Facility Management
90(3)(d)(i)(ii) and 90(3)(k)
That the Report, Appendices and Minutes be kept confidential until the end of the first term of the Management Agreement with the YMCA being 2 years.
Remains in Confidence.
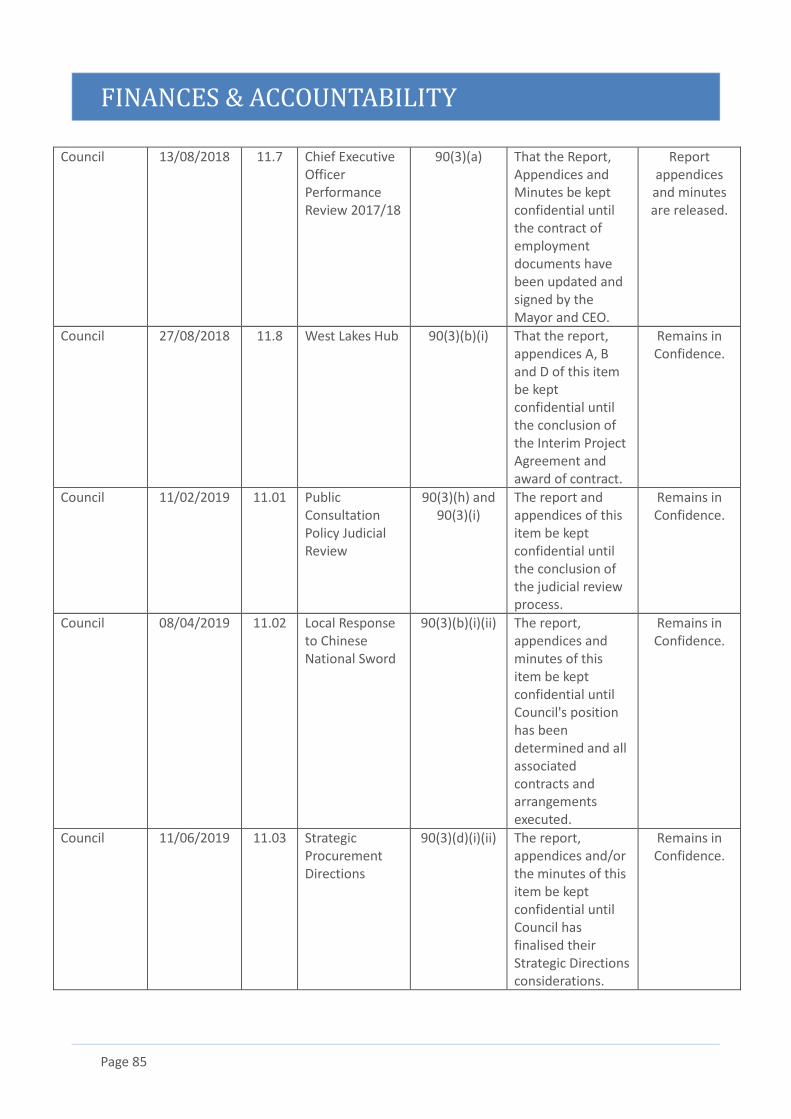
FINANCES & ACCOUNTABILITY
Page 85
Council 13/08/2018 11.7 Chief Executive Officer Performance Review 2017/18
90(3)(a) That the Report, Appendices and Minutes be kept confidential until the contract of employment documents have been updated and signed by the Mayor and CEO.
Report appendices and minutes are released.
Council 27/08/2018 11.8 West Lakes Hub 90(3)(b)(i) That the report, appendices A, B and D of this item be kept confidential until the conclusion of the Interim Project Agreement and award of contract.
Remains in Confidence.
Council 11/02/2019 11.01 Public Consultation Policy Judicial Review
90(3)(h) and 90(3)(i)
The report and appendices of this item be kept confidential until the conclusion of the judicial review process.
Remains in Confidence.
Council 08/04/2019 11.02 Local Response to Chinese National Sword
90(3)(b)(i)(ii) The report, appendices and minutes of this item be kept confidential until Council's position has been determined and all associated contracts and arrangements executed.
Remains in Confidence.
Council 11/06/2019 11.03 Strategic Procurement Directions
90(3)(d)(i)(ii) The report, appendices and/or the minutes of this item be kept confidential until Council has finalised their Strategic Directions considerations.
Remains in Confidence.
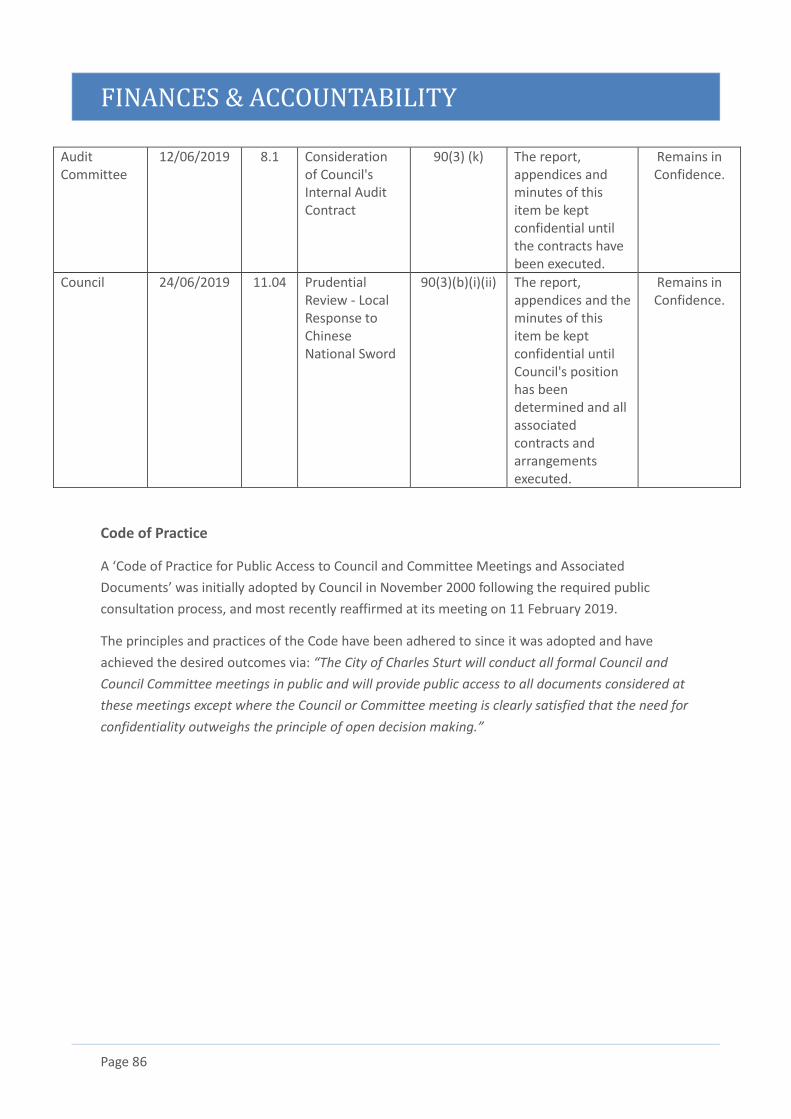
FINANCES & ACCOUNTABILITY
Page 86
Audit Committee
12/06/2019 8.1 Consideration of Council's Internal Audit Contract
90(3) (k) The report, appendices and minutes of this item be kept confidential until the contracts have been executed.
Remains in Confidence.
Council 24/06/2019 11.04 Prudential Review - Local Response to Chinese National Sword
90(3)(b)(i)(ii) The report, appendices and the minutes of this item be kept confidential until Council's position has been determined and all associated contracts and arrangements executed.
Remains in Confidence.
Code of Practice
A ‘Code of Practice for Public Access to Council and Committee Meetings and Associated
Documents’ was initially adopted by Council in November 2000 following the required public
consultation process, and most recently reaffirmed at its meeting on 11 February 2019.
The principles and practices of the Code have been adhered to since it was adopted and have
achieved the desired outcomes via: “The City of Charles Sturt will conduct all formal Council and
Council Committee meetings in public and will provide public access to all documents considered at
these meetings except where the Council or Committee meeting is clearly satisfied that the need for
confidentiality outweighs the principle of open decision making.”
FINANCES & ACCOUNTABILITY
Page 87
Purchasing and Tendering
The City of Charles Sturt is committed to ensuring an efficient, effective and ethical use of
resources and accountable and transparent processes of goods and services. Our Procurement
Policy aims to deliver best value services to the community.
When considering the most appropriate form of service delivery the following factors are
considered:
• Council’s strategic directions;
• A need to control specific services;
• Risks in adopting the various options;
• Number of competitors in the market place;
• Current service delivery arrangements;
• Existing skills and resources of Council’s staff;
• Relevant industrial awards and Enterprise Bargaining Agreements;
• Benefits associated with entering into a commercial activity or project.
In fulfilling Council's procurement role, the following principles apply:
• Transparency and accountability in purchasing procedures and practices to ensure responsibilities are clearly defined and decisions are made in a transparent manner;
• Open and fair competition to ensure that potential suppliers are given reasonable opportunity to bid for the required goods and services;
• Compliance with statutory and other obligations;
• The highest standard of professionalism and probity by making decisions in an ethical and impartial manner;
• Opportunities to enter into joint procurement initiatives;
• Risk management practices and procedures in place to effectively manage risk exposure to Council with allocation of risk to the party best able to manage that risk;
• Adopt practices that are consistent with the principles of ecological sustainability, to the greatest extent that is practicable; and
• Encourage economic development through longer term contracts.
If all factors are equal when evaluating quotes and tender bids, preference will be given to local
business.
Council also has a commitment to maximising the skills, development and employment
opportunities available in the City. Consideration may be given, where practicable and appropriate,
to incorporate strategies in the procurement process that support local employment and training,
which may include Contractors engaging apprentices, trainees and cadets in their work practices.
The appropriate method of purchase is determined by the levels of expenditure established within
the Procurement Policy. In 2018/19 a total of 33 tenders were called.
FINANCES & ACCOUNTABILITY
Page 88
Council Solutions
Council Solutions is a Regional Authority (subsidiary) established in accordance with the Local
Government Act (1999) SA and is a joint initiative of the cities of Adelaide, Charles Sturt, Marion,
Onkaparinga, Salisbury and Tea Tree Gully. Council Solutions has been established to collectively on
behalf of constituent Councils implement professional contracts and purchasing arrangements
which aggregate volume to deliver:
• Value for money;
• Represent best commercial practice;
• Aims to achieve uniformity in specification of works and services across the Council Solutions Councils;
• Will achieve purchasing savings; and
• Will protect Council’s interests both jointly and separately.
National Competition Policy
It is an obligation under the Clause 7 statement on the Application of Competition Principles to
Local Government and under the Competition Principles Agreement for each Council to include in
its annual report certain relevant information as follows:
• Council has determined it has no significant business activities as defined in the Clause 7
statement.
• Where Council has submitted a tender as part of a tender process it has applied cost effective
pricing to ensure it complies with competitive neutrality.
• No complaints were received during 2018/19
Bylaws Currently Gazetted
The City of Charles Sturt’s By-laws were made by Council on 11 August 2014 and published in the
SA Government Gazette on 21 August 2014 and these came into effect on 1 January
2015. Council’s by-laws are:
1. Permits and penalties
2. Moveable signs
3. Local Government Land
4. Roads
5. Dogs and Cats
6. Domestic Livestock Management
These by-laws expire on 1 January 2022.
FINANCES & ACCOUNTABILITY
Page 89
Council Member Code of Conduct Policy
Council members in South Australia have a commitment to serve the best interests of the people
within the community they represent and to discharge their duties conscientiously, to the best of
their ability, and for public, not private, benefit at all times.
Council members will work together constructively as a Council and will uphold the values of
honesty, integrity, accountability and transparency, and in turn, foster community confidence and
trust in Local Government.
As representatives of open, responsive and accountable government, Council members are
committed to considering all relevant information and opinions, giving each due weight, in line with
the Council’s community consultation obligations.
In the performance of their role, Council members will take account of the diverse current and
future needs of the local community in decision-making, provide leadership and promote the
interests of the Council.
Council members will make every endeavour to ensure that they have current knowledge of both
statutory requirements and best practice relevant to their position. All Councils are expected to
provide training and education opportunities that will assist members to meet their responsibilities
under the Local Government Act 1999.
During 2018/19 2 complaints were received of which both were resolved.
FINANCES & ACCOUNTABILITY
Page 90
Freedom of Information Requests
There were 57 requests for information from 1 July 2018 to 30 June 2019 made under the Freedom
of Information Act.
In summary,
2018/19
Number of Applications: 33
Access granted in full: 9
Access granted in part: 13
Access refused: 7
Transferred: 1
Closed/Withdrawn: 1
Undetermined at 30 June: 2
Enquiries or requests for information under the Act, should be forwarded to:
Freedom of Information
City of Charles Sturt
PO BOX 1
WOODVILLE SA 5011
FINANCES & ACCOUNTABILITY
Page 91
FINANCES & ACCOUNTABILITY
Page 92
FINANCES & ACCOUNTABILITY
Page 93
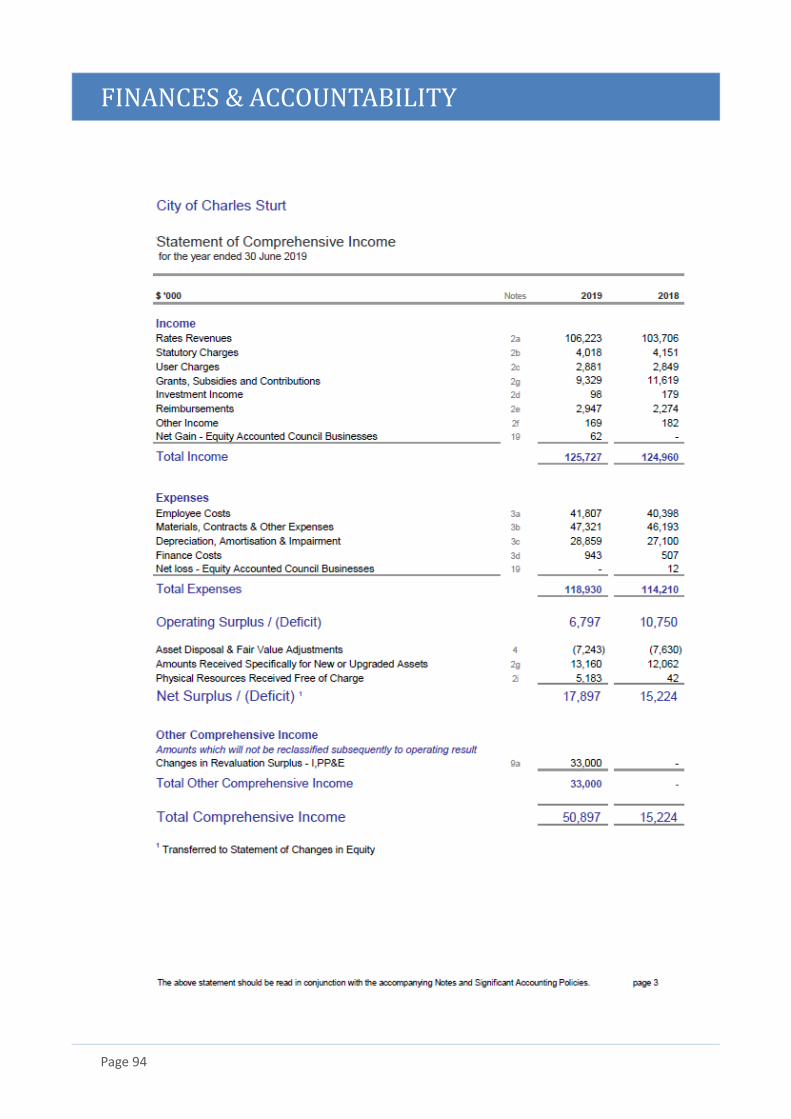
FINANCES & ACCOUNTABILITY
Page 94
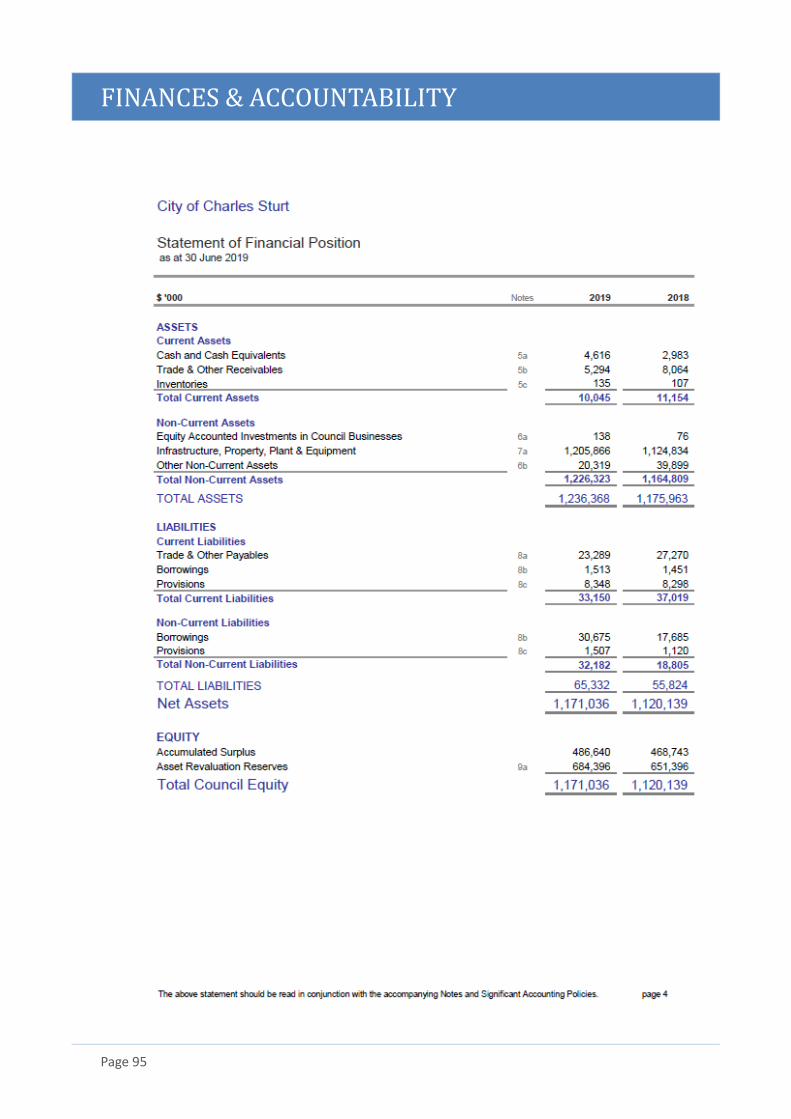
FINANCES & ACCOUNTABILITY
Page 95
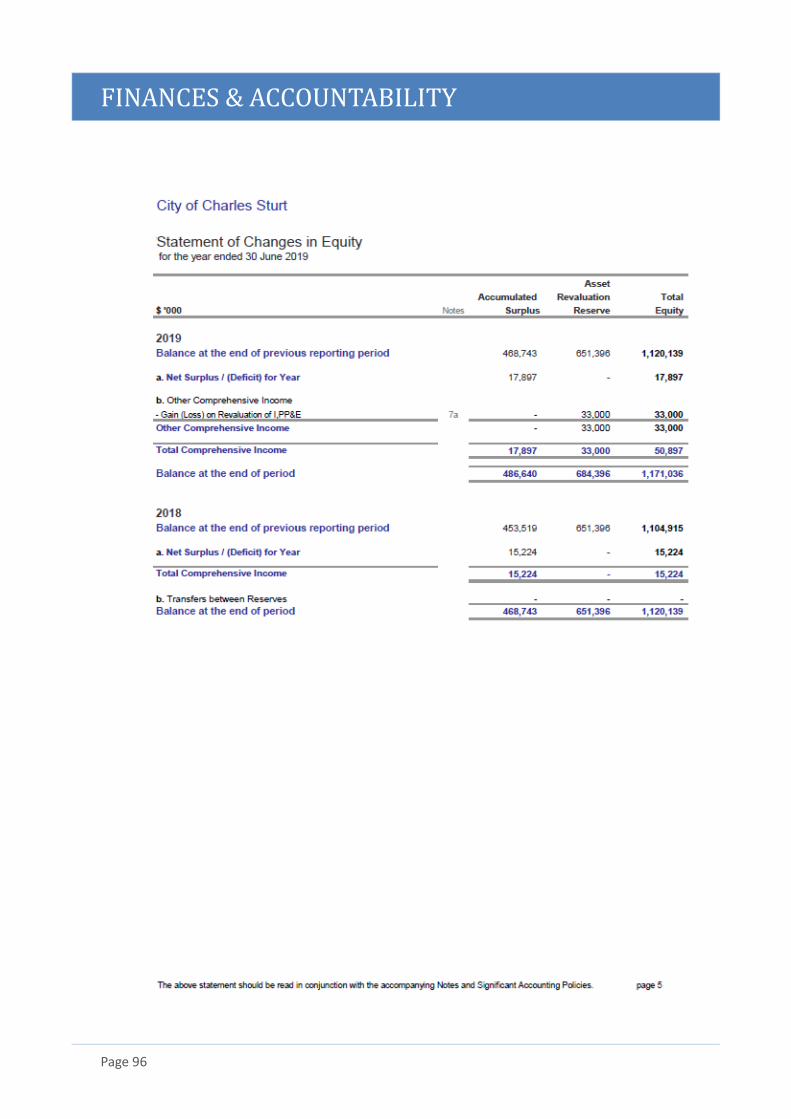
FINANCES & ACCOUNTABILITY
Page 96
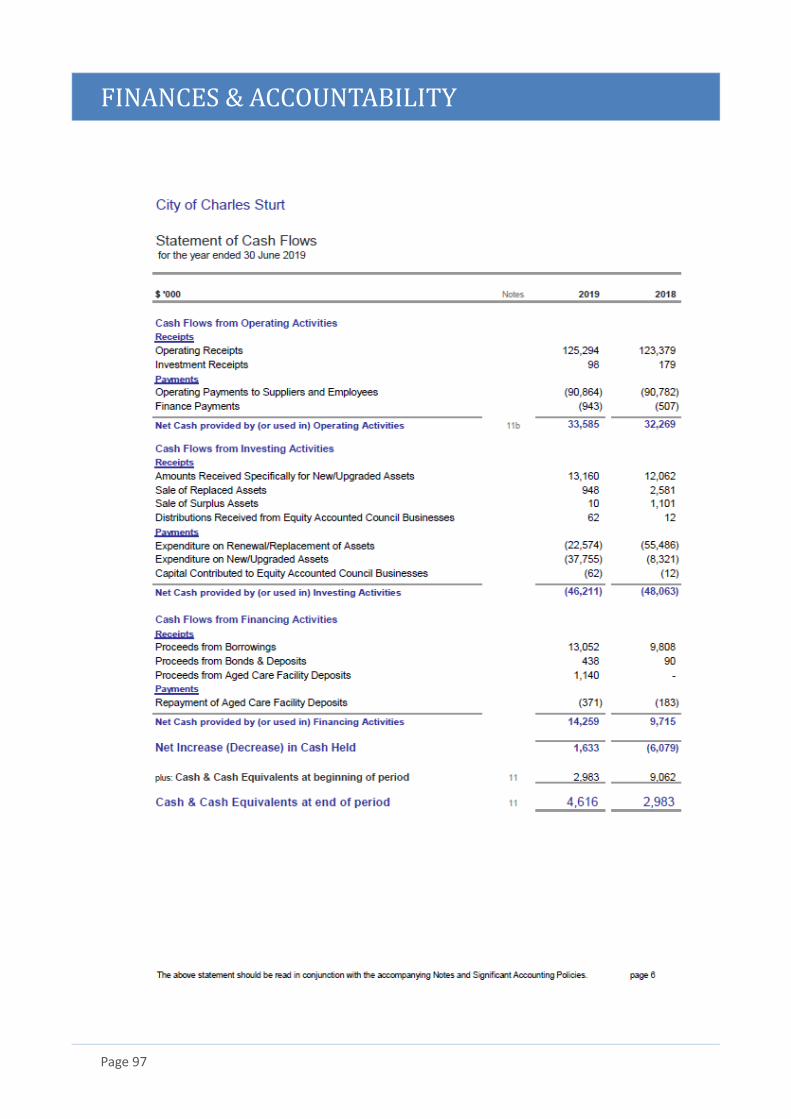
FINANCES & ACCOUNTABILITY
Page 97
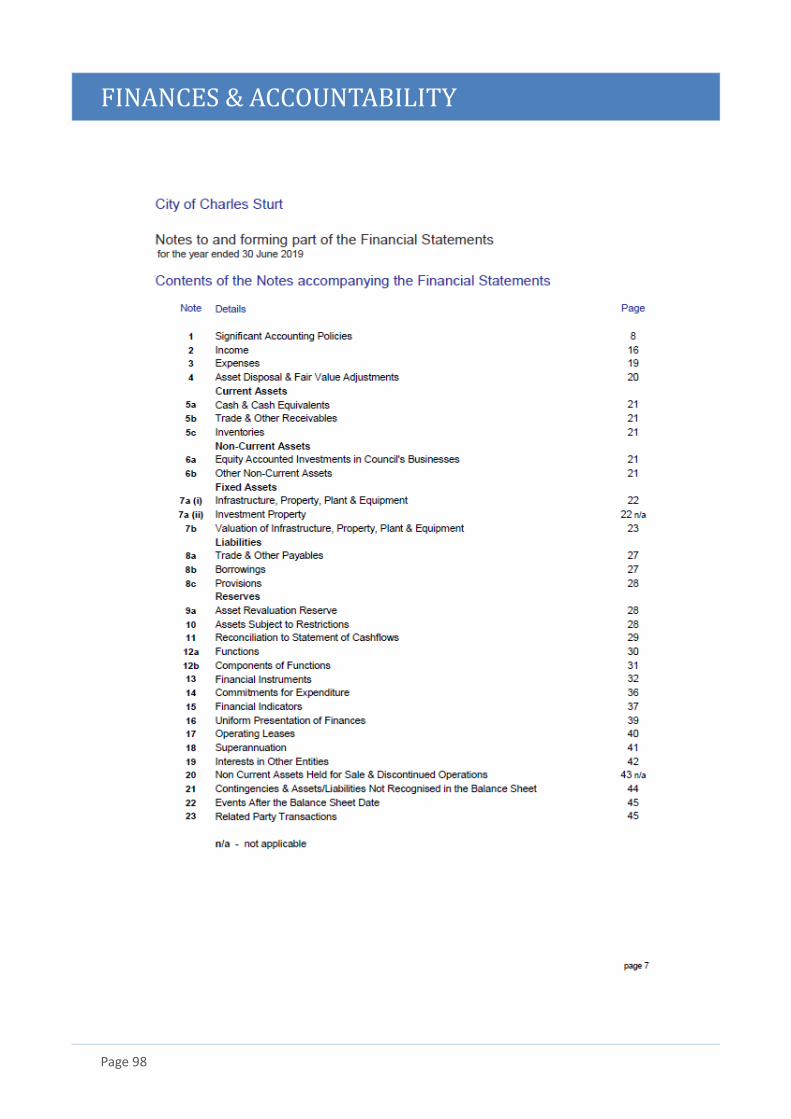
FINANCES & ACCOUNTABILITY
Page 98
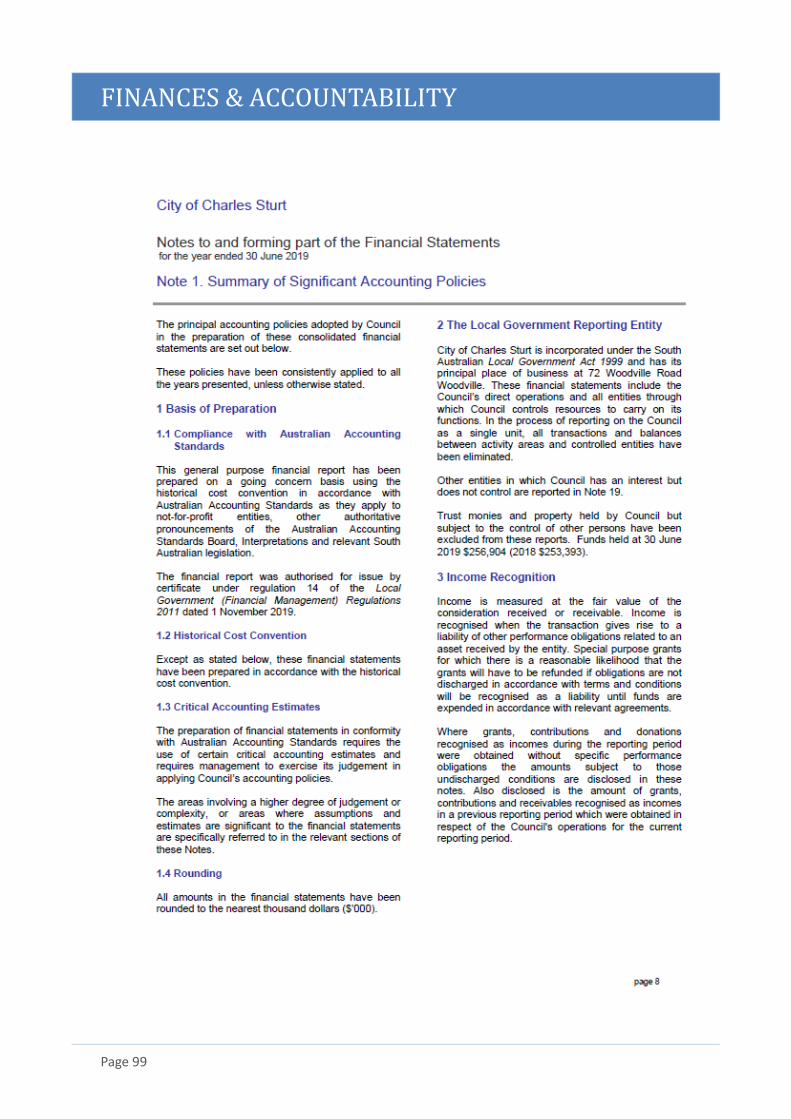
FINANCES & ACCOUNTABILITY
Page 99
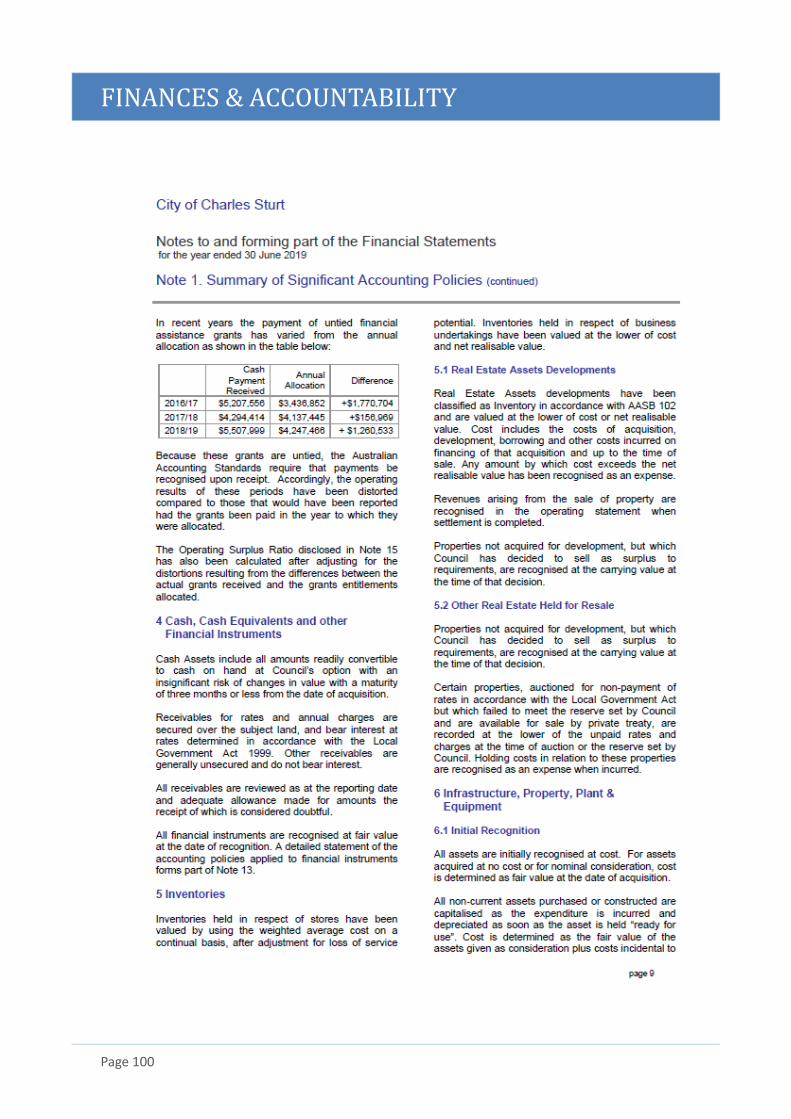
FINANCES & ACCOUNTABILITY
Page 100
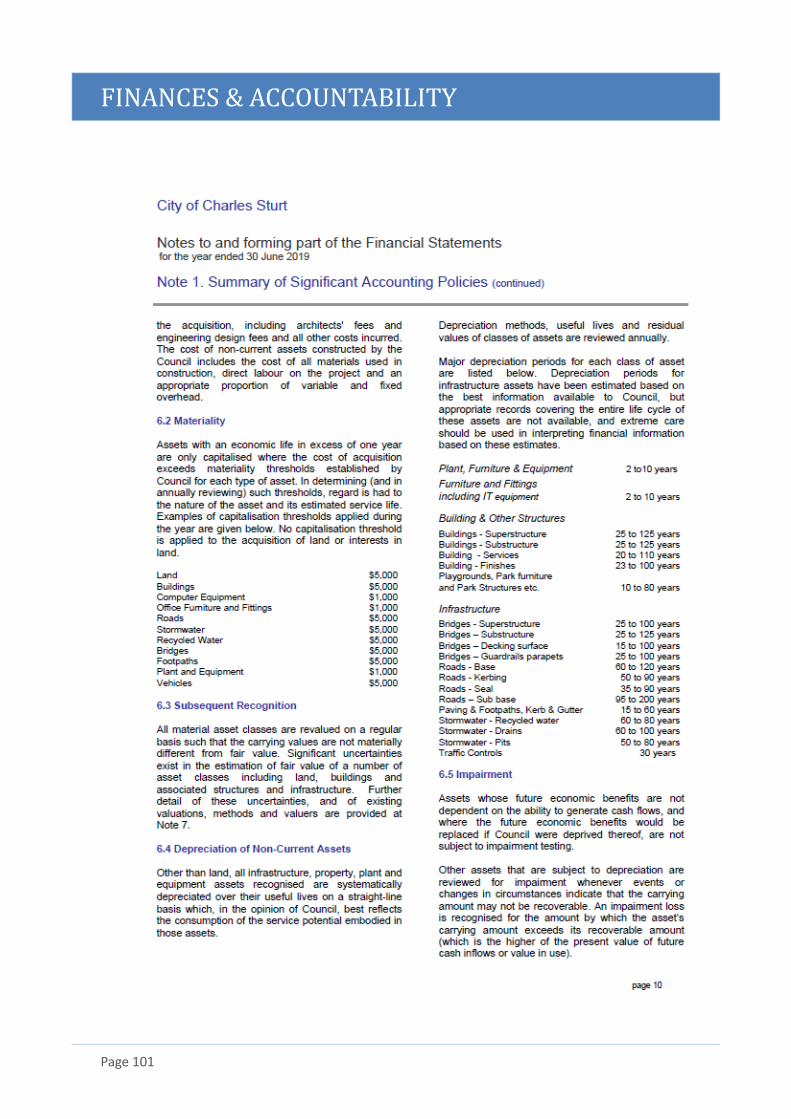
FINANCES & ACCOUNTABILITY
Page 101
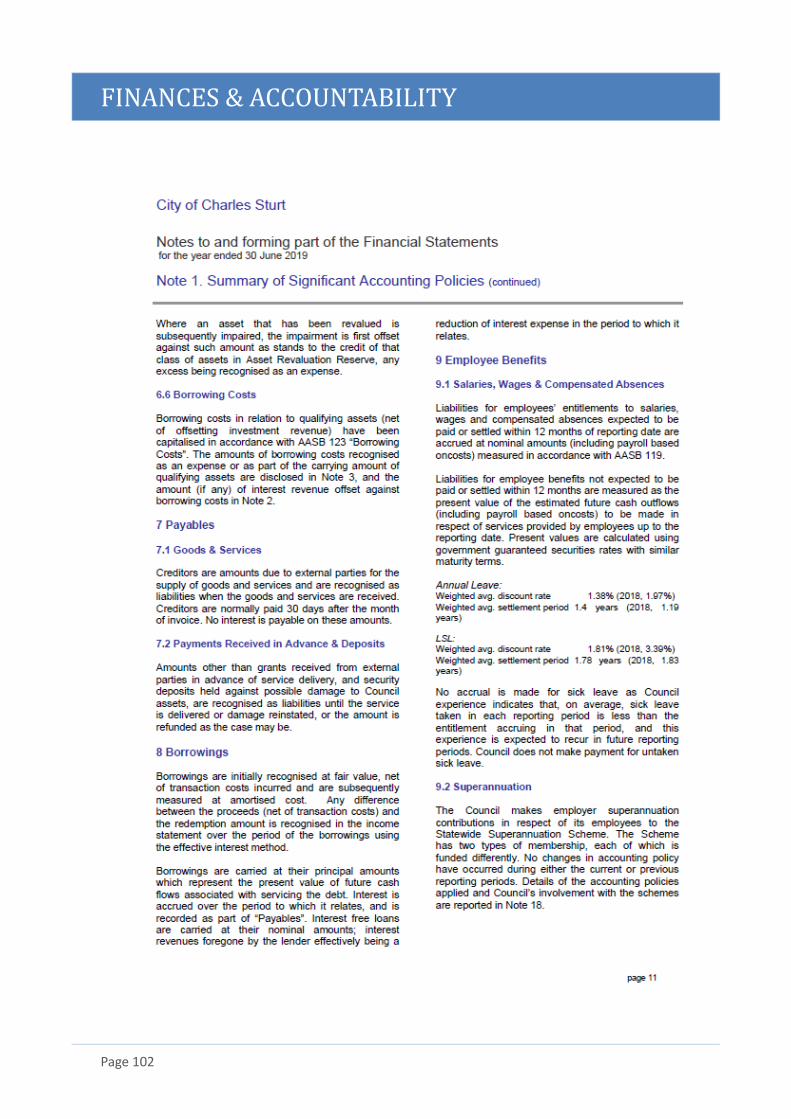
FINANCES & ACCOUNTABILITY
Page 102
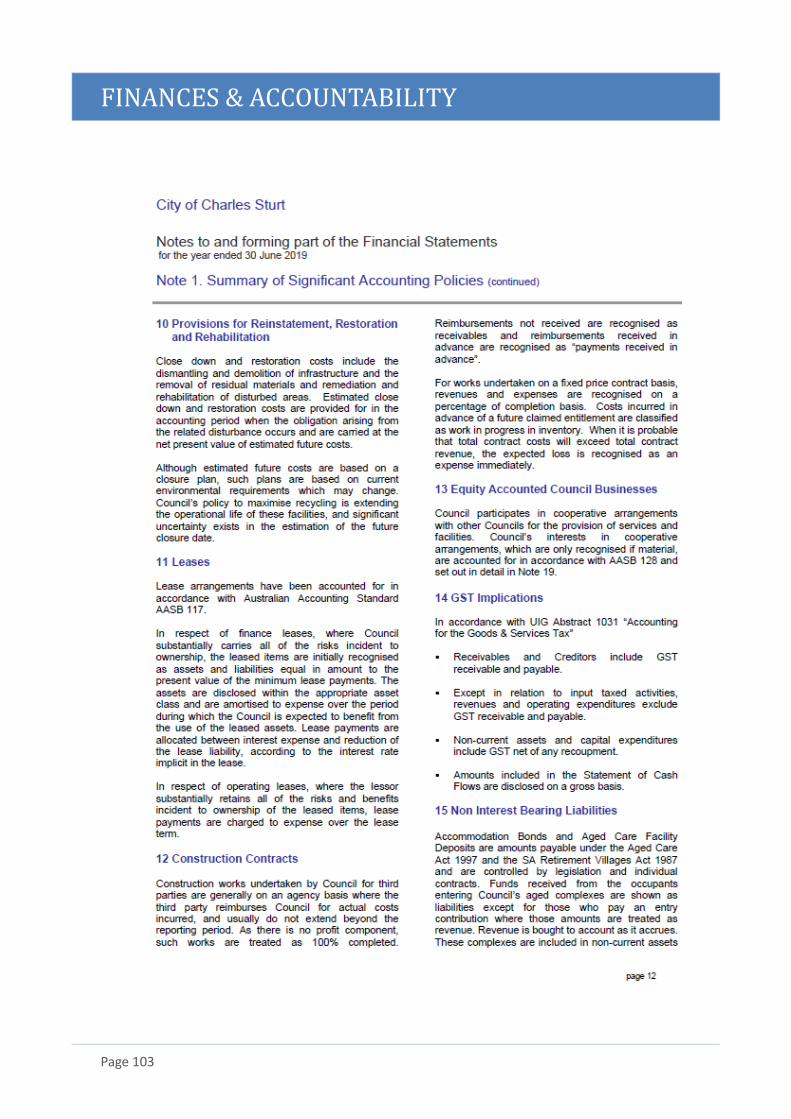
FINANCES & ACCOUNTABILITY
Page 103
FINANCES & ACCOUNTABILITY
Page 104
FINANCES & ACCOUNTABILITY
Page 105
FINANCES & ACCOUNTABILITY
Page 106
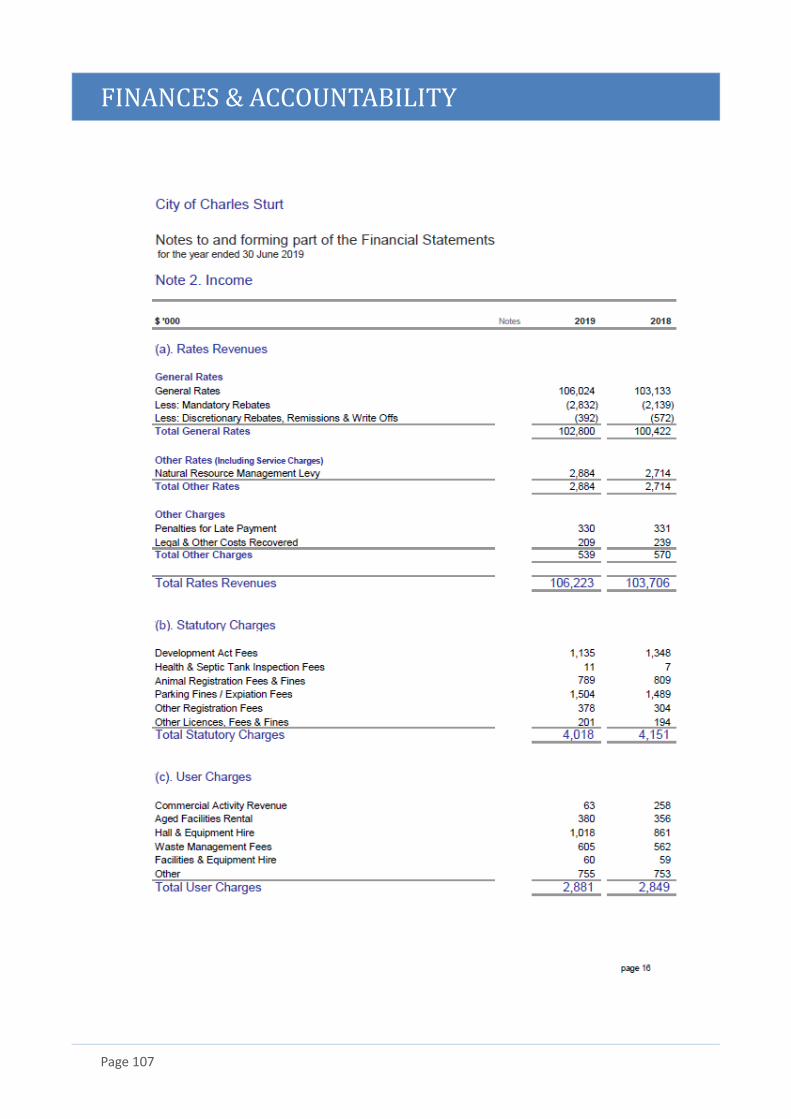
FINANCES & ACCOUNTABILITY
Page 107
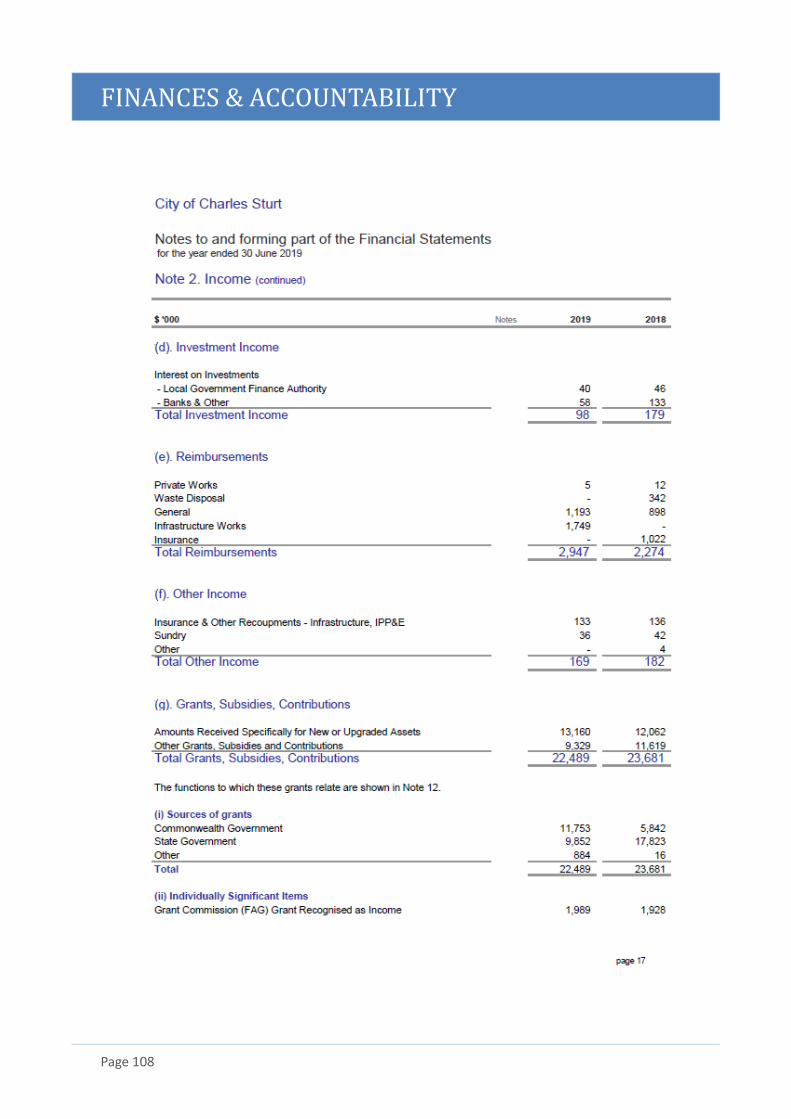
FINANCES & ACCOUNTABILITY
Page 108
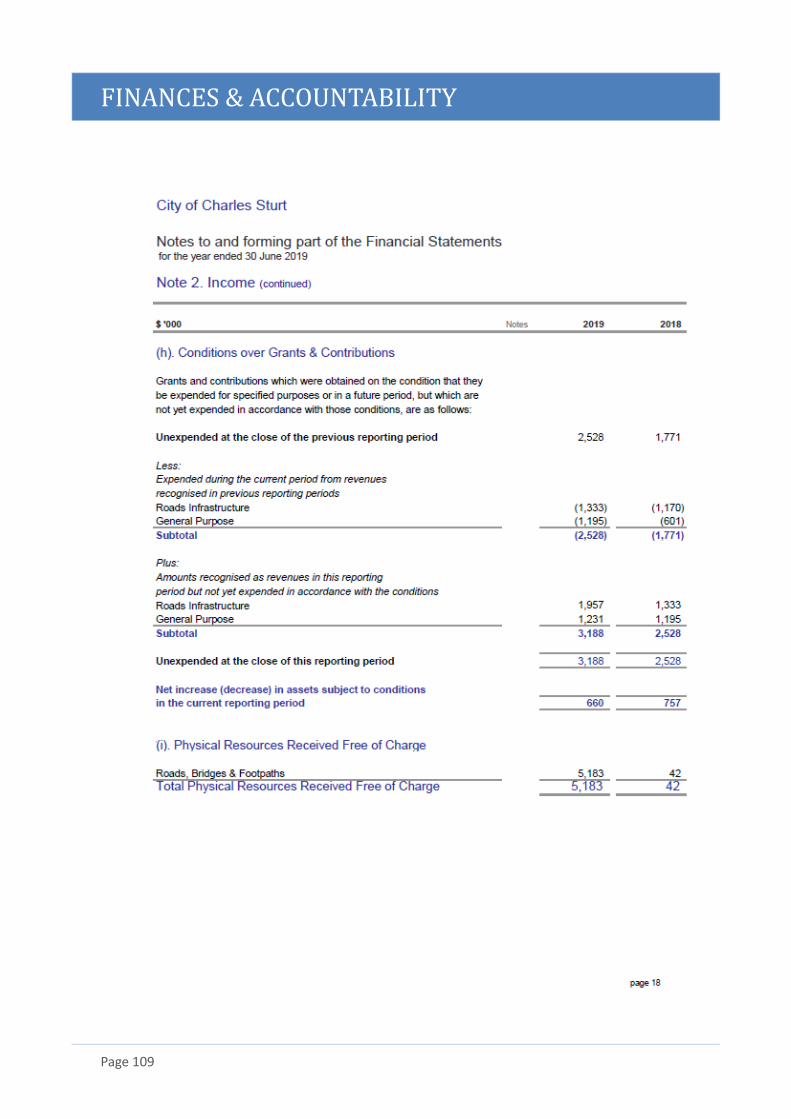
FINANCES & ACCOUNTABILITY
Page 109
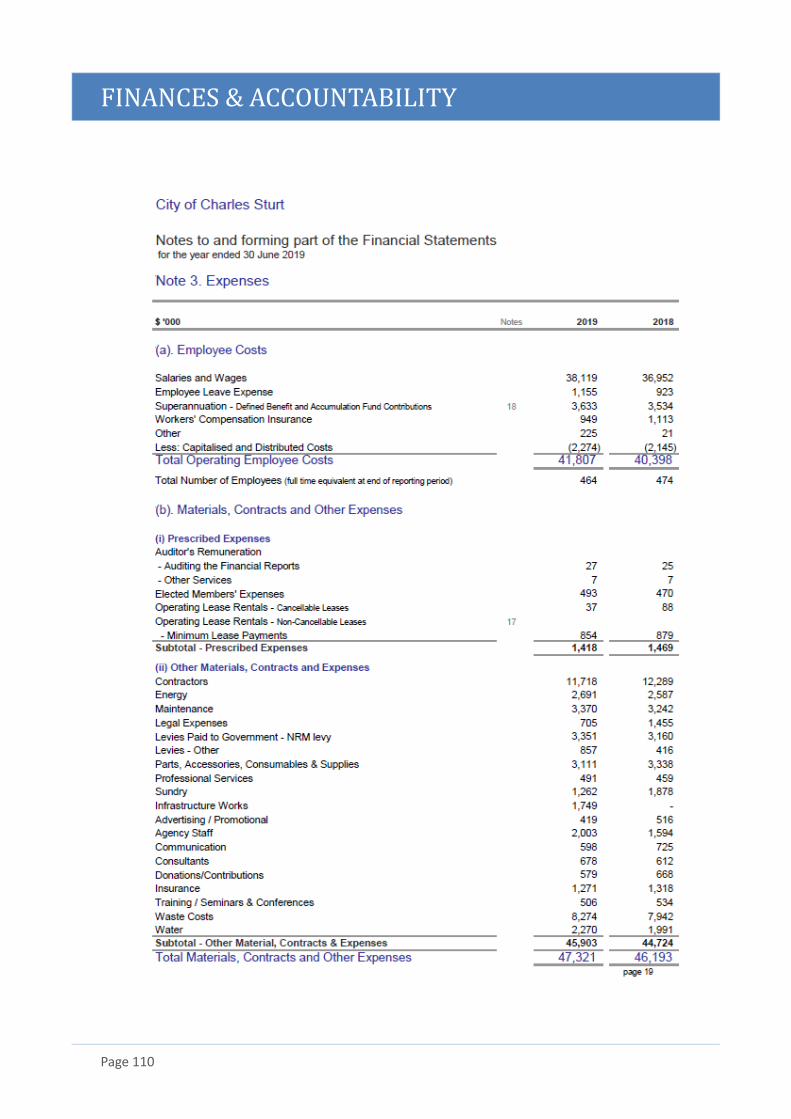
FINANCES & ACCOUNTABILITY
Page 110
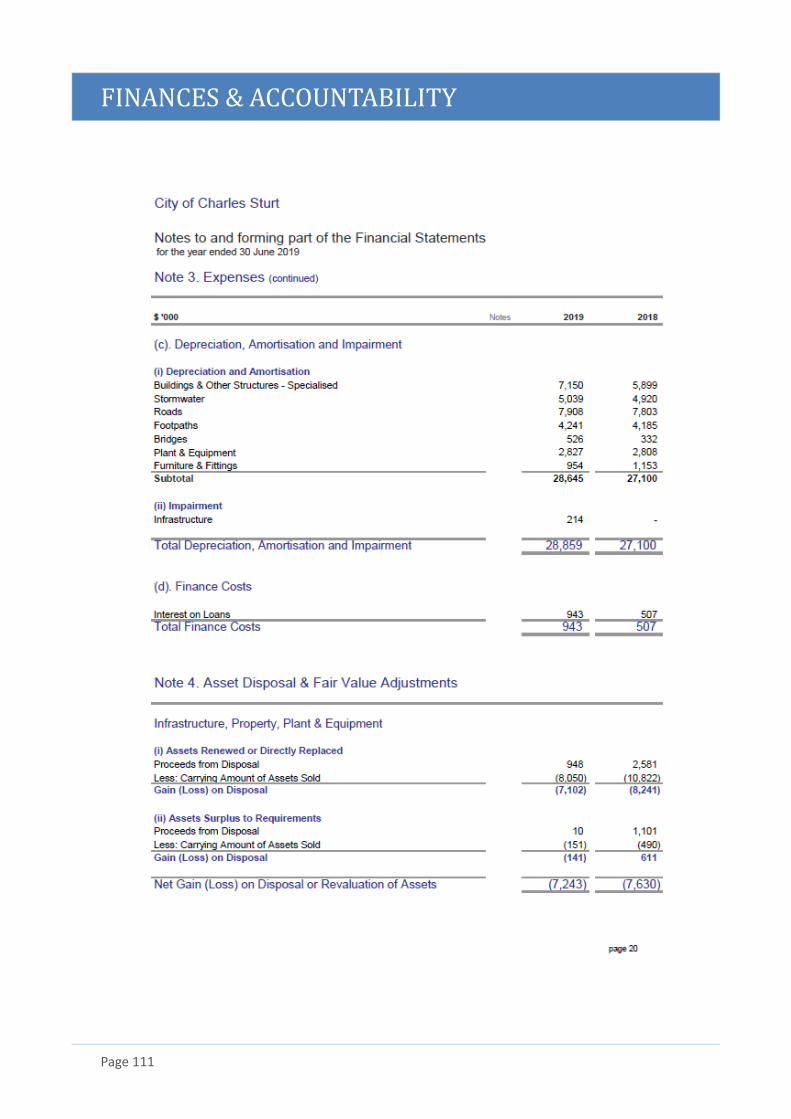
FINANCES & ACCOUNTABILITY
Page 111
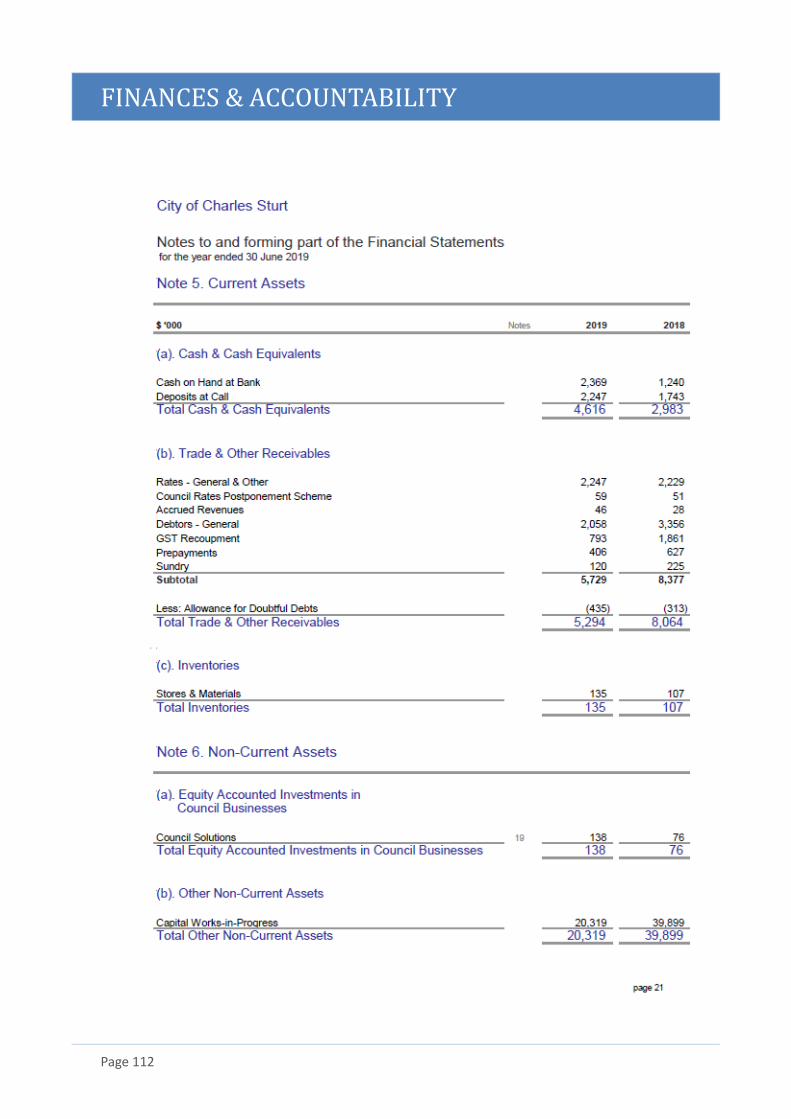
FINANCES & ACCOUNTABILITY
Page 112
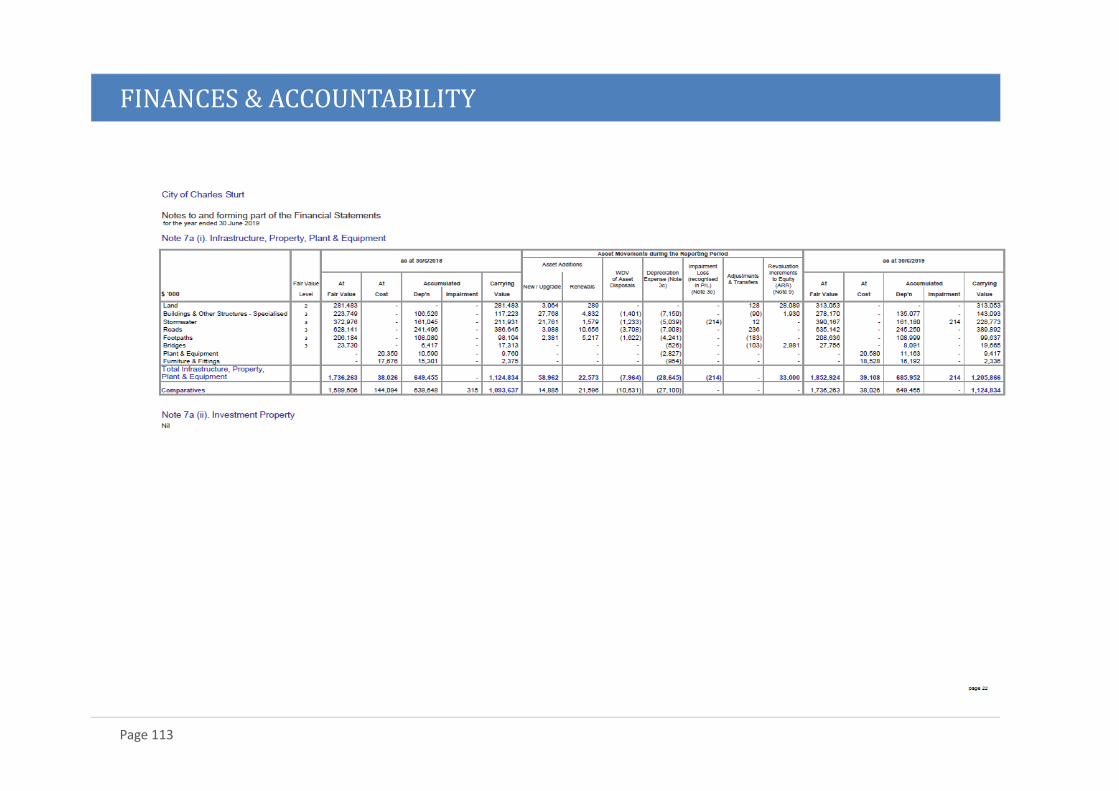
FINANCES & ACCOUNTABILITY
Page 113
FINANCES & ACCOUNTABILITY
Page 114
FINANCES & ACCOUNTABILITY
Page 115
FINANCES & ACCOUNTABILITY
Page 116
FINANCES & ACCOUNTABILITY
Page 117
FINANCES & ACCOUNTABILITY
Page 118
FINANCES & ACCOUNTABILITY
Page 119
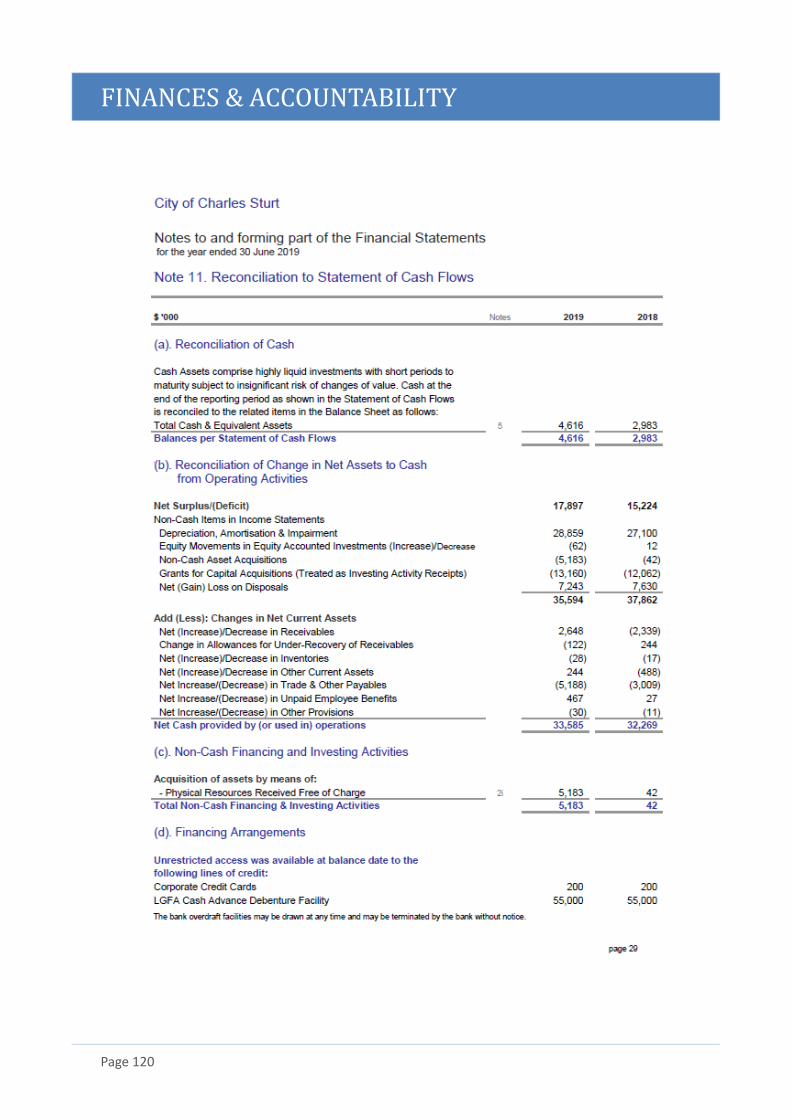
FINANCES & ACCOUNTABILITY
Page 120
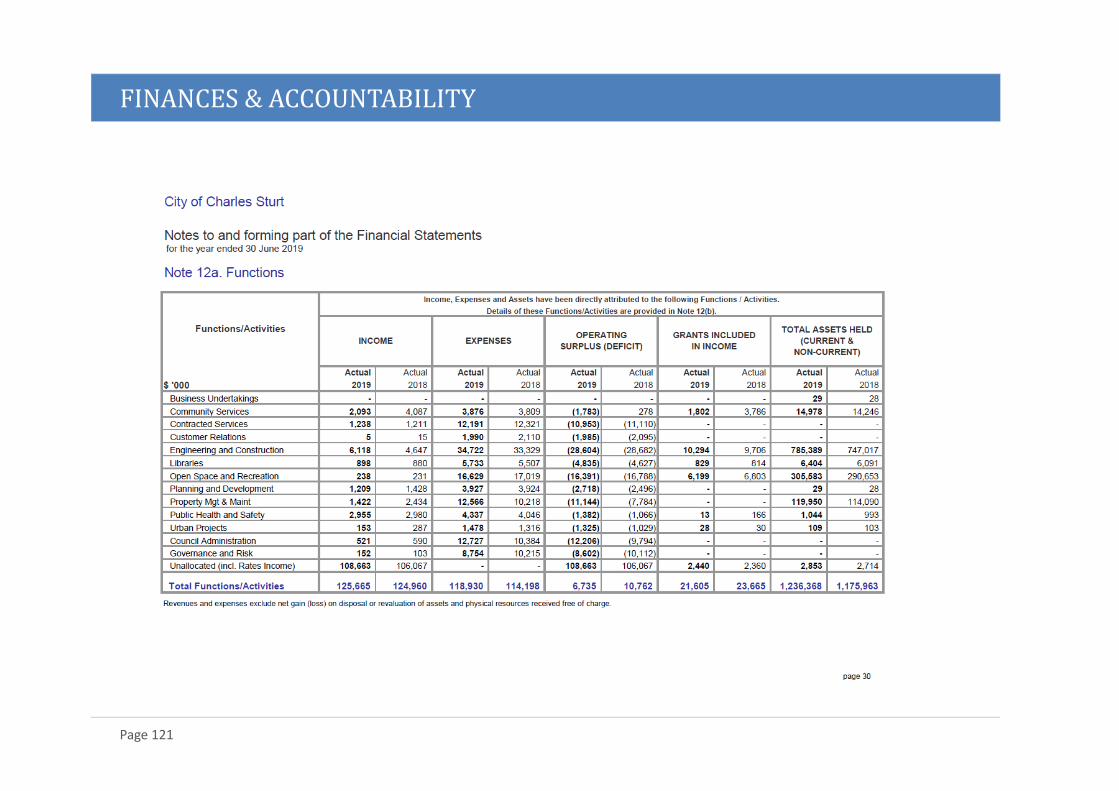
FINANCES & ACCOUNTABILITY
Page 121
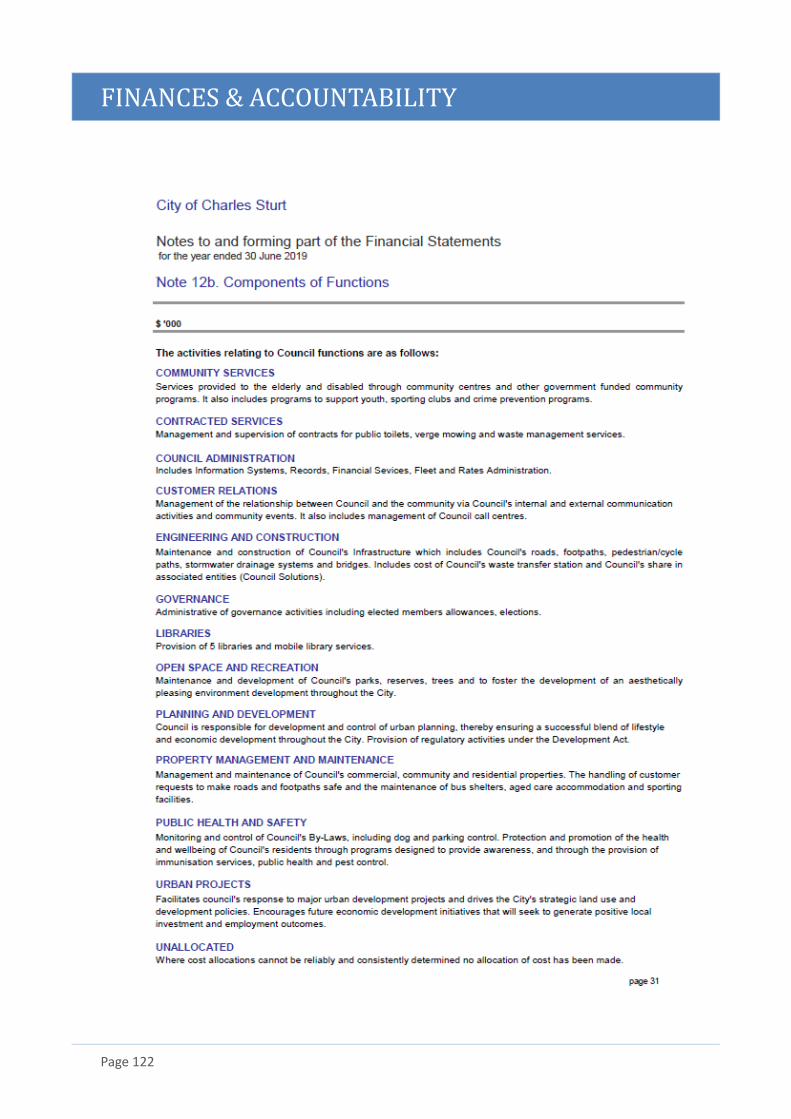
FINANCES & ACCOUNTABILITY
Page 122
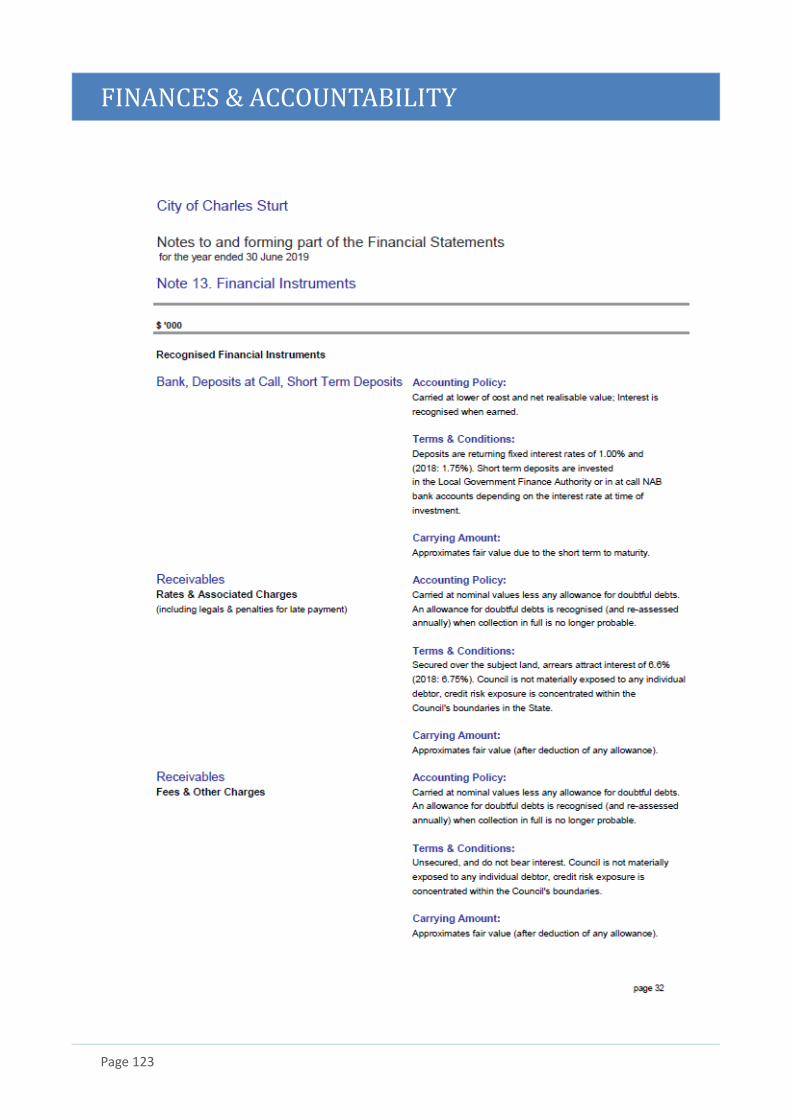
FINANCES & ACCOUNTABILITY
Page 123
FINANCES & ACCOUNTABILITY
Page 124
FINANCES & ACCOUNTABILITY
Page 125
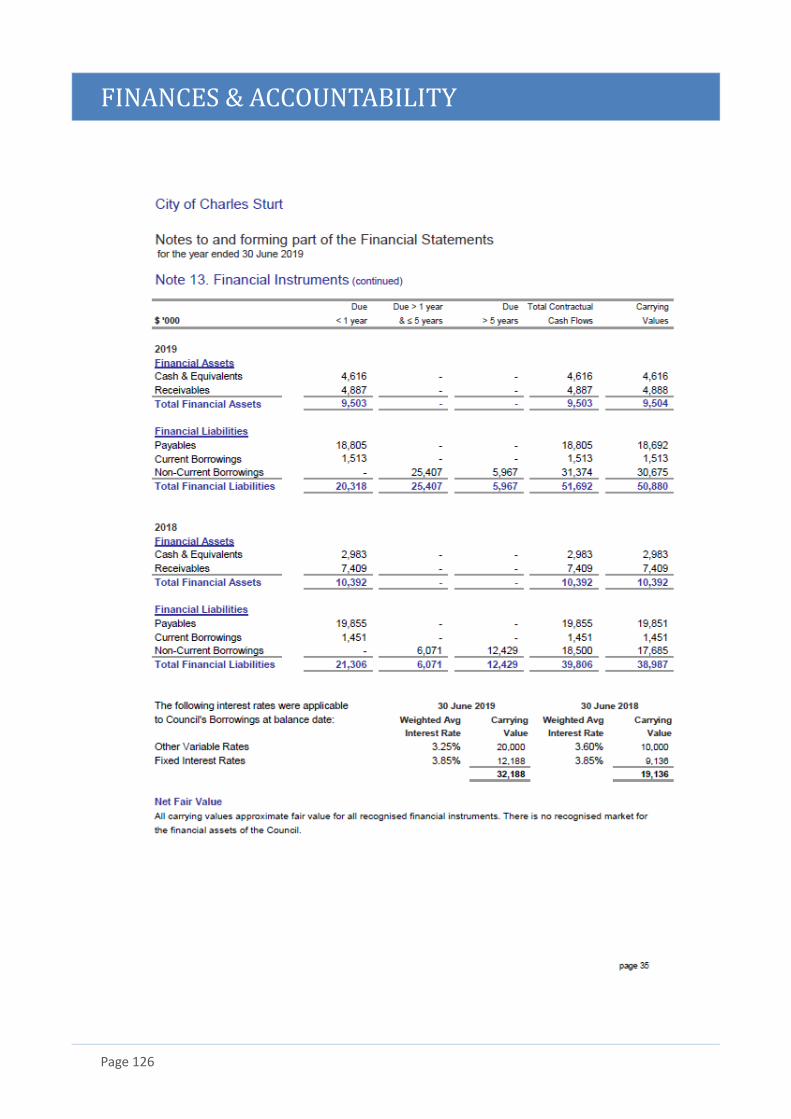
FINANCES & ACCOUNTABILITY
Page 126
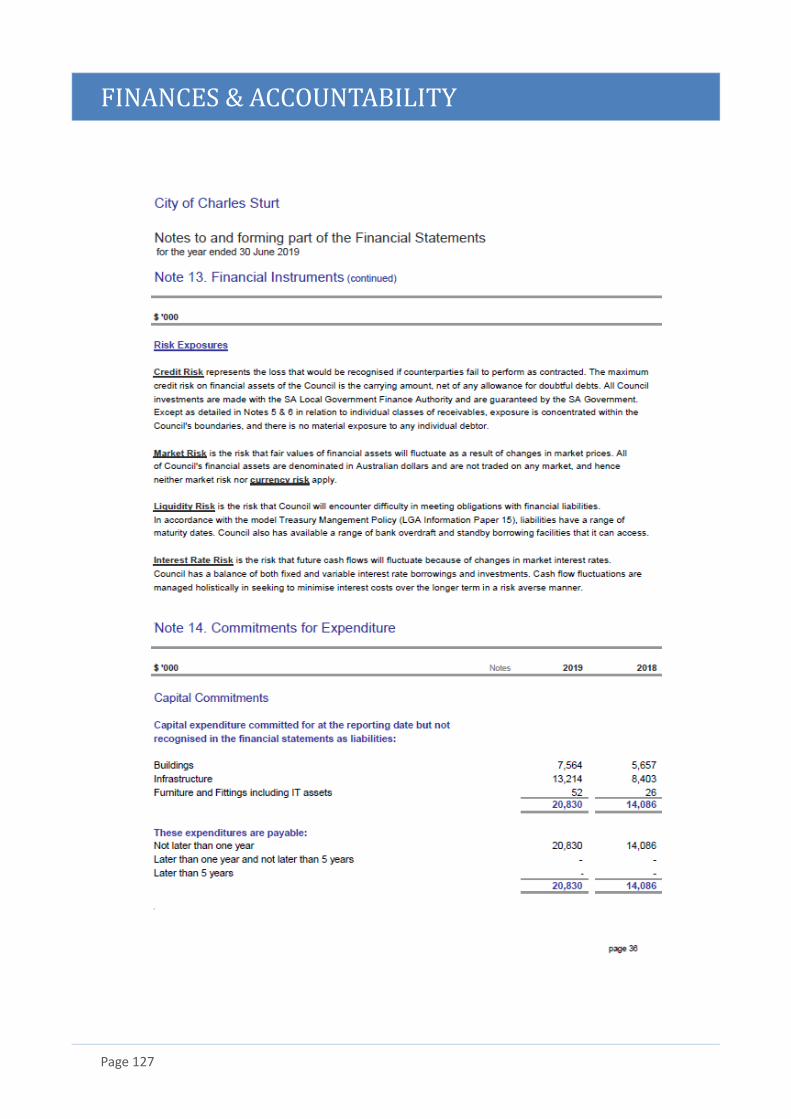
FINANCES & ACCOUNTABILITY
Page 127
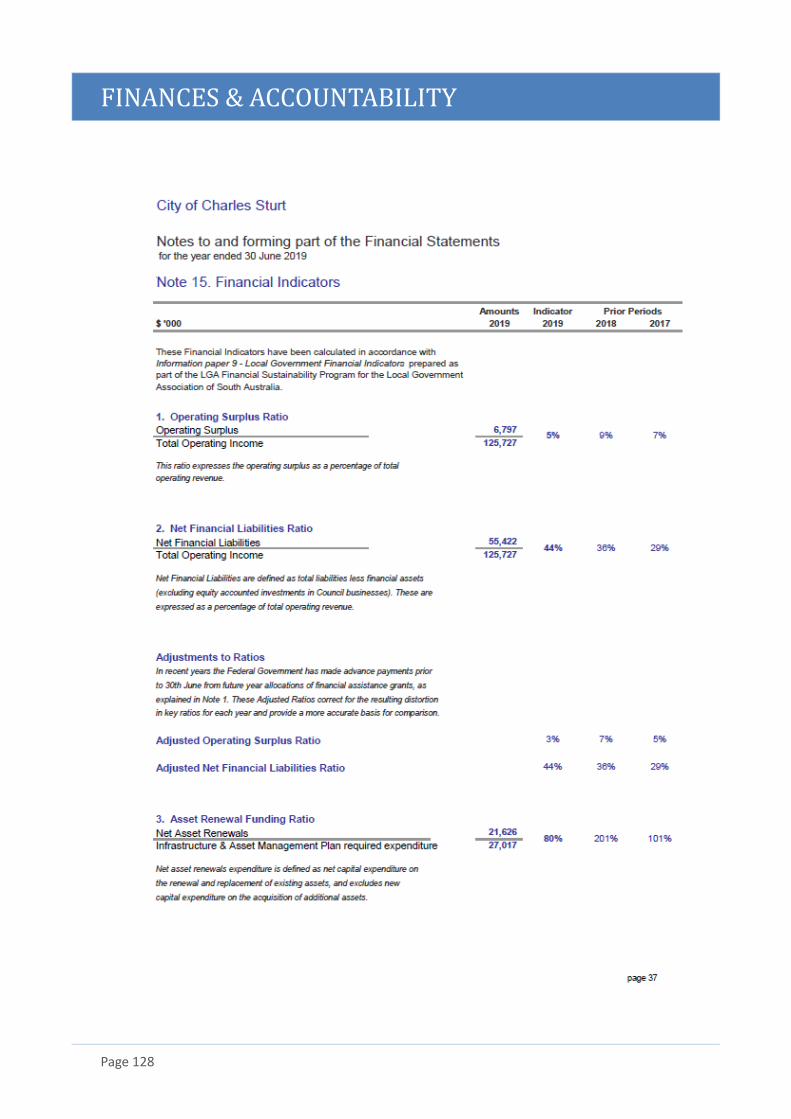
FINANCES & ACCOUNTABILITY
Page 128
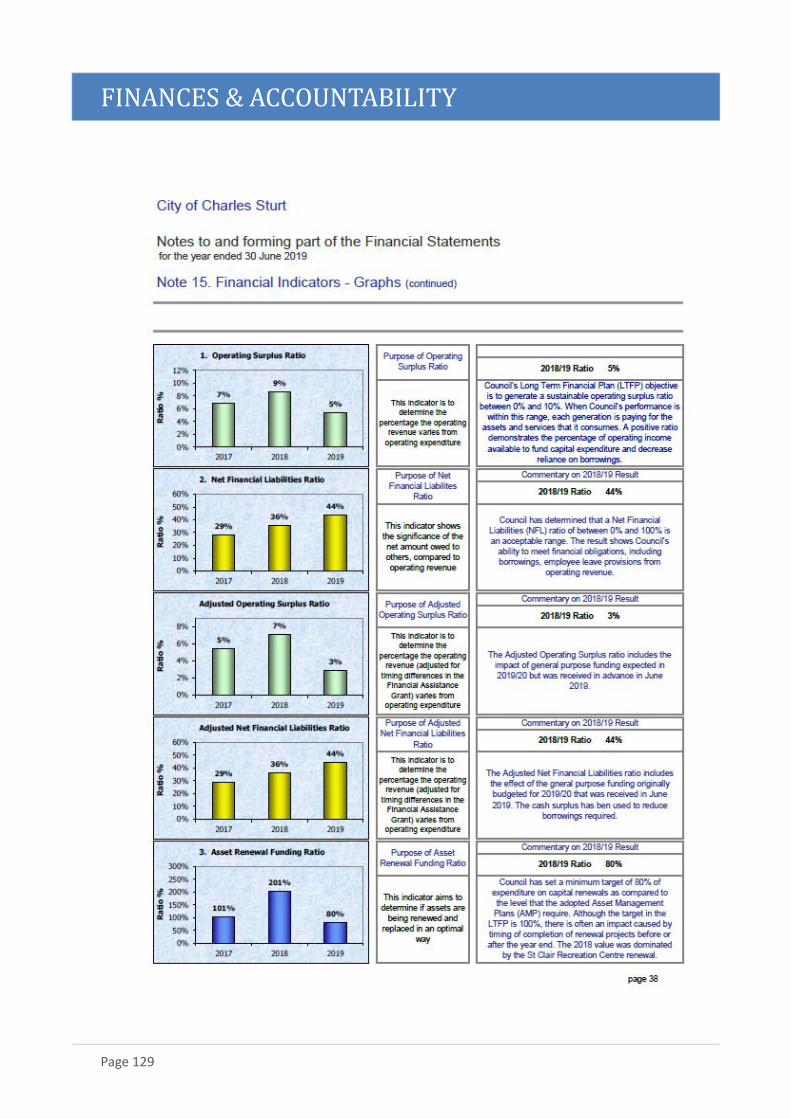
FINANCES & ACCOUNTABILITY
Page 129
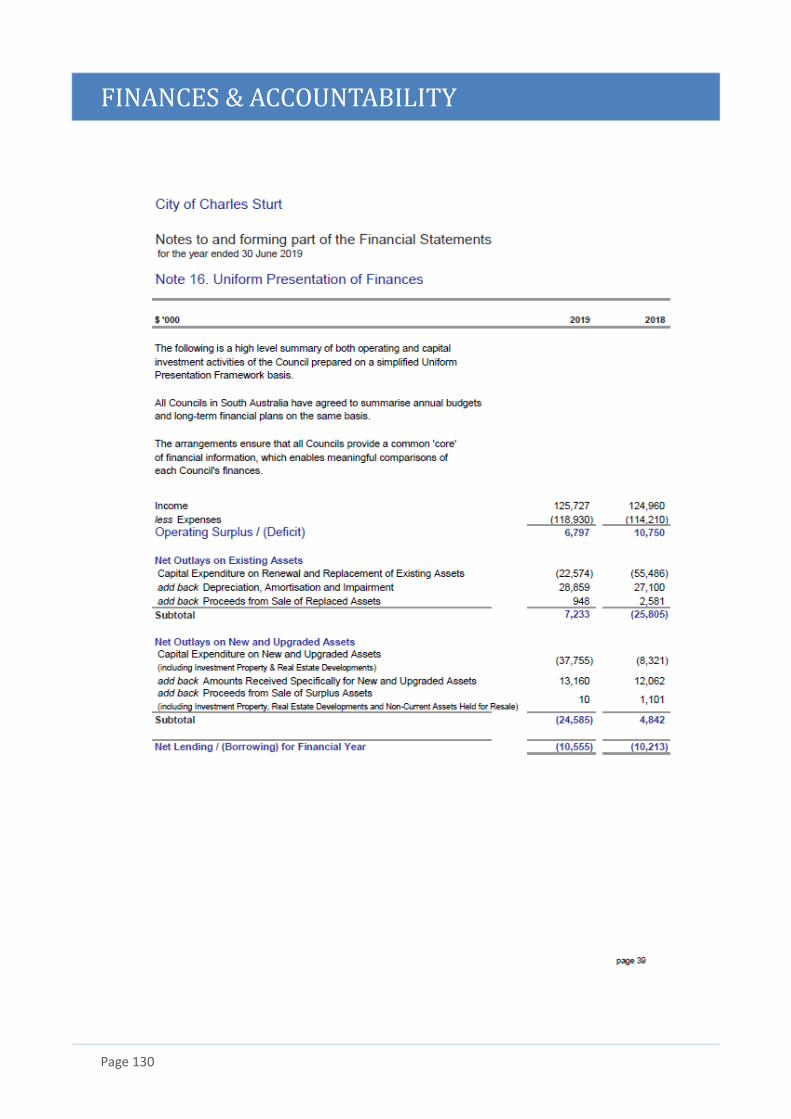
FINANCES & ACCOUNTABILITY
Page 130
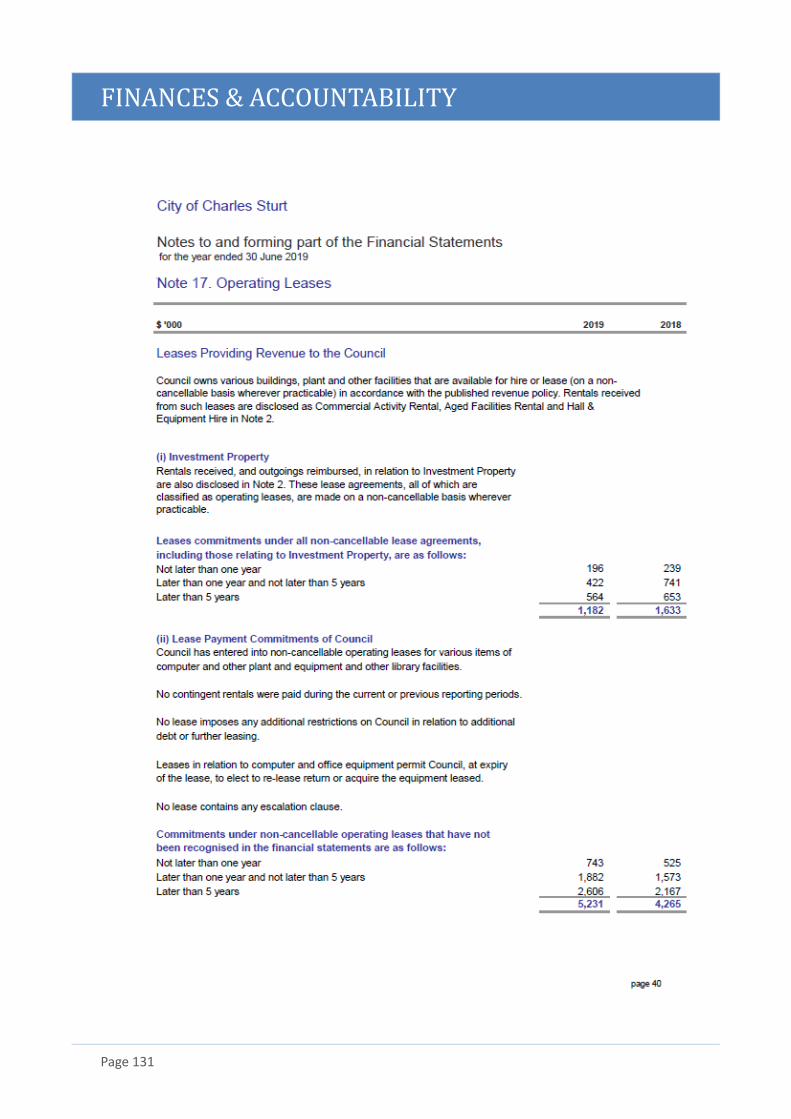
FINANCES & ACCOUNTABILITY
Page 131
FINANCES & ACCOUNTABILITY
Page 132
FINANCES & ACCOUNTABILITY
Page 133
FINANCES & ACCOUNTABILITY
Page 134
FINANCES & ACCOUNTABILITY
Page 135
FINANCES & ACCOUNTABILITY
Page 136
FINANCES & ACCOUNTABILITY
Page 137
FINANCES & ACCOUNTABILITY
Page 138
FINANCES & ACCOUNTABILITY
Page 139
FINANCES & ACCOUNTABILITY
Page 140
FINANCES & ACCOUNTABILITY
Page 141
FINANCES & ACCOUNTABILITY
Page 142
APPENDICES
Page 143
APPENDICES
Page 144
Appendix 1
List of Registers
The following are the registers Council keeps as required under the Local Government Act 1999 and
the Local Government (Elections) Act 1999:
• Assessment Record
• By-Law Register
• Delegations Register
• Fees and Charges Register
• Policy Register
• Register of Allowances and Benefits (Elected Members)
• Register of Community Land
• Register of Interests (Council members)
• Register of Interests (Council officers)
• Register of Public Roads
• Register of Salaries and Wages
• Register of Campaign Donation Returns
List of Codes of Conduct or Practice
The following is a list of the Codes of Conduct or Practice that Council is required to keep under the
Local Government Act 1999:
• Code of Conduct – Elected Members
• Code of Conduct – Employees
• Code of Practice – Public Access to Council and Committee Meetings and to associated
documents
• Code of Practice for Meeting Procedures
APPENDICES
Page 145
Appendix 2
Council Solutions Annual Report
APPENDICES
Page 146
APPENDICES
Page 147
APPENDICES
Page 148
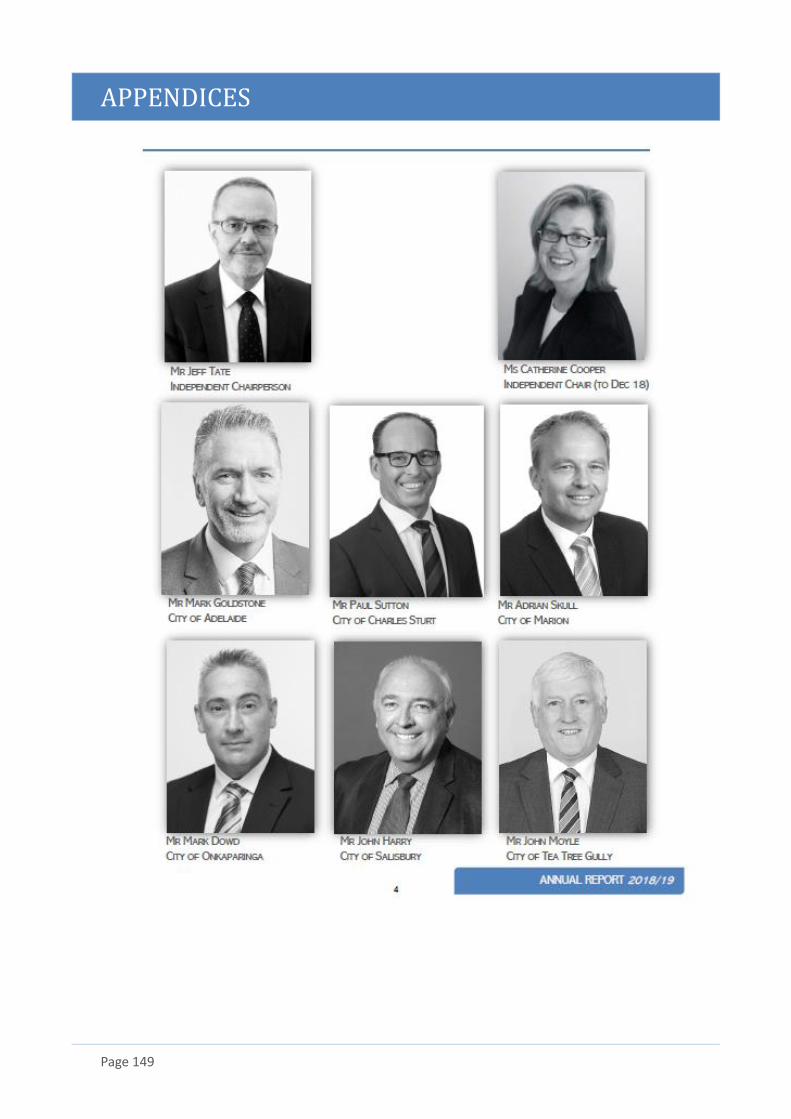
APPENDICES
Page 149
APPENDICES
Page 150

APPENDICES
Page 151
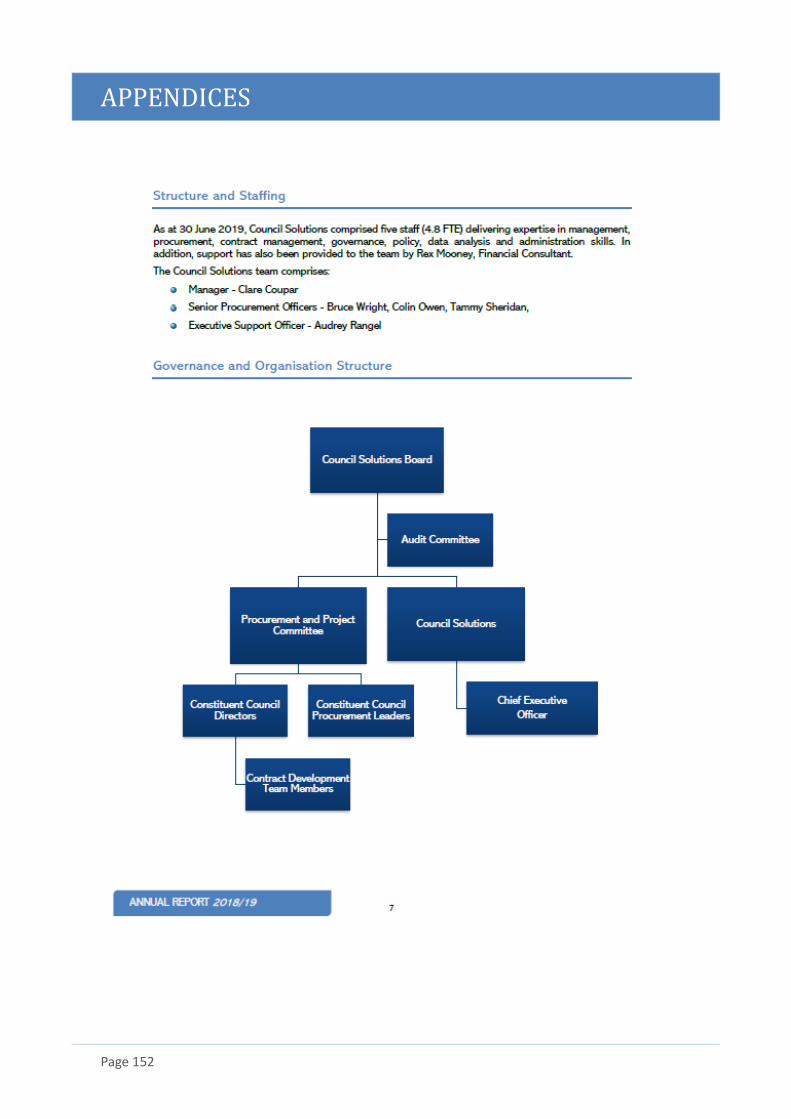
APPENDICES
Page 152
APPENDICES
Page 153
APPENDICES
Page 154
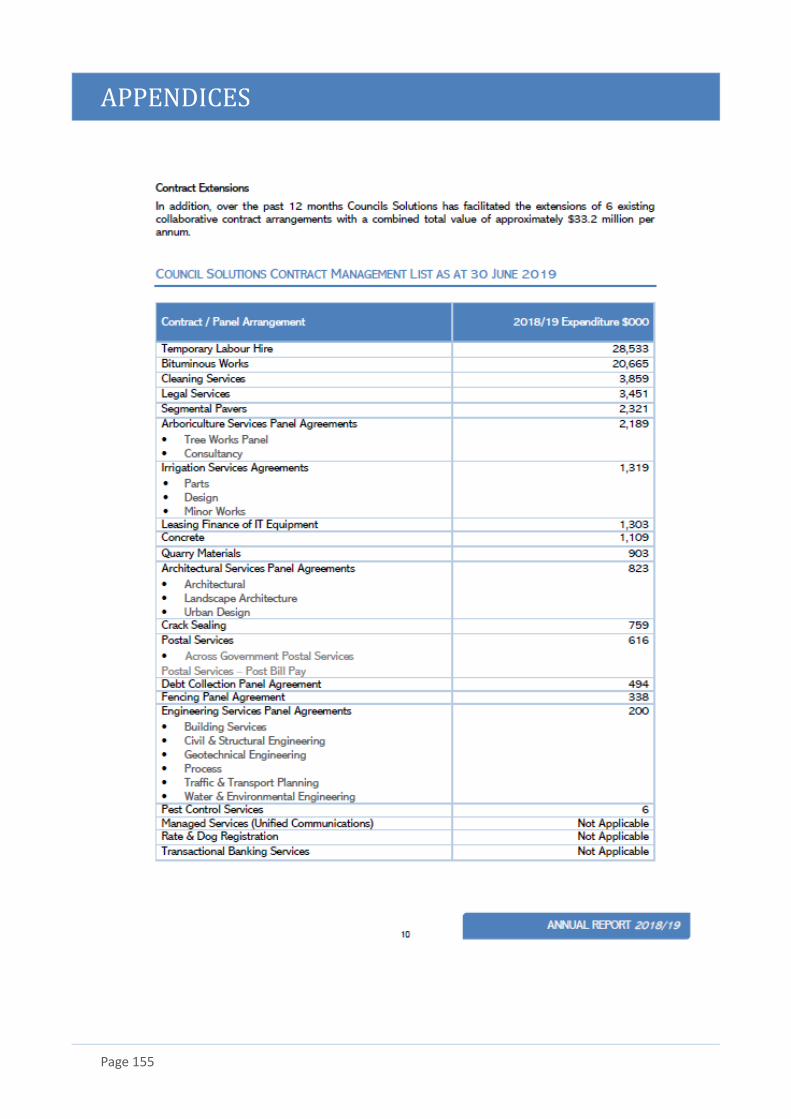
APPENDICES
Page 155
APPENDICES
Page 156
APPENDICES
Page 157
APPENDICES
Page 158
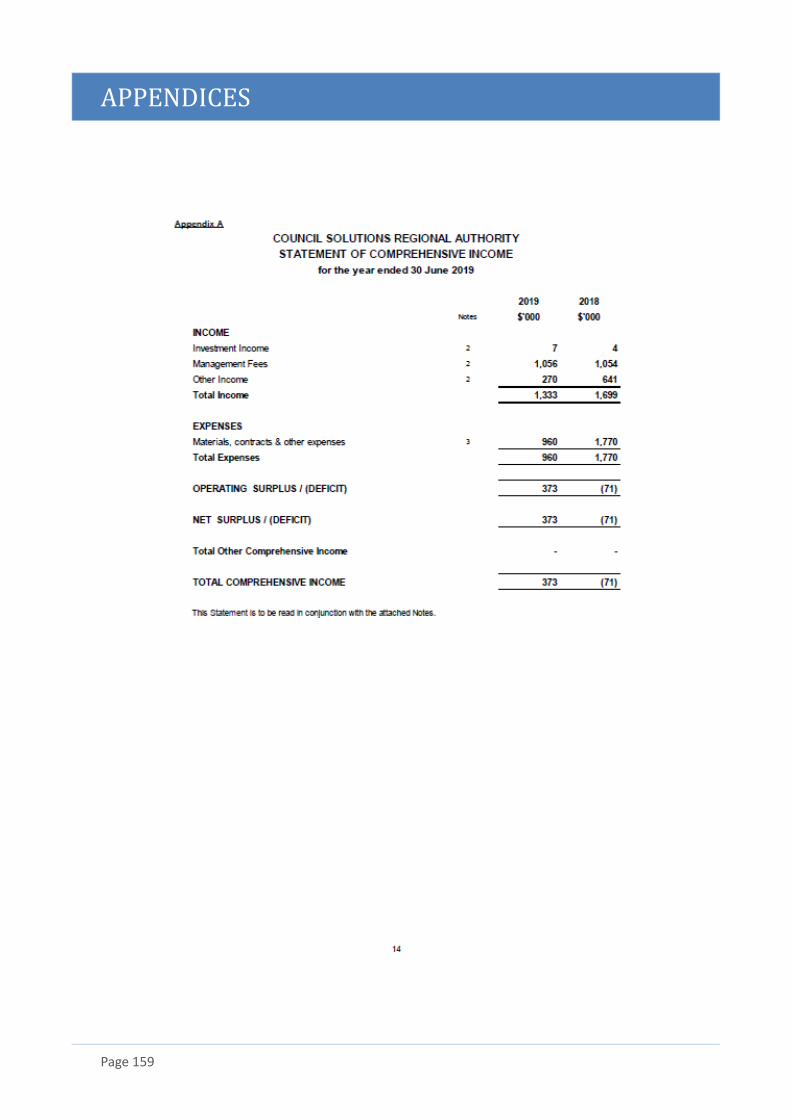
APPENDICES
Page 159
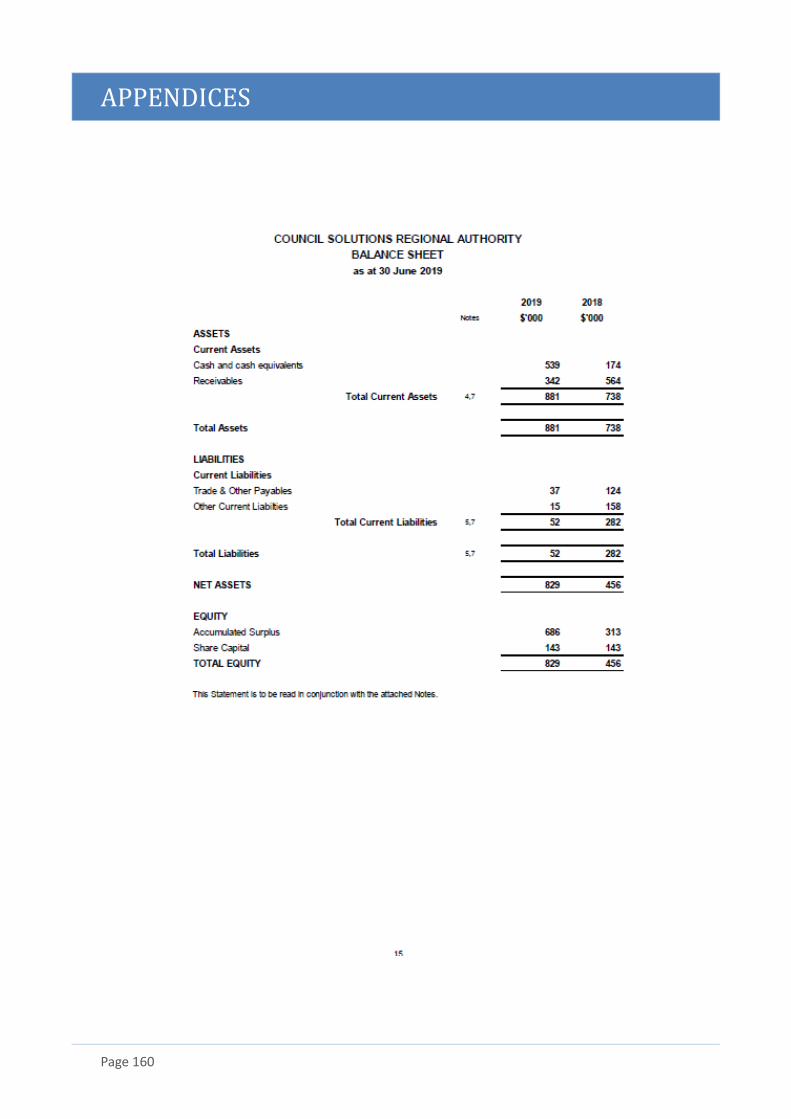
APPENDICES
Page 160
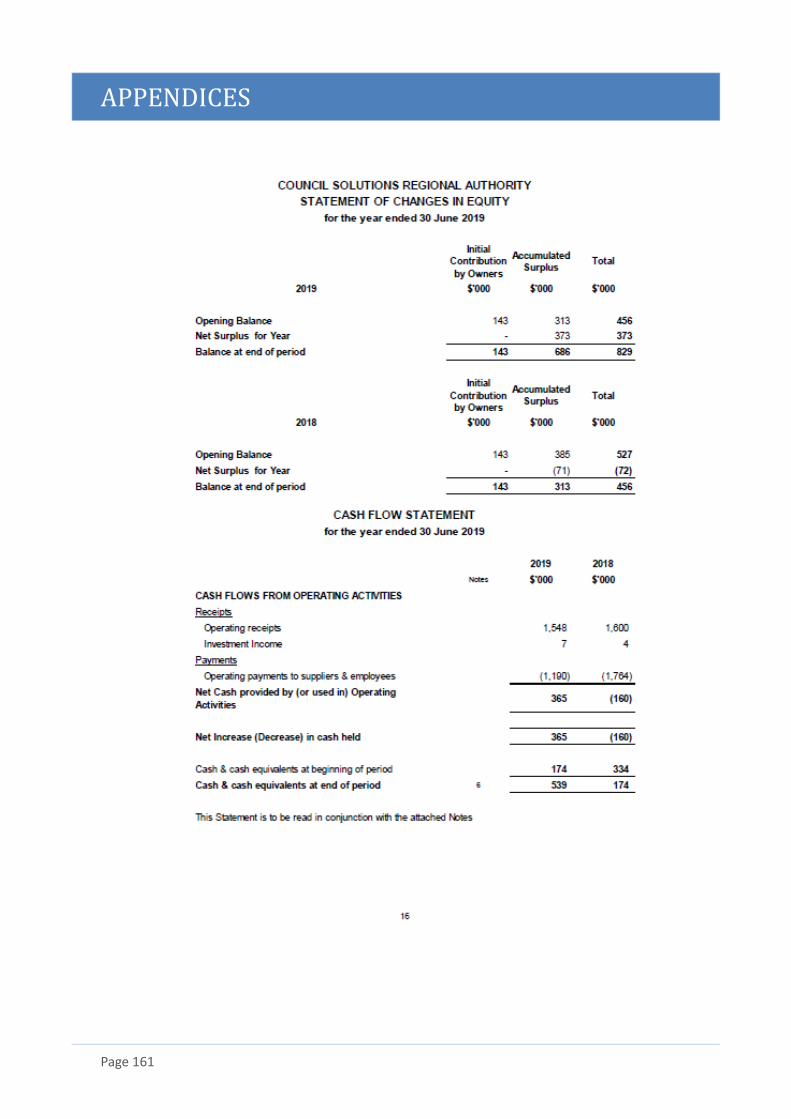
APPENDICES
Page 161
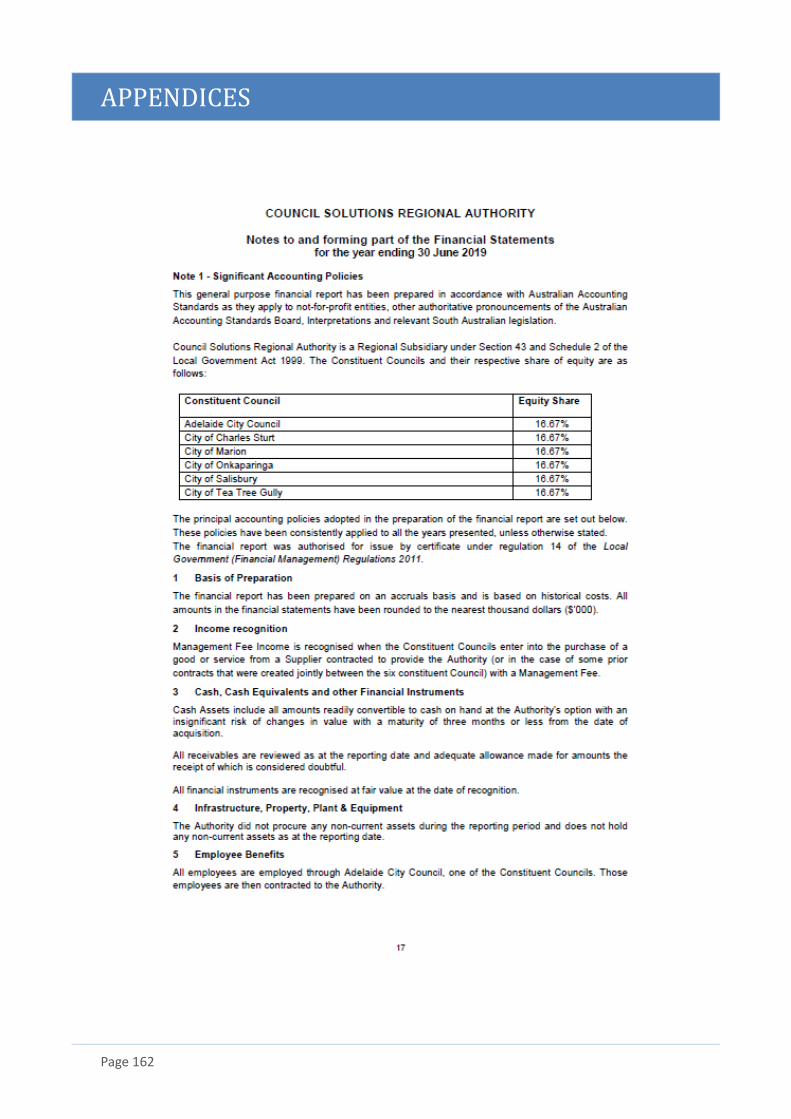
APPENDICES
Page 162
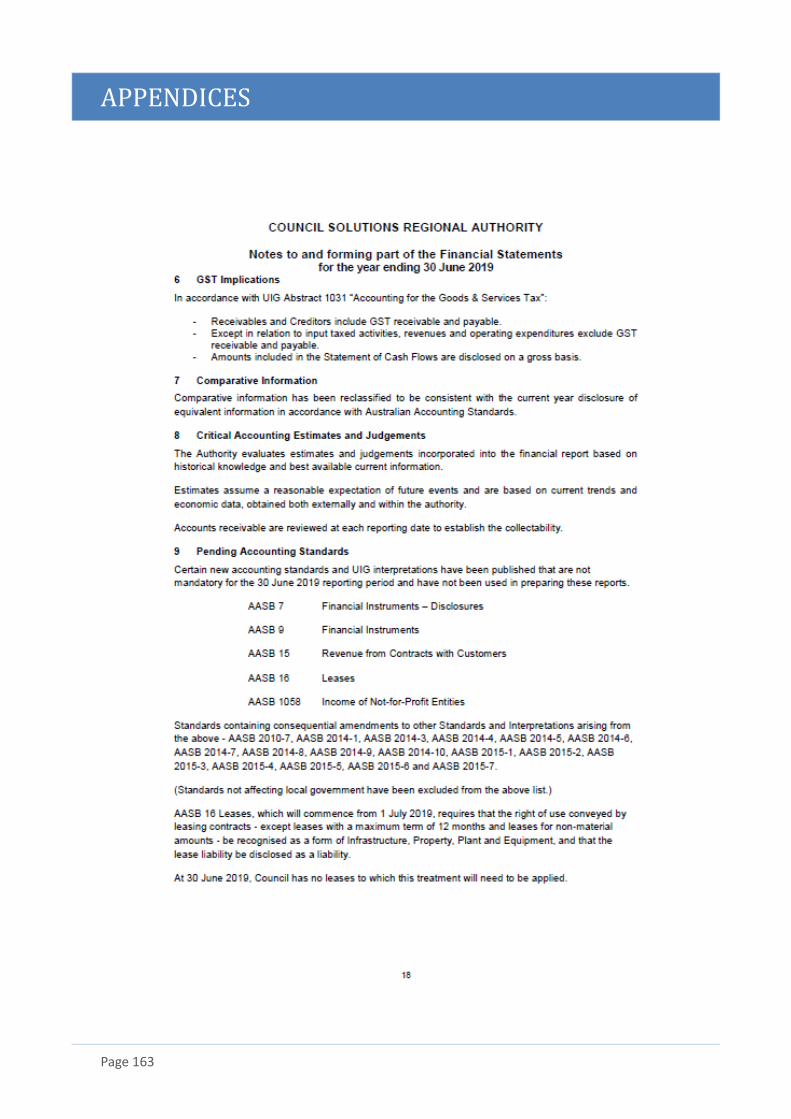
APPENDICES
Page 163
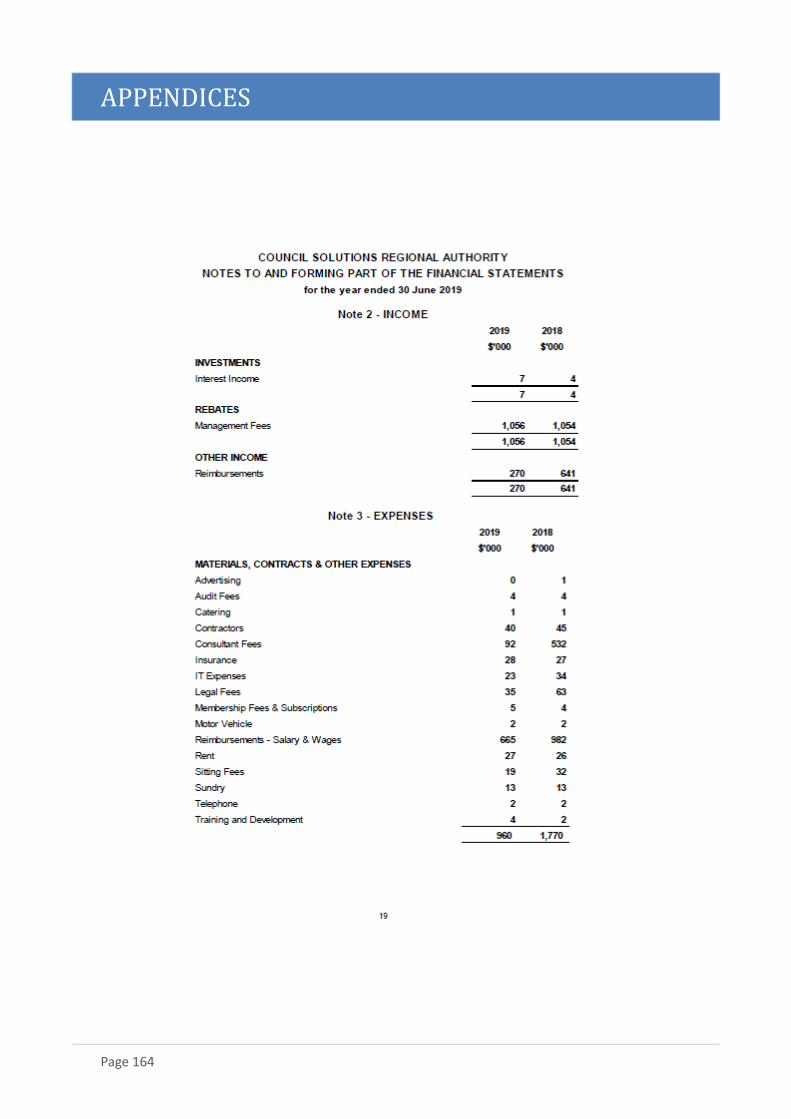
APPENDICES
Page 164
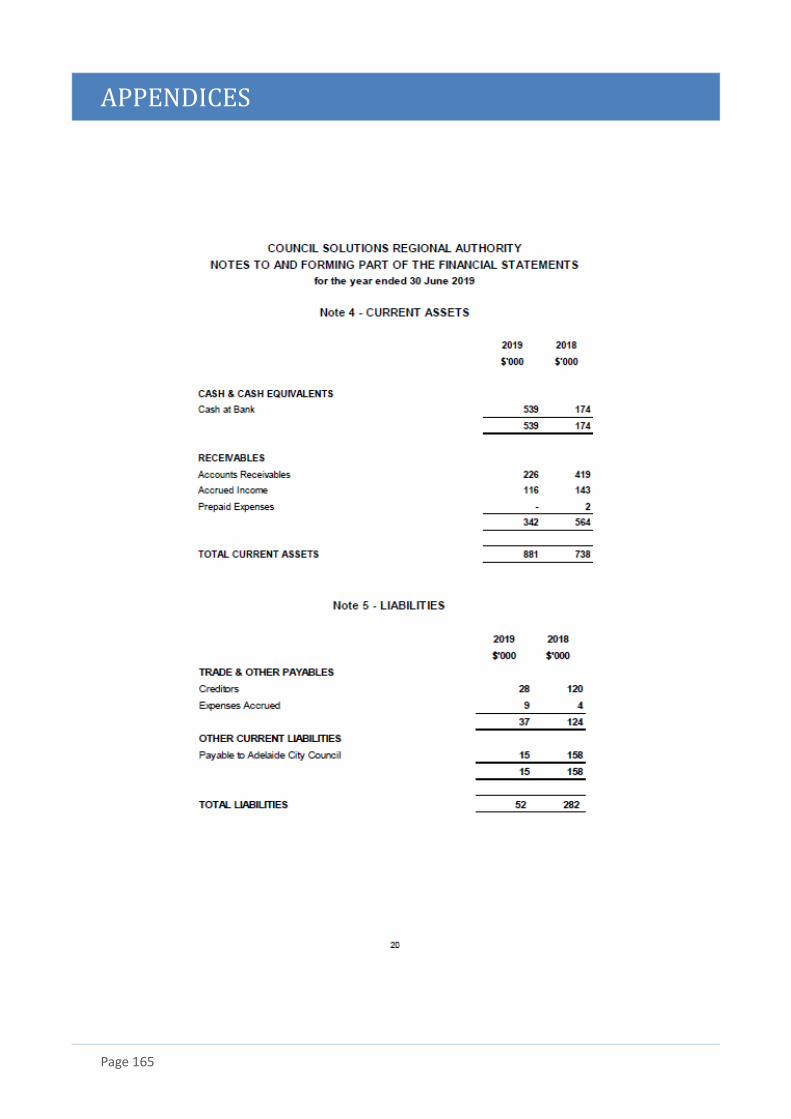
APPENDICES
Page 165
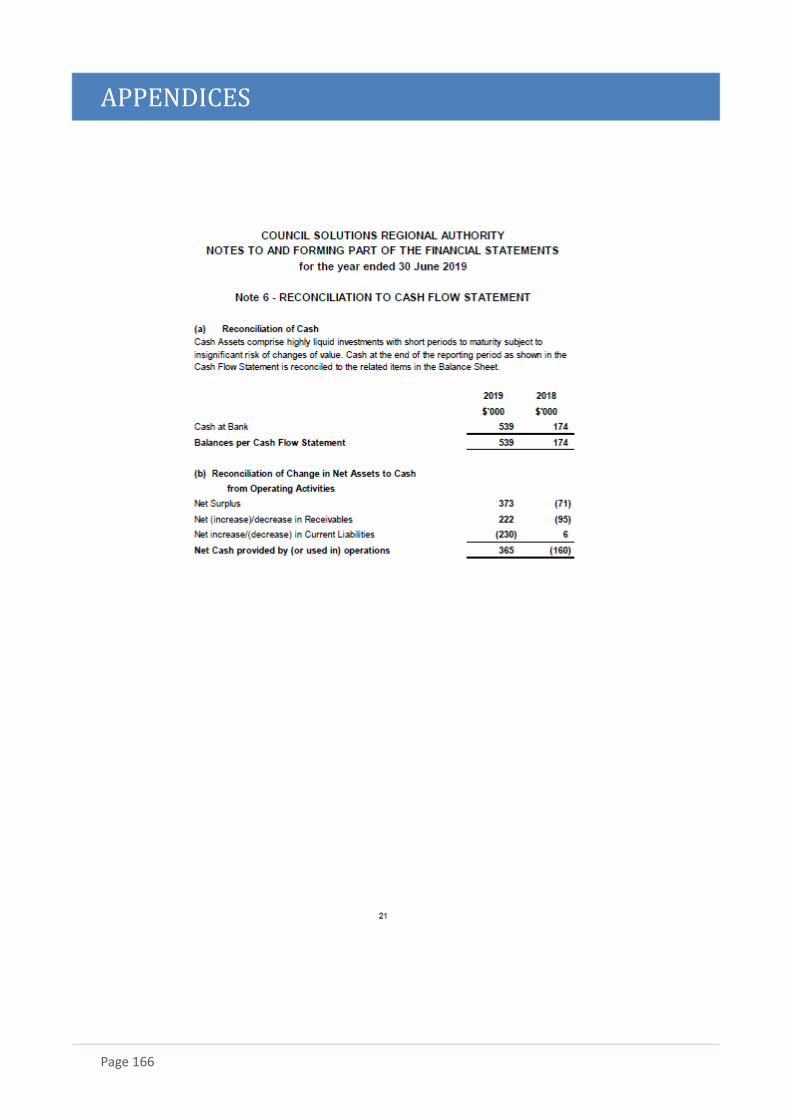
APPENDICES
Page 166
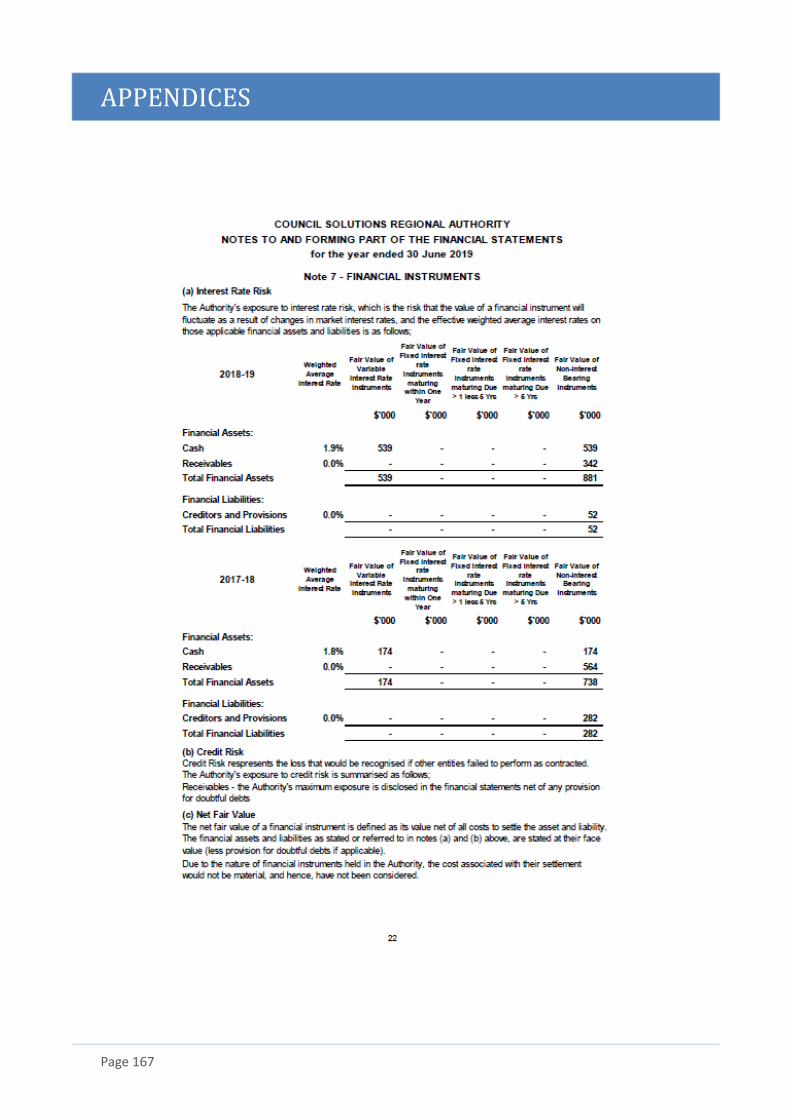
APPENDICES
Page 167
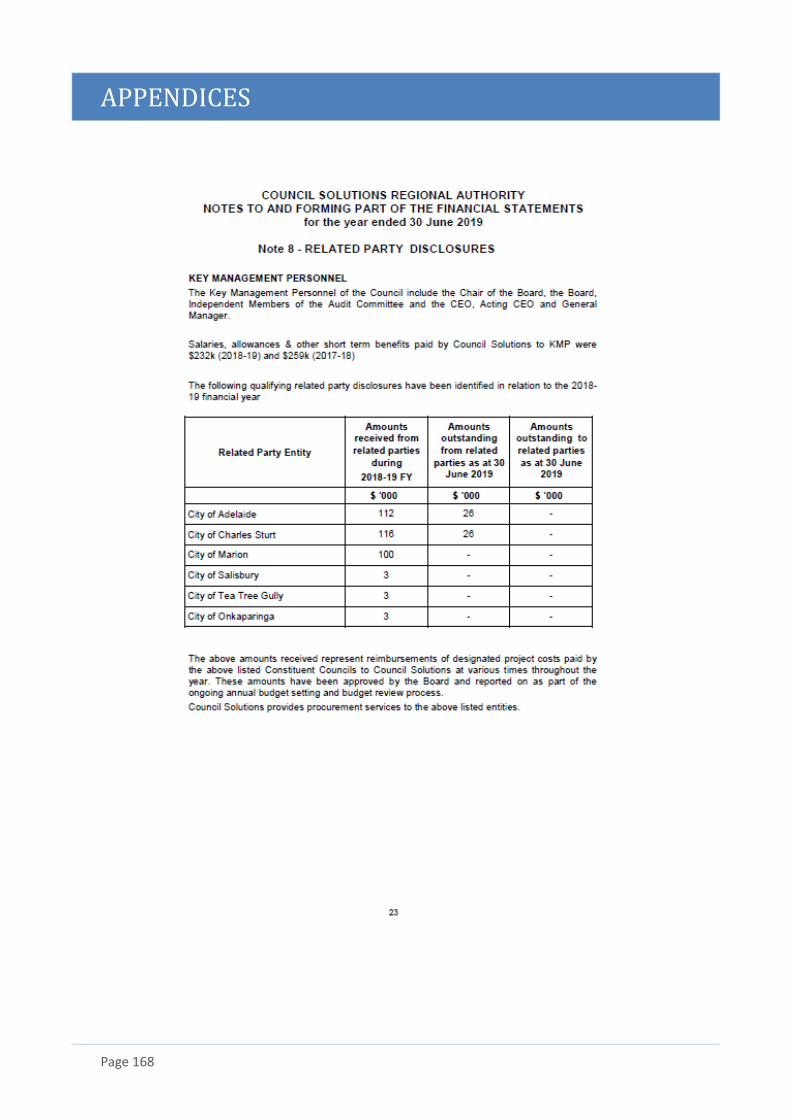
APPENDICES
Page 168
APPENDICES
Page 169
APPENDICES
Page 170
APPENDICES
Page 171
APPENDICES
Page 172
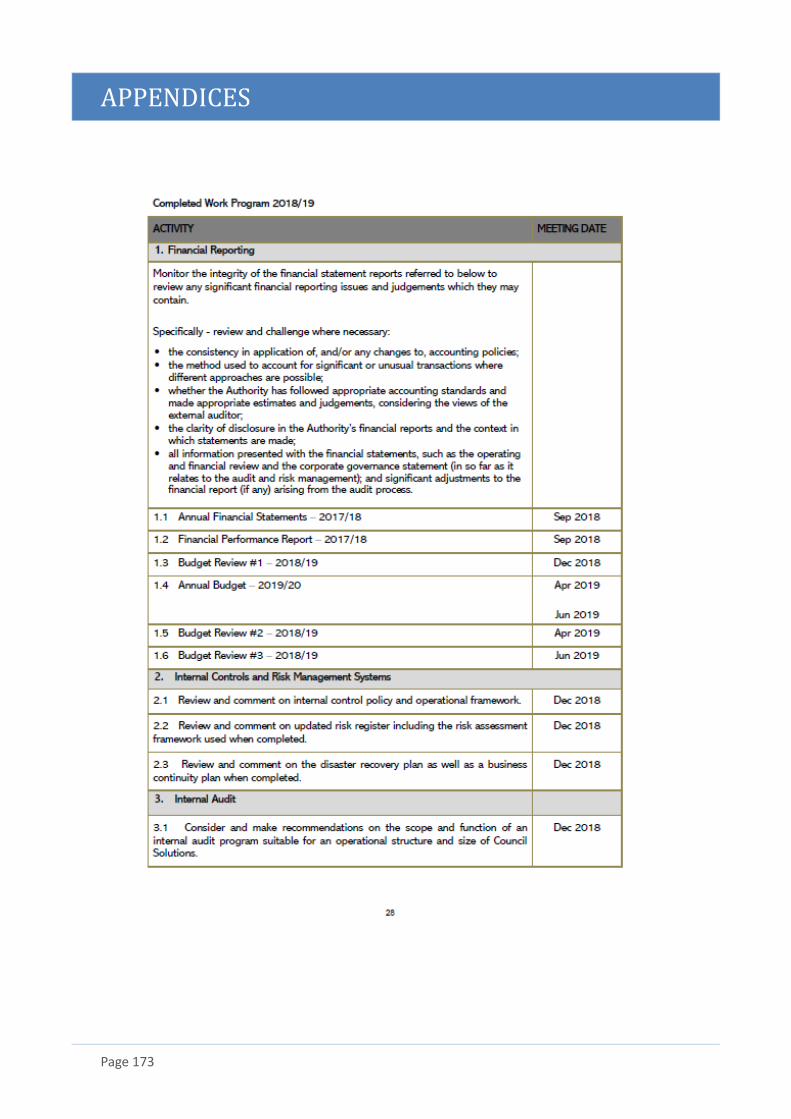
APPENDICES
Page 173
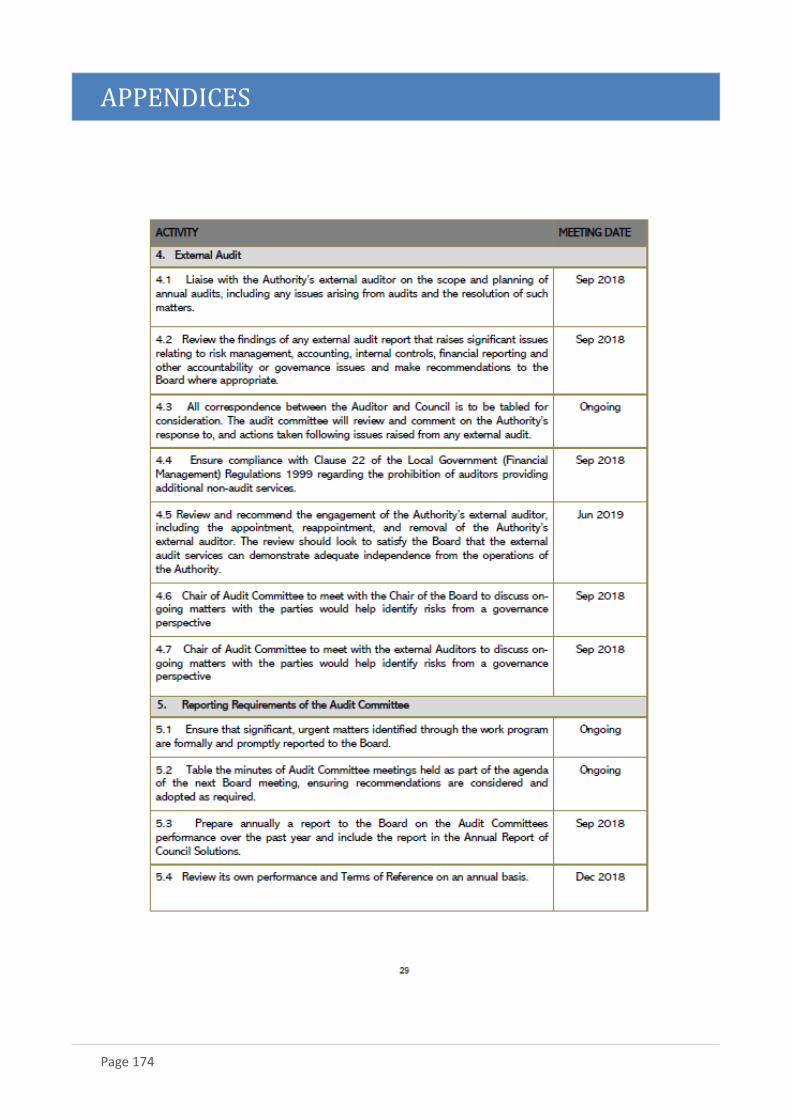
APPENDICES
Page 174

APPENDICES
Page 175

APPENDICES
Page 176
APPENDICES
Page 177
Appendix 3
Charles Sturt Building Fire Safety Committee Annual Report 2018/19
The Building Fire Safety Committee (BFSC) was established in accordance with the requirements of Section 71 of the Development Act. The purpose of the Building Fire Safety Committee is to maintain proper levels of fire safety in all buildings within the Council area. The activities of the BFSC are additional and separate to the building inspections undertaken under Council’s Building Inspection Policy. The committee shall consist of three members with a quorum of the Committee being three members. The committee must include;
• The nominee of the Chief Officer of the South Australian Metropolitan Fire Service;
• Council’s Building Surveyor or Team Leader Building who will preside at the meetings when in attendance;
• One of the appointed staff members listed above as a person with prescribed Building Surveying qualifications attending on a rotational basis as determined by the Team Leader Building, Compliance and TAG or Manager Planning and Development.
For the 2018/19 financial year the committee met 4 times and inspected 1 new property. Throughout the year Council Building Surveying officers reported back to the Building Fire Safety Committee about the progress of the fire safety upgrades of the 22 properties with BFSC actions. 3 properties have completed the fire safety upgrades this financial year. There are currently 20 properties that are being monitored by Councils Building Surveying Officers for the BFSC that are currently having the Fire Safety Services upgraded or require upgrading.
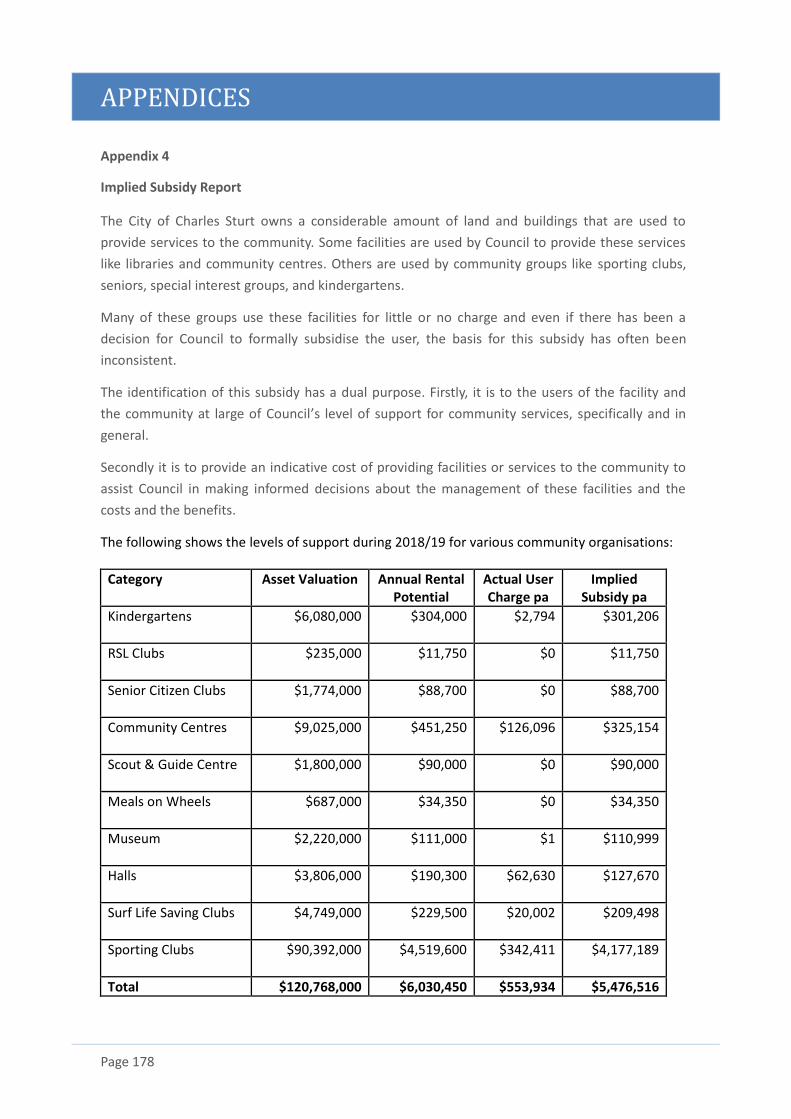
APPENDICES
Page 178
Appendix 4
Implied Subsidy Report
The City of Charles Sturt owns a considerable amount of land and buildings that are used to
provide services to the community. Some facilities are used by Council to provide these services
like libraries and community centres. Others are used by community groups like sporting clubs,
seniors, special interest groups, and kindergartens.
Many of these groups use these facilities for little or no charge and even if there has been a
decision for Council to formally subsidise the user, the basis for this subsidy has often been
inconsistent.
The identification of this subsidy has a dual purpose. Firstly, it is to the users of the facility and
the community at large of Council’s level of support for community services, specifically and in
general.
Secondly it is to provide an indicative cost of providing facilities or services to the community to
assist Council in making informed decisions about the management of these facilities and the
costs and the benefits.
The following shows the levels of support during 2018/19 for various community organisations:
Category Asset Valuation Annual Rental Potential
Actual User Charge pa
Implied Subsidy pa
Kindergartens
$6,080,000 $304,000 $2,794 $301,206
RSL Clubs
$235,000 $11,750 $0 $11,750
Senior Citizen Clubs
$1,774,000 $88,700 $0 $88,700
Community Centres
$9,025,000 $451,250 $126,096 $325,154
Scout & Guide Centre
$1,800,000 $90,000 $0 $90,000
Meals on Wheels
$687,000 $34,350 $0 $34,350
Museum
$2,220,000 $111,000 $1 $110,999
Halls
$3,806,000 $190,300 $62,630 $127,670
Surf Life Saving Clubs
$4,749,000 $229,500 $20,002 $209,498
Sporting Clubs
$90,392,000 $4,519,600 $342,411 $4,177,189
Total $120,768,000 $6,030,450 $553,934 $5,476,516
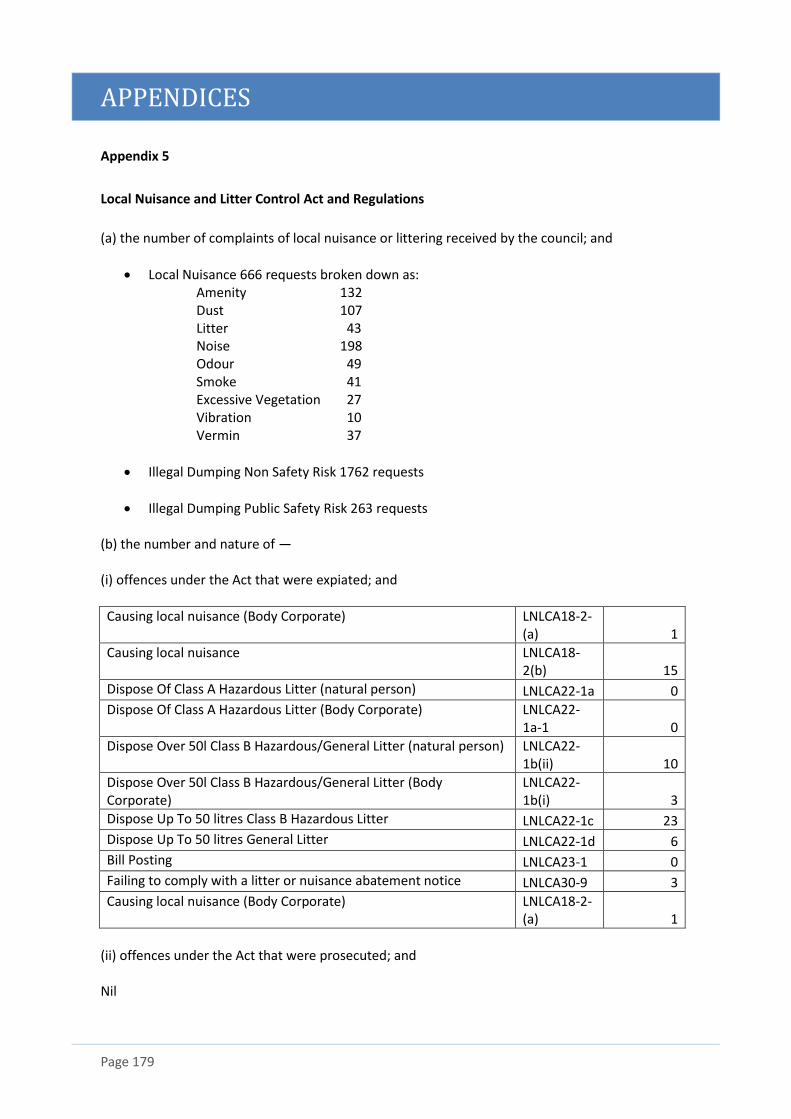
APPENDICES
Page 179
Appendix 5
Local Nuisance and Litter Control Act and Regulations
(a) the number of complaints of local nuisance or littering received by the council; and
• Local Nuisance 666 requests broken down as: Amenity 132 Dust 107 Litter 43 Noise 198 Odour 49 Smoke 41 Excessive Vegetation 27 Vibration 10 Vermin 37
• Illegal Dumping Non Safety Risk 1762 requests
• Illegal Dumping Public Safety Risk 263 requests (b) the number and nature of — (i) offences under the Act that were expiated; and
Causing local nuisance (Body Corporate) LNLCA18-2-(a) 1
Causing local nuisance LNLCA18-2(b) 15
Dispose Of Class A Hazardous Litter (natural person) LNLCA22-1a 0
Dispose Of Class A Hazardous Litter (Body Corporate) LNLCA22-1a-1 0
Dispose Over 50l Class B Hazardous/General Litter (natural person) LNLCA22-1b(ii) 10
Dispose Over 50l Class B Hazardous/General Litter (Body Corporate)
LNLCA22-1b(i) 3
Dispose Up To 50 litres Class B Hazardous Litter LNLCA22-1c 23
Dispose Up To 50 litres General Litter LNLCA22-1d 6
Bill Posting LNLCA23-1 0
Failing to comply with a litter or nuisance abatement notice LNLCA30-9 3
Causing local nuisance (Body Corporate) LNLCA18-2-(a) 1
(ii) offences under the Act that were prosecuted; and Nil
APPENDICES
Page 180
Appendix 5 continued
(iii) nuisance abatement notices or litter abatement notices issued; and 27 (iv) civil penalties negotiated under section 34 of the Act; and Nil
Local Nuisance and Litter Control Act and Regulations
(v) applications by the council to the Court for orders for civil penalties under section 34 of the Act and the number of orders made by the Court on those applications; and Nil (c) any other functions performed by the council under the Act. Nil


