Patient Transport Services: a Healthwatch In Sussex report on patient experiences 1 | Page November 2020 Patient Transport Services in Sussex What patients and passengers told us about the service in 2020 Full report
Transcript
Patient Transport Services: a Healthwatch
In Sussex report on patient experiences 1 | P a g e
November 2020
Patient Transport Services in Sussex
What patients and passengers told us
about the service in 2020
Full report
Patient Transport Services: a Healthwatch
In Sussex report on patient experiences 2 | P a g e
Contents
SECTION Page
Preface 3
1. Executive summary
Introduction
Methodology and engagement
Headline findings
- The people
- What elements of the service are working well? - What elements of the service are not working as well? - Key improvements and future changes to the service that
passengers would like to see.
4
4
5
6
8
9
11
2. Conclusions and Healthwatch in Sussex recommendations
13
3. Response from Sussex NHS Commissioners and current
provider (SCAS)
18
Full report
4. Introduction and background
5. Methodology and analysis
6. The people
7. Satisfaction levels and recommendation ratings
8. Patient and passenger experiences of the service:
- The application process
- Experiences of using the service during COVID lockdown
- Delays, change and problems with transport
- The impact of delays, changes, and problems
9. The future of the service
- What is important to passengers
- What features do passengers want to see
- How to improve communications
21
22
23
30
45
57
66
78
82
85
94
100
10. How to contact Healthwatch
111
Patient Transport Services: a Healthwatch
In Sussex report on patient experiences 3 | P a g e
Preface
Healthwatch in Sussex involves Healthwatch teams from across Brighton and Hove, East
Sussex and West Sussex working in collaboration to deliver joint projects on health and social
care services which support the population of Sussex.
This is the third of four reports from Healthwatch in Sussex on Non-Emergency Patient
Transport Services (the “service”).
The first three Healthwatch reports are intended to advise NHS Clinical Commissioning Groups
on the retendering of the service. The fourth report will be produced to advise the public and
those who use the service on the outcomes of our work. It is our intention to publish the
reports in due course, together with responses from the Clinical Commissioning Groups to our
findings.
Report 1
Delivered on 30th September 2020 to NHS Clinical Commissioning Groups. Healthwatch
reviewed over 30 publications and documents (written since 2009) on the operation of the
service both in Sussex and nationally. This report brought together the main findings and
recommendations of these publications into one Healthwatch in Sussex report, so these are
easily accessible for commissioners, current and future providers of the service, and patients.
The report highlighted the key aspects to be considered in the commissioning process and
contract specification.
Report 2
Delivered on 13th October 2020. This report provided a summary analysis of results to the
Clinical Commissioning Groups from the Sussex-wide patient engagement undertaken in
September 2020. It captured passengers’ experiences of the current service. The report,
along with Report 1, were provided ahead of a market engagement event for the new service
contract which was held on 19th October 2020. (This interim report will not be published).
Report 3 (this report)
Delivered on 16th November 2020 to NHS Clinical Commissioning Groups. This report provides
a detailed analysis of the results from the Healthwatch in Sussex passenger engagement
exercise.
Report 4
January 2021: Will be a public-facing report which will bring together the outcomes from the
first 3 reports.
Healthwatch in Sussex would like to thank the Clinical Commissioning Groups for their
cooperation in delivering this project, and staff across our local hospitals for their help in
sharing the questionnaire and ensuring that patients’ voices were heard.
Report author: Alan Boyd, Healthwatch Brighton and Hove
Patient Transport Services: a Healthwatch
In Sussex report on patient experiences 4 | P a g e
2. Executive summary
This report is a collaboration between Healthwatch in Sussex. Our engagement focussed on
establishing people's experiences of the local Non-Emergency Patient Transport Service,
which we refer to as ‘the service’ throughout this report.
This engagement process looked at people’s opinions about the service during the last 12
months (September 2019 to September 2020), focussing on:
• How they first found out and subsequently applied for the current service; their
satisfaction levels with the application process, and what they thought about any
information they were provided with about the service.
• Their experiences of using the service during the COVID-19 lockdown period (23rd March –
4th July 2020), and how they rated this experience compared to any other times when they
had used it.
• Their experiences if any (at any point in time in the last 12 months), of any delays,
changes, or problems with their journeys and the impacts that such incidents may have
had for them.
• The future of the service and thoughts for how it might be improved going forward.
• Satisfaction levels and recommendation ratings for the service.
Introduction For people who meet certain criteria, the NHS offers a free at the point of use Non-
Emergency Patient Transport Service. NHS Choices explains that the service is designed for
people whose condition means they need additional medical support during their journey to
and from hospital and other medical appointments. The service serving Sussex is currently
provided by South Central Ambulance Service (SCAS, 2017-present). The service is scheduled
to be re-commissioned during 2021, with a new 5-year contract worth up to £20 million
beginning in April 2022.
In June 2020, Sussex NHS Commissioners, representing NHS Clinical Commissioning Groups
(CCGs) in Sussex, approached Healthwatch in Sussex to help them gather people’s
experiences of using the service. This is the fourth time, since 2016, that Healthwatch has
undertaken such work; the last time Healthwatch carried out passenger engagement was in
November - December 2017 (our subsequent report was published April 2018).
Negotiations between Healthwatch and the CCGs to undertake this work originally
commenced in November/December 2019 but were subsequently halted by the coronavirus
(COVID-19) pandemic. This reduced the time available for Healthwatch to conduct any
patient engagement work and the restrictions of infection-control measures also meant that
our usual activities such as visiting and talking to patients in hospital have not been possible.
At the same time, the service has experienced lower than usual demand attributed to
concerns that patients may have around contracting COVID-19. At the time Healthwatch in
Sussex conducted our patient engagement (1st -28th September), demand was down by
approximately one third. The 130 responses we achieved to this current engagement were
also lower than our engagement in 2017 (218 total responses) and 2016 (186 total responses).
In Sussex report on patient experiences 6 | P a g e
Headline findings
The people who responded to our questionnaire
30 patients or passengers of the service, or their representatives,
responded to the Healthwatch in Sussex questionnaire. The location of
respondents varied across the three Healthwatch areas as follows:
• East Sussex: 65 respondents, representing 50% of the total sample.
• West Sussex: 40 respondents, representing 31% of the total sample.
• Brighton and Hove: 23 respondents, representing 17.5% of the total sample.
• 2 (1.5%) respondents did not identify which Healthwatch area they were from.
These results partly reflect data supplied by the CCGs to Healthwatch which indicates that
the known split for the service per CCG area is: 13% Brighton & Hove 43% East Sussex; and 44%
West Sussex.
The response rates for each area have been compared to those achieved in 2017:
• A comparable response rate was achieved in 2020 for Brighton and Hove (29 in 2017).
• The same number of responses were achieved in West Sussex (40).
• The response rate in East Sussex in 2020 was around one third lower than in 2017 (99).
In 2020:
• 119 respondents provided their gender, of which 54% identified as female (n64/119) and
45% male (n54/119). One person selected ‘Other’ to describe their gender.
• 108 respondents provided their age. 52% of these respondents were aged 65 and over
(n56/108). The ages of respondents ranged from 9-90 and the average (mean) age was
65.5.
• 84% (n95/113) of respondents who provided the information said that they were ‘White
British’. In 2020, we reached more people who identified as Black, Asian or being from a
minority ethnic group (BAME) (11%, n12/113), increasing 6 percentage points on 2017
levels.
• 89% (n103/116) of respondents identified themselves as having a long-standing health
problem or disability (14 respondents elected not to answer). In 2017, 57% (n89) of
respondents indicated that they were ‘disabled in some capacity’.
• 7% (n9/125) of respondents identified themselves as being a carer for someone else.
Who used the service?
We asked people to tell us why they had used the service, and allowed them to select from
multiple options (meaning that the total number of responses is greater than 130):
• 65 respondents to our survey indicated that they had used the service to attend hospital
for renal dialysis treatment. This represented 50% of the 130 individuals who responded to
our questionnaire.
• 37 respondents told us that they had used the service during the first COVID-19 lockdown
period (23rd March - 4th July 2020) which represented 28.5% of the 130 individuals who
responded to our questionnaire.
Patient Transport Services: a Healthwatch
In Sussex report on patient experiences 7 | P a g e
• 31 respondents told us that they had used the service to attend just a handful of
appointments which represented 24% of the 130 individuals who responded to our
questionnaire. This category of passenger may have used the service just once or a few
times but would not be classified as being regular users of the service.
• 24 passengers told us that they had used the service to attend other types of regular
appointments (non-renal) which represented 18.5% of the 130 individuals who responded to
our questionnaire.
• 21 passengers indicated that they needed a vehicle that could accommodate a wheelchair
to help them get to appointments which represented 16% of the 130 individuals who
responded to our questionnaire.
• Small numbers of passengers provided ‘other’ reasons for having used the service such as
for cancer treatment (three passengers); following hospital discharge (two passengers); or
people who said they needed support to travel to an appointment (four passengers).
• Five (4%) passengers who completed our survey said that they had applied for the service
but had been told they did not qualify.
Why do people use the service?
We asked people to tell us which locations (hospitals or clinics) the service had taken them
to, and these were as follows:
• Renal dialysis passengers were transported to 6 separate locations. Most passengers were
taken to the Sussex Kidney Unit, Royal Sussex County Hospital - 32 passengers, representing
49% of all renal dialysis patients who responded to the questionnaire.
• All other categories of passenger (i.e., non-renal) were transported to 24 separate
locations. Two hospitals in East Sussex were attended by a majority of these passengers –
the Conquest Hospital in Hastings (11), and Eastbourne District General Hospital (8).
• 11 passengers indicated that they
had attended more than one
location using the service.
• Five passengers from the Sussex
region told us that they had been
transported by the service to
hospitals outside of the area i.e.,
to hospitals in London,
Southampton, and Kent.
Over half of passengers (57%, n71/125) who completed our questionnaire indicated that they
had been using the service for 12 months or more. Of these 71 people, 41 (58%) passengers
were renal dialysis patients, 20 (28%) passengers indicated that they had used the service for
12 months or more to attend a handful of appointments, 15 (21%) passengers were other
categories of regular users, and 11 (15.5%) were wheelchair passengers.3
3 Respondents could select from multiple options to describe why they used the service. %s are based on the number of people who chose each option and so add up to more than 100%
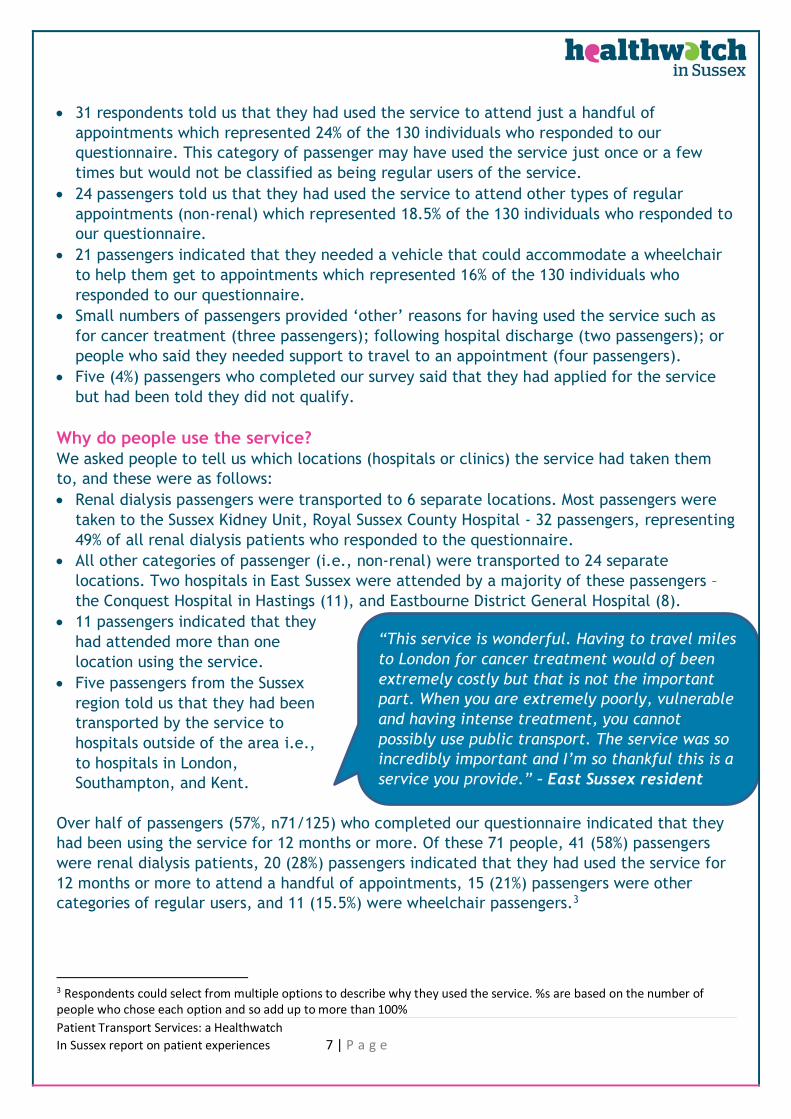
“This service is wonderful. Having to travel miles
to London for cancer treatment would of been
extremely costly but that is not the important
part. When you are extremely poorly, vulnerable
and having intense treatment, you cannot
possibly use public transport. The service was so
incredibly important and I’m so thankful this is a
service you provide.” – East Sussex resident
Patient Transport Services: a Healthwatch
In Sussex report on patient experiences 8 | P a g e
What elements of the service are working well?
Satisfaction with the service
Overall satisfaction with the service in 2020 is high at 78.5%. This
reflects the views of people who said that they were ‘very satisfied’
or ‘satisfied’ with it.
Overall, 86% of people who had used the service in 2020 would
recommend family and friends to apply for it. This is 6 percentage points
higher than in 2017 levels (80%).
Passengers from West Sussex recorded the highest levels of satisfaction at 95% with the
service and were the most likely to recommend it at 97.5%. Both of these levels/ratings are
higher than those recorded by residents in November/December 2017, which were 89% and
88% respectively. No passengers selected the ‘very unlikely’ to recommend rating, and only
one passenger selected the ‘very dissatisfied’ rating.
Passengers from East Sussex recorded 75% satisfaction levels with the service. There was a
three-percentage point increase in the number of passengers who would recommend the
service, up to 86%. Very low proportions of passengers chose either ‘very dissatisfied’ or ‘very
unlikely’ to recommend ratings.
(Passengers from Brighton and Hove recorded low satisfaction levels and recommendation
ratings, which are discussed in the next section).
The application process
Over 70% of people said that they were satisfied with all aspects their phone applications,
and 83% said that the process of applying for the service was easy.
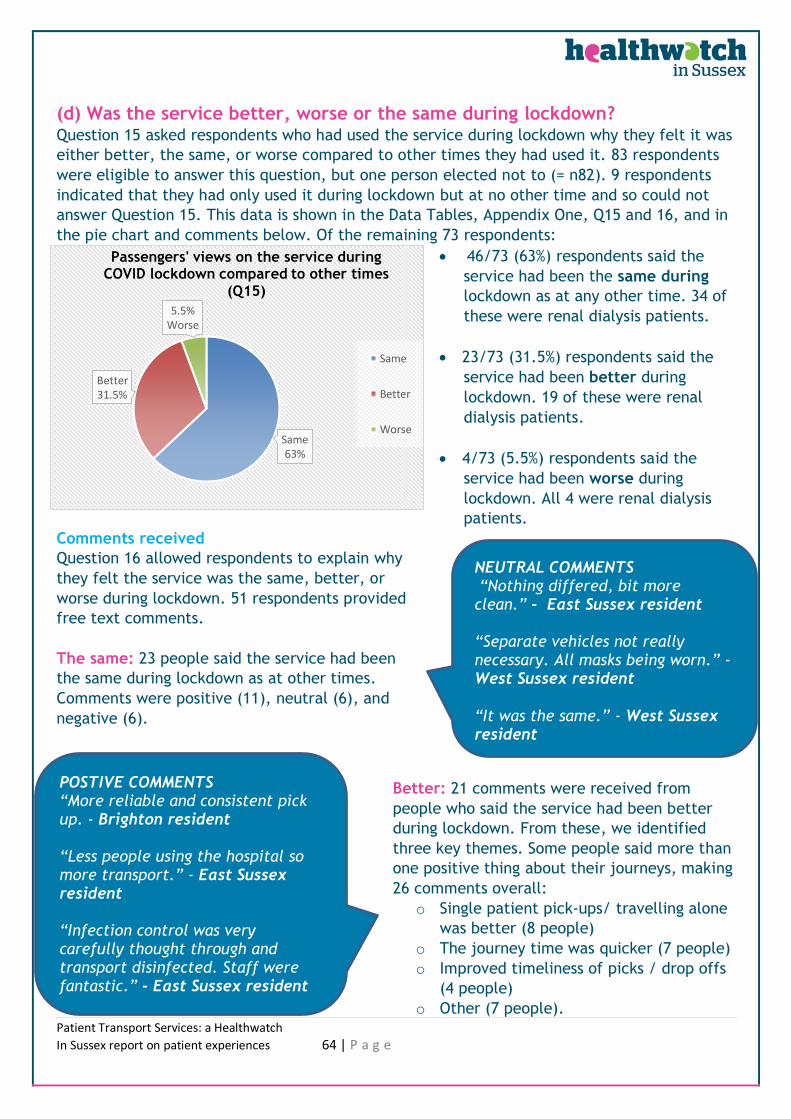
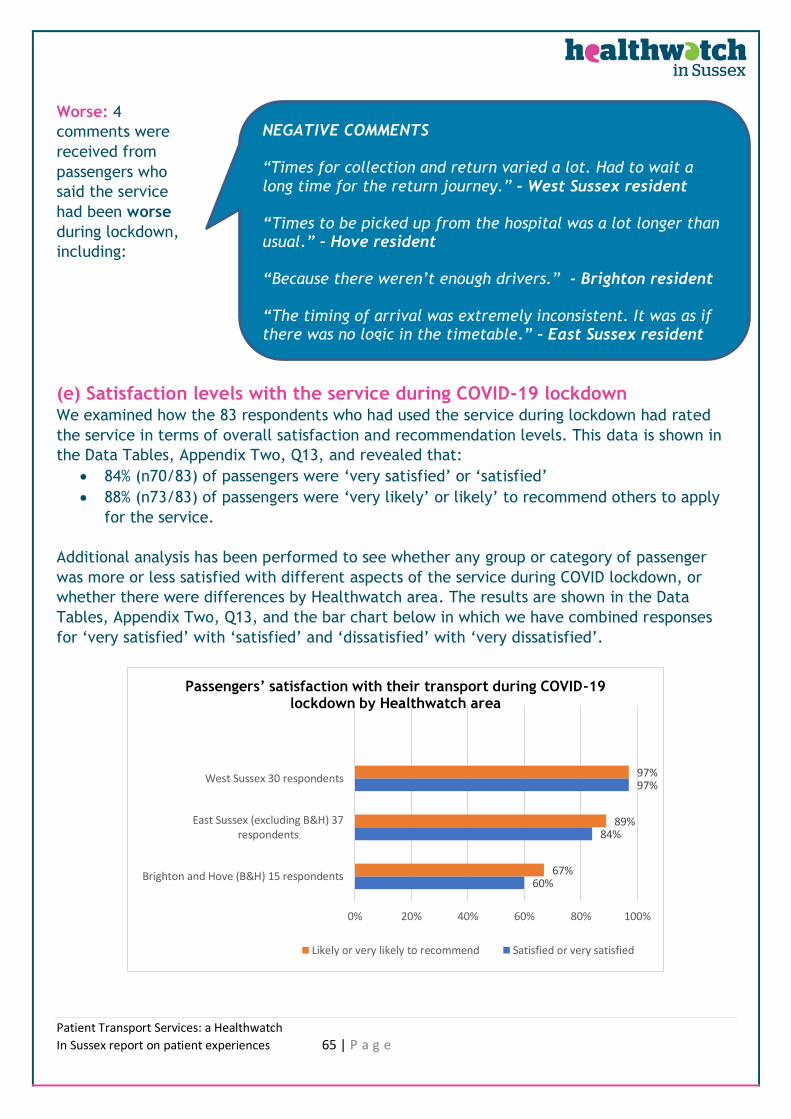
The service during the first COVID lockdown period
94.5% of people said the service had been the same or better during
the first lockdown period as at other times.
84% of people who had used the service during the first lockdown were
‘very satisfied’ or ‘satisfied’ with it, and 88% were ‘very likely’ or
likely’ to recommend others to apply for the service. These levels are
higher than the overall satisfaction levels and recommendation ratings
with the service which are 78.5% and 86% respectively.
Over 90% of passengers said that they were satisfied with the following four aspects of their
journeys made during the first lockdown period: social distancing in transport, the ease of
communicating with staff who were wearing Personal Protective Equipment (PPE), having
access to PPE whilst travelling in vehicles, and the cleanliness of transport.
“The service that I have received has been excellent. Friendly,
caring people who make my time with them feel special.” – East Sussex resident
“Fantastic service
friendly; infection
control taken very
seriously; keep up
the good work -
fantastic.” - East
Sussex resident
Patient Transport Services: a Healthwatch
In Sussex report on patient experiences 9 | P a g e
Over 80% of passengers said that they were satisfied with the following four elements of their
journeys made during the first lockdown: the amount of time they spent travelling in
vehicles, the communications they received to arrange their transport, the timeliness of their
pick-ups from home, and the ease of contacting the call centre.
Passengers’ experiences of using the service
Over 80% of passengers told us that they had ‘never’, or ‘rarely’ experienced any problems
with the following five aspects of their journeys: having to make their own way to hospital
due to transport delays (91%), same day cancellations of their journeys (86%), missing
appointments due to delays or changes with their transport (81.5%), having to make their own
way home due to transport delays (81%), or longer journey times to hospital than expected
(80%).
Additionally, 80% or more of passengers indicated that they had
‘never’ or ‘rarely’ experienced any concerns or problems with the
following five aspects of their journeys: travelling with others where
this was not appropriate (86%), travelling alone without their carer or
other support (88%), drivers appearing untrained in their condition
(86%), being unable to take essential belongings with them in vehicles
(95%), and transport being inappropriate for their needs (87%).
What elements of the service are not working as well?
Satisfaction with the service
Overall passenger satisfaction levels with the service have fallen 6.5
percentage points compared with levels recorded by Healthwatch in Sussex
in November/December 2017 (from 85% to 78.5%).
Satisfaction levels and recommendation ratings recorded during our engagement (78.5% and
86%) are lower than the CCG’s own data that was shared with Healthwatch in early
September 2020, which reported 88% satisfaction and 94% recommendation levels (these are
results from 416 people in Sussex who were surveyed by the CCG during 2019/20).
Passengers from Brighton and Hove and East Sussex recorded poorer satisfaction levels and
recommendation ratings in 2020 than people from West Sussex:
• Residents from Brighton and Hove recorded the lowest levels of satisfaction with the
service in 2020, which at 56.5% is a 27.5 percentage point decrease on November/
December 2017 levels. They were also the least likely to recommend the service, down to
64% compared to the 76% seen in November/December 2017.
• Passengers from East Sussex recorded a 12-percentage point drop in satisfaction levels,
down from the 87% seen in November/December 2017. A quarter of passengers said they
were ‘dissatisfied’ or ‘very dissatisfied’, whilst 14% said they were ‘unlikely’ or ‘very
unlikely’ to recommend the service.
“Have not had any
experiences which
have caused issue. I
have received an
excellent service for
which I am
grateful“ -East
Sussex resident
Patient Transport Services: a Healthwatch
In Sussex report on patient experiences 10 | P a g e
The application process
Nearly a third of all passengers (28%) said they were not confident that their call handler had
fully taken their personal needs into account when arranging their transport.
Nearly a quarter (24%) of people told us that they had found it difficult to get through to the
call centre on the phone.
Over a fifth (21%) of people said that they did not receive a clear explanation of how the
service worked from the call handler.
Passengers told us they were not always given information about the service. 55% of
passengers who said that someone else had applied for transport on their behalf told us that
they were not given any information by the person who arranged it for them (who were
mostly hospital staff).
The service during the first COVID lockdown period
Passengers from Brighton and Hove who had used the service during the first lockdown were
less likely to recommend the service (67%) or be satisfied with it (60%) compared to residents
from East Sussex (89% and 84%) and West Sussex (97% for both).
Two aspects of the service which did not work as well during the first lockdown were:
notifications being sent to passengers to inform them of any delays or changes to their
schedule journeys (only 62% of passengers were satisfied with this aspect), and the timeliness
of transport when being picked up from hospital (just 56% of passengers were satisfied with
this aspect). Renal patients and wheelchair passengers were most likely to be dissatisfied
with the timeliness of their pickups from hospital. Renal dialysis patients, and other regular
(non-renal) passengers of the service were more likely to be dissatisfied with any notifications
they had received about changes to their journeys.
Passengers’ experiences of using the service
59% of all passengers said they had experienced delays, changes, or problems (‘issues’) with
their transport and/or journeys made using the service. 44% said they had experienced
between 2-4 issues, and 23% experienced between 5-9 issues. Residents from Brighton and
Hove experienced a greater number of issues compared
to residents from East Sussex or West Sussex.
68% of all passengers reported experiencing delays
in being picked up from hospital.
Over one third of all passengers experienced changes
to their scheduled vehicle (38%), delayed pick ups
from home (33%), or longer journey times travelling
home than expected (31.5%).
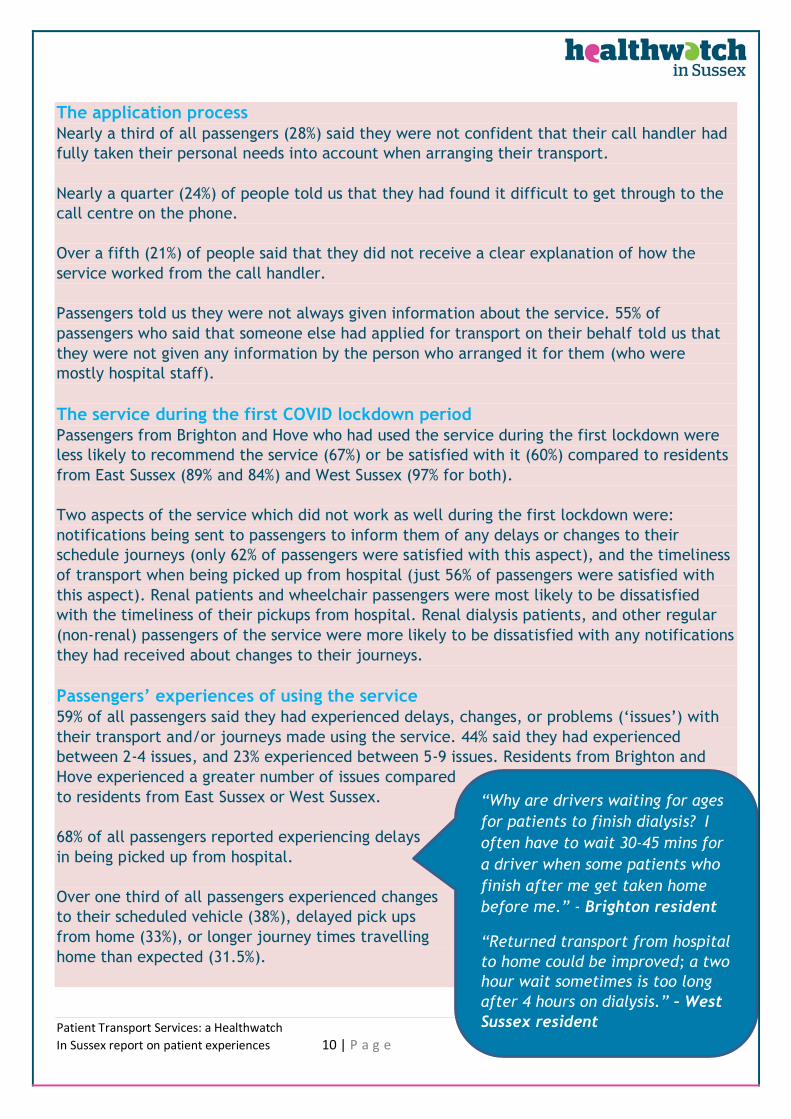
“Why are drivers waiting for ages
for patients to finish dialysis? I
often have to wait 30-45 mins for
a driver when some patients who
finish after me get taken home
before me.” - Brighton resident
“Returned transport from hospital
to home could be improved; a two
hour wait sometimes is too long
after 4 hours on dialysis.” – West
Sussex resident
Patient Transport Services: a Healthwatch
In Sussex report on patient experiences 11 | P a g e
High proportions of residents from Brighton & Hove and East Sussex reported experiencing
issues ‘often’ or ‘very often’ with ‘changes to scheduled vehicles’; whilst a high proportion of
residents from Brighton & Hove reported experiencing ‘longer journey times travelling home
than expected’ ‘often’ or ‘very often’.
A quarter of all passengers (26%) reported experiencing difficulties finding out the
whereabouts of their transport. This problem affected residents from Brighton & Hove and
East Sussex more than those from West Sussex.
Renal patients were the group most likely to report experiencing delays in being picked up
from home; delays in being picked up from hospital; changes to their scheduled vehicles and
having to make their own way home due to transport delays.
10% or more of all respondents indicated that they had
experienced concerns or problems with travelling with
others where this was not appropriate for them (14%),
travelling alone without their carer/other support (12%),
drivers appearing untrained to manage their condition (14.5%),
or transport being inappropriate for their needs (13%).
55 passengers said that there had been multiple impacts
for them caused by problems with either their transport or
journeys made using the service. 46 (84%) had experienced
anxiety or stress, 19 (34.5%) had missed meals, 13 (23.5%)
had incurred a financial cost, 9 (16%) missed medication and
7 (13%) had missed their carer.
Key improvements and future changes to the service
that passengers would like to see.
What is important to patients/passengers
Over 80% of all passengers indicated that the following aspects of a
patient transport service are important to them:
- ‘to be notified of changes or delays to my journeys’ (95%).
- ‘to be given an exact time for when my vehicle will be arriving’ (91%).
- ‘to be able to easily amend my booking’ (86%).
- ‘to speak with someone at any time to check where my vehicle is’ (85%).
- ‘to arrive at hospital no more than 30 minutes early for my appointment’ (80.5%).
- ‘to arrive home within 30 minutes of my allocate time’ (80%).
Renal patients said that the following aspects were important to them: ‘to be given an exact
time for when my vehicle will be arriving’ (92%), and to ‘arrive home within 30 minutes of
my allocated time’ (88%).
“It would be helpful if the
coordinators read the
patient’s notes before they
send the vehicle, so they
get the right vehicle for the
right job.” – West Sussex
resident
“I had to miss 2
appointments due to being
send the wrong transport.”
East Sussex resident
Patient Transport Services: a Healthwatch
In Sussex report on patient experiences 12 | P a g e
Over 85% wheelchair passengers indicated that the following were important to them:
- ‘to arrive home within 30 minutes of my allocated time’.
- ‘to arrive at hospital within 30 minutes of my allocated time’.
- ‘for my carer/support person to act on my behalf’.
- ‘to speak with someone at any time to check where my vehicle is’
92% of regular (non-renal) passengers said that ‘to be given an exact time for when my
vehicle will be arriving’ was important to them.
84% of all passengers who used the service just a handful of times to get to appointments said
that the ability to ‘easily amend their booking’ was important to them.
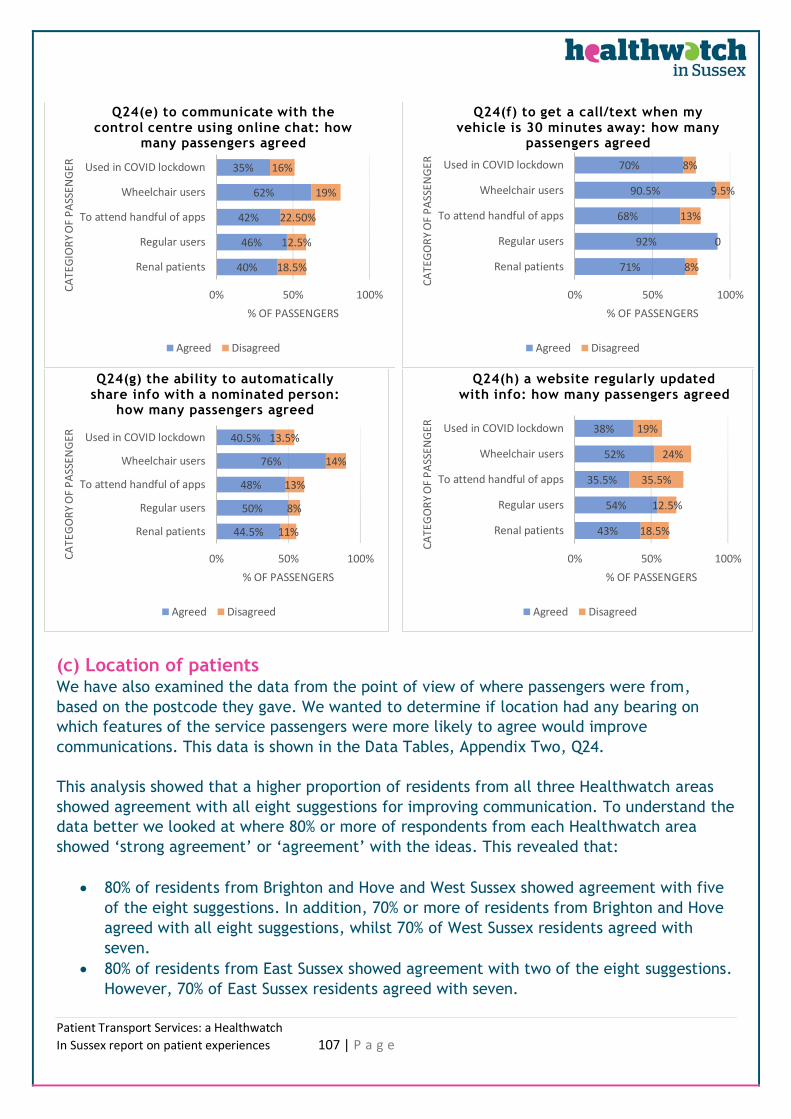
The future of the service
Overall, 50% or more of all passengers agreed that the eight Healthwatch suggestions
proposed on the questionnaire would help to improve communications between the provider
and passengers.
79% of all passengers indicated that it would improve
communications ‘to receive a text or call telling
me my vehicle is nearby (up to 30 minutes away)’.
76% of wheelchair passengers agreed that ‘The option of
having information shared automatically with a
nominated carer, friend or relative’ would improve
communication between the provider and passengers.
75% of all passengers said that they were ‘very likely’ or ‘likely’ to use ‘a telephone call
centre service with extended operating hours (open longer than 9am–5pm)’, but 100% of
wheelchair passengers and 80% of renal patients said they would use this feature.
Over 60% of all passengers said that it would improve communications ‘to have an online
account facility which allows me (or a person I nominate) to amend/cancel my bookings’
(63%) and ‘a mobile phone app which allows me to track the whereabouts of vehicles’
(61.5%).
61% of all passengers would use ‘a step-by-step ‘how to’ guide to help them to apply for the
service’.
Between 10% - 30% of all passengers indicated that they were ‘very likely’ or ‘likely’ to use
the following features if they were available: information about the service that is available
in Easyread format, translated into languages other than English, or signed (BSL).
In addition, over 80% of renal patients said that they were ‘very likely’ or ‘likely’ to use ‘a
dedicated service specifically for renal patients, including specialist call centre staff’, and
66% of renal patients indicated that having ‘a nominated driver’ was important to them.
“It could be a very good service,
and sometimes it works well, but a
lot of the time the transport is late
and you have no idea what's
happening and how long you are
going to wait. It can’t be that hard
to keep people informed, can it?” –
East Sussex resident
Patient Transport Services: a Healthwatch
In Sussex report on patient experiences 13 | P a g e
2. Conclusions and Healthwatch in Sussex recommendations
Conclusions
The data we have collected demonstrates that the current provider, South Central Ambulance
Services (SCAS), has delivered a strong performance since November/December 2017, which
was the last time that Healthwatch in Sussex undertook patient engagement on transport
services. In 2020, a large proportion of passengers told us that they were satisfied with ten
aspects of the service that we asked them to consider. Most passengers would also
recommend it to family and friends. Patient feedback on the service during the first COVID-19
lockdown period was positive, and this is testimony to how well the service, and staff,
adapted to this unprecedented challenge.
In 2020, some of our key findings and recommendations remain unchanged from those we
presented to Commissioners and the current provider in April 2018 (following our
November/December 2017 patient engagement), whilst new areas have been identified
through our most recent survey of patients which require action.
In 2017-18, our key findings were:
• Poor pick-up times affected some patients.
• Renal patients continued to experience delays and uncertainties around pick-up times.
• Hospital staff faced long delays in getting through to the control centre.
• A need to train dispatch staff to understand local geography to improve the scheduling of
transport.
• Concerns were raised by wheelchair passengers regarding the suitability of some vehicles.
And we recommended in 2017-18 that the provider should:
• Create a dedicated team to support renal patients.
• Improve the experience for patients and staff who try to access the contact centre.
• Identify actions to improve the timeliness and reliability of the service over the weekend.
• Increase the use of patient forums.
• Deliver staff training to ensure the needs of mobility impaired patients were understood.
• In addition, we said that patient experience should be at the centre of this commissioned
service and form an integral part of the operational delivery.
Our latest engagement has revealed that several of the above recommendations have not
been implemented or fully corrected by the current provider:
• A dedicated service for renal patients has not been established.
• Passengers continue to experience poorer pick-ups from hospital.
• Some passengers report that they are still experiencing delays in getting through to the
control centre (although numbers are now lower).
• Some patients continue to report longer journey times than expected which indicates that
there is further room for improvement around the planning of journeys.
• Whilst patient forums were established by the provider, they have not been actively
continued, and we understand that it was not easy for people to attend these.
Patient Transport Services: a Healthwatch
In Sussex report on patient experiences 14 | P a g e
In 2020, overall satisfaction with the service remains high but levels are slightly lower than
those recorded by Healthwatch in November/December 2017. As in previous years,
satisfaction levels continue to vary by Healthwatch area but these are more marked in 2020.
The data we have collected indicates that West Sussex residents are experiencing fewer
disruptions to their transport or journeys compared to residents from East Sussex and Brighton
and Hove (the latter recorded their lowest satisfaction levels since 2016). In addition, high
proportions of residents from Brighton & Hove are experiencing issues with longer journey
times travelling home than expected which implies that better geographical planning of
transport would benefit them.
Renal patients continued to tell us that they experience problems with their transport, and
they remain one of the most affected groups of passengers, but we are pleased to see that
their satisfaction levels with the service are now much higher than in previous years, and on a
par with other passengers. Wheelchair passengers reported fewer issues with the suitability of
their transport which is also an improvement. However, all categories of passenger reported
experiencing issues or problems with either their journeys or transport.
A key difference with our Healthwatch in Sussex engagement activity conducted in 2020,
compared to other years, is that we asked patients and passengers to tell us what aspects of a
transport service are important to them. We also asked them to tell us what future changes
to the service they would like to see. This has identified several areas which commissioners
should contract the new provider to deliver. These are:
• The service should improve its communications.
The data we have collected supports the need for clearer information about the
service, and how to apply for it, and that this should be made available in a range of
accessible formats. Passengers have also indicated that they want to see a variety of
technological innovations to improve communications, but the provider must also
maintain more traditional methods for those who are less comfortable using
technology. This links to a recent report by Healthwatch in Sussex ‘Accessing health
and care services – findings during the Coronavirus pandemic’ which focused on
establishing people’s experiences of digital or remote consultations during the COVID-
19 period and crucially, their expectations and preferences for service redesign and
delivery in the restore and recovery stages post COVID. Our report found:
“There is a need to ensure that communication is in appropriate formats, is
received and understood.”
And that services should:
“Familiarise some older people, in particular, in how to use video and online
services. Promote videos or other media to show the processes involved in having
In Sussex report on patient experiences 24 | P a g e
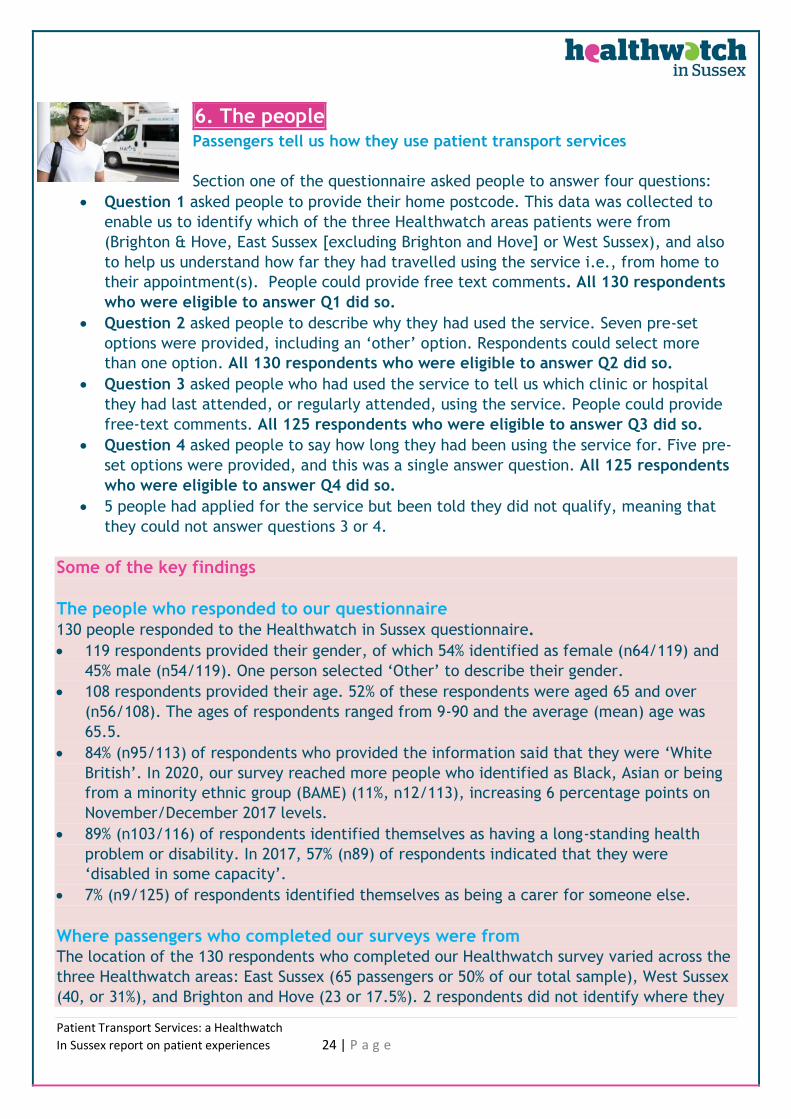
6. The people Passengers tell us how they use patient transport services
Section one of the questionnaire asked people to answer four questions:
• Question 1 asked people to provide their home postcode. This data was collected to
enable us to identify which of the three Healthwatch areas patients were from
(Brighton & Hove, East Sussex [excluding Brighton and Hove] or West Sussex), and also
to help us understand how far they had travelled using the service i.e., from home to
their appointment(s). People could provide free text comments. All 130 respondents
who were eligible to answer Q1 did so.
• Question 2 asked people to describe why they had used the service. Seven pre-set
options were provided, including an ‘other’ option. Respondents could select more
than one option. All 130 respondents who were eligible to answer Q2 did so.
• Question 3 asked people who had used the service to tell us which clinic or hospital
they had last attended, or regularly attended, using the service. People could provide
free-text comments. All 125 respondents who were eligible to answer Q3 did so.
• Question 4 asked people to say how long they had been using the service for. Five pre-
set options were provided, and this was a single answer question. All 125 respondents
who were eligible to answer Q4 did so.
• 5 people had applied for the service but been told they did not qualify, meaning that
they could not answer questions 3 or 4.
Some of the key findings
The people who responded to our questionnaire
130 people responded to the Healthwatch in Sussex questionnaire.
• 119 respondents provided their gender, of which 54% identified as female (n64/119) and
45% male (n54/119). One person selected ‘Other’ to describe their gender.
• 108 respondents provided their age. 52% of these respondents were aged 65 and over
(n56/108). The ages of respondents ranged from 9-90 and the average (mean) age was
65.5.
• 84% (n95/113) of respondents who provided the information said that they were ‘White
British’. In 2020, our survey reached more people who identified as Black, Asian or being
from a minority ethnic group (BAME) (11%, n12/113), increasing 6 percentage points on
November/December 2017 levels.
• 89% (n103/116) of respondents identified themselves as having a long-standing health
problem or disability. In 2017, 57% (n89) of respondents indicated that they were
‘disabled in some capacity’.
• 7% (n9/125) of respondents identified themselves as being a carer for someone else.
Where passengers who completed our surveys were from The location of the 130 respondents who completed our Healthwatch survey varied across the
three Healthwatch areas: East Sussex (65 passengers or 50% of our total sample), West Sussex
(40, or 31%), and Brighton and Hove (23 or 17.5%). 2 respondents did not identify where they
Patient Transport Services: a Healthwatch
In Sussex report on patient experiences 25 | P a g e
were from. These results partly reflect similar data supplied by the CCGs to Healthwatch
which reveals that the known split for the service per CCG area is: 13% Brighton & Hove 43%
East Sussex; and 44% West Sussex.
Why people used the service
130 people responded to this question. As people could select multiple options then we
received a total of 197 answers to this question.
• 65 respondents to our survey indicated that they had used the service to attend hospital
for renal dialysis treatment. This represented 50% of the total sample (n65/130).
• 37 respondents told us that they had used the service during the first COVID-19 lockdown
period (23rd March – 4th July 2020, 28.5%).
• 31 respondents said they had used the service to attend just a handful of appointments
(24%) i.e., these were people who did not use the service regularly.
• 24 respondents had used the service to attend other types of regular appointments (non-
renal, 18.5%, n24).
• Smaller numbers of passengers had used the service for ‘other’ reasons which included:
attending hospital for cancer treatment (3 passengers); to be taken home after being
discharged from hospital (2 passengers); or people who said they needed support to travel
to an appointment (4 passengers).
• Five respondents who completed our survey said that they had applied for the service but
had been told they did not qualify (4%).
Hospitals or clinics people were transported to by the service
125 respondents were eligible to answer this question (the 5 people who had been told that
they did not qualify for the service were not eligible to answer). Respondents told us that
they had been transported by the service to the following locations:
• Renal dialysis passengers were transported to six different locations.
• All other categories of passenger (i.e., non-renal patients) were transported to 24
different locations.
• 11 passengers had attended more than one location using the service.
• Five passengers from the Sussex area were transported to hospitals outside of the county
i.e., to hospitals in London, Southampton, and Kent.
How long people have been using the service
• 125 respondents were eligible to answer this question. 57% (n71/125) of passengers
indicated that they had been using the service for 12 months or more.
• 15 respondents each (12%) had been using the service for either 1-3 months, or 6-12
months.
• 13 respondents had been using the service for less than a month (10.5%), whilst 11
respondents had been using it for 3-6 months (9%).
Patient Transport Services: a Healthwatch
In Sussex report on patient experiences 26 | P a g e
The people: results in detail
(a) Where passengers who completed our survey were from (responses per
Healthwatch area) Respondents were asked to provide us with their postcode, and 128 did so. We used postcodes
to determine which Healthwatch area passengers were from. The location of respondents
varied across the three Healthwatch areas as follows:
• East Sussex (50%, n65/130 passengers).
• West Sussex (31%, n40/130 passengers).
• Brighton and Hove (17.5%, n2/130 passengers).
• 2 respondents (1.5%) did not identify where they were from.
We have compared the response rates achieved in 2020 with those from November/December
2017, which was the last time that Healthwatch in Sussex undertook a patient survey on
patient transport. Similar response rates were achieved in 2020 for Brighton and Hove and
West Sussex to those seen in November/December 2017 (shown in red text in the table
below). The response rate in East Sussex in 2020 was approximately one third lower than in
November/December 2017. The lower response rate in 2020 reflects the extra challenges
presented by the COVID-19 pandemic which prevented Healthwatch from visiting hospitals
and talking directly to patients, but also the lower demand for the service during the
lockdown period.
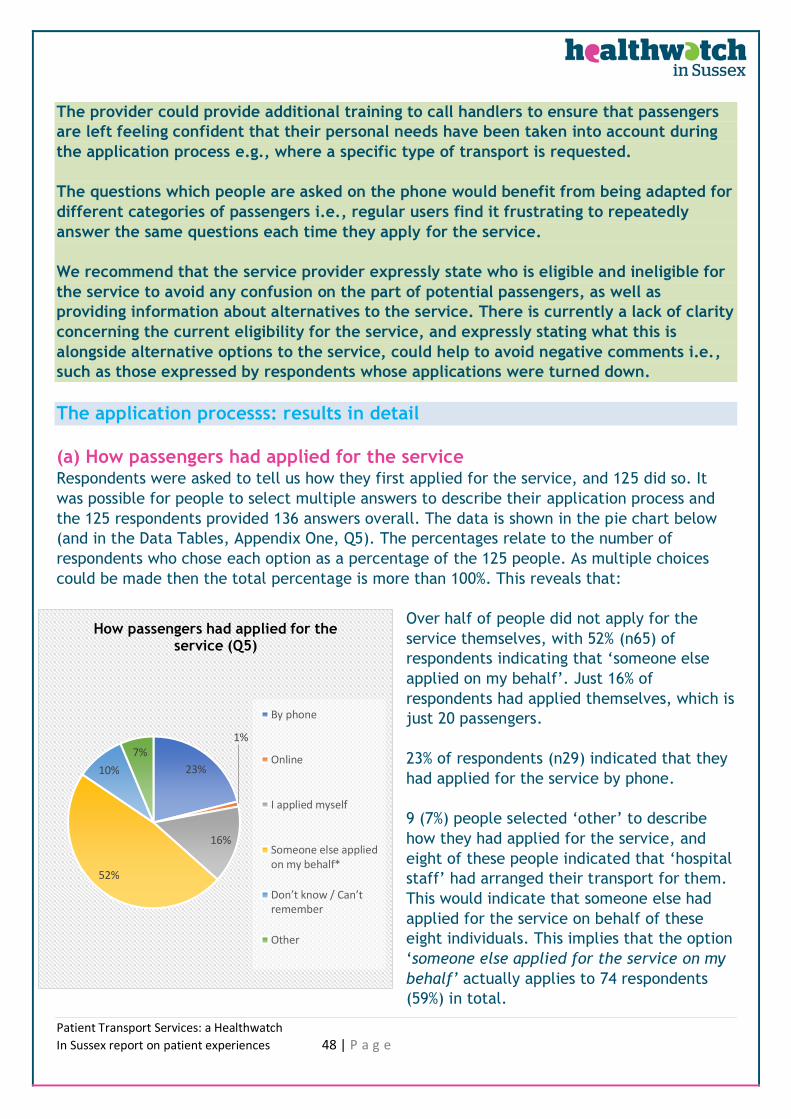
(b) Why people used the service
130 respondents told us why they had used the service. As people could select from multiple
options then we received a total of 197 answers to this question. This data is shown in the
Data Tables, Appendix One, Q2, and the pie chart below. This revealed that there were five
main categories of passenger who had used the service:
1. renal dialysis patients.
2. regular (non-renal) passengers.
3. those who had used the service to attend just a handful of appointments.
4. those who needed transport which accommodated their wheelchair (‘wheelchair
passengers’).
5. those who had used the service during the first COVID-19 lockdown (23rd March – 4th
July 2020).
Area of Sussex Number of
respondents in
2020 (and 2017)
Brighton and Hove 23 (17.5%) (29)
West Sussex 40 (31%) (40)
East Sussex 65 (50%) (99)
Unknown /other 2 (1.5%) (15)
17.5%
31%50%
1.5%
Which Healthwatch area respondents are from (Q1)
Brighton andHoveWest Sussex
East Sussex
Unknown /other
Patient Transport Services: a Healthwatch
In Sussex report on patient experiences 27 | P a g e
We refer to these five categories of passenger throughout the remainder of the report.
In addition, some people provided ‘other’ reasons for why they had used the service, and five
people indicated that they had applied for the service but been told that they did not qualify
for it.
• 50% (n65/130) of respondents indicated that they used the service to attend hospital
for renal dialysis treatment (the option ‘To take me to my renal dialysis appointments’
represented 33% or 65 of the 197 of all responses received to Question 2).
• Similar proportions of passengers had used the service during the first COVID-19
lockdown period (28.5%, n37/130), or to attend just a handful of appointments (24%,
n31/130). The latter category of passenger may have used the service just once or a
few times but would not be classified as regular users of the service.
• A smaller proportion of passengers had used the service to attend other types of
regular (non-renal) appointments (18.5%, n24/130), and for ‘other’ reasons such as to
attend hospital for regular cancer treatment (3 passengers).
• 16% (n21/130) of respondents indicated that they needed a vehicle that could
accommodate a wheelchair to help them get to appointments.
• Two passengers had used the service to get home after being discharged from hospital,
and four passengers told us that they had used the service as they needed some form
of support to travel to a medical appointment.
• Five passengers who completed our survey said that they had applied for the service
but had been told they did not qualify for it (4%).
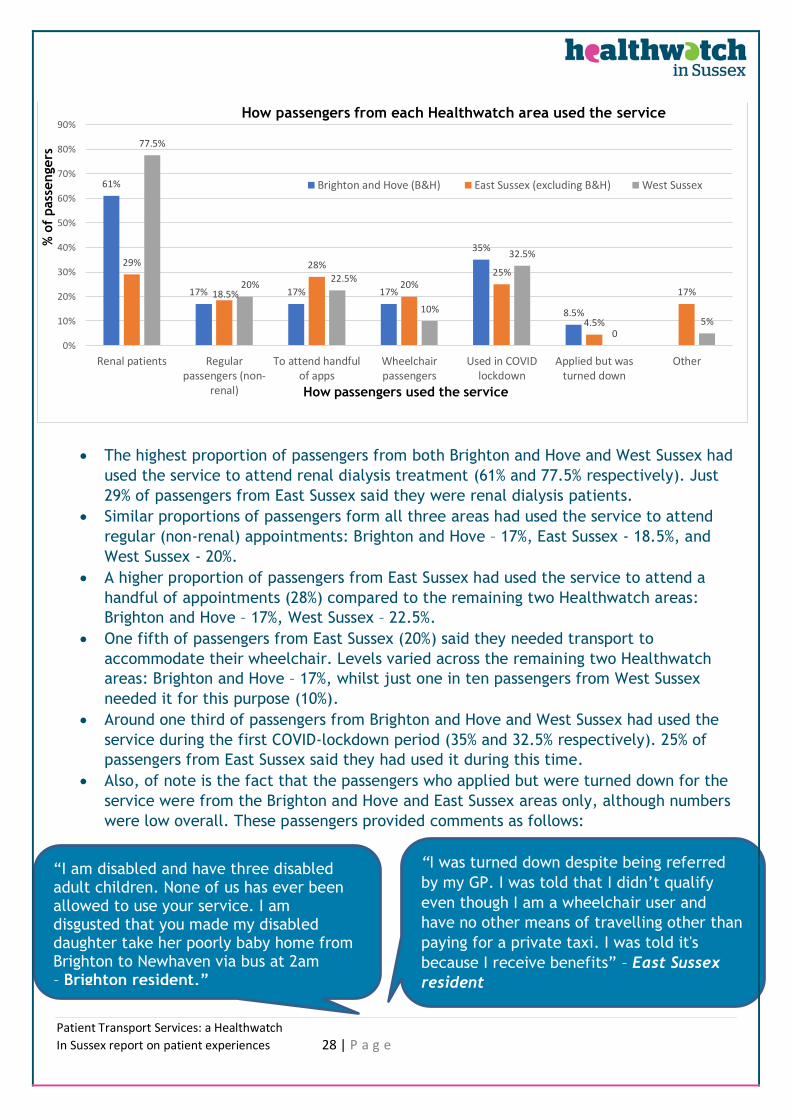
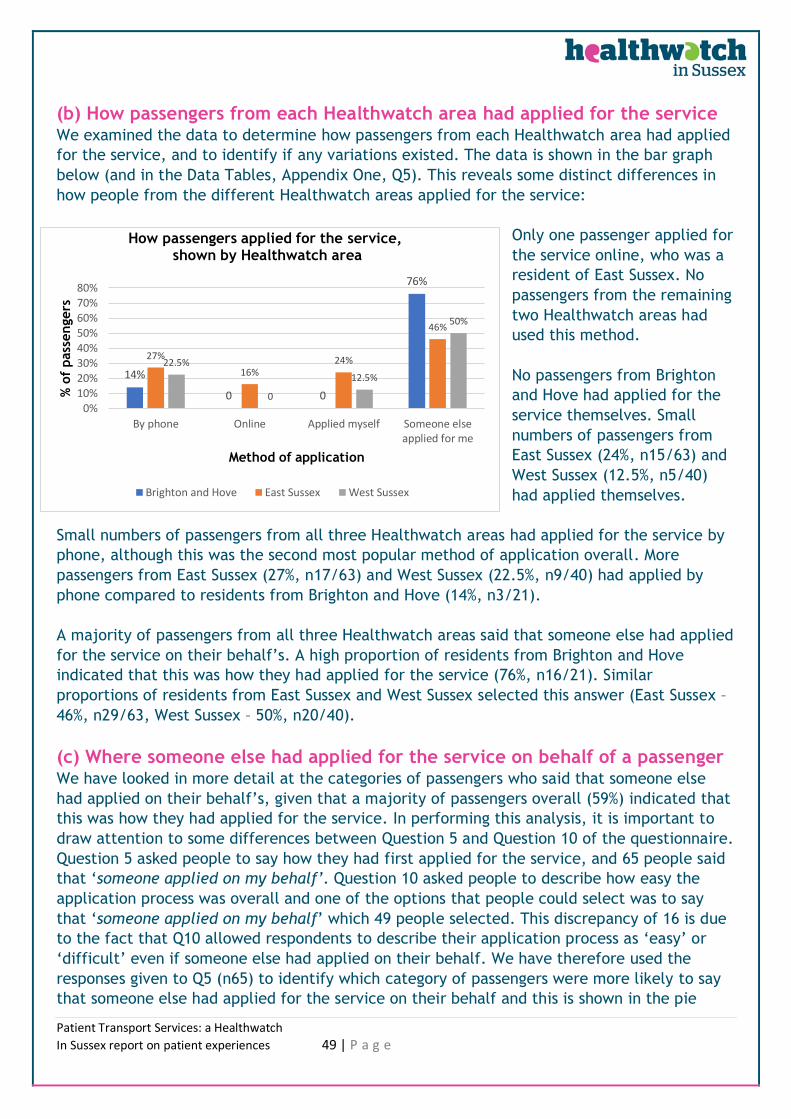
We examined the data further to determine why passengers from each Healthwatch area had
used the service, and to identify if any variations existed. The data is shown in the bar graph
below (and in the Data Tables, Appendix One, Q2) and reveals that the service provided
transport to all five categories of passenger from each area, but in differing proportions. The
principal difference is that a majority of passengers from both Brighton and Hove and West
Sussex relied on the service to help them get to their renal dialysis treatment, whilst far
fewer passengers from East Sussex had used it for this purpose.
50%
18.5%
24%
16.0%
28.5%
4%11%
Why passengers use patient transport (Q2)
Renal patients
Regular passengers (non-renal)
To attend handful of apps
Wheelchair passengers
Used in COVID lockdown
Applied but was turned down (5 people)
Other (14 people)
Patient Transport Services: a Healthwatch
In Sussex report on patient experiences 28 | P a g e
• The highest proportion of passengers from both Brighton and Hove and West Sussex had
used the service to attend renal dialysis treatment (61% and 77.5% respectively). Just
29% of passengers from East Sussex said they were renal dialysis patients.
• Similar proportions of passengers form all three areas had used the service to attend
regular (non-renal) appointments: Brighton and Hove – 17%, East Sussex - 18.5%, and
West Sussex - 20%.
• A higher proportion of passengers from East Sussex had used the service to attend a
handful of appointments (28%) compared to the remaining two Healthwatch areas:
Brighton and Hove – 17%, West Sussex – 22.5%.
• One fifth of passengers from East Sussex (20%) said they needed transport to
accommodate their wheelchair. Levels varied across the remaining two Healthwatch
areas: Brighton and Hove – 17%, whilst just one in ten passengers from West Sussex
needed it for this purpose (10%).
• Around one third of passengers from Brighton and Hove and West Sussex had used the
service during the first COVID-lockdown period (35% and 32.5% respectively). 25% of
passengers from East Sussex said they had used it during this time.
• Also, of note is the fact that the passengers who applied but were turned down for the
service were from the Brighton and Hove and East Sussex areas only, although numbers
were low overall. These passengers provided comments as follows:
61%
17% 17% 17%
35%
8.5%
29%
18.5%
28%
20%25%
4.5%
17%
77.5%
20%22.5%
10%
32.5%
05%
0%
10%
20%
30%
40%
50%
60%
70%
80%
90%
Renal patients Regularpassengers (non-
renal)
To attend handfulof apps
Wheelchairpassengers
Used in COVIDlockdown
Applied but wasturned down
Other
% o
f pass
engers
How passengers used the service
How passengers from each Healthwatch area used the service
Brighton and Hove (B&H) East Sussex (excluding B&H) West Sussex
“I am disabled and have three disabled adult children. None of us has ever been allowed to use your service. I am disgusted that you made my disabled daughter take her poorly baby home from Brighton to Newhaven via bus at 2am – Brighton resident.”
“I was turned down despite being referred
by my GP. I was told that I didn’t qualify
even though I am a wheelchair user and
have no other means of travelling other than
paying for a private taxi. I was told it's
because I receive benefits” – East Sussex
resident
Patient Transport Services: a Healthwatch
In Sussex report on patient experiences 29 | P a g e
(c) Hospitals or clinics people were transported to by the service We examined the data to determine which hospitals or clinics passengers had been
transported to by the service. The data is shown in the Data Tables, Appendix One, Q3, and
reveals that respondents to our survey were transported to the following locations:
• Renal dialysis passengers only were transported to six different locations. 32
passengers, representing 49% of all renal dialysis patients, had attended the Sussex
Kidney Unit, Royal Sussex County Hospital in Brighton.
• All other categories of passenger were transported to 24 specific locations. The
locations attended by most passengers were two hospitals in East Sussex: Conquest
Hospital attended by 11 passengers, and the Eastbourne District General attended by 8
passengers.
In addition:
• 11 passengers had attended more than one location using the service.
• Five passengers from the Sussex area were transported to hospitals outside of the
county i.e., to hospitals in London, Southampton, and Kent.
(d) How long people have been using the service We examined the data to determine how long passengers had been using the service. The
data is shown in the bar graph below (and in the Data Tables, Appendix One, Q4). 125
respondents were eligible to provide this information and the data reveals that the largest
proportion of passengers who completed our questionnaire had been using the service for 12
months of longer (57%, n71/125). Similar proportions of passengers had been using the service
for the remaining four options:
Less than a month - 13 (10.5%) 1-3 months - 15 (12%)
3-6 months - 11 (9%) 6-12 months - 15 (12%)
We looked at the 71 respondents who had used the service for 12 months or more to identify
which category of passenger they were. Respondents could select from multiple options to
describe why they had used the service and the percentages shown below are based on the
number of people who chose each option and so add up to more than 100%:
41/71 (58%) passengers were renal dialysis patients.
20/71 (28%) passengers indicated that they had used the service for 12 months or more to attend a handful of appointments. 15/71 (21%) passengers were ‘other categories’ of regular users. 11/71 (15.5%) were wheelchair passengers.
10.5%
12%
9%
12%
57%
0.0% 10.0% 20.0% 30.0% 40.0% 50.0% 60.0%
Less than a month
1-3 months
3-6 months
6-12 months
12 months or more
% of passengers
Lenght
of
tim
e
How long passengers having been using patient transport (Q4)
Patient Transport Services: a Healthwatch
In Sussex report on patient experiences 30 | P a g e
(e) More information about the people who responded to the questionnaire The table below describes the respondents who answered our questionnaire in 2020 (the
percentages relate to the 130 respondents who completed the questionnaire). We have
included comparable data from the Healthwatch in Sussex April 2018 report in red where
known (which includes data from our patient engagement undertaken in November -
December 2017).
The location of the 130 respondents
(identified by postcode). Comparable
responses were achieved in Brighton and
Hove, and West Sussex in 2020 and 2017.
Area of Sussex Number of respondents
Brighton and Hove 23 (17.5%) (29)
West Sussex 40 (31%) (40)
East Sussex 65 (50%) (99)
Unknown /other 2 (1.5%) (15)
The gender of respondents
In 2020 more females answered our
questionnaire than any other gender. In 2017,
the opposite was seen with more males
responding.
Gender Number of respondents
Female 64 (49%) (41%)
Male 54 (41.5%) (58%)
Other 1 (1%) (1%)
Not given 11 (8.5%) (-)
The ages of respondents in 2020 ranged
from 9 to 90. The average age was 65.5
years. In both 2020 and 2017, a higher
proportion of respondents were aged over 75.
Ages Number of respondents
<18 1 (1%) (0)
18-34 4 (3%) (3%)
35-54 22 (17%) (14%)
55-64 25 (19%) (16%)
65-74 19 (14.5%) (19%)
75+ 37 (28.5%) (47%)
Not given 22 (17%) (2%)
The ethnicity of respondents
In 2020 and 2017, most respondents said that
they were ‘White British’. In 2020, we reached
more people who identified as BAME.
Ethnicity Number of respondents
White British 95 (73%) (93%)
White any other 6 (4.5%) (2.5%)
BAME (all groups) 12 (9%) (3%)
Other 0 (1.5%)
Not given 17 (13%) (-)
Respondents with a long-term health
condition, and carers
In 2020, 79% (n103) of people identified
themselves as having a long-standing health
problem or disability. In 2017, 57% (89)
respondents indicated that they were
‘disabled in some capacity’.
In 2020, 7% (n9) of people identified
themselves as being a carer.
The sexual orientation of respondents
Sexual orientation Number of
respondents
Heterosexual 100 (77%)
LGBT 6 (4.5%)
Not given 24 (18.5) No comparable data is available from 2017
In Sussex report on patient experiences 32 | P a g e
Satisfaction levels by Healthwatch area
There were wide variations in satisfaction levels recorded by passengers across Sussex. The
highest overall satisfaction levels were recorded by passengers living in West Sussex at 95%,
which is six-percentage points higher than levels recorded in November/December 2017
(89%). Only two passengers from the area were dissatisfied with the service.
Passengers from East Sussex recorded a 12-percentage point drop in satisfaction levels
(‘satisfied’ or ‘very satisfied’), down to 75% from the 87% seen in November/December 2017.
A quarter (25%) of passengers were ‘dissatisfied’ or ‘very dissatisfied’ with the service.
Passengers from Brighton and Hove recorded the lowest levels of satisfaction with the
service (‘satisfied’ or ‘very satisfied’), and at 56.5% this is a 27.5 percentage point decrease
on 2017 levels. Previous satisfaction levels recorded by respondents from Brighton and Hove
were 67% in May/June 2017, and 84% in November/December 2017. This means that current
satisfaction levels for Brighton and Hove residents are now lower than they were in 2017.
Further analysis of the results indicates that West Sussex residents were more likely to report
‘never’ or ‘rarely’ experiencing any issues with their transport to journeys, whilst residents
from East Sussex and Brighton and Hove were more likely to say that they had experienced
problems. This may explain the differences in satisfaction levels recorded across the
Healthwatch areas.
Overall recommendation ratings
128 passengers provided a recommendation rating, and overall, 86% of respondents said they
were ‘very likely’ or ‘likely’ to recommend family and friends to apply for the service. The
proportion of passengers who would recommend the service is 6 percentage points higher
than in November/December 2017 (80%). This is also higher than results recorded by
Healthwatch in May/June 2017 (77%) and 2016 (44%).
Recommendation ratings by Healthwatch area
There were variations in the recommendation ratings recorded by passengers across Sussex.
In 2020, passengers from West Sussex were the most ‘likely’ or ‘very likely’ to recommend
the service at 97.5%, which is nearly ten percentage points higher than levels recorded by
residents in November/December 2017 (88%). In 2020, 50% of residents from West Sussex
were ‘very likely’ to recommend the service which is considerably higher than the 13%
recorded in 2017.
In East Sussex, a three-percentage point increase was recorded in the number of passengers
who were ‘likely’ or ‘very likely’ to recommend the service, up from 83% in
November/December 2017 to 86% in 2020. However, a higher proportion of residents in 2020
were ‘unlikely’ or ‘very unlikely’ to recommend the service in 2020 than they were in
November/December 2017 (14% in 2020, compared to 6% in 2017 respectively).
Patient Transport Services: a Healthwatch
In Sussex report on patient experiences 33 | P a g e
In 2020, passengers from Brighton and Hove were the least likely to recommend the service,
down 12 percentage points to 64% compared to the 76% seen in November/December 2017. A
far higher proportion of residents in 2020 were ‘unlikely’ or ‘very unlikely’ to recommend the
service in 2020 than they were in November/December 2017 (36% in 2020, compared to 13% in
2017 respectively).
Passenger group satisfaction levels and recommendation ratings In 2020, and at 85%, the highest satisfaction levels were recorded by renal dialysis patients.
This is welcome news as in 2017, Healthwatch found that renal patients were less likely than
non-renal patients to be ‘very satisfied’ with the service. However, significantly lower
proportions of renal patients from Brighton and Hove were satisfied with the service at 57% or
would recommend it at 64%. This is compared with results for renal patients from East Sussex
(84% for both) and from West Sussex (97% for both).
The lowest overall satisfaction levels and recommendation ratings with the service were
recorded by passengers who described themselves as ‘regular users of the service (non-
renal)’.
Of note are the following results:
- 100% of wheelchair passengers from West Sussex residents were satisfied with the service.
- 100% of passengers who had used the service to attend a handful of appointments and
wheelchair passengers from West Sussex and Brighton and Hove would recommend the
service.
Satisfaction with the application process
Overall, 70% of those passengers who had a phone call as part of their application for the
service said they were satisfied with all aspects of their phone application. But once again,
there were variations in satisfaction levels recorded across Sussex:
• At least 80% or more of passengers from West Sussex said that they were satisfied with
all seven aspects of their phone call that we asked them to consider.
• At least 80% or more of passengers from East Sussex said that they were satisfied with
just four of the seven aspects.
• At least 80% or more of residents from Brighton and Hove were satisfied with just two
aspects of their phone call, whilst 25% of passengers from the area said that they were
dissatisfied with five aspects of their phone call.
Satisfaction with the service during the first COVID-19 lockdown period
84% of passengers who had used the service during this period were ‘very satisfied’ or
‘satisfied’, whilst 89% were ‘very likely’ or likely’ to recommend others to apply for the
service. These results are higher than the overall satisfaction levels and recommendation
ratings recorded for the service in 2020 (78.5% and 86%).
However, only 62% of passengers who had used the service during this period were satisfied
with any notifications they had received about delays or changes to their scheduled journeys,
whilst just 56% were satisfied with the timeliness of their pickups from hospital.
Patient Transport Services: a Healthwatch
In Sussex report on patient experiences 34 | P a g e
Satisfaction levels with the service: results in detail
(a) Satisfaction levels and recommendation ratings with the service overall Passengers were asked to provide a satisfaction rating for the service as a whole by choosing
from one of four options: ‘very satisfied’, ‘satisfied’, ‘dissatisfied’, and ‘very dissatisfied’.
We have concluded that satisfaction with the service is defined as people who chose either
the ‘very satisfied’ or ‘satisfied’ options.
In the same way, passengers were asked to provide a recommendation level as a whole for
the service by choosing from one of four options: ‘very likely’ to recommend, ‘likely’ to
recommend, ‘unlikely’ to recommend and ‘very unlikely’ to recommend. We have concluded
that people who would recommend the service is defined as those who chose ‘the very likely’
or ‘likely’ options.
This data is shown in the Data Tables, Appendix One and Two, Q25 and Q26, and the series of
graphs included below.
Overall satisfaction with the service
across Sussex in 2020 is high at
78.5% (n102/130)
Overall, 86% of people who had used
the service in 2020 would
recommend family and friends to
apply for it.
(b) How the results in 2020 compare with previous years
The table below shows results previously recorded by Healthwatch between 2016-2017, and
data recorded by the Clinical Commissioning Group in 2019/20. This reveals that:
• in 2020, overall patient satisfaction levels (78.5%) were 6.5 percentage points
lower than levels recorded by Healthwatch in November/December 2017 (85%).
However, they were higher than they were in May/June 2017 (75%) and considerably
higher than in 2016 (which ranged from 67% before April 2016, to just 8% between
April-July2016)
31.5%
47%
14.5%
7%
Overall satisfaction levels with the service, 2020 (Q26, % of 130 responses)
Very satisfied (41people)
Satisfied (61 people)
Dissatisfied (19 people)
Very dissatisfied (9people)
47%
39%
9%5% 1.5%
Overall recommendation ratings in 2020 (Q25, % of 128 responses)
Very likely (60 people)
Likely (50 people)
Unlikely (12 people)
Very unlikely (6 people)
No reply (2 people)
Patient Transport Services: a Healthwatch
In Sussex report on patient experiences 35 | P a g e
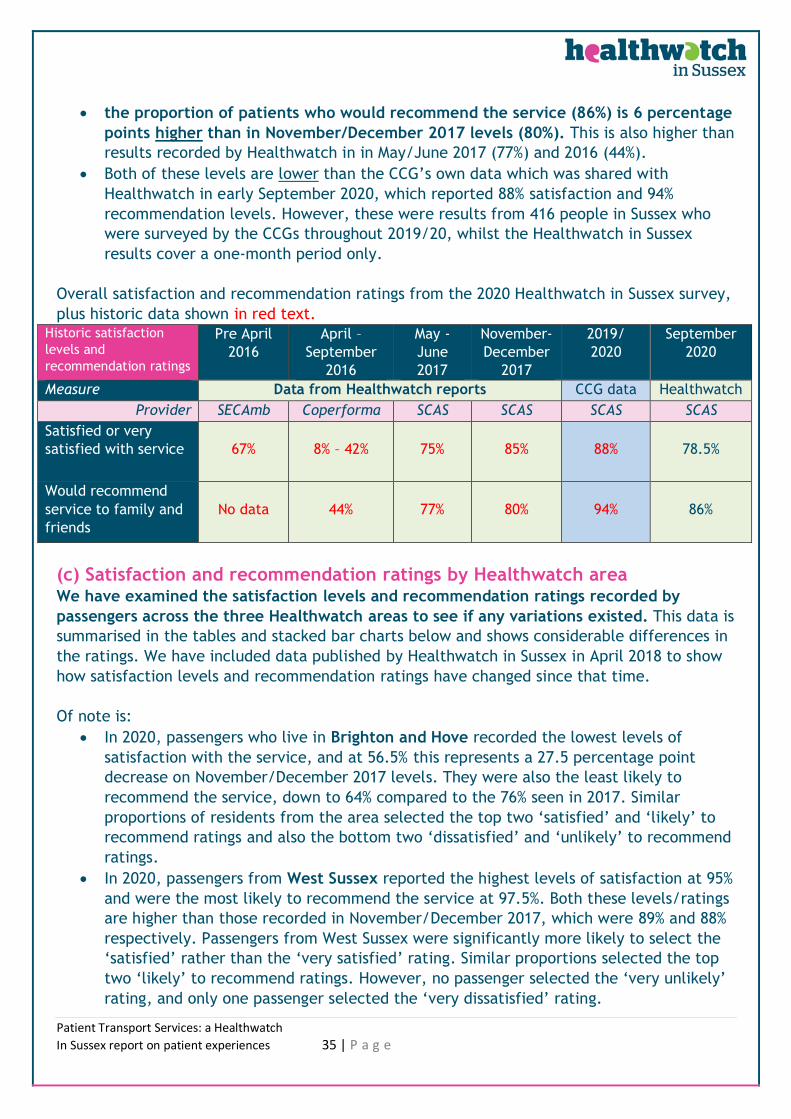
• the proportion of patients who would recommend the service (86%) is 6 percentage
points higher than in November/December 2017 levels (80%). This is also higher than
results recorded by Healthwatch in in May/June 2017 (77%) and 2016 (44%).
• Both of these levels are lower than the CCG’s own data which was shared with
Healthwatch in early September 2020, which reported 88% satisfaction and 94%
recommendation levels. However, these were results from 416 people in Sussex who
were surveyed by the CCGs throughout 2019/20, whilst the Healthwatch in Sussex
results cover a one-month period only.
Overall satisfaction and recommendation ratings from the 2020 Healthwatch in Sussex survey,
plus historic data shown in red text. Historic satisfaction
levels and
recommendation ratings
Pre April
2016
April –
September
2016
May -
June
2017
November-
December
2017
2019/
2020
September
2020
Measure Data from Healthwatch reports CCG data Healthwatch
Provider SECAmb Coperforma SCAS SCAS SCAS SCAS
Satisfied or very
satisfied with service
67%
8% – 42%
75%
85%
88%
78.5%
Would recommend
service to family and
friends
No data
44%
77%
80%
94%
86%
(c) Satisfaction and recommendation ratings by Healthwatch area We have examined the satisfaction levels and recommendation ratings recorded by
passengers across the three Healthwatch areas to see if any variations existed. This data is
summarised in the tables and stacked bar charts below and shows considerable differences in
the ratings. We have included data published by Healthwatch in Sussex in April 2018 to show
how satisfaction levels and recommendation ratings have changed since that time.
Of note is:
• In 2020, passengers who live in Brighton and Hove recorded the lowest levels of
satisfaction with the service, and at 56.5% this represents a 27.5 percentage point
decrease on November/December 2017 levels. They were also the least likely to
recommend the service, down to 64% compared to the 76% seen in 2017. Similar
proportions of residents from the area selected the top two ‘satisfied’ and ‘likely’ to
recommend ratings and also the bottom two ‘dissatisfied’ and ‘unlikely’ to recommend
ratings.
• In 2020, passengers from West Sussex reported the highest levels of satisfaction at 95%
and were the most likely to recommend the service at 97.5%. Both these levels/ratings
are higher than those recorded in November/December 2017, which were 89% and 88%
respectively. Passengers from West Sussex were significantly more likely to select the
‘satisfied’ rather than the ‘very satisfied’ rating. Similar proportions selected the top
two ‘likely’ to recommend ratings. However, no passenger selected the ‘very unlikely’
rating, and only one passenger selected the ‘very dissatisfied’ rating.
Patient Transport Services: a Healthwatch
In Sussex report on patient experiences 36 | P a g e
• In 2020, passengers from East Sussex recorded a 12-percentage point drop in
satisfaction levels, down from the 87% seen in November/December 2017, but
satisfaction remained high overall at 75%. A three-percentage point increase was seen
in the number of passengers who would recommend the service, up to 86%. Passengers
from East Sussex were slightly more likely to select the ‘very satisfied’ rather than the
‘satisfied’ rating. They were considerably more likely to select the ‘very likely’ rather
than the ‘likely’ to recommend rating. A quarter of passengers said they were
‘dissatisfied’ or ‘very dissatisfied’, whilst 14% said they were ‘unlikely’ or ‘very
unlikely’ to recommend the service.
Overall satisfaction levels with the service in 2020 by area with 2017 results in red
Very satisfied Satisfied Dissatisfied Very dissatisfied
% o
f pass
engers
Satisfaction rating
Satisfaction levels amongst passengers, shown by Healthwatch area (Q26, % based on 128
responses where a postcode was given)
Brighton and Hove (B&H) East Sussex (excluding B&H) West Sussex
Patient Transport Services: a Healthwatch
In Sussex report on patient experiences 37 | P a g e
(d) Satisfaction by category of passenger We have examined the satisfaction levels and recommendation ratings recorded by
different categories of passengers to see if any variations existed:
1. renal dialysis patients.
2. regular (non-renal) passengers
3. those who attended just a handful of appointments.
4. those who needed transport which accommodated their wheelchair (‘wheelchair
passengers’).
5. those who had used the service during the first COVID lockdown period.
This data is summarised in the Data Tables, Appendix Two, Q26 and Q25, and the stacked bar
charts below.
In 2020, and at 85% (n55/65), the highest satisfaction levels were recorded by renal
dialysis patients. This is welcome news as in our April 2018 Healthwatch report we said that
renal patients were less likely than non-renal patients to be ‘very satisfied’ with the service.
In fact, Healthwatch has raised poor satisfaction levels amongst renal patients as an issue
since 2016 and we are pleased that renal patients are finally reporting improved satisfaction
with the service. (NB renal patients continue to report issues with the timeliness of the
service as discussed later on in this report).
Passengers who had used the service during the first COVID lockdown period recorded the
second highest satisfaction levels at 84% (n31/37).
Lower satisfaction levels were recorded by:
• One in three passengers who described themselves as ‘regular users of the service
(non-renal)’ (67% were satisfied, 33% were not).
• One in four passengers who are ‘wheelchair passengers’ (76% were satisfied, 24% were
not).
• One in five passengers who used the service ‘to attend just a handful of appointments’
(78% were satisfied, 22% were not).
27% 36%18%
18%50% 36%
11%
3%50% 47.5%
2.5% 0
0%
20%
40%
60%
80%
100%
Very likely Likely Unlikely Very unlikely
% o
f p
asse
nge
rs
Recommendation rating
Recommendation levels amongst passengers, shown by Healthwatch area (Q25, % based on 126
responses where a postcode was given)
Brighton and Hove (B&H) East Sussex (excluding B&H) West Sussex
Patient Transport Services: a Healthwatch
In Sussex report on patient experiences 38 | P a g e
Additionally, five people who had applied for the service but who were told they did not
qualify were all ‘dissatisfied’ with it, perhaps understandably so.
We have also looked at the data by Healthwatch area which is discussed in detail below. This
is shown in the Data Tables, Appendix Two, Q25 and Q26. This analysis revealed some notable
differences amongst passengers from the different areas:
• Satisfaction levels amongst all five categories of passengers from Brighton and Hove
were low, ranging from 50% to 57%. Passengers from West Sussex recorded the highest
satisfaction ratings ranging from 75%-100%.
• Significantly lower proportions of renal patients from Brighton and Hove were satisfied
with the service, at 57%. This is compared with 84% of renal patients from East Sussex
and 97% of renal patients from West Sussex.
• Significantly lower proportions of regular (non-renal) passengers from Brighton and
Hove and East Sussex were satisfied with the service (50% and 67% respectively). This is
compared with 75% of these passengers from West Sussex. In fact, regular (non-renal)
passengers awarded the lowest overall satisfaction rating out of the five categories of
passengers.
• 100% of wheelchair passengers from Brighton and Hove and West Sussex would
recommend the service, whilst 85% from East Sussex would do so.
• The lowest recommendations ratings were given by Brighton and Hove residents who
were renal dialysis passengers (64%) or those who had used the service during the
COVID-19 lockdown period (65%).
85%
67%
78%
76%
84%
15%
33%
22.5%
24%
16%
0% 10% 20% 30% 40% 50% 60% 70% 80% 90% 100%
Renal patients
Regular passengers (non-renal)
To attend handful of apps
Wheelchair passengers
Used in COVID lockdown
% of passengers
Cat
ego
ry o
f p
ass
en
ger
Satisfaction levels with the service amongst different categories of passenger
Satisfied Dissatisfied
Patient Transport Services: a Healthwatch
In Sussex report on patient experiences 39 | P a g e
(e) Satisfaction levels and recommendation ratings by Healthwatch area (in
detail) This data reveals that in 2020, passengers who live in the
Brighton and Hove area recorded the lowest levels of
satisfaction with the service, and at 56.5% this is a 27.5
percentage point decrease on 2017 levels.
Previous satisfaction levels recorded by respondents from Brighton and Hove were 67% in
May/June 2017 and 84% in November/December 2017. This means that current satisfaction
levels for Brighton and Hove residents are now lower than they were in 2017. Residents from
Brighton and Hove are also the least likely to recommend the service, down to 64% (n14/22)
compared to 76% seen in November/December 2017. In 2020, this outcome is based on the
views of 23 respondents who live in the BN1, 2, 3 or 41 postcode areas. However, in 2017, a
comparable number of 29 residents rated the service as being better overall.
Satisfaction levels
In 2020, 13% of residents from Brighton and Hove were ‘very satisfied’ with the service which
is considerably lower than the 36% recorded in November/December 2017. A similar
proportion of residents were ‘satisfied’ with the service in both 2020 and 2017 (43.5% and 48%
respectively), and at 43.5% this was the rating most likely to be chosen by residents from the
area in 2020. A far higher proportion of residents were ‘dissatisfied’ or ‘very dissatisfied’ with
the service in 2020 than in 2017 (26% and 17.5% in 2020 compared with 3% and 2% in 2017).
Recommendation ratings
In 2020, 27% of residents from Brighton and Hove were ‘very likely’ to recommend the service
which is lower than the 40% recorded in November/December 2017. The same proportions of
residents were ‘likely’ to recommend the service in both 2020 and 2017 (36%), and this was
also the rating most likely to be chosen by residents from the area in 2020. A higher
proportion of residents in 2020 were ‘unlikely’ or ‘very unlikely’ to recommend the service in
2020 than they were in 2017 (both 18% in 2020, compared with 8% and 5% respectively in
2017).
86%
83%
97%
91%
89%
14%
17%
3%
9.5%
11%
0% 10% 20% 30% 40% 50% 60% 70% 80% 90% 100%
Renal patients
Regular passengers (non-renal)
To attend handful of apps
Wheelchair passengers
Used in COVID lockdown
% of passenger
Cat
ego
ry o
f p
asse
nge
rRecommendation ratings amongst different categories of
passenger
Would recommend would not recommend
Patient Transport Services: a Healthwatch
In Sussex report on patient experiences 40 | P a g e
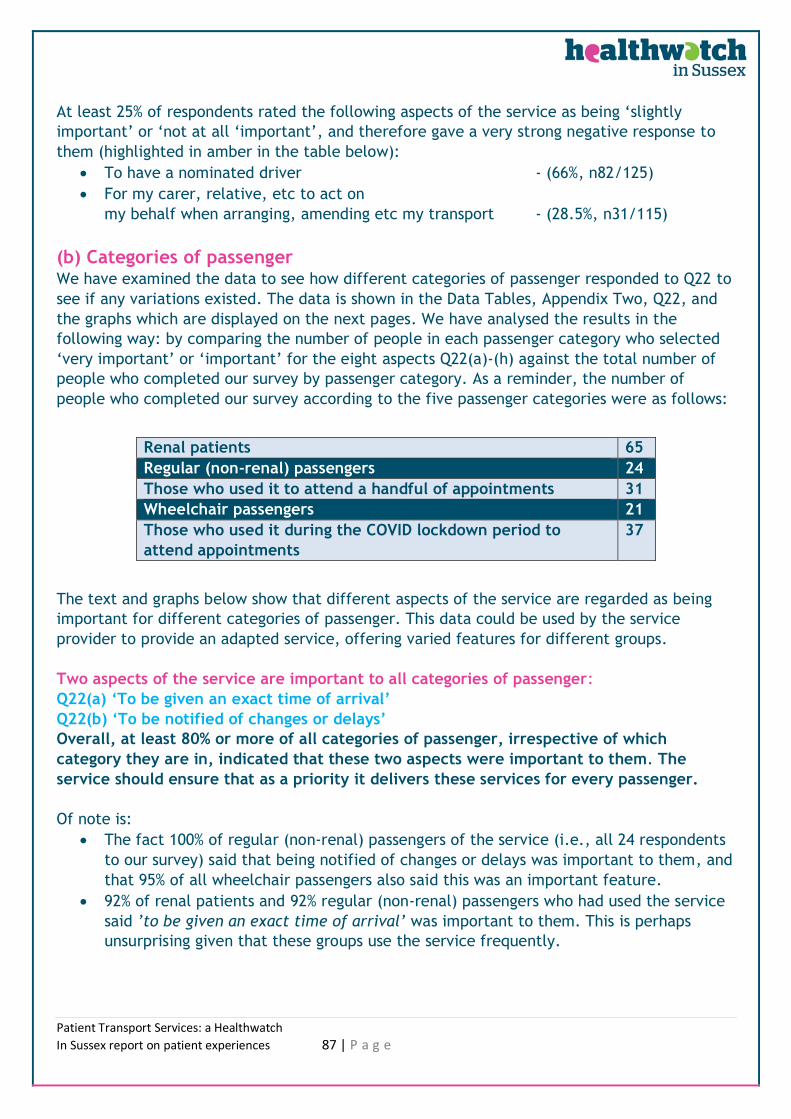
Categories of passenger
We have examined the satisfaction levels and recommendation ratings given by the different
categories of passengers from the Brighton and Hove area, and this is shown in the bar chart
below. We have combined results from passengers who said they were ‘very satisfied or
satisfied’ and those who were ‘very likely’ or ‘likely’ to recommend the service. This reveals:
• Around only 50% of passengers from all five categories of passenger were satisfied with
the service, meaning that approximately half were not. This reflects the overall low
satisfaction rating for the area - 56.5%.
• Higher proportions of passengers from the area from all five categories would
recommend the service. 100% of wheelchair passengers and those who had used the
service to attend just a handful of appointments would recommend it. Three quarters
of regular (non-renal) passengers would recommend it (75%). Two-thirds of renal
patients and those who had used it during the first COVID-19 lockdown period would
recommend it (65%).
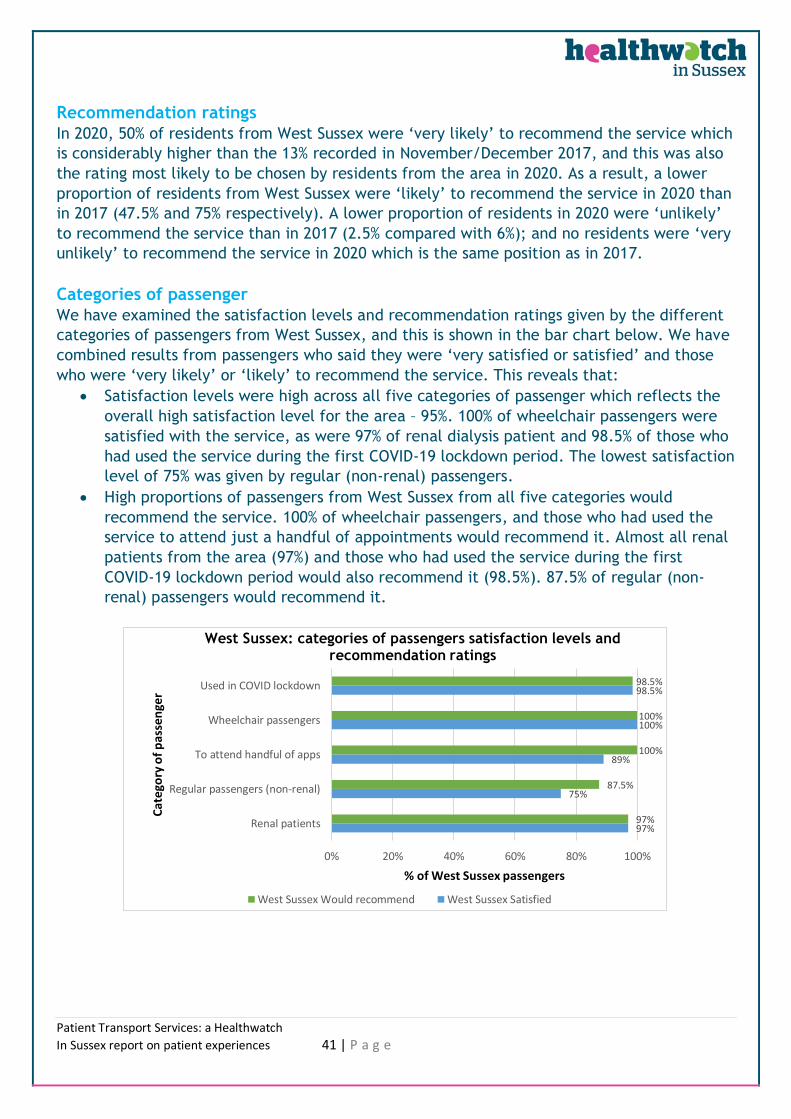
In 2020, passengers from West Sussex reported the
highest levels of satisfaction (95%) and were the most
likely to recommend the service (97.5%). Both levels are
higher than those recorded in 2017, at 89% and
88% respectively.
Satisfaction levels
In 2020, a higher proportion of residents from West Sussex were ‘very satisfied’ with the
service in 2020 than in 2017 (27.5% and 22% respectively). The same proportions of residents
were ‘satisfied’ with the service in both 2020 and 2017 (67%), and this was the rating most
likely to be chosen by residents from the area in 2020. A lower proportion of residents were
‘dissatisfied’ with the service in 2020 than in 2017 (2.5% compared with 6%). 2.5% of residents
were ‘very dissatisfied’ with the service in 2020 which is more than the 0% recorded in 2017.
57%
50%
50%
50%
55%
64%
75%
100%
100%
65%
0% 20% 40% 60% 80% 100%
Renal patients
Regular passengers (non-renal)
To attend handful of apps
Wheelchair passengers
Used in COVID lockdown
% of Brighton and Hove passengers
Cat
ego
ry o
f p
asse
nge
r
Brighton and Hove: categories of passengers satisfaction levels and recommendation ratings
Brighton and Hove Would recommend Brighton and Hove Satisfied
Patient Transport Services: a Healthwatch
In Sussex report on patient experiences 41 | P a g e
Recommendation ratings
In 2020, 50% of residents from West Sussex were ‘very likely’ to recommend the service which
is considerably higher than the 13% recorded in November/December 2017, and this was also
the rating most likely to be chosen by residents from the area in 2020. As a result, a lower
proportion of residents from West Sussex were ‘likely’ to recommend the service in 2020 than
in 2017 (47.5% and 75% respectively). A lower proportion of residents in 2020 were ‘unlikely’
to recommend the service than in 2017 (2.5% compared with 6%); and no residents were ‘very
unlikely’ to recommend the service in 2020 which is the same position as in 2017.
Categories of passenger
We have examined the satisfaction levels and recommendation ratings given by the different
categories of passengers from West Sussex, and this is shown in the bar chart below. We have
combined results from passengers who said they were ‘very satisfied or satisfied’ and those
who were ‘very likely’ or ‘likely’ to recommend the service. This reveals that:
• Satisfaction levels were high across all five categories of passenger which reflects the
overall high satisfaction level for the area – 95%. 100% of wheelchair passengers were
satisfied with the service, as were 97% of renal dialysis patient and 98.5% of those who
had used the service during the first COVID-19 lockdown period. The lowest satisfaction
level of 75% was given by regular (non-renal) passengers.
• High proportions of passengers from West Sussex from all five categories would
recommend the service. 100% of wheelchair passengers, and those who had used the
service to attend just a handful of appointments would recommend it. Almost all renal
patients from the area (97%) and those who had used the service during the first
COVID-19 lockdown period would also recommend it (98.5%). 87.5% of regular (non-
renal) passengers would recommend it.
97%
75%
89%
100%
98.5%
97%
87.5%
100%
100%
98.5%
0% 20% 40% 60% 80% 100%
Renal patients
Regular passengers (non-renal)
To attend handful of apps
Wheelchair passengers
Used in COVID lockdown
% of West Sussex passengers
Cat
ego
ry o
f p
asse
nge
r
West Sussex: categories of passengers satisfaction levels and recommendation ratings
West Sussex Would recommend West Sussex Satisfied
Patient Transport Services: a Healthwatch
In Sussex report on patient experiences 42 | P a g e
In 2020, passengers from East Sussex recorded a 12-
percentage point drop in satisfaction levels, down from the
87% seen in 2017, but remained high overall at 75%. A three-
percentage point increase was seen in the number of
passengers who would recommend the service, up to 86%.
Satisfaction levels
In 2020, 40% of residents from East Sussex were ‘very satisfied’ with the service which is
lower than the 60% recorded in November/December 2017. This was however the rating most
likely to be chosen by residents from the area in 2020. A slightly higher proportion of
residents were ‘satisfied’ with the service in 2020 than in 2017 (35% and 27% respectively). A
higher proportion of residents were ‘dissatisfied’ with the service in 2020 than in 2017 (19%
and 3% respectively). Very similar proportions of residents were ‘very dissatisfied’ with the
service in both 2020 and 2017 (6% and 7% respectively).
Recommendation ratings
Similar proportions of residents were ‘very likely’ to recommend the service in both 2020 and
November/December 2017(50% and 48% respectively), and at 50%, this was the rating most
likely to be chosen by residents from the area. Also, in 2020, a similar proportion of residents
from East Sussex were ‘likely’ to recommend the service as in 2017 (36% and 35%
respectively). A higher proportion of residents in 2020 were ‘unlikely’ or ‘very unlikely’ to
recommend the service in 2020 than they were in 2017 (14% in 2020 and 6% in 2017).
Categories of passenger
We have examined the satisfaction levels and recommendation ratings given by the different
categories of passengers from the East Sussex area, and this is shown in the bar chart below.
We have combined responses from passengers who said they were ‘very satisfied or satisfied’
and those who were ‘very likely’ or ‘likely’ to recommend the service. This reveals that:
• Satisfaction levels varied across the five categories of passenger. 86% of those who had
used the service during the first COVID-19 lockdown period and 84% of renal dialysis
patients were satisfied with the service. Three quarters of those who had used the
service to attend just a handful of appointments (78%) and wheelchair passengers (77%)
would recommend it. The lowest satisfaction level was given by regular (non-renal)
passengers, at 67%.
• High proportions of passengers from East Sussex from all five categories would
recommend the service. 94% of those who had used the service to attend just a handful
of appointments and 93% those who had used it during the first COVID-19 lockdown
period would recommend it. Over 80% of renal dialysis patients, wheelchair passengers
and regular (non-renal) passengers would recommend it.
Patient Transport Services: a Healthwatch
In Sussex report on patient experiences 43 | P a g e
Our analysis of responses given to the remaining questions asked in our survey about
satisfaction with different elements of the service has highlighted some potential reasons
for the variations across the Healthwatch areas (that are discussed above).
(f) Satisfaction levels with the application process Our analysis of questions 5-12, which asked people to tell us about their experiences of
applying for the service, revealed that:
• At least 80% or more of passengers from West Sussex were satisfied with all seven
aspects of their phone call application. Whilst at least 80% or more of passengers from
East Sussex were satisfied with just four aspects of their phone call; and at least 80% of
more of passengers and Brighton and Hove were satisfied with just two aspects of their
phone call.
• 25% or more of passengers from Brighton and Hove were dissatisfied with five aspects
of their phone call: the ease of getting through to the call centre; how simple the
questions were to answer; the total number of questions they were asked; the
explanation they received about how the service operates, and how confident they
were that their personal needs were being fully taken into account by the call handler.
• 25% or more of passengers from East Sussex were dissatisfied with just one aspect of
their phone call, namely how confident they were that their personal needs were being
fully taken into account by the call handler.
The method of application may have some limited impact on overall satisfaction levels.
There is a 15-percentage point difference in satisfaction levels with the service overall
between those who had applied themselves (70%) compared with those for whom someone
else applied on their behalf (85%). But how someone applies for the service does not appear
to materially impact on whether someone would recommend the service, as levels of
recommendation were at 85% and above regardless of the method chosen by an individual to
apply for the service.
84%
67%
78%
77%
86.0%
84%
83%
94%
85%
93%
0% 20% 40% 60% 80% 100%
Renal patients
Regular passengers (non-renal)
To attend handful of apps
Wheelchair passengers
Used in COVID lockdown
% of East Sussex passengers
Cat
ego
ry o
f p
asse
nge
r
East Sussex: categories of passengers satisfaction levels and recommendation ratings
East Sussex Would recommend East Sussex Satisfied
Patient Transport Services: a Healthwatch
In Sussex report on patient experiences 44 | P a g e
These results may however go some way to explaining why overall satisfaction levels with the
service amongst Brighton and Hove residents were so low at just 56.5%, and why satisfaction
levels amongst residents from East Sussex have dropped by 12 percentage points. At the same
time, it may help to explain the very high satisfaction levels with the service recorded by
west Sussex residents.
(g) Any issues experienced with the service Questions 18 and 20 asked passengers to tell us about any delays, changes, or problems they
had experienced with their transport. We examined these responses to determine if the
results may have any bearing on the satisfaction levels recorded across the three Healthwatch
areas. Our analysis showed that residents from Brighton and Hove reported experiencing a
greater number of different issues with their transport compared to residents from East
Sussex or West Sussex. The largest proportion of Brighton and Hove residents reported
experiencing 5 or more issues with their transport (36%), whereas 31% of residents from East
Sussex reported experiencing either just one issue or 3 or 4 issues (both 31%). Most residents
from West Sussex experienced just one issue at 31%.
Our analysis of question 20 showed that of the 40 passengers who had reported experiencing
one of the five issues listed, a higher proportion of residents were from Brighton and Hove
and East Sussex and that residents from West Sussex reported experiencing far fewer issues.
Once again, these results may however go some way to explaining the different satisfaction
levels recorded across the three Healthwatch areas.
(h) Satisfaction with the service during the first COVID-19 pandemic
lockdown Questions 13-15 asked passengers who had used the service during the first COVID-19
lockdown period (23rd March – 4th July) about their experiences, and to rate their satisfaction
levels with ten aspects of their journeys made during that time. 83 respondents indicated
that they had used the service during the first lockdown period and 84% were ‘very satisfied’
or ‘satisfied’, whilst 88% (n73/83) were ‘very likely’ or likely’ to recommend others to apply
for the service.
Over 80% of passengers who has used the service during the first lockdown period said that
they were ‘very satisfied’ or ‘satisfied’ with the following eight aspects of their journeys:
• Social distancing in transport - (97.5%, n80/82)
• The ease of communicating with staff wearing PPE - (95%, n77/81)
• The cleanliness of transport - (95%, n77/81)
• Having access to PPE whilst travelling - (93.5%, n73/78)
• The time spent travelling in vehicles - (88.5%, n69/78)
• Any communications received to arrange transport - (87%, n65/75)
• The timeliness of pick-ups from home - (86.5%, n70/81)
• The ease of contacting the call centre - (83%, n53/64)
Patient Transport Services: a Healthwatch
In Sussex report on patient experiences 45 | P a g e
Passengers were less likely to be ‘very satisfied’ with the following aspects:
• Notifications they had received about delays or
changes to their scheduled journeys - (62%, n42/68)
• The timeliness of transport when being picked
up from hospital - (56%, n44/79)
8. Passengers’ experiences of using the service
This section discusses findings which relate to the following:
(A) Passengers tell us about their experiences of applying for the service (page 45)
(B) Passengers tell us about the service during the first COVID-19 lockdown period (page
57)
(C) Passengers tell us about any delays, changes, or problems with their transport (page
66)
(D) Passengers tell us about the impacts of any delays, changes, or problems for (page 78)
(A) Passengers tell us about their experiences of applying for the services
People were asked how they had first found out about the service, and their
experiences of applying for it. People who had not used service were ineligible to
answer these questions. There were eight questions:
• Question 5 asked people to tell us how they had first applied for the service. Five
options, plus an ‘other’ option, were provided and respondents could select multiple
answers. All 125 respondents who were eligible to answer Q5 did so.
• Question 6 asked people to tell us how they first found out about the current service.
Six options, plus an ‘other’ option were provided and respondents could select multiple
answers. 125 respondents were eligible to answer Q6, and 123 did so.
• Question 7 asked people to consider any information they had found out, or been
provided with, about the service, and to rate this in terms of how helpful it had been
to them. Four options, plus an ‘other’ option were provided and respondents could
select multiple answers. 125 respondents were eligible to answer Q6, and 121 did
so.
• Question 8 asked whether people had spoken to someone on the phone as part of their
application for the service. This was a single answer question. All 125 respondents
who were eligible to answer Q8 did so. People who answered ‘yes’ were redirected
to Q9, whilst those who answered ‘no’ were redirected to Q10.
• Question 9 asked people who had spoken to someone on the phone as part of their
application to rate seven aspects of their call. We specifically asked if they were
satisfied or not with these aspects. There were multiple options to consider, with a
single answer permissible per option. 54 respondents were eligible to answer Q9 and
differing numbers of people chose to provide an answer to the seven options (a)-
(g), ranging from 51-54.
Patient Transport Services: a Healthwatch
In Sussex report on patient experiences 46 | P a g e
• Question 10 asked people to rate their experience of applying for the service overall,
from ‘very easy’ through to ‘very difficult’. People could also indicate that ‘someone
else had applied on their behalf’, or that they either ‘did not know’ or ‘could not
recall’ how they had applied. This was a single answer question. 125 respondents
were eligible to answer Q10, and 121 did so.
• Questions 11 and 12 asked people to describe their answer given to Q10 and
specifically to tell us why they found the application process either ’very easy / fairly
easy’ or ‘very difficult / difficult’. People could provide free text answers. 125
respondents were eligible to answer these questions and 55 people provided
comments for Q11 (‘very or fairly easy’) whilst 22 provided comments for Q12
(‘very difficult / difficult’).
Some of the key findings
How passengers applied for patient transport services
• 16% of respondents had applied for the service themselves, which is equivalent to just 20
passengers. No passengers from Brighton and Hove had applied for the service
themselves.
• Only one passenger had applied for the service online, who was a resident of East Sussex,
whilst no passengers from the remaining two Healthwatch areas had used this method.
• 59% of passengers indicated that ‘someone else applied on my behalf’. 68% of these
passengers were renal dialysis patients.
• 23% of respondents indicated that they had applied for the service by phone.
Satisfaction with phone applications
A high proportion of passengers (75% or higher) expressed high satisfaction with the following
aspects of their phone application:
• How simple the questions were to answer?
• Whether they felt the questions asked were too personal or intrusive.
• The total number of questions they were asked.
• The helpfulness of the call handler.
• The ease of getting through to the call centre on the phone.
• The explanation they received about how the service operates .
However, nearly one third of passengers (28%) said they lacked confidence that their personal
needs were being taken into account by the call hander.
In addition, other aspects of phone applications where a nearly one fifth or more of
passengers expressed dissatisfaction with were:
• The ease of getting through on the phone, 24%.
• The explanation they received about how the service operates, 21%.
• The total number of questions they were asked, 18%.
• How helpful the call handler was? 18%.
• How personal the questions or intrusive questions were? 17%.
Patient Transport Services: a Healthwatch
In Sussex report on patient experiences 47 | P a g e
Information people were given about the service
Over one third of passengers (37%) said they were not given or did not find any information
about the service.
55.5% of individuals who indicated that someone else had applied for the service on their
behalf also said that they were not provided with any information about the service by the
person who arranged it for them.
Passengers who had accessed information indicated in small numbers that this was:
• Accessible, 16%.
• Helped manage my expectations, 15%.
• Easy to access, 13%.
• Over one third said that this had been clear and easy to understand, 35%.
How easy the application process was?
83% of passengers who provided either an ‘easy’ or ‘difficult’ rating felt that the application
process overall was easy. Just 17% felt that the application process overall was difficult.
Higher proportions of residents from East Sussex (21.5%) and Brighton and Hove (28.5%) were
likely to say that the application process was ‘very easy’ than residents from West Sussex
(10.5%) who were more likely to say that the application process was ‘fairly easy’.
Satisfaction with the application process overall
We examined passengers’ satisfaction levels with the service overall and this revealed that
the method of application did have an impact. 70% for those who had applied themselves
were satisfied with the service overall, whilst this was 79% for those who applied by phone,
85% where someone else had applied on their behalf, and 100% for the one passenger who had
applied online. Overall recommendation levels were 85% or higher, irrespective of how
passengers had applied for the service initially.
We recommend that the provider promotes other methods of applying for the service
given the small numbers who currently do this by phone or online.
We recommend that the provider improve its communications and information provided
at the application stage. All passengers should be provided with information about the
service regardless of who submits the initial application. Improving communications
regarding the service is a recommendation made later on in ‘the future of the service’
section of this report.
Patient Transport Services: a Healthwatch
In Sussex report on patient experiences 48 | P a g e
The provider could provide additional training to call handlers to ensure that passengers
are left feeling confident that their personal needs have been taken into account during
the application process e.g., where a specific type of transport is requested.
The questions which people are asked on the phone would benefit from being adapted for
different categories of passengers i.e., regular users find it frustrating to repeatedly
answer the same questions each time they apply for the service.
We recommend that the service provider expressly state who is eligible and ineligible for
the service to avoid any confusion on the part of potential passengers, as well as
providing information about alternatives to the service. There is currently a lack of clarity
concerning the current eligibility for the service, and expressly stating what this is
alongside alternative options to the service, could help to avoid negative comments i.e.,
such as those expressed by respondents whose applications were turned down.
The application processs: results in detail
(a) How passengers had applied for the service Respondents were asked to tell us how they first applied for the service, and 125 did so. It
was possible for people to select multiple answers to describe their application process and
the 125 respondents provided 136 answers overall. The data is shown in the pie chart below
(and in the Data Tables, Appendix One, Q5). The percentages relate to the number of
respondents who chose each option as a percentage of the 125 people. As multiple choices
could be made then the total percentage is more than 100%. This reveals that:
Over half of people did not apply for the
service themselves, with 52% (n65) of
respondents indicating that ‘someone else
applied on my behalf’. Just 16% of
respondents had applied themselves, which is
just 20 passengers.
23% of respondents (n29) indicated that they
had applied for the service by phone.
9 (7%) people selected ‘other’ to describe
how they had applied for the service, and
eight of these people indicated that ‘hospital
staff’ had arranged their transport for them.
This would indicate that someone else had
applied for the service on behalf of these
eight individuals. This implies that the option
‘someone else applied for the service on my
behalf’ actually applies to 74 respondents
(59%) in total.
23%
1%
16%
52%
10%
7%
How passengers had applied for the service (Q5)
By phone
Online
I applied myself
Someone else appliedon my behalf*
Don’t know / Can’t remember
Other
Patient Transport Services: a Healthwatch
In Sussex report on patient experiences 49 | P a g e
(b) How passengers from each Healthwatch area had applied for the service We examined the data to determine how passengers from each Healthwatch area had applied
for the service, and to identify if any variations existed. The data is shown in the bar graph
below (and in the Data Tables, Appendix One, Q5). This reveals some distinct differences in
how people from the different Healthwatch areas applied for the service:
Only one passenger applied for
the service online, who was a
resident of East Sussex. No
passengers from the remaining
two Healthwatch areas had
used this method.
No passengers from Brighton
and Hove had applied for the
service themselves. Small
numbers of passengers from
East Sussex (24%, n15/63) and
West Sussex (12.5%, n5/40)
had applied themselves.
Small numbers of passengers from all three Healthwatch areas had applied for the service by
phone, although this was the second most popular method of application overall. More
passengers from East Sussex (27%, n17/63) and West Sussex (22.5%, n9/40) had applied by
phone compared to residents from Brighton and Hove (14%, n3/21).
A majority of passengers from all three Healthwatch areas said that someone else had applied
for the service on their behalf’s. A high proportion of residents from Brighton and Hove
indicated that this was how they had applied for the service (76%, n16/21). Similar
proportions of residents from East Sussex and West Sussex selected this answer (East Sussex –
46%, n29/63, West Sussex – 50%, n20/40).
(c) Where someone else had applied for the service on behalf of a passenger We have looked in more detail at the categories of passengers who said that someone else
had applied on their behalf’s, given that a majority of passengers overall (59%) indicated that
this was how they had applied for the service. In performing this analysis, it is important to
draw attention to some differences between Question 5 and Question 10 of the questionnaire.
Question 5 asked people to say how they had first applied for the service, and 65 people said
that ‘someone applied on my behalf’. Question 10 asked people to describe how easy the
application process was overall and one of the options that people could select was to say
that ‘someone applied on my behalf’ which 49 people selected. This discrepancy of 16 is due
to the fact that Q10 allowed respondents to describe their application process as ‘easy’ or
‘difficult’ even if someone else had applied on their behalf. We have therefore used the
responses given to Q5 (n65) to identify which category of passengers were more likely to say
that someone else had applied for the service on their behalf and this is shown in the pie
14%
0 0
76%
27%
16%24%
46%
22.5%
0
12.5%
50%
0%10%20%30%40%50%60%70%80%
By phone Online Applied myself Someone elseapplied for me
% o
f pass
engers
Method of application
How passengers applied for the service,shown by Healthwatch area
Brighton and Hove East Sussex West Sussex
Patient Transport Services: a Healthwatch
In Sussex report on patient experiences 50 | P a g e
chart below (as multiple answers could be selected for Q5 the percentages add up to more
than 100%):
▪ 44 of the 65 (68%) passengers
were renal dialysis patients.
▪ 6 of the 65 (9%) passengers were
regular (non-renal) passengers.
▪ 15 of the 65 (23%) passengers
used the service to attend a
handful of appointments.
▪ 10 of the 65 (15%) passengers
were wheelchair passengers.
▪ 25 of the 65 (38.5%) passengers
had used the service during the
first COVID lockdown period.
Renal patients were therefore the largest category of passenger where someone else had
applied for the service on their behalf.
(d) Satisfaction levels with the application process We have performed additional analysis to see if the method of application had any impact on
passengers’ overall satisfaction levels with the service, and whether they would be more or
less likely to recommend the service. This is shown in the bar chart below (and in the Data
Tables, Appendix Two, Q5). The analysis shows that passengers’ recorded high satisfaction
and recommendations levels irrespective of how they had applied for the service initially.
Of note is:
The fact that recommendation
levels are 85% or higher,
irrespective of how passengers
had applied for the service
initially.
The fact that overall
satisfaction levels amongst
passengers varied from 70% for
those who applied themselves,
79% for those who applied by
phone, 85% where someone
else had applied on their
behalf, and 100% for the one
passenger who had applied
online.
79%
100%
70%
85%
90%
100%
85%
91%
0% 20% 40% 60% 80% 100%
By phone
Online
I applied myself
Someone else applied on my behalf*
% of passengers
Meth
od o
f applicati
on
Whether the method of application for the service impacted overall satisfaction and recommendation
levels
Very / likely to Recommend service Very / satisfied with the service
44
6
1510
25
0
10
20
30
40
50
Renalpatients
Regularpassengers(non-renal)
To attendhandful of
apps
Wheelchairpassengers
Used inCOVID
lockdown
Nu
mb
er o
f p
asse
nge
rs
Category of passenger
Category of passenger for whom someone else had applied for the service on their behalf
Patient Transport Services: a Healthwatch
In Sussex report on patient experiences 51 | P a g e
These results would seem to indicate that the application process works well when someone
else applies on behalf of the passenger, and this is perhaps to be expected as such people,
are often hospital staff who regularly access the system and are likely to be more familiar
with it and may better understand how to complete the application process. We explore why
satisfaction levels are lower when someone applies by phone, or by themselves, below to try
to identify potential reasons.
(e) Information people were given about the service Respondents were asked to tell us how they first found out about the service, and 123 did so.
It was possible for people to select multiple answers and the 123 respondents provided 139
answers overall. The data is shown in the Data Tables, Appendix One, Q6. The percentages
relate to the number of respondents who chose each option as a percentage of the 123
people, and as multiple choices could be made then the total percentage is more than 100%.
This reveals that over half of passengers were first told about the service by the hospital /
hospital staff (56%, n69/123), and almost a quarter had been referred to the service (23%,
n28/123). Small numbers of passengers had found out about the service themselves (11%,
n13/123), via friends or family (7%, n9/123) or through their GP (8%, n10/123).
Four (3%) passengers said they had found out about the service in other ways, including via a
disabled people’s Facebook page (1) and through a Renal Welfare Officer (1). It is interesting
to note that 56% of passengers were first told about the service by the hospital/hospital staff
and that 59% of passengers said that someone else had applied on their behalf; and also, that
18% of passengers found out about the service themselves or via family/friends, and 16% of
passengers indicated that they had applied for the service themselves.
We also asked people to rate any information they found, or were given, about the service,
and 121 passengers did so. This data is shown in the Data Tables, Appendix One, Q7. Over one
third of passengers (37%, n45/121) said they were not given or did not find any information
about the service. When we look in more detail at these 45 passengers, we find that 25
(55.5%) individuals also indicated that someone else had applied for the service on their
behalf. This implies that over half of patients are not being provided with any information
about the service by the person who arranges it for them.
Of the 121 passengers who had accessed information about the service, small numbers that
this was:
• Accessible - 19 (16%)
• Helped manage my expectations - 18 (15%)
• Easy to access - 16 (13%)
Just over one third of passengers said that information had been clear and easy to understand
(35%, n42/121).
These results would indicate that current information about the service could be improved.
This could also be one reason why satisfaction levels amongst passengers who had applied by
phone, or by themselves, was lower.
Patient Transport Services: a Healthwatch
In Sussex report on patient experiences 52 | P a g e
(f) People who applied by phone Respondents were asked if they had applied for the service by phone (in full or in part, Q8)
and those who had were then asked to tell us more about their experiences, and to rate
seven different aspects of their phone calls (Q9). 125 respondents answered Q8, and 54
people indicated that they had spoken with someone on the phone as part of their application
(56 had not, and 15 could not recall). This data is shown in the Data Tables, Appendix One,
Q8 and Q9.
We have examined this data to determine which of the seven aspects of their phone call
passengers said they were most satisfied with. To do this we have combined responses where
passengers selected either ’very important’ or ‘important’ and identified where the overall
result was 80% or more. We consider that this indicates a very strong positive response
overall by passengers. Not all respondents who were eligible to do so answered every part of
Q9, and the Data Tables, Appendix One, Q9, shows the number of respondents who rated
each aspect of their call (a)-(g).
As can be seen in the graph above, 80% of all respondents indicated that they were satisfied
with four of the seven aspects of their phone call, and therefore gave them a very strong
positive response to these:
• How simple the questions were to answer - (85%, n46/54)
• How personal or intrusive the questions were - (83%, n45/54)
• The helpfulness of call handler - (83%, n44/53)
• The total number of questions asked - (82%, n42/51)
In addition, two of the remaining seven aspects scored 75% or higher satisfaction levels
• Explanation of the service - (79%, n42/53)
• Ease of getting through on phone - (76%, n41/54)
72%
79%
83%
82%
83%
85%
76%
28%
21%
17%
18%
17%
15%
24%
0% 10% 20% 30% 40% 50% 60% 70% 80% 90% 100%
g) Confidence my needs taken into account
f) Clear explanation of service given
e) Helpful call handler
d) Number of Qs asked
c) Were Qs too intrusive
b) How simple Qs were
a) Ease of getting through to call centre
% of passengers
Asp
ect
of
phone c
all
Passenger satisfaction with their phone call when they applied for the service (Q9)
Satisfied Dissatisfied
Patient Transport Services: a Healthwatch
In Sussex report on patient experiences 53 | P a g e
In a similar way, we have combined responses where passengers selected either ’dissatisfied’
or ‘very dissatisfied’ and identified where the overall result was 25% or more to determine
where a very strong negative response was recorded overall. Only one aspect of people’s
phone calls achieved this level of response – ‘Confidence your personal needs were taken into
account’ – (28%, n15/54). This means that nearly one third of people were dissatisfied with
this aspect of their phone call.
In addition, other aspects of phone applications which nearly one fifth or more of passengers
expressed dissatisfaction with were:
• The ease of getting through on the phone – 24%
• How clear the explanation of how the service works was – 21%
• The total number of questions they were asked – 18%
• How helpful the call handler was – 18%
• How personal the questions or intrusive questions were – 17%
We have looked at how different categories of passengers rated the seven aspects of their
phone application. As relatively low numbers of passengers answered Q9 then we have not
been able to perform any detailed analysis. This data is however shown in the Data Tables,
Appendix Two, Q9, and indicates that a majority of all categories of passengers were satisfied
with all seven aspects. Of note however are:
• The fact that 43% of regular (non-renal) passengers were dissatisfied with the number
of questions they were asked, and 55% were not confident that their personal needs
were being fully taken into account by the call hander, whilst 55% felt that the
questions they were asked were too intrusive.
• The fact that 67% of passengers who had only used the service to attend a handful of
appointments said they were dissatisfied with how helpful the call handler was; 43%
were dissatisfied with the explanation they received about how the service worked,
and 50% were not confident that their personal needs were being fully taken into
account by the call handler.
• 42% of wheelchair passengers felt that the questions they were asked were too
intrusive, and 57% were dissatisfied with the ease of getting through on the phone.
These findings imply that the questions people are asked
would benefit from being adapted for different categories
of passengers i.e., regular users may find it frustrating to
be asked to repeatedly answer the same questions each
time they apply.
Satisfaction with phone applications
We have looked at passenger satisfaction with different aspects of the application process
conducted over the phone, by Healthwatch area. This data is however shown in the Data
Tables, Appendix Two, Q9, and in the bar chart below. We have examined this data to
determine where 80% or more of passengers from each area said that they were satisfied with
any of the seven aspects of their phone application. To do this we have combined responses
“I was using the service from
2008 but they keep on asking
questions every time.” – East
Sussex resident
Patient Transport Services: a Healthwatch
In Sussex report on patient experiences 54 | P a g e
where passengers selected either ’very satisfied’ or ‘satisfied’. We consider that this
indicates a very strong positive response overall by passengers. Conversely, we have
identified where 25% or more of respondents said they were dissatisfied with any aspects of
their phone calls. We consider that this indicates a very strong negative response overall by
passengers. This analysis reveals:
• At least 80% or more of passengers from West Sussex were satisfied with all seven
aspects of their phone call.
• At least 80% or more of passengers from East Sussex were satisfied with four aspects of
their phone call.
• At least 80% of more of passengers and Brighton and Hove were satisfied with just two
aspects of their phone call.
• 25% or more of passengers from Brighton and Hove were dissatisfied with five aspects
of their phone call: the ease of getting through to the call centre; how simple the
questions were to answer; the total number of questions they were asked; the
explanation they received about how the service operates, and how confident they
were that their personal needs were being fully taken into account by the call handler.
• 25% or more of passengers from East Sussex were dissatisfied with just one aspect of
their phone call, namely how confident they were that their personal needs were being
fully taken into account by the call handler.
• Very small numbers of passengers from West Sussex expressed dissatisfaction with any
aspect of their phone call, and the 25% threshold was not reached for any of the seven
aspects.
These results may go some way to explaining why overall satisfaction levels with the service
amongst Brighton and Hove residents were so low at just 56.5%, and why satisfaction levels
amongst residents from East Sussex have dropped by 12 percentage points. At the same time,
it helps to explain the very high satisfaction levels with the service recorded by west Sussex
residents.
6 7 86
8 7 64
7
24
2 3 4
25
2826
31
27 2624
8
57
5 5 6
910 11 11 10 9 9 9
1 0 0 02 2 2
0
5
10
15
20
25
30
35
Ease of gettingthrough on
phone
How simple theQs were to
answer
How personal(intrusive) Qs
were
Total number ofQs asked
Helpfulness ofcall handler
Explanation ofthe service
Confidence yourpersonal needswere taken into
account
Nu
mb
er o
f p
asse
nge
rs
Aspect of the phone call
Satisfaction with different aspects of the application process conducted over the phone, by Healthwatch area
BrightonHove Satisfied BrightonHove DissatisfiedEast Sussex Satisfied East Sussex DissatisfiedWest Sussex Satisfied West Sussex Dissatisfied
Patient Transport Services: a Healthwatch
In Sussex report on patient experiences 55 | P a g e
(g) How easy was the application process overall? Respondents were asked to give an overall rating for their experience of applying for the
service, ranging from ‘very easy’ through to ‘very difficult’. 121 respondents answered Q10
and this data is shown in the Data Tables, Appendix One, Q10, and the pie chart below.
Passengers could select other
options including ‘don’t know or
can’t remember’ (5%, n6) and
‘someone else applied on my
behalf’ (40%, n49). These
individuals did not therefore
provide a rating at Q10 to describe
the application process.
A total of 66 passengers did
however provide a rating of either
‘very easy, ‘fairly easy’, ‘difficult’
or ‘very difficult’.
Of these 66 passengers:
• 23 found the application process ‘very easy’ whilst 32 found it ‘fairly easy’. We have
combined these responses to determine that 83% (n55/66) of passengers who provided
an ‘easy’ or ‘difficult’ rating felt that the application process overall was easy
• Just 7 passengers found the application process ‘difficult’, and 4 ‘very difficult’. We
have combined these responses to determine that 17% (n11/66) of passengers who
provided an ‘easy’ or ‘difficult’ rating felt that the application process overall was
difficult.
We have looked at whether there was any variation in the answers given by Healthwatch
area. This data is shown in the Data Tables, Appendix Two, Q10 and the bar chart below.
28.5% 28.5%
5% 5%
21.5%20%
8%
1.5%
10.5%
36%
2.5%5%
0.0%
5.0%
10.0%
15.0%
20.0%
25.0%
30.0%
35.0%
40.0%
Very easy Fairly easy Difficult Very difficult
% o
f pass
engers
Passenger rating
How easy the application process was, shown by Healthwatch area
Brighton and Hove (B&H) East Sussex (excluding B&H) West Sussex
19%
26%
6%3%
40%
5%
How easy passengers found the application process (Q10)
Very easy
Fairly easy
Difficult
Very difficult
Someone applied on my behalf
Don’t know / can’t remember
Patient Transport Services: a Healthwatch
In Sussex report on patient experiences 56 | P a g e
Higher proportions of residents from East Sussex (21.5%) and Brighton and Hove (28.5%) areas
were likely to say that the application process was ‘very easy’ than residents from West
Sussex (10.5%) who were more likely to say that the application process was ‘fairly easy’.
A roughly similar proportion of residents from all three areas indicated that the application
process was ‘difficult’ or ‘very difficult’, ranging from 7.5% for residents in West Sussex, to
9.5% for residents in East Sussex, and 10% for residents in Brighton and Hove.
(h) Comments received from people about the application process Questions 11 allowed respondents to provide free text comments to explain why they
considered that the application process was ‘very easy’ and ‘fairly easy’, whilst Question 12
provided an opportunity for respondents to say why they had found it to be ‘difficult’ and
‘very difficult’.
55 comments were received from respondents to Question 11 (i.e., the application process
had been ‘easy’ or ‘very easy’), whilst 22 respondents provided comments to Question 12
(i.e., the process was ‘difficult’ or ‘very difficult’. Several ‘not applicable’ responses were
provided, and these have been removed from our analysis, as have comments which did not
describe the application process. We also identified that six passengers had provided
comments at Q11 which actually described the process ‘as ‘difficult’ or ‘very difficult’ (and
not as ‘easy’). The number of relevant comments provided for Q11 is therefore 40, and for
Question 12 it is 16.
We have identified common themes within these free text responses for both Questions 11
and 12. Common themes identified from respondents who felt that the application process
was ‘very easy’ or ‘easy’ included:
• It was easy because someone else applied on my behalf (15 respondents).
• It was easy because the phone call was quick and easy and clear (10 respondents).
• It was easy because I was given clear instructions / information (7 respondents).
• ‘Other’ reasons which indicated it was easy (8 respondents).
37%
25%
18%
20%
What made the application process easy (Q11 and 12)
It was easy because someone elseapplied on my behalf
It was easy because the phone callwas quick and easy and clear
It was easy because I was givenclear instructions / information
Other reasons which indicated itwas easy
“Instructions were clear
and concise, easy to follow,
and not too long-winded.” -
East Sussex resident
“Easy because someone
else at the hospital
filled it all out for me.”
Hove resident
“Just one easy phone call.” –
West Sussex resident
Patient Transport Services: a Healthwatch
In Sussex report on patient experiences 57 | P a g e
Respondents who provided comments which suggested the application process was easy
identified themselves as the following categories of passenger: 19 renal dialysis patients; 10
regular (non-renal) passengers; 9 wheelchair passengers; 6 who had used the service to
attend a handful of appointment, and 12 who had used it during the first COVID lockdown
period. 25 were from East Sussex, 9 from West Sussex, and 6 from Brighton and Hove.
Common themes identified from respondents who felt that the
application process was ‘difficult’ or ‘very difficult’ included:
• It was difficult because there were too many questions
and it was too long (4 respondents).
• It was difficult because it was hard to get through
on the phone (4 respondents).
• It was difficult because there was no clear explanation
of the service given (3 respondents).
• ‘Other’ reasons which indicated it was difficult (5 respondents).
Respondents who provided comments which suggested
the application process was difficult identified
themselves as the following categories of passenger: 6
renal dialysis patients, 8 regular (non-renal)
passengers, 4 wheelchair passengers, 3 who had used
the service to attend a handful of appointment. 9
were from East Sussex, 5 from West Sussex and 2 from
Brighton and Hove.
(B) Passengers tell us about the service during the COVID-19 lockdown period
People were asked whether they had used the service during the first COVID-19
lockdown period, 23rd March to 4th July 2020. If they said ‘yes’, they were then
asked to answer four questions about their experiences of using the service during
that time:
• Question 13 asked people to say whether they had used the service during the first
COVID lockdown period. This was a single answer question. People who answered ‘yes’
to Q13 were redirected to Q14. 125 respondents were eligible to answer this
question, and 83 respondents (66.5%) indicated that they had used the service
during the first COVID-19 lockdown period.
• Question 14 asked respondents to consider ten different aspects of their transport or
journeys during lockdown. We specifically asked if they were satisfied or not with
these aspects. There were multiple options to consider, with a single answer
permissible per option. 83 respondents were eligible to answer this question and
differing numbers of people chose to provide an answer to the ten options (a)-(j),
ranging from 64-82.
“A lot of questions and I
didn’t feel like the call
handler was listening.” -
West Sussex resident
“Nothing is explained.”
– Hove resident
“Making needs clear if you
do not fit into a tick box
they do not know what to
do.” – Brighton resident
Patient Transport Services: a Healthwatch
In Sussex report on patient experiences 58 | P a g e
• Question 15 asked people who had used the service during the first COVID lockdown
period to rate their experience as better, the same, or worse compared to other times
when they had used it. This question was only relevant to people who had used it
during lockdown and at other times. This was a single answer question. 83
respondents were eligible to answer this question, and 82 did so.
• Question 16 allowed respondents to provide free-text comments to say why they had
described the service (at Q15) during the COVID-19 lockdown period as better, worse,
or the same. 82 respondents were eligible to answer this question, 51 respondents
provided comments.
Some of the key findings
Satisfaction with the service during the first COVID-19 lockdown period
84% of all passengers who had used the service during this period indicated that they were
‘very satisfied’ or ‘satisfied’ with it, whilst 88% were ‘very likely’ or likely’ to recommend
others to apply for the service. These results are higher than the overall satisfaction levels
and overall recommendation ratings with the service which are 78.5% and 86% respectively.
However, just 62% of passengers who had used the service during the lockdown period were
satisfied with any notifications they had received about delays or changes to their scheduled
journeys, whilst 56% were satisfied with the timeliness of their pickups from hospital.
All categories of passengers who had used the service during lockdown recorded high
recommendation ratings ranging from 87% for renal patients up to 100% of passengers who
had used the service to attend a handful of appointments only.
Satisfaction levels with the service during lockdown were more varied with renal patients
recording the highest ratings (85%), followed by those who had used the service to attend a
handful of appointments only (79%), and regular (non-renal) passengers (78%). Only 64% of
wheelchair passengers were ‘very satisfied’ or ‘satisfied’ with the service meaning that one
third were not.
Renal patients were the largest category of passenger who had used the service during the
first COVID-19 lockdown period for all three Healthwatch areas. They were also the most
likely passenger group to be dissatisfied with two aspects of the service during that time: any
notifications they had received about delays or changes to their scheduled journeys, and the
timeliness of their transport when being picked up from hospital.
80% of passengers said they were ‘satisfied’ or ‘very satisfied’ with eight of the ten aspects of
the service during lockdown that we asked them to consider. Over 35% of people were
‘dissatisfied’ or ‘very dissatisfied’ with the remaining two options: any notifications they had
received about delays or changes to their scheduled journeys (38.5%), and the timeliness of
their transport when being picked up from hospital (44%).
Patient Transport Services: a Healthwatch
In Sussex report on patient experiences 59 | P a g e
Feedback about the service during lockdown 73 respondents answered Q15 as follows:
• 46 (63%) respondents said the service had been the same during lockdown as at any other
time. 34 of these respondents were renal dialysis patients.
• 23 (31.5%) respondents said the service was better during lockdown. 19 of these
respondents were renal dialysis patients.
• 4 (5.5%) respondents said the service was worse during lockdown. All 4 respondents were
renal dialysis patients.
51 respondents provided free text answers (to Q15) to describe why they felt the service was
the same during lockdown as at any other time, better, or worse. Of those who said the
service was better during lockdown, we identified three key themes:
• Passengers preferred single patient pick-ups and/or travelling alone (7)
• The journey time was quicker (5)
• There was an improvement in the timeliness of picks / drop offs (9)
The first period of lockdown, due to COVID-19, saw higher satisfaction levels and
recommendation ratings amongst passengers. Respondents commented on quicker
journey times, improved timeliness/reliability of transport pick-ups, and single patient
journeys. The pandemic resulted in temporary changes such as quieter roads, the need
for social distancing but also possibly a smaller pool of drivers. However, none of these
changes are expected to continue longer-term. As the service returns to normal, we
recommend that the provider identify how it can continue to deliver someone of these
improved aspects of the service, notably for regular users of the service.
Experiences of Patient Transport Service during COVID: results in detail
(a) Who used the service during lockdown? Question 13 asked whether passengers had used the service during the first COVID-19
pandemic lockdown period, by which we mean 23rd March – 4th July 2020. These dates
correlated with government announcements concerning England entering a period of full
lockdown and the subsequent easing of restrictions. 125 respondents answered Q13 with 83
(66.5%) passengers indicating that they had used the service during this time, whilst 40 (32%)
said they had not and 2 (1.5%) indicating that they either did not know or could not recall.
This data is shown in the Data Tables, Appendix One, Q135. We looked at this data to identify
which Healthwatch areas these 83 passengers were from, and this data is shown in the Data
5 Question 2 of the survey asked respondents: “Which of the following describes why you have used the service”. 37 respondents answered that they had used the service during the COVID-19 pandemic. Data analysis has been performed on the 83 respondents, not the 37 who answered Question 2.
Patient Transport Services: a Healthwatch
In Sussex report on patient experiences 60 | P a g e
Tables, Appendix Two, Q13. This reveals that the highest proportion of passengers who had
used the service during the first COVID-19 lockdown period were from East Sussex (45%), with
residents from West Sussex accounting for 36%, and Brighton and Hove residents accounting
for just 18%.
Further analysis has been performed to identify which categories of passengers had used the
service during the first COVID-19 lockdown. Respondents could select from multiple options to
describe their use of the service, meaning that the total number of responses is larger than
83. This data is shown in the Data Tables, Appendix Two, Q13, and the stacked bar chart and
table below (we have excluded passengers who selected option Q2(e) ‘I used the service
during the COVID-19 pandemic lockdown to get to appointments’ as this is a given for Q13).
This shows that renal
patients were the largest
category of passenger
who had used the service
during the first COVID-19
lockdown period for all
three Healthwatch areas.
Renal patients
represented 93% of all
West Sussex and Brighton
and Hove residents who
had used the service
during lockdown,
compared with 46% for
East Sussex.
(b) How did passengers rate the service during lockdown?
We asked respondents to consider ten different aspects of their transport during lockdown
(Q14). We specifically asked if they were satisfied or not with these ten aspects. There were
multiple options to consider, with a single answer permissible per option. We have examined
the data further to determine which of the ten aspects passengers were most satisfied with.
To do this we have combined responses where passengers selected either ‘very satisfied’ or
‘satisfied’ and identified where the overall result was 80% or more (this data is shown in the
Data tables, Appendix One, Q14, and bar chart below). We consider that this threshold
indicates a very strong positive response overall by passengers. In a similar way, we have
combined responses where passengers selected either ’slightly important’ or ‘not important
at all’ and identified where the overall result was 25% or more to determine where a very
strong negative response was recorded overall.
14
2
1
2
17
10
8
6
28
6
5
3
0 20 40 60
Renal patients
Regular passengers (non-renal)
To attend handful of apps
Wheelchair passengers
Number of passengers
Cat
ego
ries
of
pas
sen
ger
Categories of passenger who used the service during the COVID lockdown period, shown by Healthwatch
area
Brighton and Hove 15 East Sussex 37 West Sussex 30
Patient Transport Services: a Healthwatch
In Sussex report on patient experiences 61 | P a g e
Not all respondents answered every part of Q14, but for most of the ten options respondents
said they were either ‘very satisfied’ or ‘satisfied’ and therefore gave a very strong positive
response to the following eight aspects of the service during the first COVID lockdown
period:
• Social distancing in transport - (97.5%, n80/82)
• Having access to PPE whilst travelling - (93.5%, n73/78)
• Ease of communicating with staff wearing PPE - (95%, n77/81)
• Cleanliness of transport - (95%, n77/81)
• Communications received to arrange transport - (87%, n65/75)
• Time spent travelling in vehicles - (88.5%, n69/78)
• Timeliness of pick-ups from home - (86.5%, n70/81)
• The ease of contacting the call centre - (83%, n53/64)
Passengers were less likely to be ‘very satisfied’ and therefore gave a very strong negative
response about the following aspects of the service (which would indicate that more needs
to be done to improve these areas):
• Notifications about delays or changes to schedule journeys - (62%, n42/68)
• Timeliness of transport when being picked up from hospital - (56%, n44/79)
Additional analysis has been performed to see whether any categories of passengers were
more or less satisfied with these two aspects of the service during COVID lockdown, or
whether there were differences by Healthwatch area. In performing this analysis, we have
combined responses for ‘very satisfied’ with ‘satisfied’ and ‘dissatisfied’ with ‘very
dissatisfied’. The results are represented in the two graphs below and reveals that:
53
80
73
77
77
65
42
69
70
44
11
2
5
4
4
10
26
9
11
35
0 20 40 60 80 100
Ease of contacting the call centre (64)
Social distancing in transport (82)
Access to PPE (78)
Communicating with staff wearing PPE (81)
Cleanliness of transport (81)
Communications about arranging transport (75)
Notifications of changes to journeys (68)
Time spent travelling to appointments (78)
Timeliness of pick- ups form home (81)
Timeliness of pick- ups from hospital (79)
Numbers of passengers
Asp
ect
of
journ
ey d
uri
ng C
OV
ID lockdow
n
Passenger satisfaction with aspects of their journeys made during COVID lockdown only
Dissatisfied Satisfied
Patient Transport Services: a Healthwatch
In Sussex report on patient experiences 62 | P a g e
• Renal patients were more likely than any other category of passenger to be dissatisfied
with these two aspects, whilst those who had used the service to attend just a handful
of appointments showed the lowest levels of dissatisfaction. Wheelchair passengers
and regular (non-renal) passengers showed similar levels of dissatisfaction.
• A far higher proportion of residents from Brighton and Hove were likely to be
dissatisfied with both aspects, compared with lower proportions of residents from East
Sussex and West Sussex.
• Two thirds of residents from Brighton and Hove were dissatisfied with the timeliness of
their pickups from hospital.
• At least one quarter (or more) of residents from all three Healthwatch areas who had
used the service during lockdown were dissatisfied with both aspects.
These findings may help to explain why residents from Brighton and Hove showed the lowest
levels of overall satisfaction with the service.
50%
39%36%
45%
35%
28%
21%
27%
0%
10%
20%
30%
40%
50%
60%
Renal patients Regular passengers(non-renal)
To attend handful ofapps
Wheelchair passengers
% o
f p
asse
nge
rs d
issa
tisf
ied
Category of passenger
Category of passengers dissatisfied with two aspects of their transport during COVID lockdown
Timeliness of pick up from hospital Notifications about transport changes
47%
27% 30%
67%
32%
43%
0%
10%
20%
30%
40%
50%
60%
70%
80%
Brighton and Hove East Sussex West Sussex
% o
f all p
ass
engers
fro
m a
rea w
ho u
sed
serv
ice in lockdow
n
Healthwatch area and aspect of journey
Passengers dissatisfied with two aspects of their journeys during lockdown shown by place of residence
Notifications received Timeliness of pick up from hospital
Patient Transport Services: a Healthwatch
In Sussex report on patient experiences 63 | P a g e
(c) Additional analysis of those passengers who were dissatisfied with these
two aspects
In total, 26 passengers said they were dissatisfied with the notifications they had received
about any delays or changes to their schedule journeys. Of these 26 people (multiple
responses were possible to identify the category of passenger):
- 21/26 (81%) were renal patients. This equates to 35% of the 60 renal patients who had
used the service during lockdown.
- 5/26 (19%) had used the service to attend regular appointments (non-renal). This
equates to 28% of the 18 passengers who had used the service during lockdown to
attend appointments.
- 3/26 (11.5%) had used the service to get to a just a handful of appointments. This
equates to 21% of the 14 passengers who had used the service during lockdown to
attend a handful of appointments.
- 3/26 (11.5%) were wheelchair passengers. This equates to 27% of the 11 passengers
who needed a vehicle that could accommodate a wheelchair.
- 7/26 (27%) were from the Brighton and Hove area. This equates to 47% of the 15
passengers from this area who has used the service during COVID lockdown.
- 10/26 (38.5%) were from the East Sussex area. This equates to 27% of the 37
passengers from this area who has used the service during COVID lockdown.
- 9/26 (34.5%) from the West Sussex area. This equates to 30% of the 30 passengers from
this area who has used the service during COVID lockdown.
In total, 35 passengers said they were dissatisfied with the timeliness of their transport
when being picked up from hospital. Of these 35 people:
- 30/35 (86%) were renal patients. This equates to 50% of the 60 renal patients who had
used the service during lockdown.
- 7/35 (20%) had used the service to attend regular appointments (non-renal). This
equates to 39% of the 18 passengers who had used the service during lockdown to
attend appointments.
- 5/35 (14%) had used the service to get to a just a handful of appointments. This
equates to 36% of the 14 passengers who had used the service during lockdown to
attend a handful of appointments.
- 5/35 (14%) were wheelchair passengers. This equates to 45% of the 11 passengers who
needed a vehicle that could accommodate a wheelchair.
- 10/35 (28.5%) were from the Brighton and Hove area. This equates to 67% of the 15
passengers from this area who had used the service during COVID lockdown.
- 12/35 (34%) were from the East Sussex area. This equates to 32% of the 37 passengers
from this area who had used the service during COVID lockdown.
- 13/35 (37%) from the West Sussex area. This equates to 43% of the 30 passengers from
this area who had used the service during COVID lockdown.
Patient Transport Services: a Healthwatch
In Sussex report on patient experiences 64 | P a g e
(d) Was the service better, worse or the same during lockdown? Question 15 asked respondents who had used the service during lockdown why they felt it was
either better, the same, or worse compared to other times they had used it. 83 respondents
were eligible to answer this question, but one person elected not to (= n82). 9 respondents
indicated that they had only used it during lockdown but at no other time and so could not
answer Question 15. This data is shown in the Data Tables, Appendix One, Q15 and 16, and in
the pie chart and comments below. Of the remaining 73 respondents:
• 46/73 (63%) respondents said the
service had been the same during
lockdown as at any other time. 34 of
these were renal dialysis patients.
• 23/73 (31.5%) respondents said the
service had been better during
lockdown. 19 of these were renal
dialysis patients.
• 4/73 (5.5%) respondents said the
service had been worse during
lockdown. All 4 were renal dialysis
patients.
Comments received
Question 16 allowed respondents to explain why
they felt the service was the same, better, or
worse during lockdown. 51 respondents provided
free text comments.
The same: 23 people said the service had been
the same during lockdown as at other times.
Comments were positive (11), neutral (6), and
negative (6).
Better: 21 comments were received from
people who said the service had been better
during lockdown. From these, we identified
three key themes. Some people said more than
one positive thing about their journeys, making
26 comments overall:
o Single patient pick-ups/ travelling alone
was better (8 people)
o The journey time was quicker (7 people)
o Improved timeliness of picks / drop offs
(4 people)
o Other (7 people).
NEUTRAL COMMENTS “Nothing differed, bit more clean.” - East Sussex resident “Separate vehicles not really necessary. All masks being worn.” - West Sussex resident
“It was the same.” - West Sussex resident
Same63%
Better31.5%
5.5%Worse
Passengers' views on the service during COVID lockdown compared to other times
(Q15)
Same
Better
Worse
POSTIVE COMMENTS “More reliable and consistent pick up. - Brighton resident “Less people using the hospital so more transport.” - East Sussex resident “Infection control was very carefully thought through and transport disinfected. Staff were fantastic.” - East Sussex resident
Patient Transport Services: a Healthwatch
In Sussex report on patient experiences 65 | P a g e
Worse: 4
comments were
received from
passengers who
said the service
had been worse
during lockdown,
including:
(e) Satisfaction levels with the service during COVID-19 lockdown We examined how the 83 respondents who had used the service during lockdown had rated
the service in terms of overall satisfaction and recommendation levels. This data is shown in
the Data Tables, Appendix Two, Q13, and revealed that:
• 84% (n70/83) of passengers were ‘very satisfied’ or ‘satisfied’
• 88% (n73/83) of passengers were ‘very likely’ or likely’ to recommend others to apply
for the service.
Additional analysis has been performed to see whether any group or category of passenger
was more or less satisfied with different aspects of the service during COVID lockdown, or
whether there were differences by Healthwatch area. The results are shown in the Data
Tables, Appendix Two, Q13, and the bar chart below in which we have combined responses
for ‘very satisfied’ with ‘satisfied’ and ‘dissatisfied’ with ‘very dissatisfied’.
60%
84%
97%
67%
89%
97%
0% 20% 40% 60% 80% 100%
Brighton and Hove (B&H) 15 respondents
East Sussex (excluding B&H) 37respondents
West Sussex 30 respondents
Passengers’ satisfaction with their transport during COVID-19 lockdown by Healthwatch area
Likely or very likely to recommend Satisfied or very satisfied
NEGATIVE COMMENTS “Times for collection and return varied a lot. Had to wait a
long time for the return journey.” - West Sussex resident “Times to be picked up from the hospital was a lot longer than usual.” – Hove resident “Because there weren’t enough drivers.” - Brighton resident “The timing of arrival was extremely inconsistent. It was as if there was no logic in the timetable.” – East Sussex resident
Patient Transport Services: a Healthwatch
In Sussex report on patient experiences 66 | P a g e
This analysis reveals that:
• Nearly all passengers (97%, n29/30) from West Sussex who had used the service during
lockdown would recommend the service and were satisfied with it.
• A high proportion of passengers from East Sussex who had used the service during
lockdown would recommend the service (89%, n33/37), and were satisfied with it (84%,
n31/37).
• Passengers from Brighton and Hove who had used the service during lockdown were
less likely to recommend the service (67%, n10/15), or to be satisfied with it (60%,
n9/15). The passengers who were dissatisfied unlikely to recommend the service were
renal patients or wheelchair passengers.
• Two passengers from East Sussex and the one passenger from West Sussex who were
dissatisfied with the service or would not recommend it during COVID lockdown were
all renal patients.
The analysis of different categories of passengers who had used the service during the COVID-
19 lockdown period, and their overall satisfaction and recommendation levels revealed the
following:
• All categories of passengers who had used the service during lockdown recorded high
recommendation ratings ranging from 87% for renal patients up to 100% of passengers
who had used the service to attend a handful of appointments only.
• Satisfaction levels with the service during lockdown were more varied with renal
patients recording the highest ratings (85%), followed by those who had used the
service to attend a handful of appointments only (79%), and regular (non-renal)
passengers (78%). Only 64% of wheelchair passengers were ‘very satisfied’ or ‘satisfied’
with the service meaning that one third were not. This is shown in the Data Tables,
Appendix Two, Q13.
(C) Passengers tell us about any delays, changes and problems with their
transport or journeys
People were asked five questions about their experiences of using the service
overall. This related to all journeys made at any time, although we asked people
to consider journeys made within the last 12 months:
• Question 17 asked people to say whether they had or had not experienced any delays,
changes, or problems with their scheduled journeys or transport. This was a single
answer question. People who answered ‘yes’ were redirected to Q18. 125 respondents
were eligible to answer this question, and 74 respondents (59%) indicated that they
had experienced delays, changes, or problems with aspects of the service.
• Question 18 asked respondents to consider different aspects of the timeliness of their
transport or journeys. We specifically asked if they had experienced any delays,
changes, or problems from a stated list of ten options. There were multiple options to
consider, and respondents could select a single answer per option from either ‘never’,
rarely’, often’, or ‘very often’. 74 respondents were eligible to answer this
question, and of these, 80% or more had ‘never’ or ‘rarely’ experienced issues with
Patient Transport Services: a Healthwatch
In Sussex report on patient experiences 67 | P a g e
five of the options we presented them with, whilst between 25% to 68% of people
had experienced issues with the remaining five options ‘often’ or ‘very often’.
• Question 19 asked people who had experienced unexpected delays, changes, or
problems with their transport or journeys to describe the impacts, if any, that these
issues had caused them. There were multiple options to consider, including a ‘no
impact’ option, with a single answer permissible per option ranging from ‘never’
through to ‘very often’. Q19a was a free text question which allowed for people to
describe ‘other’ impacts not listed. 74 respondents were eligible to answer this
question, and 72 did so. Of these, 18 respondents (25%) said that there had been
‘no impacts’ for them. 54 passengers (75%) said that there had been impacts for
them.
• Question 20 asked respondents to consider a further five possible scenarios which
were not related to the timeliness of their transport or journeys. This question was not
filtered meaning that all 125 respondents could in theory answer this. There were
multiple options to consider, and respondents could select a single answer per option
from either ‘never’, rarely’, often’, or ‘very often’. 125 respondents were eligible to
answer this question and differing numbers of people chose to provide an answer to
the five options (a)-(e), ranging from 115-120.
Some of the key findings
Passengers who experienced delays, changes, or problems with their transport /
journeys 59% of passengers (n74/125) told us that they had experienced some form of delay, change,
or problem with their transport or journeys. 37.5% (n47) said they had not experienced any
delays, changes, or problems.
When we asked these 74 passengers to consider ten potential timeliness issues 80% told us
that they had ‘never’ or ‘rarely’ experienced issues with five of the options we presented
them with, whilst between 25% to 68% of people had experienced issues with the remaining
five options ‘often’ or ‘very often’. Overall, a total of 82% (n61/74) passengers reported that
they had experienced at least one of the ten issues we asked them to consider either ‘often’
or ‘very often’. 44% of passengers had experienced between 2-4 issues, and 23% had
experienced between 5-9 issues.
When we asked passengers to consider a further five issues which were not related to
timeliness, at least 80% or more of respondents indicated that they had ‘never’ or rarely’
experienced problems with the following aspects of their transport or journeys: travelling
with others where this was not appropriate (85%), travelling alone without their carer/other
support (88.5%), drivers appearing untrained in their condition (86%), not being able to take
essential belongings with them (95%), and transport being inappropriate for their needs (87%).
Patient Transport Services: a Healthwatch
In Sussex report on patient experiences 68 | P a g e
In addition, at least 50% or more of respondents indicated that they had ‘never’ experienced
problems with the following aspects of their transport or journeys: missing appointments due
to delays or changes (51.5%), same day cancellations of their journeys (58.5%), having to
make their own way home due to transport delays (59%), and having to make their own way
to hospital due to delays (71%).
10% or more of respondents indicated that they had experienced problems with the following
aspects of their transport or journeys, which would indicate that more could be done to
improve these areas: travelling with others where this was not appropriate (14%), travelling
alone without their carer/other support (12.5%), drivers appearing untrained in their
condition (14.5%), transport being inappropriate for their needs (13%).
Problems experienced by passengers
Of particular concern is the high proportion of passengers (68%) who told us that they had
experienced a delayed pick up from hospital. This was the only issue which residents from all
three Healthwatch areas told us that they had experienced ‘often’ or very often’. This ties in
with our earlier finding that 56% of respondents had experienced issues with the timeliness of
transport when being picked up from hospital.
In addition, one third or more of passengers had experienced problems with the following
aspects of their transport or journeys ‘often’ or ‘very often’: delayed pick up from home
(32%), changes to scheduled vehicle (38%), and longer journey times home than expected
(33%).
Renal patients were more likely to say they had been affected ‘often’ or ‘very often’ by
changes to scheduled vehicles (73%, n19/26 passengers affected by this issue) and having to
make their own way home due to transport delays (69%, n9/13 passengers affected by this
issue). They were also the group who were most likely to experience transport not being
inappropriate for their needs (56%, n9/16).
Residents from Brighton and Hove experienced a greater number of different issues compared
to residents from East Sussex or West Sussex. 36% of Brighton and Hove residents reported
experiencing 5 or more issues.
Impacts of any delays, changes, or problems
55 passengers (76%) said that the delays, changes, or problems they had experienced had
resulted in negative impacts for them.
Of the 55 passengers who said that there had been impacts for them (multiple answers were
possible and so the percentages add up to more than 100%):
• 46 (84%) said they had experienced anxiety or stress.
• 19 (34.5%) said they had missed meals.
• 13 (23.5%) said they had incurred a financial cost.
• 9 (16%) said they had missed medication.
• 7 (13%) said they had missed their carer.
Patient Transport Services: a Healthwatch
In Sussex report on patient experiences 69 | P a g e
The provider should identify actions to limit passengers’ missing meals; experiencing
delays in being picked up from hospital after their treatment; incurring any additional
financial costs (associated with delayed transport), and/or experiencing stress and anxiety
Our recommendations are therefore:
We recommend that the provider carry out a mapping exercise to provide them with a
clearer picture of where passengers live, and why they use the service. Improved
scheduling of transport should help to reduce the number of delayed pick-ups. This also
relates to additional recommendations contained later in this report to provide renal
patients with nominated drivers and a dedicated renal transport service. Understanding
where patients live will assist with the delivery of these targeted services.
(As highlighted later) we recommend that the service deploy a range a technological
solutions to better communicate with passengers and use these to keep passengers
informed of changes to their transport/journeys. Passengers should be able to track their
vehicles using a mobile phone app, but drivers or the call centre should contact every
passenger by text or phone telling them when their vehicle is 30 minutes away.
We recommend that the service provider should employ a full-time transport planner to
identify a long-term approach which can help to ensure that the hospital pickup element
of the service becomes more reliable, with improved timeliness.
Delays, changes, or problems with transport: results in detail
(a) Passengers tell us about unexpected delays, changes, or problems with
their scheduled transport or journeys
We asked people to say whether they had
experienced any unexpected delays, changes,
or problems with their scheduled transport or
journeys. 125 respondents were eligible to
answer this question, and 74 respondents
(59%) indicated that they had experienced
delays, changes, or problems with various
aspects of the service. 47 respondents said
they had not experienced any problems
(37.5%), whilst 4 respondents indicated that
they either did not know or could not recall.
This data is shown in the Data Tables,
Appendix One, Q17, and the pie chart.
59%
37.5%
3.5%
Passengers who said they had experienced delays, changes, or problems with their scheduled
journeys (Q17)
Yes
No
Don't know /can't recall
Patient Transport Services: a Healthwatch
In Sussex report on patient experiences 70 | P a g e
The 74 passengers who had experienced any problems were asked a series of follow-on
questions (Q18 and Q20) to explore 15 specific aspects of their transport or journeys. Ten of
these aspects related to different scenarios which could affect the timeliness of their
transport or journeys (Q18), whilst the remaining five aspects related to wider issues that
might be important to passengers, such as whether their transport was appropriate for their
needs (Q20).
We examined the data received to these two questions to determine the proportions of
passengers who had selected either a positive or negative response to enable us to identify
any patterns. We concluded that a positive response for both questions 18 and 20 was one
where passengers had selected either ‘never’ or ‘rarely’ to describe whether they had
experienced one of the 15 options. Conversely, a negative response was one where
passengers selected ‘often’ or ‘very often’. The full results for this analysis are shown in the
Data tables, Appendix One, Q18 and Q20, but we discuss these in more detail below.
For questions 18 and 20, a high proportion of respondents selected a positive response for
most of the various 15 aspects we asked them to consider. As this is the case, we have
identified where 80% or more of passengers gave a positive response which we consider
indicates a very strong positive response overall by passengers, and 50% to highlight a strong
positive response. Similarly, as a low proportion of respondents selected a negative response
for most of the various options provided at Q18 and 20, we have applied an 25% threshold to
highlight where a very strong negative response was recorded overall, and 10% to highlight a
strong negative response.
(b) Timeliness aspects of peoples’ transport and journeys (Q18) 74 respondents who had answered ‘yes’ to Q17 (i.e., those who said that they had
experienced any issues with their transport or journeys) were filtered through to Q18. Of the
74 respondents who answered Q18, the degree to which they had experienced any delays,
changes, or problems is shown in the Data Tables, Appendix One, Q18 and the graphs below.
Not all respondents answered every part of Q18 (a)-(j).
- Issues ‘never’ experienced by passengers
At least 50% or more of passengers indicated that they had ‘never’ experienced problems with
the following aspects of their transport or journeys, and therefore gave a strong positive
response for:
• Having to make their own way to hospital due to transport delays - (71%, n49/69)
• Having to make their own way home due to transport delays - (59%, n41/69)
• Same day cancellations of their journeys - (58.5%, n41/70)
• Missing appointments due to transport delays or changes - (51.5%, n36/70)
- issues experienced ‘very often’ by passengers
At least 10% or more of passengers had experienced the following problem ‘very often’, and
gave a strong negative response for:
• Delayed pick up from hospital - (15%, 11/72)
Patient Transport Services: a Healthwatch
In Sussex report on patient experiences 71 | P a g e
- Issues experienced ‘never’ or ‘rarely’ by passengers
We have combined responses to determine that 80% or more of passengers indicated that they
had ‘never’ or ‘rarely’ experienced problems with the following aspects of their transport or
journeys, and therefore gave a very strong positive response for:
• Having to make their own way to hospital due to transport delays - (91%, n63/69)
• Same day cancellations of their journeys - (86%, n60/70)
• Missing appointments due to transport delays or changes - (81.5%, n57/70)
• Having to make their own way home due to transport delays - (81%, n56/69)
• Longer journey times to hospital than expected - (80%, n56/70)
- Issues experienced ‘often’ or ‘very often’ by passengers
At least 25% or more of passengers indicated that they had experienced problems with the
following aspects of their journeys made by the service ‘often’ or ‘very often’, and therefore
gave a strong negative response, which would indicate that more needs to be done to
improve these areas. Of particular concern is the high proportion of passengers (68%)
experiencing a delayed pick up from hospital which ties in with our earlier finding that 56% of
respondents had experienced issues with the timeliness of transport when being picked up
from hospital:
• Delayed pick up from hospital - (68%, n49/72)
• Changes to scheduled vehicle - (38%, n26/68)
• Longer journey times home than expected - (33%, n23/70)
• Delayed pick up from home - (32%, n22/69)
• Difficulties finding out the whereabouts of transport - (26%, n18/70)
For Q18, a total of 61/74 (82%) passengers reported that they had experienced at least one of
the ten issues (options (a)-(j) given at Q18) that we asked them to consider either ‘often’ or
‘very often’. Although the remaining 13 passengers had previously indicated at Q17 that they
had experienced some type of issue with their journeys or transport they then went on to
state at Q18 that they had ‘never’ or ‘rarely’ experienced any of the ten issues that we asked
them to consider. Passengers could of course have experienced different issues to those we
had listed.
This bar chart shows the
number of different issues
experienced by passengers
either ‘often’ or ‘very often’
only. As can be seen, most
passengers experienced just
one issue (33%, n20/61),
whilst 44% (n27/61)
experienced between 2-4
issues, and 23% (n14/61)
experienced between 5-9
issues. This data is shown in
the Data Tables, Appendix
Two, Q18.
13
20
12
7 84 3
14
20
0
5
10
15
20
25
None/otherissuenot
listed
One Two three Four Five Six Seven Eight Nine Ten
Num
ber
of
pass
engers
Number of issues experienced 'often' or 'very often'
The number of different issues experienced by passengers with their transport 'often' or 'very
often'
Patient Transport Services: a Healthwatch
In Sussex report on patient experiences 72 | P a g e
(c) Categories of passenger affected by timeliness issues (Q18) We have performed additional analysis of the 61 individuals who said that they had
experienced at least one of the ten issues to identify which categories of passengers were
affected. Respondents could choose multiple options and the 61 passengers reported a total
of 92 issues or problems. This is shown in the Data Tables, Appendix Two, Q18, and displayed
in the pie chart below. As not all respondents answered every part of Q18, the table shows
the number of respondents who reported one or more of the options (a)-(j) i.e., the 37 renal
patients reported experiencing 40% of the 92 issues. Overall, renal patients reported
experiencing more issues with their transport more than any other groups.
17.5%
4%
51.5%
58.5%
35%
59%
71%
47%
40%
34%
50.5%
28%
30%
27%
26.5%
22%
20%
27%
40%
33%
29%
53%
14%
10%
34%
16%
6%
21.5%
16%
26%
3%
15%
4%
4%
4.5%
3%
3%
4.5%
4%
7%
0% 20% 40% 60% 80%
Delayed pick up from home (69)
Delayed pick up from hospital (72)
Missed appointments due to PTS transport delays (70)
Same day cancellations (70)
Changes to scheduled vehicle (68)
Making own way home due to PTS transport delays etc (69)
Making own way to hospital due to PTS delays etc (69)
Difficulties finding whereabouts of transport (70)
Longer journey times to hospital than expected (70)
Longer journey times home than expected (70)
% of passengers who reported problem
Asp
ect
of
jou
rney
s
How often passengers experienced delays, changes, or problems with the following aspects of their journeys (Q18)
Very often Often Rarely Never
Patient Transport Services: a Healthwatch
In Sussex report on patient experiences 73 | P a g e
We have also analysed this data to determine if certain categories of passengers were more
or less likely to have been affected by each of the ten issues ‘often’ of ‘very often’. This is
shown in the Data Tables, Appendix Two, Q18, and has revealed the following:
Renal patients were the group most likely to report experiencing:
• Delayed pick-up from home – 9/22 passengers affected by this issue (41%)
• Delayed pick up from hospital – 28/49 passengers affected by this issue (57%)
• Changes to scheduled vehicles - 19/26 passengers affected by this issue (73%)
• Having to make their own way home
due to transport delays – 9/13 passengers affected by this issue (69%)
Regular patients were the group most likely to experience:
• Same day cancellations – 5/10 passengers affected by this issue (50%)
• Having to make their own way to
hospital due to transport delays – 3/6 passengers affected by this issue (50%)
• Difficulties finding out the whereabouts
of their vehicle – 7/18 passengers affected by this issue (39%)
• Longer journey times home than
expected - 9/23 passengers affected by this issue (39%)
Passengers who used the service to attend just a handful of appointments were the group
most likely to report experiencing:
• Missed appointments due to
transport delays - 6/13 passengers affected by this issue (46%)
• Longer journey times to hospital
than expected - 6/14 passengers affected by this issue (43%)
40%
15%
14%
9%
22%
Category of passenger that reported at least one or more issues with their transport (Q18)
Renal patients (37)
Regular (non-renal)passengers (14)
To attend handful of apps(13)
Wheelchair passengers (8)
Used in COVID lockdown (20)
Patient Transport Services: a Healthwatch
In Sussex report on patient experiences 74 | P a g e
(d) Timeliness issues experienced by passengers from each Healthwatch area
(Q18) Additional analysis of the 61 passengers who reported
experiencing one of the ten issues listed at Q18 has
revealed that more residents from East Sussex
experienced at least one issue (refer to the table).
However, residents from and Brighton and Hove
experienced a larger number of different issues
compared to residents from East Sussex or West
Sussex, as is shown in the stacked bar chart below.
The greatest proportion of
Brighton and Hove residents
reported experiencing 5 or
more issues, at 36% (n5/14).
For East Sussex, the greatest
proportions of residents
experienced either just one
issue or 3-4 issues, both at 31%
(n8/26).
For West Sussex, the greatest
proportions of residents
experienced just one issue at
43% (n9/21).
These numbers may go some way to explaining the different satisfaction levels recorded
across the three Healthwatch areas (Brighton and Hove: 56.5%, East Sussex 75%, West Sussex
97%).
Issues experienced across the Healthwatch areas
Our analysis shown in the Data Tables, Appendix Two, Q18, shows that there was only issue
which residents from all three areas experienced ‘often’ or ‘very often’, which was ‘delays in
being picked up from hospital’. This supports the overall finding (described earlier) that 68%
of all passengers indicated that they had experienced this issue.
High proportions of residents from Brighton & Hove experienced issues ‘often’ or ‘very often’
with ‘changes to scheduled vehicles’ (50%, n7/14), and ‘longer journey times travelling home
than expected’ (57%, 8/14). This latter issue may imply that some Brighton and Hove
residents are being dropped off at home after other residents who must travel further
distances. The fact that few residents from Brighton and Hove experienced issues with
‘longer journey times to hospital than expected’ would point to some discrepancies affecting
the planning of their journeys to hospital and home again. This could suggest that better
geographical planning of transport would benefit these residents. Overall, 33% of passengers
% or residents from each Healthwatch
area who reported experiencing at least
one issue
Brighton and Hove 14/61 (23%)
East Sussex 26/61 (43%)
West Sussex 21/61 (34%)
36%21% 21% 21%
23%
31%15%
31%
14%19%
24%
43%
0%
20%
40%
60%
80%
100%
5 or more issues 3 or 4 issues 2 issues 1 issue
% o
f pass
engers
experi
encin
g iss
ues
Number of issues experienced by passengers
Number of issues experienced by passengers 'very often' or 'often' shown by Healthwatch area
Barbican Suite Greencoat House 32, St Leonards Road Eastbourne BN21 3UT Email: [email protected] Phone: 0333 101 4007 Website: www.healthwatcheastsussex.co.uk Social media
Healthwatch West Sussex PO Box 1343 Crawley West Sussex RH10 0QH Email: [email protected] Phone: 0300 012 0122 Website: www.healthwatchwestsussex.co.uk Social media