35
Performance Excellence Overview February 01, 2013 Jared Quinton, MHSM, ASQ CSSBB Director, Performance Excellence UC Davis Health System
| Date post: | 27-Mar-2018 |
| Category: |
Documents |
| Upload: | hoangduong |
| View: | 226 times |
| Download: | 2 times |
Performance Excellence Overview
February 01, 2013
Jared Quinton, MHSM, ASQ CSSBB Director, Performance Excellence
UC Davis Health System

Serving 6 million residents in 33 counties encompassing 65,000 square miles
Major educational, research and patient-care facilities spread across more than 140 acres
Only Level 1 trauma center for both adult and pediatric emergencies in inland Northern California Licensed beds 619
Admissions 31,025 ED Visits 58,023 Clinic Visits 893,788

Competitor Intelligence
Consumer Information
Demographic & Economic
Policy, Regulatory &
Legislative
Financial Analysis
Human Resources
Infrastructure
Quality & Safety
Market Share Outmigration Alliances New Programs
Financial ratios Service line profitability Payor mix Efficiency measures
Patient Satisfaction Market Research Awareness / Perception
Population growth / stratification
Labor supply / demand Income / Employment Other regional business
developments
Federal/State/Local legal and health regulatory mandates
Publicly reported data Industry/Professional
organizations Partners/Collaborators
Recruitment Satisfaction Retention / Turnover Labor Expenses
Capital requirements Facilities / Equipment
requirements Capacity Market projections Program growth
Quality metrics Safety metrics Service line utilization
(statistics, trends, projections)

Performance Excellence A HEALTHIER WORLD THROUGH BOLD INNOVATION
Possible Data Sources @ UC Davis
Internal Data Sources:
External Data Sources:

Performance Excellence A HEALTHIER WORLD THROUGH BOLD INNOVATION
QI Challenges
Perception Culture

Performance Excellence A HEALTHIER WORLD THROUGH BOLD INNOVATION
Measure
Analyze
Improve
Control
Define
DMAIC Methodology

Performance Excellence A HEALTHIER WORLD THROUGH BOLD INNOVATION
Lean Six Sigma
Change
Management Patient
Experience
DMAIC Framework
Creating Value Through Quality Improvement
Value = 𝑄𝑄𝑄𝑄𝑄𝑄𝑄 𝑂𝑄𝑄𝑂𝑂𝑂𝑂𝑂+𝑆𝑄𝑆𝑂𝑄𝑄+𝑆𝑂𝑆𝑆𝑄𝑂𝑂𝐶𝑂𝑂𝑄 𝐹𝑂𝑆 𝑄 𝑂𝑠𝑄𝑠 𝑂𝑆 𝑂𝑄𝑆𝑂

Performance Excellence A HEALTHIER WORLD THROUGH BOLD INNOVATION
Why use ? DMAIC offers an organization: A shared methodology for problem solving A shared structure to meet goals A shared system-wide language A shared toolset that is transferable to all levels DMAIC fosters innovative improvement through high impact, value-added quality initiatives (QI) targeted to achieve system goals
Performance Excellence A HEALTHIER WORLD THROUGH BOLD INNOVATION
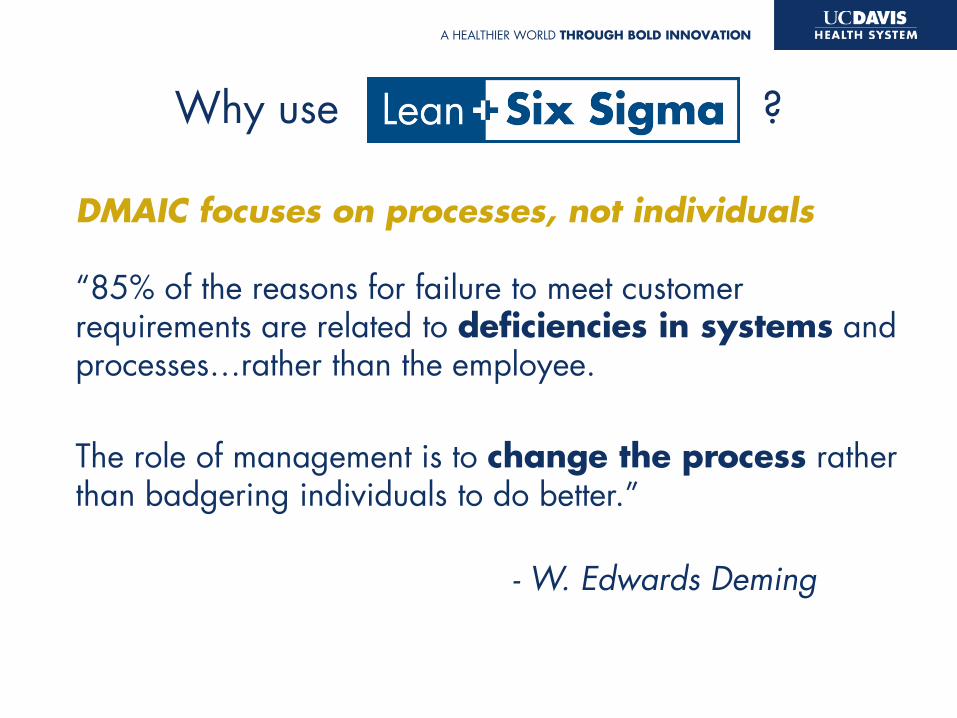
Why use ?
DMAIC focuses on processes, not individuals
“85% of the reasons for failure to meet customer requirements are related to deficiencies in systems and processes…rather than the employee. The role of management is to change the process rather than badgering individuals to do better.” - W. Edwards Deming
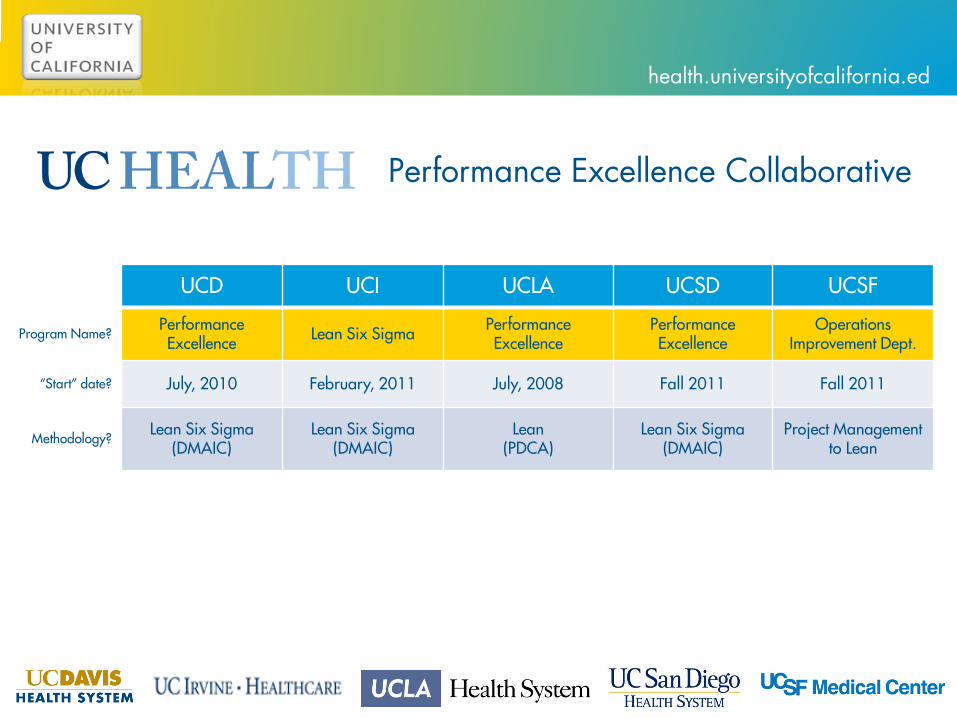
health.universityofcalifornia.edu
Performance Excellence Collaborative
UCD UCI UCLA UCSD UCSF
Program Name? Performance Excellence Lean Six Sigma Performance
Excellence Performance Excellence
Operations Improvement Dept.
“Start” date? July, 2010 February, 2011 July, 2008 Fall 2011 Fall 2011
Methodology? Lean Six Sigma
(DMAIC) Lean Six Sigma
(DMAIC) Lean
(PDCA) Lean Six Sigma
(DMAIC) Project Management
to Lean
Performance Excellence A HEALTHIER WORLD THROUGH BOLD INNOVATION
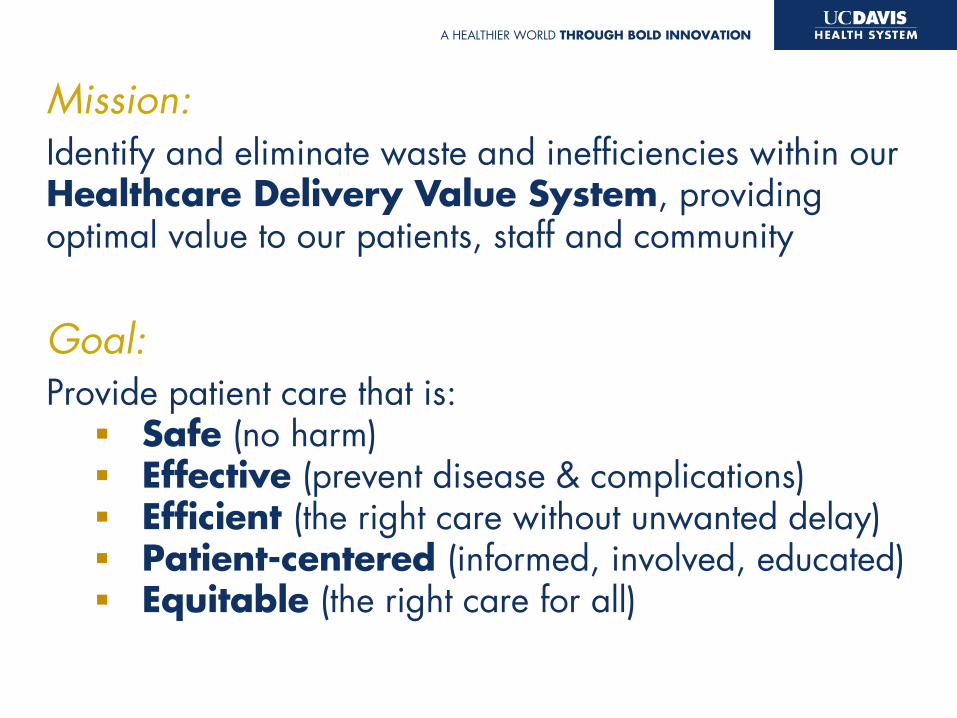
Mission: Identify and eliminate waste and inefficiencies within our Healthcare Delivery Value System, providing optimal value to our patients, staff and community Goal: Provide patient care that is: Safe (no harm) Effective (prevent disease & complications) Efficient (the right care without unwanted delay) Patient-centered (informed, involved, educated) Equitable (the right care for all)

Performance Excellence A HEALTHIER WORLD THROUGH BOLD INNOVATION
Performance Excellence (PE) Structure
Project Management
Consultative Support
Education & Training
Facilitate DMAIC project management and provide expertise in the art and science of quality improvement and change management
Provide just-in-time education and training on Lean Six Sigma methodologies in order to develop infrastructure for evolving process culture
Provide consultation and/or coaching to Health System teams that require support in analyzing current state processes and identifying improvement opportunities

Performance Excellence A HEALTHIER WORLD THROUGH BOLD INNOVATION
PE Department Organization
Lead Project Teams and Deliver Results
Guide & Facilitate DMAIC
Strategic Direction & Resource Commitment
Vision & Commitment UC Davis Medical Center
Chief Executive Officer
UC Davis Medical Center
Chief Patient Care Services Officer
PE Director
(Master Black Belt)
Project Manager
(Black Belt)
Project Manager
(Black Belt)
Medical Director
(Green Belt)
* While in the Division of Patient Care Services, the PE department works across the Health System
Performance Excellence A HEALTHIER WORLD THROUGH BOLD INNOVATION
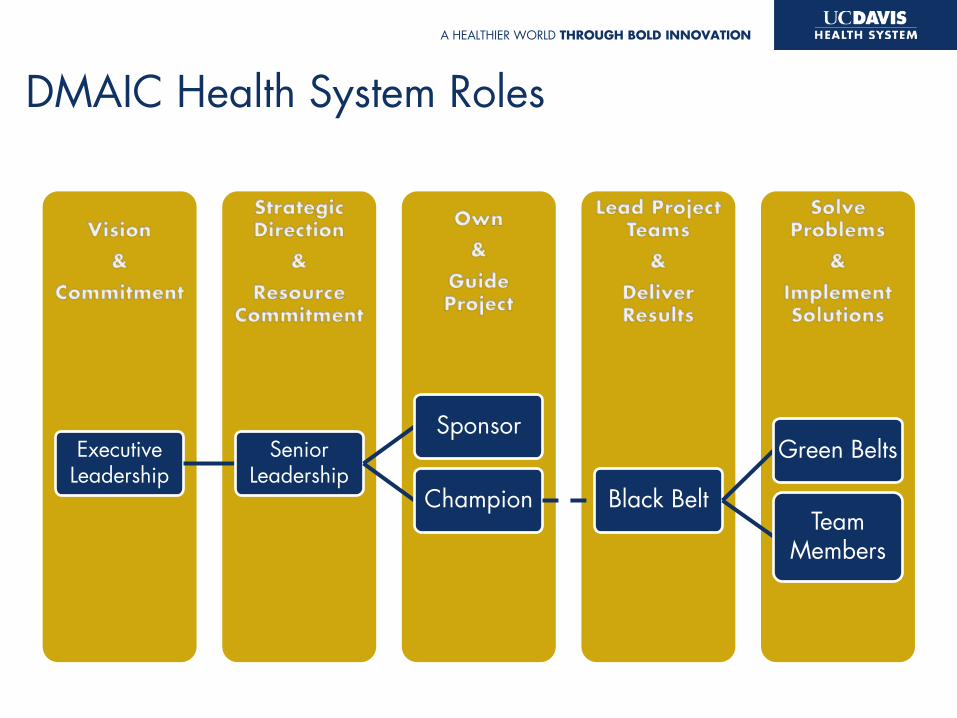
DMAIC Health System Roles
Executive Leadership
Senior Leadership
Sponsor
Champion Black Belt
Green Belts
Team Members

Performance Excellence A HEALTHIER WORLD THROUGH BOLD INNOVATION
Healthcare Delivery Value System
Quality Initiatives
(Projects)
Secondary
Driver
Primary
Driver AIM
Quality Improvement
clinical
flow
operations
finance
Outpatient Throughput
Clinical Case Management Intensive Case Mgmt
Inpatient Throughput ED Flow
Perioperative Services
Environmental Services Inpatient Discharge
Coding & Billing Charge Lag
HAI (VAP, CLABSI, CAUTI) Healthcare Acquired
Conditions
Sepsis Mortality

Performance Excellence A HEALTHIER WORLD THROUGH BOLD INNOVATION
What is ?
design processes with very high reliability, seeking to improve quality, delivery, and cost
A systematic methodology utilizing effective data analysis tools and techniques driven by DMAIC [deh-may-ihk]
Measure
Analyze
Improve
Control
Define

Performance Excellence A HEALTHIER WORLD THROUGH BOLD INNOVATION
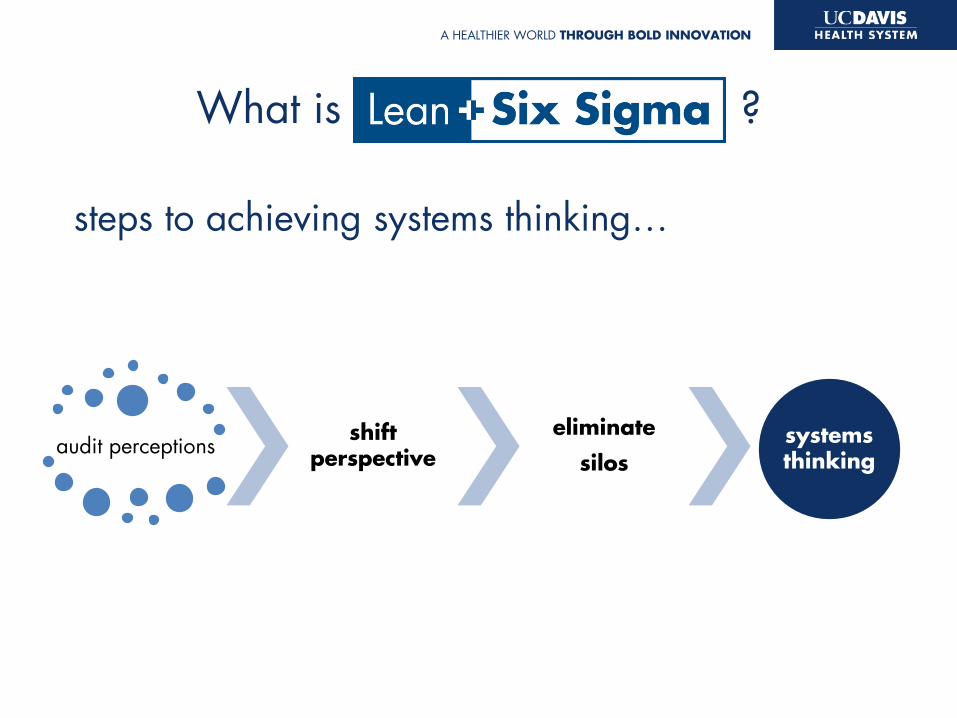
What is ?
*
*requires systems thinking
Performance Excellence A HEALTHIER WORLD THROUGH BOLD INNOVATION
What is ?
audit perceptions shift perspective
eliminate
silos systems thinking
steps to achieving systems thinking…

Performance Excellence A HEALTHIER WORLD THROUGH BOLD INNOVATION

Performance Excellence A HEALTHIER WORLD THROUGH BOLD INNOVATION
Define
Measure
Analyze
Improve
Control
y = f(x) data
collection data
analysis controlled
interventions sustainability
Charter Observe Process Map
Plan Collect Validate
Correlation Hypothesis Testing RCA
Generate Prioritize Pilot
Monitor Act
Determine Current State Obtain Future State
DMAIC up close…
Performance Excellence A HEALTHIER WORLD THROUGH BOLD INNOVATION
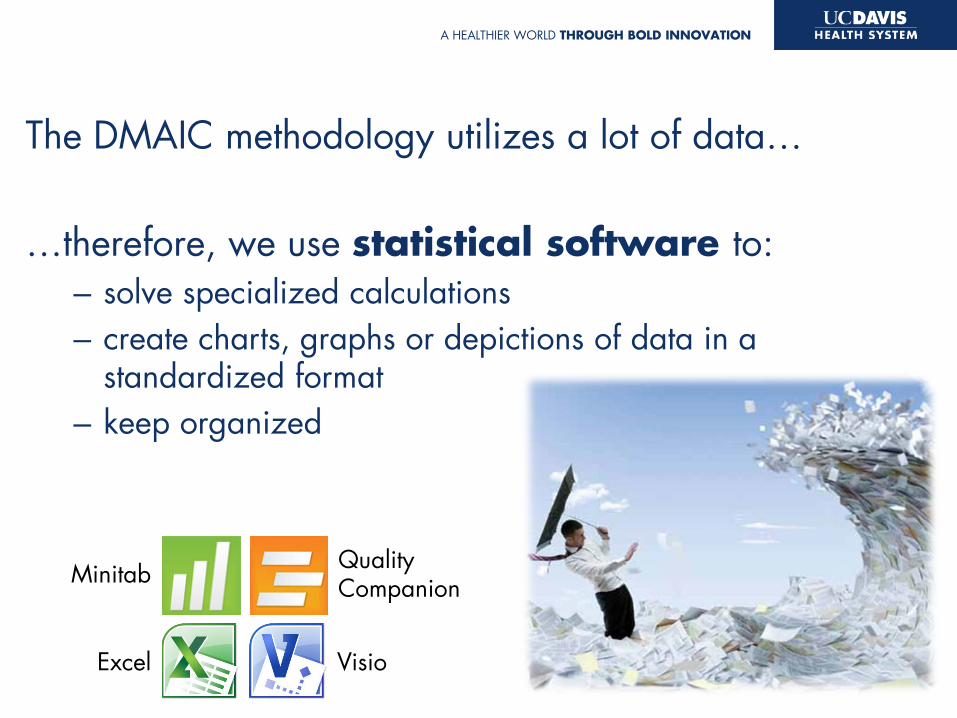
The DMAIC methodology utilizes a lot of data…
…therefore, we use statistical software to:
– solve specialized calculations – create charts, graphs or depictions of data in a
standardized format – keep organized
Minitab Quality Companion
Excel Visio

Performance Excellence A HEALTHIER WORLD THROUGH BOLD INNOVATION
The Role of DMAIC
data
detailed information
DMAIC tools reports
summary information
Access applicable data to monitor process performance
Perform analysis to identify and improve opportunities for improvement
Create and publish reports
Provide project management infrastructure Consult during requirement phase of tool
development Publish data dictionary for reporting tools

Performance Excellence A HEALTHIER WORLD THROUGH BOLD INNOVATION
PROJECT CHARTER PROBLEM STATEMENT: A brief description of the problem at hand and why it is a priority.
METRICS: Identify critical to “X” requirements. Quality / Cost / Process / Safety / Delivery Regulations and/or standards Benchmarks
GOALS / OBJECTIVES: Expected outcome of Quality Improvement process.
SCOPE: Identify operational or organizational boundaries.
Member Role Department Name 1
Name 2
Name 3
Name 4
Name 5
Name 6
Name 7
QI Leadership:
Executive Leadership: Name
__________________________________________________
QI Champion/Sponsor: Name
__________________________________________________
QI Black Belt: Name
__________________________________________________
Start Date: xx/xx/xxxx End Date: xx/xx/xxxx

Performance Excellence A HEALTHIER WORLD THROUGH BOLD INNOVATION
DEFINE:
A3
PROBLEM STATEMENT: A brief description of the problem at hand and why it is a priority.
PROCESS MAP / VALUE STREAM MAP (VSM):
MEASURE: Identify, collect and validate specific measurements that describe the process and reveal whether the goals have been achieved. SIPOC diagram Spaghetti diagram
CONTROL PLAN: Develop a control plan to monitor the process in order to sustain improvement. Control chart 5S Poka-yoke (mistake-proofing)
IMPROVE: Generate, prioritize and implement solution(s) to the stated problem. State result(s) of implemented improvement(s). Pilot Kaizen Standard work processes
ANALYZE: Identify the root cause(s) of stated problem. Ishikawa/Fishbone diagram Correlation testing Hypothesis testing FMEA
GOAL:
Expected outcome of Quality Improvement process.
SCOPE: Identify operational or organizational boundaries.
A B C

Performance Excellence A HEALTHIER WORLD THROUGH BOLD INNOVATION
PE Intranet Site General Information Resources Current Quality Initiatives Contact Information

Performance Excellence A HEALTHIER WORLD THROUGH BOLD INNOVATION
References American Society for Quality
– http://www.asq.org
Institute for Healthcare Improvement – http://www.ihi.org/IHI/Results/WhitePapers/GoingLeaninHealthCare.htm
Joint Commission Center for Transforming Healthcare – http://www.centerfortransforminghealthcare.org/leansixsigma.aspx
Johns Hopkins Center for Innovation in Quality Patient Care
– http://www.hopkinsmedicine.org/innovation_quality_patient_care/areas_expertise/lean_sigma
University of Michigan, College of Engineering, LSS for Healthcare
– http://interpro.engin.umich.edu/Healthcare.htm A Lean Guide to Transforming Healthcare (2006) Lean Done Right (2012)
– Thomas G. Zidel The Certified Six Sigma Green Belt Handbook The Certified Six Sigma Black Belt Handbook (Second Edition) The Certified Six Sigma Master Black Belt Handbook
– ASQ, Quality Press

QI Example 1
Improving Detection & Management of Severe Sepsis

Performance Excellence A HEALTHIER WORLD THROUGH BOLD INNOVATION
Severe Sepsis Detection & Management QI
Fully leverage the EHR Utilize Lean Six Sigma methodologies Partner with
– Gordon and Betty Moore Foundation – California Health Care Safety Net Institute – University HealthSystem Consortium
Comply with the UCDMC DSRIP Proposal
Improvement of severe sepsis detection and management to reduce unnecessary death and harm attributable to sepsis

Performance Excellence A HEALTHIER WORLD THROUGH BOLD INNOVATION
Sepsis Improvement Collaborative
Performance Excellence A HEALTHIER WORLD THROUGH BOLD INNOVATION
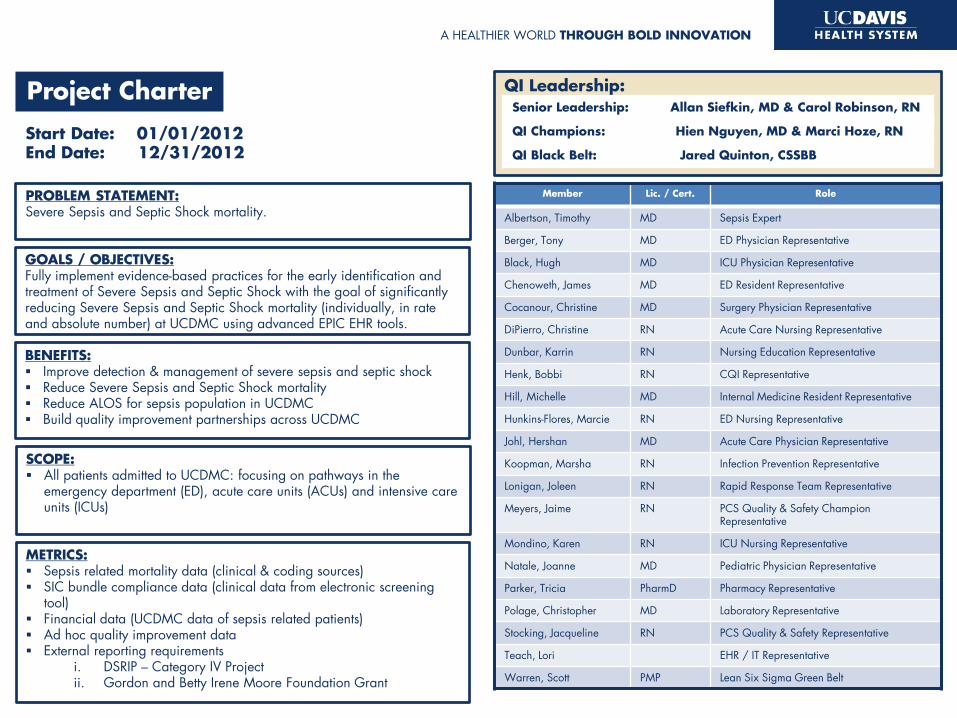
PROBLEM STATEMENT: Severe Sepsis and Septic Shock mortality.
METRICS: Sepsis related mortality data (clinical & coding sources) SIC bundle compliance data (clinical data from electronic screening
tool) Financial data (UCDMC data of sepsis related patients) Ad hoc quality improvement data External reporting requirements
i. DSRIP – Category IV Project ii. Gordon and Betty Irene Moore Foundation Grant
GOALS / OBJECTIVES: Fully implement evidence-based practices for the early identification and treatment of Severe Sepsis and Septic Shock with the goal of significantly reducing Severe Sepsis and Septic Shock mortality (individually, in rate and absolute number) at UCDMC using advanced EPIC EHR tools.
SCOPE: All patients admitted to UCDMC: focusing on pathways in the
emergency department (ED), acute care units (ACUs) and intensive care units (ICUs)
Member Lic. / Cert. Role
Albertson, Timothy MD Sepsis Expert
Berger, Tony MD ED Physician Representative
Black, Hugh MD ICU Physician Representative
Chenoweth, James MD ED Resident Representative
Cocanour, Christine MD Surgery Physician Representative
DiPierro, Christine RN Acute Care Nursing Representative
Dunbar, Karrin RN Nursing Education Representative
Henk, Bobbi RN CQI Representative
Hill, Michelle MD Internal Medicine Resident Representative
Hunkins-Flores, Marcie RN ED Nursing Representative
Johl, Hershan MD Acute Care Physician Representative
Koopman, Marsha RN Infection Prevention Representative
Lonigan, Joleen RN Rapid Response Team Representative
Meyers, Jaime RN PCS Quality & Safety Champion Representative
Mondino, Karen RN ICU Nursing Representative
Natale, Joanne MD Pediatric Physician Representative
Parker, Tricia PharmD Pharmacy Representative
Polage, Christopher MD Laboratory Representative
Stocking, Jacqueline RN PCS Quality & Safety Representative
Teach, Lori EHR / IT Representative
Warren, Scott PMP Lean Six Sigma Green Belt
QI Leadership: Senior Leadership: Allan Siefkin, MD & Carol Robinson, RN
QI Champions: Hien Nguyen, MD & Marci Hoze, RN
QI Black Belt: Jared Quinton, CSSBB
Start Date: 01/01/2012 End Date: 12/31/2012
BENEFITS: Improve detection & management of severe sepsis and septic shock Reduce Severe Sepsis and Septic Shock mortality Reduce ALOS for sepsis population in UCDMC Build quality improvement partnerships across UCDMC
Project Charter

Performance Excellence A HEALTHIER WORLD THROUGH BOLD INNOVATION
DEFINE:
SIC Mortality Rate
PROBLEM STATEMENT: Sepsis related mortality at UCDMC
MEASURE:
CONTROL PLAN: Sepsis Improvement Collaborative work products
IMPROVE: Sepsis Improvement Collaborative work products
ANALYZE:
GOAL: By December 2012: Reduce combined severe sepsis and septic shock mortality by ≥15% Reduce severe sepsis mortality by ≥15% Reduce septic shock mortality by ≥15%
in percentage rate and absolute numbers from 2009 baseline data
SCOPE: All UCDMC patients (ED, ACU and ICU) with severe sepsis and/or septic shock
A3
Septic Shock 112 257 43.6%Severe Sepsis 67 235 28.5%SIC Population 179 492 36.4%Septic Shock 121 310 39.0%Severe Sepsis 73 330 22.1%SIC Population 194 640 30.3%Septic Shock 113 321 35.2%Severe Sepsis 63 311 20.3%SIC Population 176 632 27.8%Septic Shock 123 333 36.9%Severe Sepsis 57 325 17.5%SIC Population 180 658 27.4%
* Baseline
2011
2012 YTDJan-12 to Nov-12
2009*
2010
464136312621161161
70.0%
60.0%
50.0%
40.0%
30.0%
20.0%
10.0%
0.0%
Observation (months)
Mor
talit
y Ra
te _X=37.0%
_X=27.8% _
X=27.7%
2009 2010 2011 2012
_X=30.6%
SIC Mortality Rate by Calendar YearSevere Sepsis (995.92) & Septic Shock (785.52)
* Source data from HIM

QI Example 2
Environmental Services Inpatient Discharge Process

Performance Excellence A HEALTHIER WORLD THROUGH BOLD INNOVATION
EVS Inpatient Discharge Process QI
Utilize LSS to fully leverage EVS metrics – Logistical metrics (TeleTracking) – Quality metrics (Visual & ATP Monitoring)
Engage all levels of EVS staff in QI process
Improvement of departmental efficiencies with the goal to decrease discharge cleaning turnaround time and improve process quality

Performance Excellence A HEALTHIER WORLD THROUGH BOLD INNOVATION

Performance Excellence A HEALTHIER WORLD THROUGH BOLD INNOVATION
DEFINE:
Quality Audit Process
PROBLEM STATEMENT: Lack of standard quality audit form
PROCESS MAP:
MEASURE: CONTROL PLAN:
IMPROVE:
ANALYZE:
GOAL: Design and implement standard quality audit form
SCOPE: Inpatient discharge process
QI


