48
Performance Metrics Central User Guide Performance Metrics Central

Performance Metrics CentralUser Guide
Perf
orm
ance
Met
rics
Cen
tral
Performance Metrics Central User Guide
2
TABLE OF CONTENTSABOUT THIS GUIDE ........................................................................................................ 4YOUR PERFORMANCE METRICS CENTRAL............................................................. 4BENEFITS OF USING PERFORMANCE METRICS CENTRAL ................................. 4WHAT YOU WILL FIND IN THIS USER GUIDE............................................................ 4PREREQUISITES.............................................................................................................. 5RECOMMENDED FOR BEST PERFORMANCE .......................................................... 5
Hardware Requirements .............................................................................................................................................................. 5Software Requirements ................................................................................................................................................................ 5Network Requirements ................................................................................................................................................................. 5
CHAPTER ONE – PERFORMANCE METRICS CENTRAL OVERVIEW ................... 6CHAPTER OBJECTIVES ....................................................................................................................................................................... 6PREREQUISITES ................................................................................................................................................................................. 6OVERVIEW.......................................................................................................................................................................................... 6
CHAPTER TWO – LOG ONTO PERFORMANCE METRICS CENTRAL TOOL....... 7CHAPTER OBJECTIVES ....................................................................................................................................................................... 7PREREQUISITES ................................................................................................................................................................................. 7OVERVIEW.......................................................................................................................................................................................... 72.1. LOGIN.......................................................................................................................................................................................... 82.2. LOGIN: NON-PERFORMANCE METRICS CENTRAL USER ............................................................................................................... 92.3. LOGIN: PERFORMANCE METRICS CENTRAL PARTNER USER ........................................................................................................ 92.4. LOGIN: PERFORMANCE METRICS CENTRAL INTERNAL USER ...................................................................................................... 10
CHAPTER THREE – VIEW SHARED SUPPORT (CSSP) PERFORMANCE METRICS...........................................................................................................................14
CHAPTER OBJECTIVES ..................................................................................................................................................................... 14PREREQUISITES ............................................................................................................................................................................... 143.1. SELECT A PARTNER (CISCO USERS ONLY) ................................................................................................................................ 143.2. VIEW PERFORMANCE METRICS.................................................................................................................................................. 14
3.2.1. Section Header ................................................................................................................................................................. 153.2.2. Metrics List........................................................................................................................................................................ 153.2.3. Metrics Number Displays ................................................................................................................................................. 16
3.3. DOWNLOAD SHARED SUPPORT (CSSP) METRICS DETAIL REPORT ........................................................................................... 163.3.1. Download detail reports ................................................................................................................................................... 163.3.2. View the downloaded report ............................................................................................................................................ 18
3.4. VIEW SHARED SUPPORT (CSSP) PROGRAM THRESHOLD AND DISCOUNT ................................................................................. 193.5. SHARED SUPPORT (CSSP) METRICS ONLINE HELP .................................................................................................................. 20
CHAPTER FOUR – VIEW CBR PERFORMANCE METRICS ....................................21CHAPTER OBJECTIVES ..................................................................................................................................................................... 21PREREQUISITES ............................................................................................................................................................................... 214.1. SELECT A PARTNER (CISCO USERS ONLY) ................................................................................................................................ 214.2. VIEW PERFORMANCE METRICS.................................................................................................................................................. 21
4.2.1. Section Header ................................................................................................................................................................. 224.2.2. Metrics List........................................................................................................................................................................ 224.2.3. Metrics Number Displays ................................................................................................................................................. 22
4.3. DOWNLOAD CBR METRICS DETAIL REPORT.............................................................................................................................. 234.3.1. Download detail reports ................................................................................................................................................... 234.3.2. View the downloaded report ............................................................................................................................................ 25
4.4. VIEW CBR PROGRAM THRESHOLD ............................................................................................................................................ 264.5. CBR METRICS ONLINE HELP..................................................................................................................................................... 27
CHAPTER FIVE – VIEW SIS PERFORMANCE METRICS.........................................29CHAPTER OBJECTIVES ..................................................................................................................................................................... 29PREREQUISITES ............................................................................................................................................................................... 29
Performance Metrics Central User Guide
3
5.1. SELECT A PARTNER (CISCO USERS ONLY) ................................................................................................................................ 295.2. VIEW PERFORMANCE METRICS.................................................................................................................................................. 29
5.2.1. Section Header ................................................................................................................................................................. 305.2.2. Metrics List........................................................................................................................................................................ 305.2.3. Metrics Number Displays ................................................................................................................................................. 31
5.3. VIEW CONTRACT ....................................................................................................................................................................... 315.4. VIEW SIS PROGRAM REQUIREMENT .......................................................................................................................................... 325.5. DOWNLOAD SIS METRICS DETAIL REPORT................................................................................................................................ 33
5.5.1. Download detail reports ................................................................................................................................................... 335.5.2. View the downloaded report ............................................................................................................................................ 35
5.6. VIEW CASES.............................................................................................................................................................................. 365.7. SIS METRICS ONLINE HELP....................................................................................................................................................... 38
CHAPTER SIX – VIEW OPERATIONAL INDICATOR ................................................39CHAPTER OBJECTIVES ..................................................................................................................................................................... 39PREREQUISITES ............................................................................................................................................................................... 395.1. SELECT A PARTNER (CISCO USERS ONLY) ................................................................................................................................ 395.2. VIEW OPERATIONAL INDICATOR METRICS .................................................................................................................................. 39
5.2.1. Operational Indicator Metrics List .................................................................................................................................... 40
APPENDIX A. SHARED SUPPORT (CSSP) PERFORMANCE METRICS – Q & A41APPENDIX B. SIS PERFORMANCE METRICS – Q & A ...........................................47

Performance Metrics Central User Guide
4
About this GuideYour Performance Metrics Central User Guide provides detailed information about how to use the Performance Metrics Central Tool. It is designed as a reference and instructional guide. It includes an overview, and instructions on how to access and view the partner performance metrics numbers for the program or programs they are enrolled.
Your Performance Metrics CentralPerformance Metrics Central provides on-line comparative (competitive) operational support data, performance metrics, and metrics detail to stimulate support partners to achieve best in class support performance as well as allowing monitoring of performance requirements.
Performance Metrics Center enables System Integrator Support, Cisco Brand Resale, and Shared Support Program Officers to manage their service operation more efficiently by providing up-to-date information on the performance metrics.
There are three programs currently in the Performance Metrics Central:• Shared Support Program• Cisco Brand Resale• System Integrator Support
In addition, PMC also provides the various Operational Indicator reports for each partner in PMC.
Benefits of Using Performance Metrics Central Visibility of the partner performance metrics Detail information about the CSSP/CBR/SIS metrics Symantec and flexible management of partner and contract relationship
What You Will Find in This User Guide Overview of Performance Metrics Central Explanation of Common Functionality and Navigation on Performance Metrics
Central How to access partner performance metrics numbers How to view the threshold and discount information How to download detail report for each metric How to setup a partner How to manage partner mapping How to request a re-calculation of the metrics numbers How to download summary reports

Performance Metrics Central User Guide
5
Prerequisites Internet, computer, and mouse skills Cisco.com account with access to Partner Access On-Line For a partner user, your partner has been setup in CSSP/CBR/SIS programs
Recommended for Best PerformanceFor the best performance when using Personalized Commerce View, follow these suggestions:
Hardware Requirements Pentium 166 MHz (minimum), Pentium 200 MHz or higher (recommended) 128 MB RAM TCP/IP protocol installed and configured Monitor and display adapter capable of 256 colors at 800x600 resolution
Hardware - Optimal Performance Recommendations Pentium III 1 GHz 256 MB RAM Display adapter capable of 1024x768 resolution
Software Requirements Windows 98, 2000, NT or XP HTML Browser
- Internet Explorer 5.5 or higher- Netscape 6.x or higher
Network Requirements 56K Modem connection or higher (sustained bandwidth)
Performance Metrics Central User Guide
6
Chapter One – Performance Metrics Central Overview
Chapter Objectives Learn what the Performance Metrics Central Tool is about
Prerequisites None
Overview
The goal of the Performance Metrics Central is to collect the partner performance raw data from various source, conduct analysis and calculations, and present to the users a set of metrics numbers, which would indicate the performance of the partner in different angels.

Performance Metrics Central User Guide
7
Chapter Two – Log onto Performance Metrics Central Tool
Chapter Objectives Learn how to access your Performance Metrics Central tool
Prerequisites You have your CCO account Your company has been setup as CSSP/CBR/SIS partner You already have the URL of the Performance Metrics Central Tool
Note: the URL for the Performance Metrics Central tool is: http://tools.cisco.com/CustAdv/PP/smIntroduction.do
Overview
In order to be able to access Performance Metrics Central Tool, the user has to have CCO account. Based on the type of access to the Performance Metrics Central Tool, the CCO users can be classified into the following four types:
Ø Non-Performance Metrics Central Users
Non-Performance Metrics Central Users refers to CCO users who can not access Performance Metrics Central. For those users, at least one of the following is not true:
o User is associated with a partner company site in the Partner database. To verify the association, check the URL: http://www.cisco.com/go/getpartneraccess.
o User must be granted access to the PAL tool. Access can be requested either on-line (Click here to request access to PAL on-line) or by contacting your Cisco Channel Account Manager (CAM). If you do not know who your CAM is, click here to use the CAM Locator tool.
o User's company must be covered by Performance Metrics Central tool which currently covers all active SIS/CSSP/CBR partners. For additional help, send email to proper theater alias listed below:For Amer, [email protected] Apac, [email protected] Emea, [email protected] Japan, [email protected] US, [email protected].
Ø Performance Metrics Central Partner Users
This group of user refers to the CCO users who are not Cisco users and have the access to the Performance Metrics Central tool.
Ø Performance Metrics Central Internal Users

Performance Metrics Central User Guide
8
This group of user refers to all the CCO users who are Cisco users.
Ø Performance Metrics Central Super Users
There is a group of special Cisco users who have been setup in the Performance Metrics Central tool. This group of users will perform the functions that are not visible to other type of users. They are called Performance Metrics Central Super User.
Only a limited number of users exist in the Super User group.
Note: To protect user privacy, a 30-minute time-out session is built into the portal. When no interaction or activity occurs for 30 minutes after initial login, the user will be automatically logged out. Re-logging will be necessary to access Performance Metrics Central.
2.1. Login
Step1. Open your browser. Performance Metrics Central tool supports both IE (version 5.5 and above) and Netscape (version 6.0 and above).
Step2. Type the following URL to the address field of your browser:
http://tools.cisco.com/CustAdv/PP/smIntroduction.do
Step3. A dialog box will automatically pop up, which looks like the following:
Step4. Type in your CCO id and password, and click ‘OK’.
Step5. It depends on the type of user of your CCO id as what screen you will see. Please see the sections below.
Performance Metrics Central User Guide
9
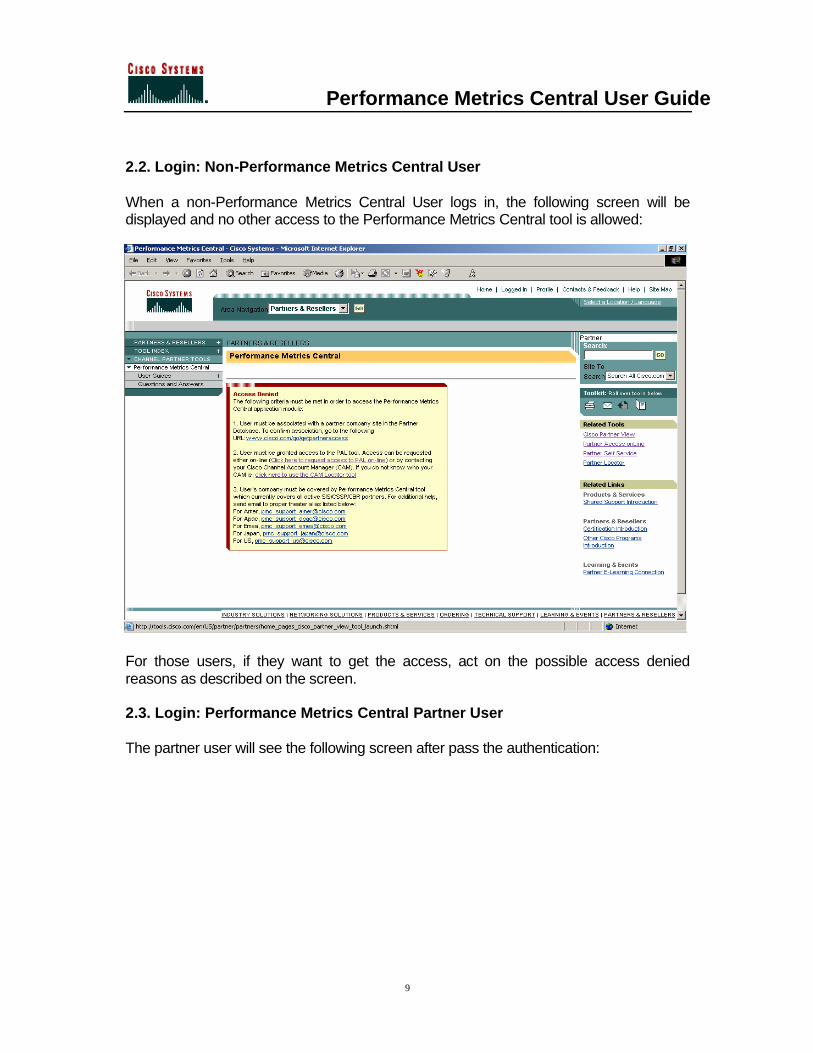
2.2. Login: Non-Performance Metrics Central User
When a non-Performance Metrics Central User logs in, the following screen will be displayed and no other access to the Performance Metrics Central tool is allowed:
For those users, if they want to get the access, act on the possible access denied reasons as described on the screen.
2.3. Login: Performance Metrics Central Partner User
The partner user will see the following screen after pass the authentication:

Performance Metrics Central User Guide
10
On the top right corner, the partner’s name, country, and the user’s full name will be displayed.
2.4. Login: Performance Metrics Central Internal User
When the Performance Metrics Central internal user logs in, he/she will see the following screen:

Performance Metrics Central User Guide
11
The screen looks similar to the one for the partner user. The only difference is that at the top right corner, instead of partner name and country name, it displays the link “Select Partner”. This link will enable the user to select a partner to view performance metrics number, or switch between partners.
Follow the below steps to do select partner/switch partner.
Step1. Following screen shows when click the link “Select Partner” from the upper screen once internal user login to the performance metrics central tool.
Also as an internal user, if you have already selected a partner, you can always switch to a different partner by clicks on the link ‘Change Partner’ behind the current partner name, as depicted below:

Performance Metrics Central User Guide
12
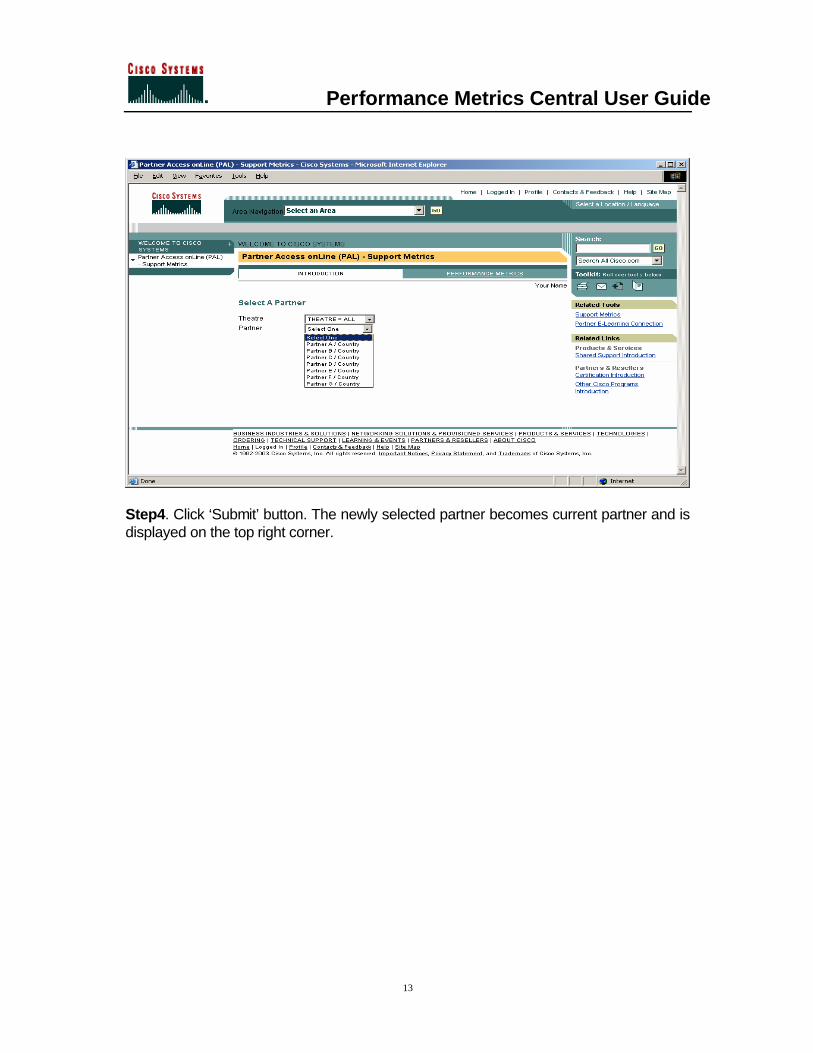
Step2. Select a theater from the first dropdown list box. “THEATER = ALL” means all the theaters, which also means all the partners.
Step3. The tool will automatically refresh based on the theater user selects. After refresh, select a partner from the partner dropdown list box
Performance Metrics Central User Guide
13
Step4. Click ‘Submit’ button. The newly selected partner becomes current partner and is displayed on the top right corner.
Performance Metrics Central User Guide
14
Chapter Three – View Shared Support (CSSP) Performance MetricsChapter Objectives Learn how to view the CSSP Performance Metrics numbers. Learn how to download detail metrics report Learn how to view the CSSP program threshold and discount Learn how to select and switch partner (For Cisco Users only)
Prerequisites You have already successfully logged onto the Performance Metrics Central tool.
3.1. Select a Partner (Cisco Users Only)
For partner user, after successful login, the corresponding partner for the user will be automatically selected. There is no need for partner to go through this step.
For Cisco user, it is required to select a partner in order to view the performance metrics. Otherwise, the tool will force the user to select first. Please refer to section 2.4 for more detail.
3.2. View Performance Metrics
The step to view performance metrics is very straightforward: click on the ‘PERFORMANCE METRICS’ top menu, or tab.
The following screen will be displayed:

Performance Metrics Central User Guide
15
3.2.1. Section Header
All the CSSP metrics are displayed in a section with the header ‘Shared Support’.
In the section header, it also displays the publishing date of the metrics numbers. The metrics numbers for the month are normally published on the 15th of next month. Based on the publishing date, you can determine for what month the current metrics numbers are calculated. For example, if the publishing date is Dec 15, 2003, it means the metrics numbers are calculated based on the data till Nov. 2003.
3.2.2. Metrics List
All the CSSP performance metrics are listed in the first column, one metrics per line. Based on the type of partner, the list of metrics might be slightly different.
For example, partners in US and Canada would see the following list:
Ø Attach RateØ Renewal RateØ Post-Sale Customer SatØ Case VolumeØ RMA Volume

Performance Metrics Central User Guide
16
While the partners in the rest of the world (EMEA, ASIA, etc.) would see the following metrics list:
Ø Conversion RateØ Renewal RateØ Post-Sale Customer SatØ Case VolumeØ RMA Volume
The detail definition and metrics calculation algorithm can be found in the Appendix A.
3.2.3. Metrics Number Displays
The second column of the metrics table is for the metrics numbers.
Each metrics may have multiple numbers, as named in the metrics name column.
For each metrics, there is one key number among all the metrics numbers. This key number will determine which level the partner belongs to, which is illustrated using the color code.
At the bottom of the section, you can find the legends for those color codes. Next section will describe the threshold values for those different levels.
3.3. Download Shared Support (CSSP) Metrics Detail Report
Each metrics number is calculated based on a set of data extracted from the various data source. If you want to see the detailed item by item data of which the metrics numbers consist, you can download them from the Performance Metrics Central tool.
3.3.1. Download detail reports
Step1. Go to the Performance Metrics Screen
By click on the ‘PERFORMANCE METRICS’ tab, you would see the following screen as described before:

Performance Metrics Central User Guide
17
Step2. Click the link “Download Report” as marked in the above screen shot. A window will pop up, shown as follows:

Performance Metrics Central User Guide
18
Step3. Select the corresponding report or reports and click the ‘Submit’ button. The following screen will display:
Step4. Performance Metrics Central tool will generate the report and email to you. Depends on the system load, normally it would take less than four hours to receive the requested reports via email.Normally, it takes 15 minutes or less to get the email of the requested report. However, due to the network conditions, server load, or size of the download, it might take as long as a few hours to get the email. If you do not receive the report after 24 hours, you need to request download again, or contact the PMC support team.
3.3.2. View the downloaded report
The requested reports are packed into a zip file before emailed to you. You need to uncompress the file first.
When unpack the zip file, suggest you uncheck the option ‘Use folder names’. This way, all the reports will be extracted directly into the location you’ve specified.

Performance Metrics Central User Guide
19
After uncompress, you will find that all the Performance Metrics Central detail reports are in CSV (Comma Separated Version) format, which can be recognized by MS Excel.
Although a CSV file has no size limitation (only limited by the operation system), MS Excel has the maximum of 64K rows in one spreadsheet. If you see the following message when trying to open a big CSV file, it means the CSV file contains more lines than MS Excel can handle:
This would happen to partners who have many contracts or large volume of items or cases, etc.
In this situation, you can use other generic editor tool to open the CSV file first, since the CSV file is also a plain text file. You can then break the file into multiple sections, each of which is less than 64 lines.
3.4. View Shared Support (CSSP) Program Threshold and Discount
On the metrics display screen, in the Shared Support section, there is a link “View Threshold and Discount” as described below:
Performance Metrics Central User Guide
20
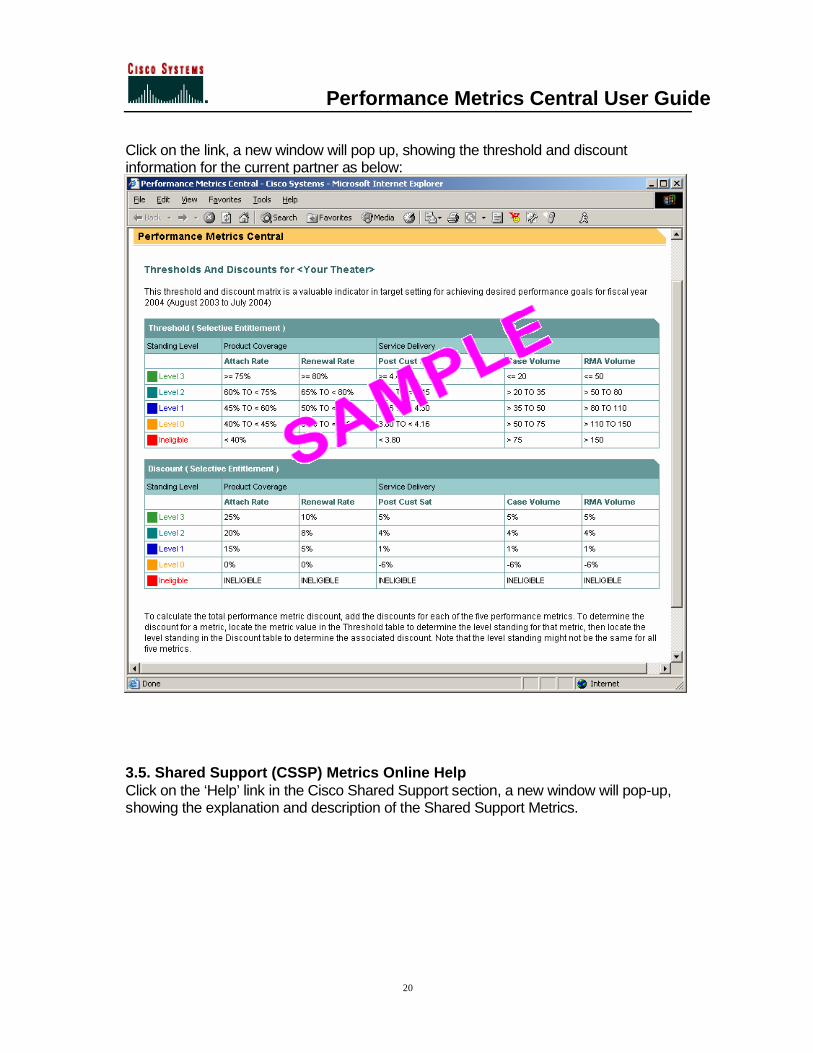
Click on the link, a new window will pop up, showing the threshold and discount information for the current partner as below:
3.5. Shared Support (CSSP) Metrics Online HelpClick on the ‘Help’ link in the Cisco Shared Support section, a new window will pop-up, showing the explanation and description of the Shared Support Metrics.
Performance Metrics Central User Guide
21
Chapter Four – View CBR Performance MetricsChapter Objectives Learn how to view the CBR Performance Metrics numbers. Learn how to download detail metrics report Learn how to view the CBR program threshold and discount Learn how to select and switch partner (For Cisco Users only)
Prerequisites You have already successfully logged onto the Performance Metrics Central tool.
4.1. Select a Partner (Cisco Users Only)
For partner user, after successful login, the corresponding partner for the user will be automatically selected. There is no need for partner to go through this step.
For Cisco user, it is required to select a partner in order to view the performance metrics. Otherwise, the tool will force the user to select first. Please refer to section 2.4 for more detail.
4.2. View Performance Metrics
The step to view performance metrics is very straightforward: click on the ‘PERFORMANCE METRICS’ top menu, or tab.
The following screen will be displayed:

Performance Metrics Central User Guide
22
4.2.1. Section Header
All the CBR metrics are displayed in a section with the header ‘Cisco Brand Resale’.
In the section header, it also displays the publishing date of the metrics numbers. The metrics numbers for the month are normally published on the 15th of next month. Based on the publishing date, you can determine for what month the current metrics numbers are calculated. For example, if the publishing date is Dec 15, 2003, it means the metrics numbers are calculated based on the data till Nov. 2003.
4.2.2. Metrics List
All the CBR performance metrics are listed in the first column, one metrics per line.
Ø Attach RateØ Renewal Rate
4.2.3. Metrics Number Displays

Performance Metrics Central User Guide
23
The second column of the metrics table is for the metrics numbers.
Each metrics may have multiple numbers, as named in the metrics name column. Different numbers of the metrics are separated by the character “/”.
For each metrics, there is one key number among all the metrics numbers. This key number will determine which level the partner belongs to, which is illustrated using the color code.
At the bottom of the section, you can find the legends for those color codes. Next section will describe the threshold values for those different levels.
4.3. Download CBR Metrics Detail Report
Each metrics number is calculated based on a set of data extracted from the various data source. If you want to see the detailed item by item data of which the metrics numbers consist, you can download them from the Performance Metrics Central tool.
4.3.1. Download detail reports
Step1. Go to the Performance Metrics Screen
By click on the ‘PERFORMANCE METRICS’ tab, you would see the following screen as described before:

Performance Metrics Central User Guide
24
Step2. Click the link “Download Report” as marked in the above screen shot. A window will pop up, shown as follows:
Step3. Select the corresponding report or reports and click the ‘Submit’ button. The following screen will display:

Performance Metrics Central User Guide
25
Step4. Performance Metrics Central tool will generate the report and email to you. Depends on the system load, normally it would take less than four hours to receive the requested reports via email.Normally, it takes 15 minutes or less to get the email of the requested report. However, due to the network conditions, server load, or size of the download, it might take as long as a few hours to get the email. If you do not receive the report after 24 hours, you need to request download again, or contact the PMC support team.
4.3.2. View the downloaded report
The requested reports are packed into a zip file before emailed to you. You need to uncompress the file first.
When unpack the zip file, suggest you uncheck the option ‘Use folder names’. This way, all the reports will be extracted directly into the location you’ve specified.
After uncompress, you will find that all the Performance Metrics Central detail reports are in CSV (Comma Separated Version) format, which can be recognized by MS Excel.

Performance Metrics Central User Guide
26
Although a CSV file has no size limitation (only limited by the operation system), MS Excel has the maximum of 64K rows in one spreadsheet. If you see the following message when trying to open a big CSV file, it means the CSV file contains more lines than MS Excel can handle:
This would happen to partners who have many contracts or large volume of items or cases, etc.
In this situation, you can use other generic editor tool to open the CSV file first, since the CSV file is also a plain text file. You can then break the file into multiple sections, each of which is less than 64 lines.
4.4. View CBR Program Threshold
On the metrics display screen, in the Cisco Brand Resale section, there is a link “View Threshold” as described below:

Performance Metrics Central User Guide
27
Click on the link, a new window will pop up, showing the threshold information for the current partner as below:
4.5. CBR Metrics Online HelpOn the metrics display screen, in the Cisco Brand Resale section, there is a link “View Threshold and Discount” as described below:

Performance Metrics Central User Guide
28
Click on the link, a new window will pop up, showing the help text for CBR metric.

Performance Metrics Central User Guide
29
Chapter Five – View SIS Performance MetricsChapter Objectives Learn how to view the SIS Performance Metrics numbers. Learn how to download detail metrics report Learn how to view the SIS program threshold and discount Learn how to select and switch partner (For Cisco Users only)
Prerequisites You have already successfully logged onto the Performance Metrics Central tool.
5.1. Select a Partner (Cisco Users Only)
For partner user, after successful login, the corresponding partner for the user will be automatically selected. There is no need for partner to go through this step.
For Cisco user, it is required to select a partner in order to view the performance metrics. Otherwise, the tool will force the user to select first. Please refer to section 2.4 for more detail.
5.2. View Performance Metrics
The step to view performance metrics is very straightforward: click on the ‘PERFORMANCE METRICS’ top menu, or tab.
The following screen will be displayed:

Performance Metrics Central User Guide
30
5.2.1. Section Header
All the SIS metrics are displayed in a section with the header ‘System Integrator Support’.
In the section header, it also displays the publishing date of the metrics numbers. The metrics numbers for the month are normally published on the 15th of next month. Based on the publishing date, you can determine for what month the current metrics numbers are calculated. For example, if the publishing date is Dec 15, 2003, it means the metrics numbers are calculated based on the data till Nov. 2003.
5.2.2. Metrics List
All the SIS performance metrics are listed in the first column, one metrics per line.
Ø CCIE Case Rate %Ø CCNP Case Rate %Ø Configuration Case Rate %

Performance Metrics Central User Guide
31
5.2.3. Metrics Number Displays
The rest of the columns of the metrics table are for the metrics numbers.
The second and third columns shows the metrics for last 2 complete quarters and the last column show last 3 month rolling average.
For each metrics, the number is color coded and at the bottom of the section, you can find the legends for those color codes. Next section will describe the threshold values for those different levels.
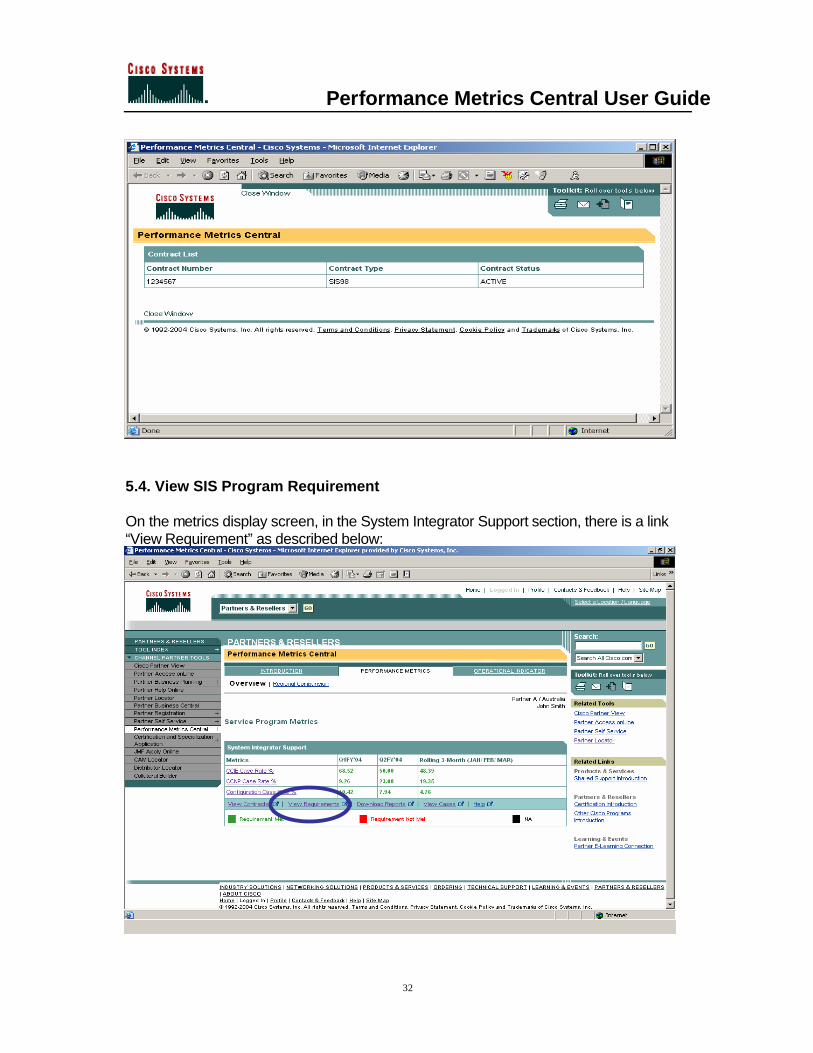
5.3. View Contract On the metrics display screen, in the System Integrator Support section, there is a link“View Contracts”.
By clicking this link, new windows will pop-up, showing all the mapped contract of this partner.
Performance Metrics Central User Guide
32
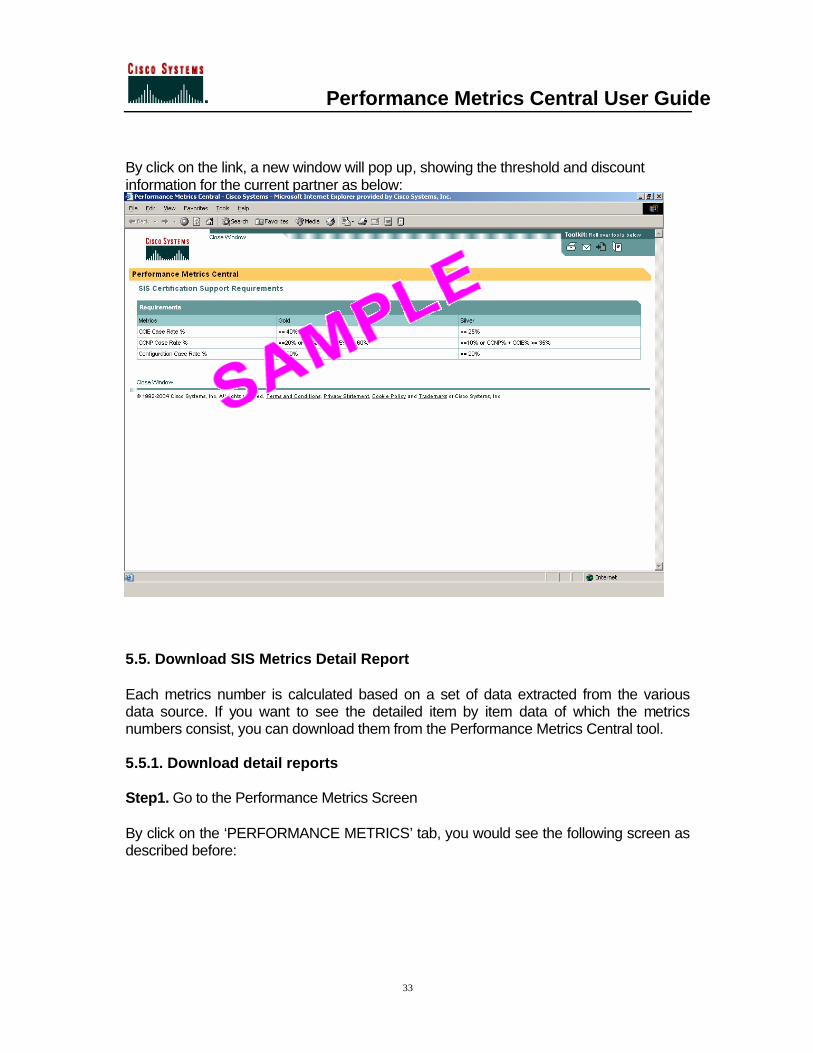
5.4. View SIS Program Requirement
On the metrics display screen, in the System Integrator Support section, there is a link “View Requirement” as described below:
Performance Metrics Central User Guide
33
By click on the link, a new window will pop up, showing the threshold and discount information for the current partner as below:
5.5. Download SIS Metrics Detail Report
Each metrics number is calculated based on a set of data extracted from the various data source. If you want to see the detailed item by item data of which the metrics numbers consist, you can download them from the Performance Metrics Central tool.
5.5.1. Download detail reports
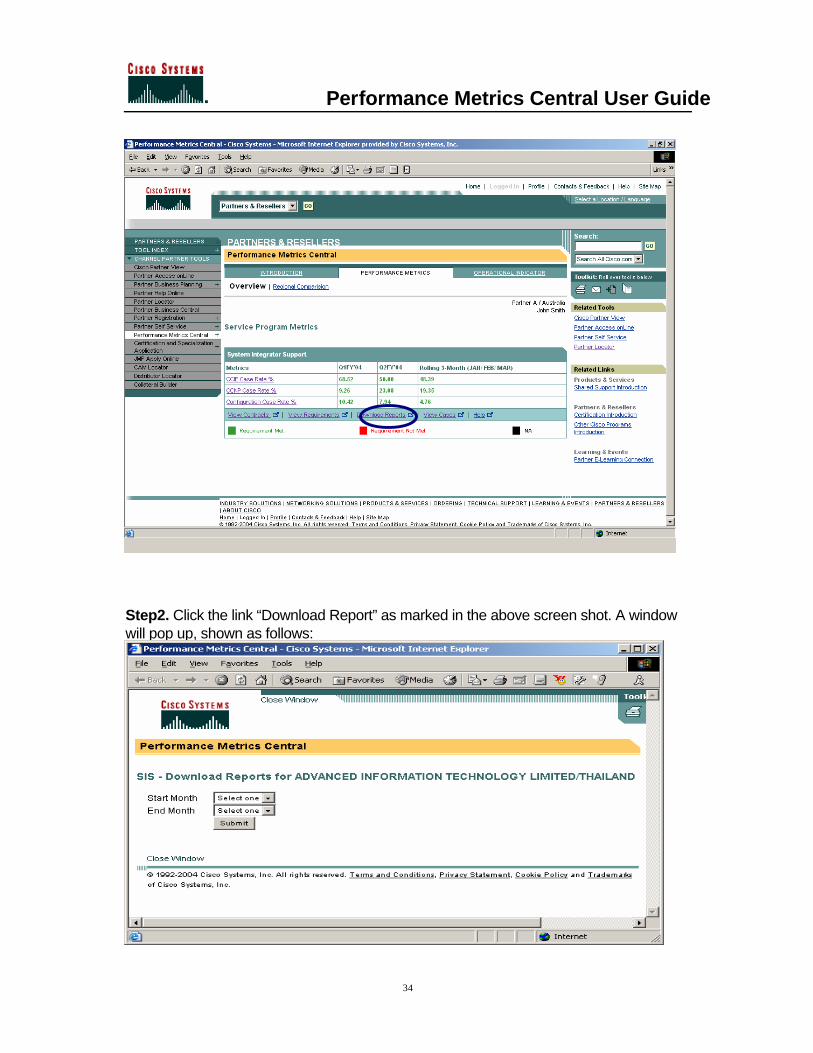
Step1. Go to the Performance Metrics Screen
By click on the ‘PERFORMANCE METRICS’ tab, you would see the following screen as described before:
Performance Metrics Central User Guide
34
Step2. Click the link “Download Report” as marked in the above screen shot. A window will pop up, shown as follows:

Performance Metrics Central User Guide
35
Step3. Select the corresponding start month or end month and click the ‘Submit’ button. The following screen will display:
Step4. Performance Metrics Central tool will generate the report and email to you. Depends on the system load, normally it would take less than four hours to receive the requested reports via email.Normally, it takes 15 minutes or less to get the email of the requested report. However, due to the network conditions, server load, or size of the download, it might take as long as a few hours to get the email. If you do not receive the report after 24 hours, you need to request download again, or contact the PMC support team.
5.5.2. View the downloaded report
The requested reports are packed into a zip file before emailed to you. You need to uncompress the file first.

Performance Metrics Central User Guide
36
When unpack the zip file, suggest you uncheck the option ‘Use folder names’. This way, all the reports will be extracted directly into the location you’ve specified.
After uncompress, you will find that all the Performance Metrics Central detail reports are in CSV (Comma Separated Version) format, which can be recognized by MS Excel.
Although a CSV file has no size limitation (only limited by the operation system), MS Excel has the maximum of 64K rows in one spreadsheet. If you see the following message when trying to open a big CSV file, it means the CSV file contains more lines than MS Excel can handle:
This would happen to partners who have many contracts or large volume of items or cases, etc.
In this situation, you can use other generic editor tool to open the CSV file first, since the CSV file is also a plain text file. You can then break the file into multiple sections, each of which is less than 64 lines.
5.6. View CasesOn the metrics display screen, in the System Integrator Support section, there is a link “View Cases” as described below:

Performance Metrics Central User Guide
37
After click the link, a new window will be pop-up as shown below:

Performance Metrics Central User Guide
38
After select the corresponding start month and end month, case detail will be listed as shown below:
5.7. SIS Metrics Online HelpClick on the ‘Help’ link in the System Integrator Support section, a new window will pop up, showing the explanation on the SIS metrics.

Performance Metrics Central User Guide
39
Chapter Six – View Operational IndicatorChapter Objectives Learn how to view the Operational Indicator metrics. Learn how to select and switch partner (For Cisco Users only)
Prerequisites You have already successfully logged onto the Performance Metrics Central tool.
5.1. Select a Partner (Cisco Users Only)
For partner user, after successful login, the corresponding partner for the user will be automatically selected. There is no need for partner to go through this step.
For Cisco user, it is required to select a partner in order to view the performance metrics. Otherwise, the tool will force the user to select first. Please refer to section 2.4 for more detail.
5.2. View Operational Indicator Metrics
The step to view OE metrics is very straightforward: click on the ‘OPERATIONAL INDICATOR’ top menu, or tab.
The following screen will be displayed:

Performance Metrics Central User Guide
40
5.2.1. Operational Indicator Metrics ListØ Case by Contract IDØ Case by InitiatorØ Case by Open MethodØ Case by Original PriorityØ Case by Problem TypeØ Case by TechnologyØ Case Closure time by Original PriorityØ Case Linked with BugØ Case volume and CCIE/CCNP % (Monthly)Ø Case volume and CCIE/CCNP % (Quarterly)Ø Case volume and Configuration % (Monthly)Ø Case volume and Configuration % (Quarterly)Ø RMA by Product Family
Take the ‘Case volume and CCIE/CCNP % (Monthly)’ as an example. The report will be shown like below:

Performance Metrics Central User Guide
41
Appendix A. Shared Support (CSSP) Performance Metrics – Q & A
Attach Rate1. What is the Definition of Attach Rate?
Attach rate measures the SMARTnet Next Business Day (NBD) dollar value of new service contracts sold compared to the SMARTnet NBD list value of all new equipment purchased during the first 12 months
2. What is the Formula used to calculate the Attach Rate Metric?
Total $ value of service sold in month 1-12Attach Rate % =
Total $ value opportunity of service sales in month 1-12x 100%
Numerator:
Service dollars attached
Service coverage attached in the current period. Service coverage dollars are translated to SMARTnet NBD U.S. List Price at the next business day service level
Denominator: Service dollar attach opportunity
Service coverage dollars available for attach in the current period. Service coverage dollars are translated to SMARTnet U.S. list price at the next business day service
3. Is There Any Exclusion to the Attach Rate Calculation?
Because the attach and renewal calculations are dollars based, it weights the importance of covering higher complexity/higher value products as compared to low end plug-and-play products. It is the responsibility of the partner to maintain installed base information
4. How do we calculate the Attach Rate Numerator?
Service coverage attached must meet the following criteria:
Service sale in the current period
Service must be linked to hardware that was originally purchased from Cisco in the current period.
If the contract meets these criteria, but the original service agreement does not show expiring in the current 12-month period, it is treated separately as a multiyear agreement (see multiyear definition below). This information is collected from Cisco’s database and is measured at the contract line item level. Once the data is collected, it is then translated to the SMARTnet NBD U.S. list price. All service contract types are included (SMARTnet Resell, Cisco Shared Support, etc.).
5. How do we calculate the Attach Rate Denominator?
Service coverage dollars available for attach are calculated by reporting hardware purchased from Cisco in the

Performance Metrics Central User Guide
42
current period. These sales are translated to their equivalent SmartNet price at the next business day service level. This dollar amount equals the attach rate opportunity and hence, the attach rate denominator. Only chassis and serialized cards/modules that have a SMARTnet list price shall be included in the attach rate calculation.
6. What is the Timing of the Attach Rate Measurement?
The service coverage must have been purchased from Cisco in the current 12-month period and show expiring in the next 12-month period. If the contract meets all of the attach rate requirements but does not show expiring in the next 12-month period, it is treated separately as a multiyear agreement.
7. What else is considered to calculate the Attach Rate Metric?
Multiyear Agreements – Multiyear agreements are amortized over the life of the agreement in one-year increments. If a multiyear agreement is originally sold (that is the partner purchases additional years of coverage instead of the minimum one-year), the coverage is converted to SMARTnet next business day list price and divided by the number of years purchased. The first year’s value will be added into the attach rate numerator and denominator, and the remaining dollars will be credited to the renewal numerator and denominator. Multiyear agreements that meet renewal criteria will be amortized over the life of the agreement and each year’s value will be credited to the renewal numerator and denominator
Conversion Rate1. What is the Definition of Conversion Rate?
Conversion Rate measures all converted support agreements as a percentage of total support opportunity under full-entitlement.
2. What is the Formula used to calculate the Conversion Rate Metric?
Total $ value of service sold in month 13-24Conversion Rate % =
Total $ value opportunity available for conversion in month 13-24x 100%
Numerator: Service Dollars Converted
Service Coverage Converted in the current period (following Full Entitlement). Service Coverage Dollars are translated to SMARTnet List Price at NBD Service Level or SAS list price as applicable.
Denominator: Service Dollar Conversion Opportunity Service Coverage Conversion Dollars Available for Conversion in the current period (following full entitlement). Service Coverage Dollars are translated to SMARTnet List Price at NBD Service Level or SAS list price as applicable.
3. Is There Any Exclusion to the Conversion Rate Calculation?
Not Applicable
Performance Metrics Central User Guide
43
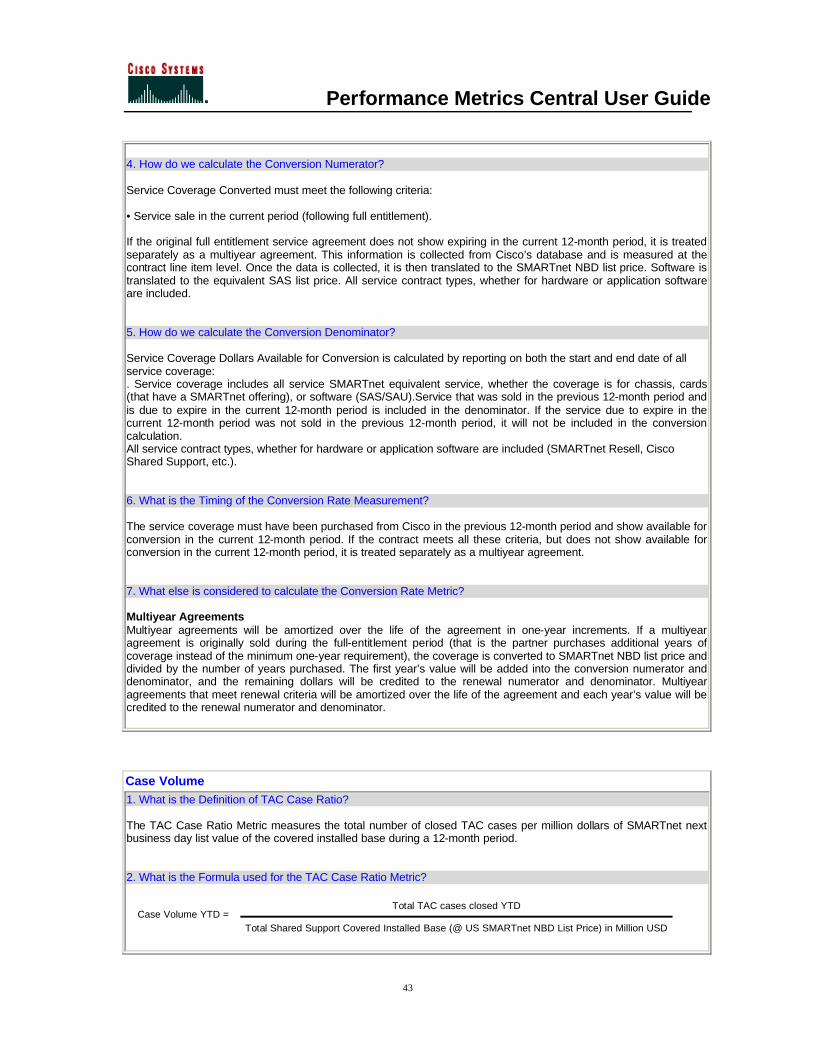
4. How do we calculate the Conversion Numerator?
Service Coverage Converted must meet the following criteria:
• Service sale in the current period (following full entitlement).
If the original full entitlement service agreement does not show expiring in the current 12-month period, it is treated separately as a multiyear agreement. This information is collected from Cisco’s database and is measured at the contract line item level. Once the data is collected, it is then translated to the SMARTnet NBD list price. Software is translated to the equivalent SAS list price. All service contract types, whether for hardware or application software are included.
5. How do we calculate the Conversion Denominator?
Service Coverage Dollars Available for Conversion is calculated by reporting on both the start and end date of all service coverage:. Service coverage includes all service SMARTnet equivalent service, whether the coverage is for chassis, cards (that have a SMARTnet offering), or software (SAS/SAU).Service that was sold in the previous 12-month period and is due to expire in the current 12-month period is included in the denominator. If the service due to expire in the current 12-month period was not sold in the previous 12-month period, it will not be included in the conversion calculation.All service contract types, whether for hardware or application software are included (SMARTnet Resell, Cisco Shared Support, etc.).
6. What is the Timing of the Conversion Rate Measurement?
The service coverage must have been purchased from Cisco in the previous 12-month period and show available for conversion in the current 12-month period. If the contract meets all these criteria, but does not show available for conversion in the current 12-month period, it is treated separately as a multiyear agreement.
7. What else is considered to calculate the Conversion Rate Metric?
Multiyear AgreementsMultiyear agreements will be amortized over the life of the agreement in one-year increments. If a multiyear agreement is originally sold during the full-entitlement period (that is the partner purchases additional years of coverage instead of the minimum one-year requirement), the coverage is converted to SMARTnet NBD list price and divided by the number of years purchased. The first year’s value will be added into the conversion numerator and denominator, and the remaining dollars will be credited to the renewal numerator and denominator. Multiyear agreements that meet renewal criteria will be amortized over the life of the agreement and each year’s value will be credited to the renewal numerator and denominator.
Case Volume1. What is the Definition of TAC Case Ratio?
The TAC Case Ratio Metric measures the total number of closed TAC cases per million dollars of SMARTnet next business day list value of the covered installed base during a 12-month period.
2. What is the Formula used for the TAC Case Ratio Metric?
Total TAC cases closed YTDCase Volume YTD =
Total Shared Support Covered Installed Base (@ US SMARTnet NBD List Price) in Million USD
Performance Metrics Central User Guide
44
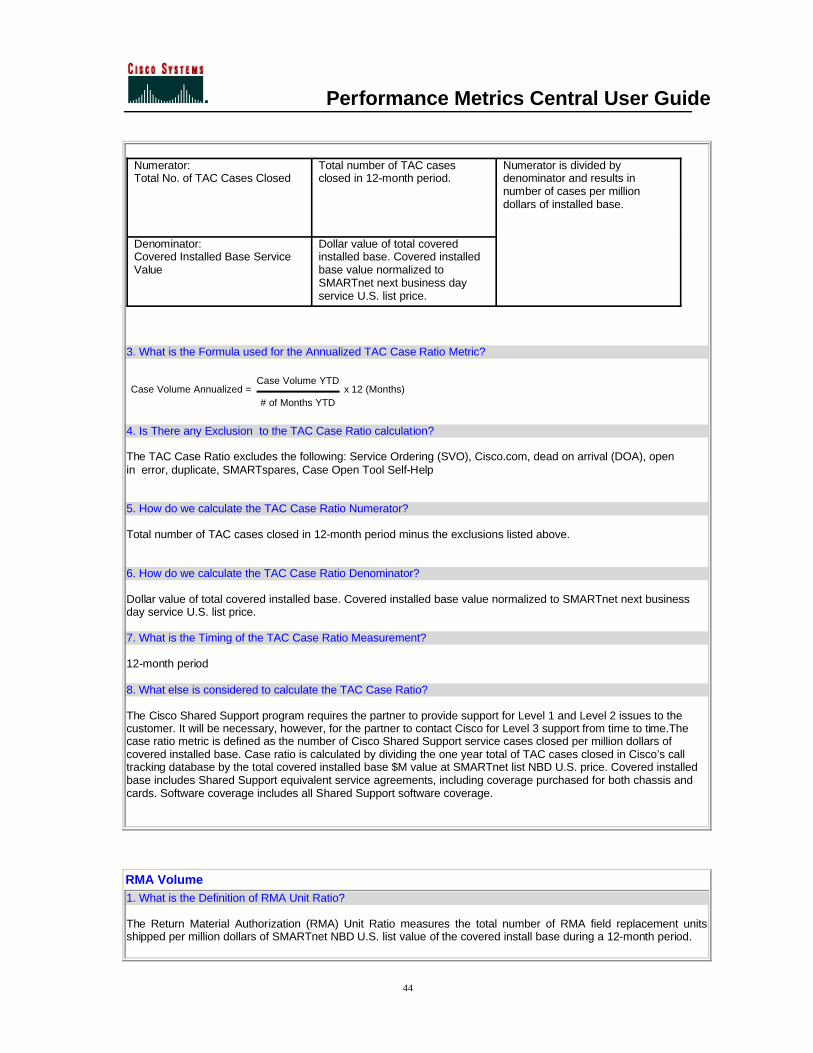
Numerator: Total No. of TAC Cases Closed
Total number of TAC cases closed in 12-month period.
Denominator: Covered Installed Base Service Value
Dollar value of total covered installed base. Covered installed base value normalized to SMARTnet next business day service U.S. list price.
Numerator is divided by denominator and results in number of cases per million dollars of installed base.
3. What is the Formula used for the Annualized TAC Case Ratio Metric?
Case Volume YTD Case Volume Annualized =
# of Months YTD x 12 (Months)
4. Is There any Exclusion to the TAC Case Ratio calculation?
The TAC Case Ratio excludes the following: Service Ordering (SVO), Cisco.com, dead on arrival (DOA), open in error, duplicate, SMARTspares, Case Open Tool Self-Help
5. How do we calculate the TAC Case Ratio Numerator?
Total number of TAC cases closed in 12-month period minus the exclusions listed above.
6. How do we calculate the TAC Case Ratio Denominator?
Dollar value of total covered installed base. Covered installed base value normalized to SMARTnet next business day service U.S. list price.
7. What is the Timing of the TAC Case Ratio Measurement?
12-month period
8. What else is considered to calculate the TAC Case Ratio?
The Cisco Shared Support program requires the partner to provide support for Level 1 and Level 2 issues to the customer. It will be necessary, however, for the partner to contact Cisco for Level 3 support from time to time.The case ratio metric is defined as the number of Cisco Shared Support service cases closed per million dollars of covered installed base. Case ratio is calculated by dividing the one year total of TAC cases closed in Cisco’s call tracking database by the total covered installed base $M value at SMARTnet list NBD U.S. price. Covered installed base includes Shared Support equivalent service agreements, including coverage purchased for both chassis and cards. Software coverage includes all Shared Support software coverage.
RMA Volume1. What is the Definition of RMA Unit Ratio?
The Return Material Authorization (RMA) Unit Ratio measures the total number of RMA field replacement units shipped per million dollars of SMARTnet NBD U.S. list value of the covered install base during a 12-month period.

Performance Metrics Central User Guide
45
2. What is the Formula used to calculate the RMA Unit Ratio?
Total RMA FRU Shipments YTDRMA Volume YTD =
Total Shared Support Covered Installed Base (@ US SMARTnet NBD List Price) in Million USD
Numerator: Total No. of RMA Units Shipped
Total number of RMA field replacement units shipped in 12-month period
Denominator: Covered Installed Base Value
Dollar Value of Total Covered Installed Base value normalized to SMARTnet next business day service level U.S. list price
Numerator is divided by denominator and results in number of shipments per million dollars of installed base.
3. What is the Formula used to calculate the RMA Unit Ratio?
RMA Volume YTDRMA Volume Annualized =
# of Months YTDx 12 (Months)
4. Is There Any Exclusion to the RMA Unit Ratio calculation?
The RMA unit ratio excludes the following: non-service Return Material Authorization (RMA), RMAs for Dead on Arrival (DOA), and Field Alert RMAs requested by Cisco TAC.
5. How do we calculate the RMA Unit Ratio Numerator?Total number of RMA field replacement units shipped in 12-month period
6. How do we calculate the RMA Unit Ratio Denominator?
Dollar Value of Total Covered Installed Base value normalized to SMARTnet next business day service level U.S. list price
7. What is the Timing of the RMA Unit Ratio Measurement?
12-month period
8. What else is considered to calculate the RMA Unit Ratio?
RMA volume is defined as the number of RMA field replacement units relative to SMARTnet NBD U.S. list price value of the partners covered installed base. RMA rate is calculated by dividing the number of RMA field replacement units shipped by the SMARTnet NBD value of the partners covered installed base (installed base under contract). Covered installed base includes Shared Support equivalent service agreements, including coverage purchased for both chassis and cards.
Post-Sale Customer Satisfaction1. What is the Definition of Customer Satisfaction?Customer Satisfaction measures customer satisfaction as reported by the partner’s customers

Performance Metrics Central User Guide
46
2. What is the formula used to calculate Customer Satisfaction metric?
Average customer score (scale of 1–5, minimum of 30 completed surveys) for the following question:“Overall, how would you rate your satisfaction with post-sales support (repair, maintenance, and technical support) provided by the above Cisco Channel partner? Would you say you are…”5—Very Satisfied4—Satisfied3—Neutral2—Dissatisfied1—Very dissatisfied
Survey process—Partners and Cisco field personnel are asked to identify customers who should be solicited for participation in the survey. The survey uses a rating system of 1–5, with 5 being the highest. The partner’s customers are asked to complete the survey on behalf of the channel partner (the channel partner is identified on the survey).End-customer names are collected and entered by:• Cisco account Teams• Partners by using PAL Tool, go to:http://www.cisco.com/cgi-bin/frontx/PAL2/ctrl/partner_home.htmlSurvey volume—Each Cisco Shared Support partner is required to submit enough customer names to ultimately achieve a minimum of 30 responses on Question 18 for each country grouping. Multiple (unique) respondents from a specific partner client are acceptable to meet the target of 30 responses.
3. Is There Any Exclusion to Customer Satisfaction metric?
N/A?
4. How do we calculate the Customer Satisfaction Numerator?
Not Applicable
5. How do we calculate the Customer Satisfaction Denominator?
Not Applicable
6. What is the Timing of the Customer Satisfaction metric Measurement?
Survey timingCustomer satisfaction surveys are distributed throughout the period. Each partner’s targets and thresholds are based on the goals set at the beginning of the measurement period. The result will be calculated based on four Cisco fiscal quarters prior to the end of the annual measurement period.
7. What else is considered to calculate Customer Satisfaction Metric?
Cisco uses a third-party company, Walker, to perform customer satisfaction surveys. The results from this survey are used for a variety of purposes related to partner certification and the development of operational improvement plans.In the case of Cisco Shared Support, this same Customer Satisfaction Survey is used to measure the customer satisfaction with post-sales support. The question used to determine the partner satisfaction rating is question number 18.

Performance Metrics Central User Guide
47
Appendix B. SIS Performance Metrics – Q & ACCIE Case Rate %1. What is the Definition of CCIE Case Rate?
Number of CCIE cases from partner vs. total case volume (excluding SVO,DOA,CCO usage, open in error, SmartSpare, and duplicated cases)
Number of TAC cases opened in the specified time period which are logged by a Cisco Certified Internet Expert
CCIE Case Rate % = Total number of TAC cases opened in the specified time period
x 100%
2. Is There Any Exclusion to the CCIE Case Rate Calculation?Cases meeting the following specifications will be excluded from the CCIE case rate calculation:
a. SmartSpare contract type cases.b. SVO/RMA cases: All cases opened directly thru SVO Gateway application for RMA and do not
require escalation to the TAC.c. CCO related issue cases: All cases that identified as CCO/Administrative related issues.d. DOA (Dead on Arrival) cases: All cases identified as DOA by TAC. e. Open in error cases: as such identified in case type. f. Duplicate cases: as such identified in case type.
3. Is there any recommendation and suggestion regarding to CCIE Case Rate?
o Ensure CCIE representation in your vendor escalation path.o Monitoring of contract usage by using both the Service Request Tool (which incorporates case query
functions) (http://tools.cisco.com/ServiceRequestTool/create) and case detail reports provided on the Performance Metrics Central tool.
o Monitoring accuracy of Individual Certification status.
CCNP Case Rate %1. What is the Definition of CCNP Case Rate?
Number of CCNP cases from partner vs.total case volume (excluding SVO,DOA,CCO usage, open in error,SmartSpare,and duplicated cases)
Number of TAC cases opened in the specified time period which are logged by a Cisco Certified Network Professional, who is not a Cisco Certified Internet Expert
CCNP Case Rate % = Total number of TAC cases opened in the specified time period
x 100%
2. Is There Any Exclusion to the CCNP Case Rate Calculation?Cases meeting the following specifications will be excluded from the CCNP case rate calculation:
a. SmartSpare contract type cases.b. SVO/RMA cases: All cases opened directly thru SVO Gateway application for RMA and do not
require escalation to the TAC.

Performance Metrics Central User Guide
48
c. CCO related issue cases: All cases that identified as CCO/Administrative related issues.d. DOA (Dead on Arrival) cases: All cases identified as DOA by TAC. e. Open in error cases: as such identified in case type. f. Duplicate cases: as such identified in case type.
3. Is there any recommendation and suggestion regarding to CCNP Case Rate?
o Ensure CCNP representation in your vendor escalation path.o Monitoring of contract usage by using both the Service Request Tool (which incorporates case query
functions) (http://tools.cisco.com/ServiceRequestTool/create) and case detail reports provided on the Performance Metrics Central tool.
o Monitoring accuracy of Individual Certification status.
Configuration Case Rate %1. What is the Definition of Configuration Case Rate?
A configuration case is a case that can be resolved by implementing a configuration change. Entering or enabling a Cisco command or commands to turn on a specific protocol or a certain feature in a Cisco product can resolve the problem. The command or commands can be found in the Cisco documentation.
The configuration case rate is identified and labeled by the TAC Customer Support Engineer and is recognized as such in the system.
Number of TAC cases closed in the specified time period which are logged and labeled as ‘configuration’ case
Configuration Case Rate % = Total number of TAC cases closed in the specified time period
x 100%
2. Is There Any Exclusion to the Configuration Case Rate Calculation?Cases meeting the following specifications will be excluded from the configuration case rate calculation:
a. SmartSpare contract type cases.b. SVO/RMA cases: All cases opened directly thru SVO Gateway application for RMA and do not
require escalation to the TAC.c. CCO related issue cases: All cases that identified as CCO/Administrative related issues.d. DOA (Dead on Arrival) cases: All cases identified as DOA by TAC. e. Open in error cases: as such identified in case type. f. Duplicate cases: as such identified in case type.


