Page 1
PESTICIDE USAGE SURVEY REPORT 271
ARABLE CROPS
IN THE
UNITED KINGDOM
2016
D. Garthwaite, I. Barker, L. Ridley, A. Mace, G. Parrish, R. MacArthur, Y. Lu.
Land Use & Sustainability Team
Fera
Sand Hutton
York
YO41 1LZ
Page 2
ii
A NATIONAL STATISTICS SURVEY
National Statistics are produced to high professional standards set out in the Code of Practice for Official Statistics. They are free from any political interference. The UK Statistics Authority has a statutory duty to assess National Statistics for compliance with this Code of Practice. Further information is available from the Office for National Statistics website (http://www.ons.gov.uk/ons/index.html). The statistics undergo regular quality assurance reviews to ensure that they meet customers’ needs. The United Kingdom Statistics Authority has designated these statistics as National Statistics, in accordance with the Statistics and Registration Service Act 2007 and signifying compliance with the Code of Practice for Official Statistics. Designation can be broadly interpreted to mean that the statistics: • meet identified user needs; • are well explained and readily accessible; • are produced according to sound methods; and • are managed impartially and objectively in the public interest. Once statistics have been designated as National Statistics it is a statutory requirement that the Code of Practice shall continue to be observed. If you have any enquiries or feedback on the statistics included in this report they can be directed to the contact given below: Pesticide Usage Survey Team – e-mail: [email protected] Telephone: 01904 462032 Alternatively, please contact: Fera at: [email protected] DATA USES
The data collected is used for a number of purposes including:
• Quantifying pesticide usage and changes in the use of active substances over time;
• Policy, including assessing the economic and/or environmental implications of the introduction of new active
substances and the withdrawal/non-authorisation of pesticide products (the data reported to organisations such
as the OECD and EU enabling the UK to honour international agreements); evaluating changes in growing
methods and Integrated Pest Management where this has an impact on pesticide usage;
• Informing the pesticide risk assessment (authorisation) process;
• Informing the targeting of monitoring programmes for residues in food and the environment;
• Contributing to assessing the impact of pesticide use, principally as part of the Pesticides Forum’s Annual
Report;
• Responding to enquiries (for example, Parliamentary Questions, correspondence, queries under the Freedom
of Information Act or Environmental Information Regulations, etc.);
• Providing information to assist research projects which can support all of the above activities;
• Training/teaching programmes which are designed to improve practice in the use of pesticides by the
farming/training industries;
• Informing the Wildlife Incident Investigation Scheme (WIIS) programme to help identify potential misuse of pesticides.
REVISIONS POLICY This report presents a comprehensive summary of data for arable crops grown and taken to harvest in 2016. We will provide information on any revisions we make to the report or the datasets if any inaccuracies or errors occur. Details of any revisions, including the date upon which they were changed, will appear on the following website: https://secure.fera.defra.gov.uk/pusstats/surveys/index.cfm
Page 3
iii
CONTENTS Page
Executive Summary 1
Introduction 2
Trends 3
Crops 5
Pesticide Usage 6
Pesticide usage on cereals
Wheat 7
Winter barley 11
Spring barley 15
Oats 19
Rye 23
Triticale 26
Pesticide usage on oilseeds
Oilseed rape 29
Linseed 33
Pesticide usage on potatoes
Ware potatoes 37
Seed potatoes 41
Pesticide usage on pulses
Dry harvest peas 45
Field beans 49
Pesticide usage on sugar beet 53
Appendix 1 – Arable application tables 57
Appendix 2 – Arable definitions 79
Appendix 3 – Arable methodology 80
Appendix 4 – Arable standard errors 84
Appendix 5 – First raising factors 92
Acknowledgements 93
References 93
Page 4
1
EXECUTIVE SUMMARY This report contains information on arable crops including wheat, barley (spring & winter), oats, rye, triticale, oilseed rape, linseed, ware & seed potatoes, dry harvest peas, field beans and sugar beet. Data on pesticide usage on these crops were collected from 21,602 examples (individual fields of arable crops) grown on 1,246 holdings throughout the United Kingdom (16 of which were organic). Herbicide applications made to fallow ground and prior to drilling a harvested crop are included, applications made to failed crops have been excluded. Minor crops encountered, but not included in this report include borage, echium, hemp, lupin, millet and quinoa. The sample accounted for 6% of the total area of arable crops grown in the United Kingdom during the 2016 season (autumn 2015 through to harvest in 2016). The area of crops surveyed in each region was proportional to the area of arable crops grown in that region. The data on the area of pesticide treatments and the amount of active substances applied have been raised to give national usage estimates.
Wheat comprised 44% of the area of all arable crops grown in 2016, oilseed rape (spring & winter) 14%, spring barley 16%, winter barley 10%, ware potatoes 3%, beans 4%, oats 3%, sugar beet 2%, peas, rye and linseed 1% each and seed potatoes and triticale less than 1%. In terms of pesticide area treated, wheat accounted for 52% of the total, oilseed rape (spring & winter) 13%, ware potatoes 6%, spring barley 10%, winter barley 9%, beans (spring & winter) 3%, sugar beet and oats 2%, seed potatoes and peas 1% and rye, linseed & triticale less than 1%. By weight, applications to wheat constituted 53% of the total weight of active substances applied, ware potatoes 11%, oilseed rape 11%, winter barley 8%, spring barley 7%, field beans 3%, sugar beet 2%, oats, seed potatoes and peas 1% and rye, triticale & linseed less than 1% each.
Fungicides accounted for 39% of the total pesticide-treated area of arable farm crops grown in the United Kingdom in 2016, herbicides 32%, growth regulators 11%, seed treatments 8%, insecticides & nematicides 7%, molluscicides 3%, sulphur and physical control agents less than 1% each. By weight, herbicides accounted for 46% of the pesticide active substances applied, fungicides 34%, growth regulators 16% and insecticides & nematicides, molluscicides, seed treatments and sulphur 1% each.
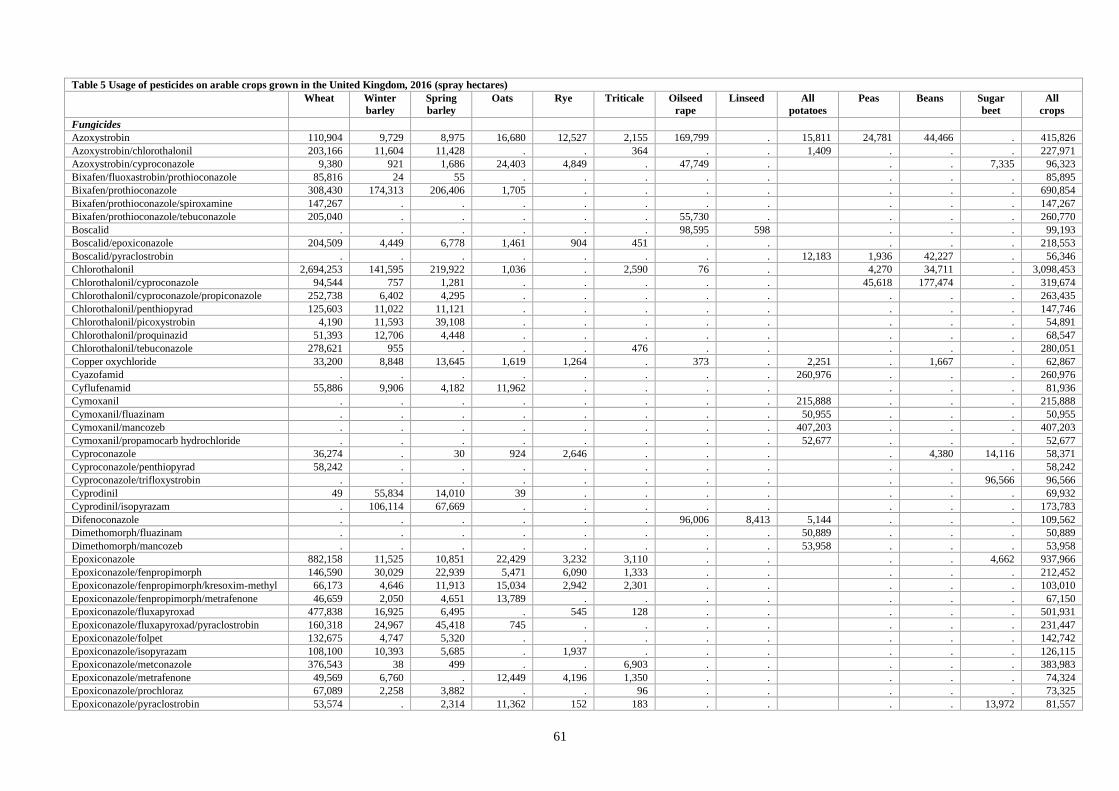
The most extensively-used fungicide formulations applied as sprays were chlorothalonil, tebuconazole, prothioconazole/tebuconazole and epoxiconazole. Chlorothalonil was also the most widely-used individual active substance and in terms of weight applied, the principal formulation used.
The most extensively-used herbicide formulations were glyphosate, diflufenican/flufenacet and iodosulfuron-methyl-
sodium/mesosulfuron-methyl. Glyphosate was the herbicide used most extensively by weight applied, accounting for
almost 2,221 tonnes of active substance.
The pyrethroids were the most extensively-used foliar applied insecticides (excluding nematicides), accounting for 94% of the insecticide-treated area, followed by neonicotinoids 2%, carbamates 2% and all other insecticides 2%. Two insecticides accounted for 74% of the total insecticide-treated area of all arable farm crops: lambda-cyhalothrin 51% and cypermethrin 23%.
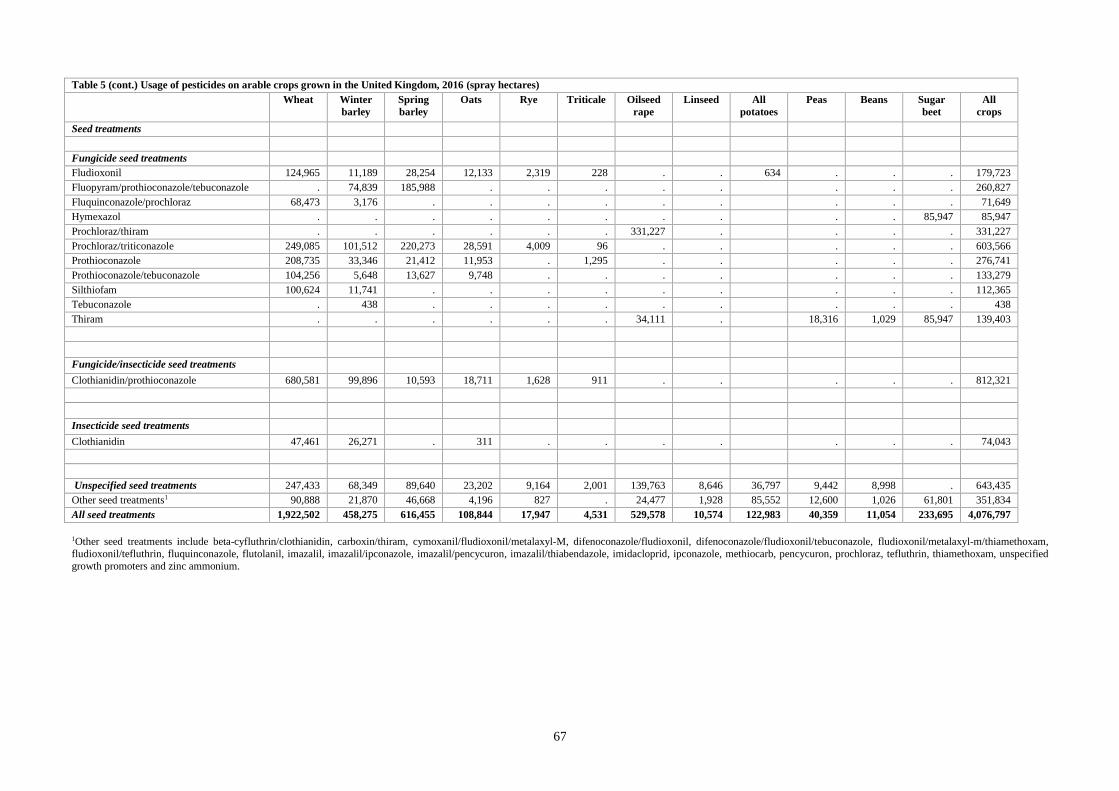
The insecticide/fungicide formulation, clothianidin/prothioconazole, was the principal seed treatment formulation used, accounting for 20% of the seed treatment area. Two fungicide formulations, prochloraz/triticonazole and prochloraz/thiram, were used on 15% and 8% of the seed treatment area.
Chlormequat applied alone or in mixtures accounted for 53% of the area of arable crops treated with specific growth regulators.
Metaldehyde (86% by area treated), ferric phosphate (13%) and methiocarb 1% were the only molluscicides encountered.
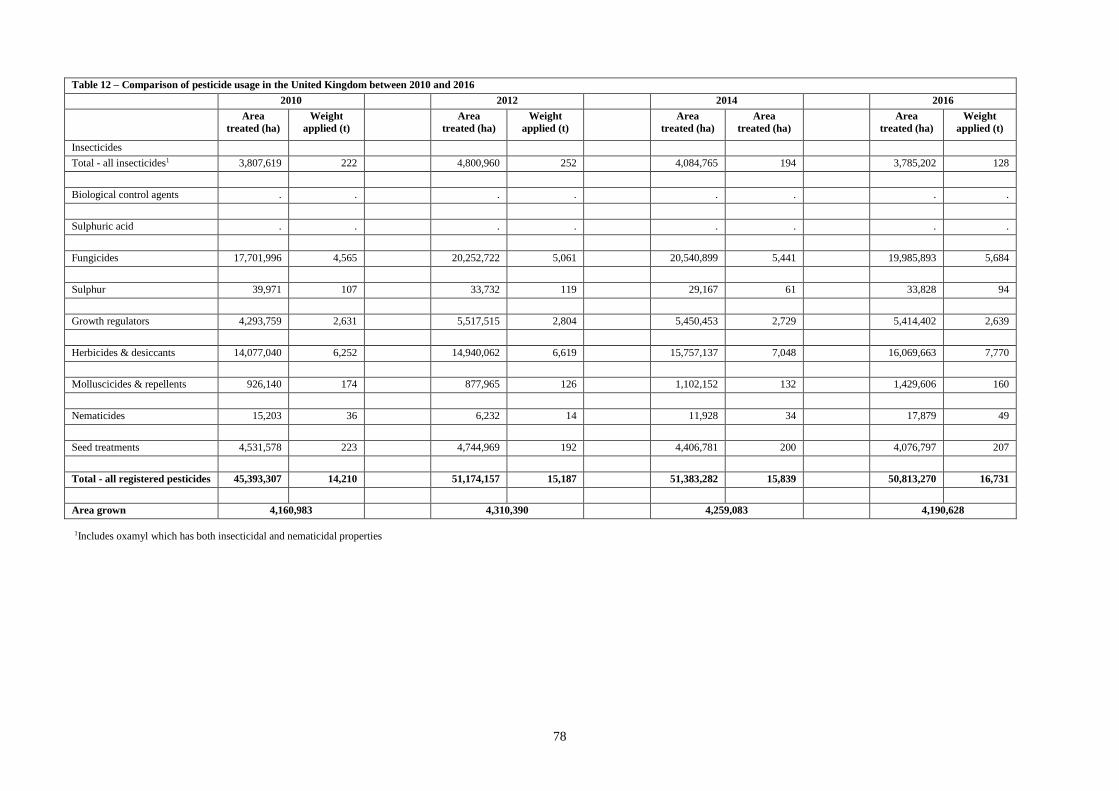
The area of all arable crops grown, excluding set-aside, increased by 1% between 2010 and 2016, and decreased 2% since 2014. Since 2010 there has been an increase in the area treated by 12%, and an increase in the weight of pesticides applied by 18%. Since the previous survey in 2014 the area treated decreased by 1%, with the weight increasing by 6%.
The report shows major increases in the use of chlorothalonil (22% by area treated, 27% by weight applied) and in glyphosate (24% by area treated and 26% by weight applied). The area treated with metaldehyde increased by 33% between 2014 and 2016 with a 21% increase in weight applied. The insecticide lambda-cyhalothrin increased by 30% in terms of area treated with a 35% increase in weight applied. The withdrawal of active substances since the 2014 survey notably include carbendazim, flusilazole and methiocarb.
Page 5
2
INTRODUCTION
The Expert Committee on Pesticides (ECP) advises government on all aspects of pesticide use. In order to discharge
this function, the Committee must regularly monitor the usage of all pesticides. It needs accurate data on the usage of
individual pesticides. Pesticide usage data are now also required under the EU Statistics Regulation (1185/2009/EC).
As part of the on-going process for obtaining data, the Pesticide Usage Survey Teams of Fera Science Ltd., a joint
venture between Capita PLC and the Department for Environment, Food & Rural Affairs (Defra), Science & Advice for
Scottish Agriculture (SASA), a division of the Scottish Government’s Agriculture and Rural Economy Directorate and
the Agri-Food & Biosciences Institute (AFBI), Department of Agriculture, Environment and Rural Affairs (DAERA)
conducted surveys of pesticide usage in arable crops in 2015/16 by visiting holdings throughout the United Kingdom
during the winter of 2016/17.
Since 2010, all surveys of pesticide usage in agriculture and horticulture have been fully co-ordinated by the survey
teams of England & Wales, Scotland and Northern Ireland. The methodology used for sample selection and the
collection of data from sample holdings is identical in each region. Reports are produced of pesticide usage throughout
the United Kingdom. All teams have undertaken recent United Kingdom Statistics Authority (UKSA) audits and the
data are accredited as National Statistics.
This was the fourth survey of usage on arable crops in the whole of the United Kingdom and the thirteenth survey of
pesticide usage on arable farm crops carried out by the Great Britain Pesticide Usage Survey Teams. The previous
report for the United Kingdom was published in 2015 covering pesticide usage on arable crops in 2014 (Garthwaite et.
al., 2015).
Additional data on crop agronomy are collected for all surveys but may not be presented within the report. For
additional data relating to the surveys please refer to the contacts below.
Information on all aspects of pesticide usage in the United Kingdom as a whole, or for Wales or the Defra regions of
England, may be obtained from the Pesticide Usage Survey Team at the Fera Science Ltd., Sand Hutton, York, UK
YO41 1LZ.
For further information please contact:
The survey team – e-mail: [email protected] Telephone: 01904 462 032
Or visit the website: https://secure.fera.defra.gov.uk/pusstats/surveys/index.cfm
Alternatively, please contact: Fera at: [email protected]
Further data relating specifically to Scotland may be obtained from the Pesticide Usage Survey Team at Science and
Advice for Scottish Agriculture, Edinburgh. Also available at:
http://www.sasa.gov.uk/pesticides/pesticide-usage/pesticide-usage-survey-reports
Copies of reports on pesticide usage in Northern Ireland may be obtained from Her Majesty's Stationery Offices. Also
available at:
https://www.afbini.gov.uk/articles/pesticide-usage-monitoring-reports
Recently-published reports for the United Kingdom, Great Britain, England & Wales and Northern Ireland can also be
viewed and downloaded on the Internet at:
https://secure.fera.defra.gov.uk/pusstats/surveys/index.cfm
Page 6
3
TRENDS
0
500
1,000
1,500
2,000
2,500
3,000
3,500
4,000
4,500
5,000
2010 2012 2014 2016
thou
san
d h
ect
are
s
Figure 1 - Changes in the area of arable crops grown in the United Kingdom - 2010 - 2016
0
10,000
20,000
30,000
40,000
50,000
60,000
2010 2012 2014 2016
treate
d t
hou
san
d h
ect
are
s
Figure 2 - Changes in the overall treated area of arable crops in the United Kingdom - 2010 - 2016
12.5
13.0
13.5
14.0
14.5
15.0
15.5
16.0
16.5
17.0
2010 2012 2014 2016
tho
usa
nd
to
nn
es
Figure 3 - Changes in the overall weight of pesticides applied to arable crops in the United Kingdom -
2010 - 2016
Page 7
4
TRENDS (cont.)
0
5,000
10,000
15,000
20,000
25,000
Insecticides Fungicides Growth regulators Herbicides & desiccants Molluscicides &repellents
Seed treatments
treate
d t
hou
san
d h
ect
are
s
Figure 4 - Changes in the area treated of the major pesticide groups applied to arable crops in the
United Kingdom - 2010 - 2016
2010
2012
2014
2016
0
1
2
3
4
5
6
7
8
9
Insecticides Fungicides Growth regulators Herbicides & desiccants Molluscicides &repellents
Seed treatments
tho
usa
nd
to
nn
es
Figure 5 - Changes in the weight of the major pesticide groups applied to arable crops in the United
Kingdom - 2010 - 2016
2010
2012
2014
2016
Page 8
5
CROPS
Information is given concerning thirteen types of arable crops, comprising wheat; spring & winter barley; oats; rye;
triticale; oilseed rape; linseed, ware & seed potatoes; dry harvest peas; field beans; and sugar beet. Data on pesticide
usage on these were collected from 21,602 examples (individual fields of arable crops or groups of fields treated
identically) grown on 1,246 holdings throughout the United Kingdom. The sample accounted for 6% of the total area of
arable crops grown in United Kingdom during the 2016 harvest season.
16%
23%
11%4%
2%
10%
8%
12%
1% 12%
1%
Figure 6 - Regional distribution of arable crops in the United Kingdom - 20161
East Midlands
Eastern
London & South East
North East
North West
South West
West Midlands
Yorkshire & the Humber
Wales
Scotland
Northern Ireland
44%
11%
16%
3%
1%
<1% 14%
1%
3%<1%
1%
4%
2%
Figure 6a - Relative areas of different crops in the United Kingdom - 2016
Wheat
Winter barley
Spring barley
Oats
Rye
Triticale
Oilseed rape
Linseed
Potatoes
Seed potatoes
Peas
Beans
Sugar beet
0
5
10
15
20
25
30
EastMidlands
Eastern London &South East
NorthEast
NorthWest
SouthWest
WestMidlands
Yorkshire& the
Humber
Wales Scotland NorthernIreland
Pe
rcen
tage o
f to
tal
Figure 6b - Comparison of regional distribution and treated area of arable crops in the United
Kingdom - 2016
Area grown
Area treated
1Please note - All Pie-Charts within this report should be read clockwise from the top, as both the pie segments and the contents of the key
appear in the same order.
Page 9
6
PESTICIDE USAGE
16%
23%
11%
4%
2%
10%
8%
12%
1%12%
1%
Figure 7 - Regional distribution of pesticide usage on arable crops in the United Kingdom- 2016
(area treated)
East Midlands
Eastern
London & South East
North East
North West
South West
West Midlands
Yorkshire & the Humber
Wales
Scotland
Northern Ireland
0
5
10
15
20
25
30
35
40
45
50
Insecticides &nematicides
Fungicides Herbicides Growthregulators
Molluscicides &repellents
Sulphur Seed treatments
Pe
rcen
tage o
f to
tal
Figure 8 - Usage of pesticides on arable crops in the United Kingdom - 2016
Area treated
Weight
0.0
2.0
4.0
6.0
8.0
10.0
12.0
14.0
16.0
18.0
Insecticides &nematicides
Fungicides Herbicides Growth regulators Molluscicides &repellents
All pesticides
Nu
mb
er o
f a
pp
licati
on
s
Figure 9 - Average number of applications made to arable crops in the United Kingdom - 2016
(excluding seed treatments)
Spray rounds
Products
Active substances
For maps of the United Kingdom showing individual Government Office regions, please visit the following website:
http://www.ons.gov.uk/ons/guide-method/geography/beginner-s-guide/maps/index.html
Page 10
7
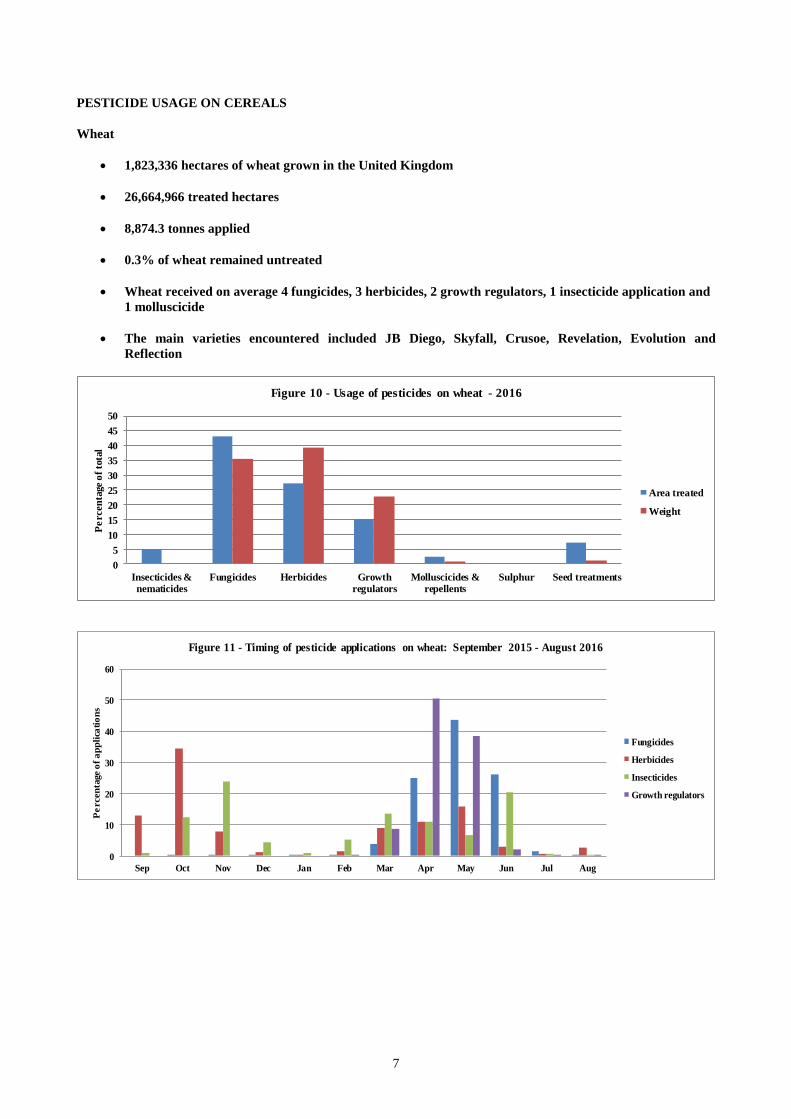
PESTICIDE USAGE ON CEREALS
Wheat
• 1,823,336 hectares of wheat grown in the United Kingdom
• 26,664,966 treated hectares
• 8,874.3 tonnes applied
• 0.3% of wheat remained untreated
• Wheat received on average 4 fungicides, 3 herbicides, 2 growth regulators, 1 insecticide application and
1 molluscicide
• The main varieties encountered included JB Diego, Skyfall, Crusoe, Revelation, Evolution and
Reflection
0
5
10
15
20
25
30
35
40
45
50
Insecticides &
nematicides
Fungicides Herbicides Growth
regulators
Molluscicides &
repellents
Sulphur Seed treatments
Pe
rcen
tage o
f to
tal
Figure 10 - Usage of pesticides on wheat - 2016
Area treated
Weight
0
10
20
30
40
50
60
Sep Oct Nov Dec Jan Feb Mar Apr May Jun Jul Aug
Pe
rcen
tage o
f a
pp
lica
tio
ns
Figure 11 - Timing of pesticide applications on wheat: September 2015 - August 2016
Fungicides
Herbicides
Insecticides
Growth regulators
Page 11
8
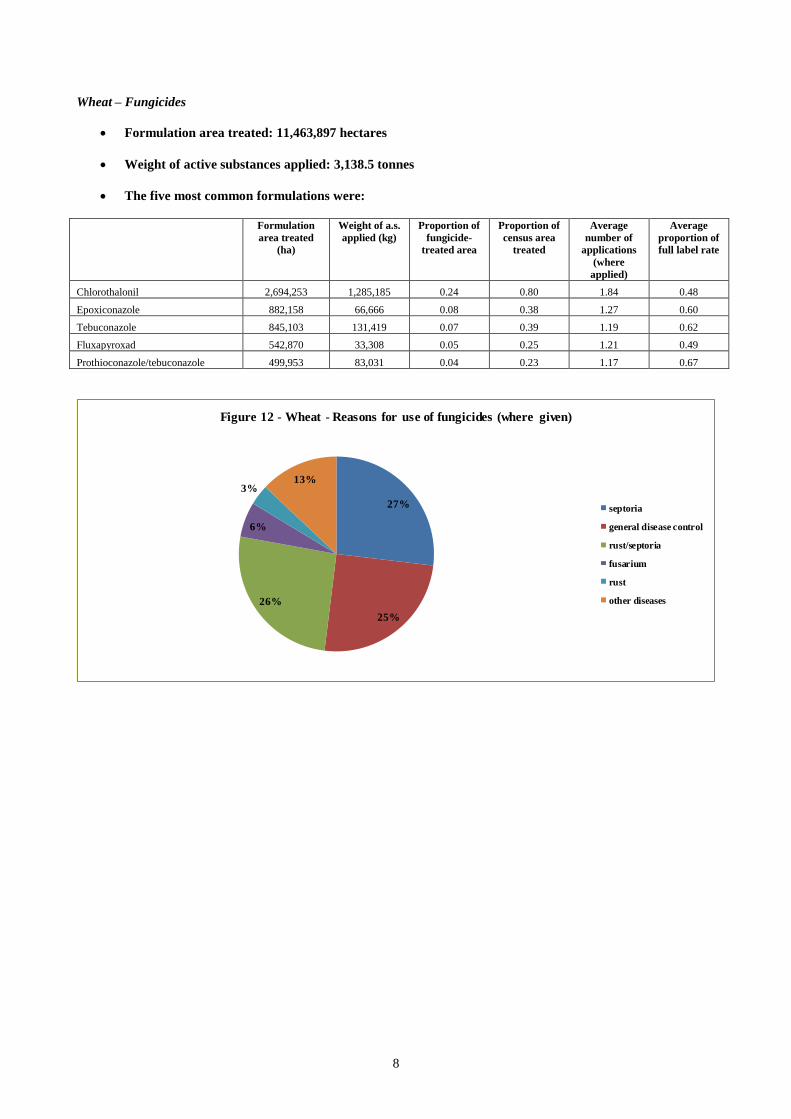
Wheat – Fungicides
• Formulation area treated: 11,463,897 hectares
• Weight of active substances applied: 3,138.5 tonnes
• The five most common formulations were:
Formulation
area treated
(ha)
Weight of a.s.
applied (kg)
Proportion of
fungicide-
treated area
Proportion of
census area
treated
Average
number of
applications
(where
applied)
Average
proportion of
full label rate
Chlorothalonil 2,694,253 1,285,185 0.24 0.80 1.84 0.48
Epoxiconazole 882,158 66,666 0.08 0.38 1.27 0.60
Tebuconazole 845,103 131,419 0.07 0.39 1.19 0.62
Fluxapyroxad 542,870 33,308 0.05 0.25 1.21 0.49
Prothioconazole/tebuconazole 499,953 83,031 0.04 0.23 1.17 0.67
27%
25%
26%
6%
3%13%
Figure 12 - Wheat - Reasons for use of fungicides (where given)
septoria
general disease control
rust/septoria
fusarium
rust
other diseases
Page 12
9
Wheat – Herbicides
• Formulation area treated: 7,270,944 hectares
• Weight of active substances applied: 3,477.8 tonnes
• The five most common formulations were:
Formulation
area treated
(ha)
Weight of a.s.
applied (kg)
Proportion of
herbicide –
treated area
Proportion of
census area
treated
Average
number of
applications
(where
applied)
Average
proportion of
full label rate
Glyphosate 1,075,162 843,343 0.15 0.46 1.27 0.49
Diflufenican/flufenacet 798,781 185,177 0.11 0.41 1.05 0.83
Iodosulfuron-methyl-sodium/mesosulfuron-methyl 664,557 9,863 0.09 0.35 1.03 0.94
Fluroxypyr 513,087 65,258 0.07 0.27 1.03 0.47
Diflufenican 446,131 30,573 0.06 0.24 1.02 0.55
35%
19%
18%
6%
6%
16%
Figure 13 - Wheat - Reasons for use of herbicides (where given)
general weed control
blackgrass
broad-leaved weeds
cleavers
grass weeds
other weeds
Wheat – Growth regulators
• Formulation area treated: 4,011,183 hectares
• Weight of active substances applied: 2,008.6tonnes
• The five most common formulations were:
Formulation
area treated
(ha)
Weight of a.s.
applied (kg)
Proportion of
growth
regulator –
treated area
Proportion of
census area
treated
Average
number of
applications
(where
applied)
Average
proportion of
full label rate
Chlormequat 2,158,837 1,804,577 0.54 0.82 1.44 0.56
Trinexapac-ethyl 1,295,712 41,121 0.32 0.53 1.33 0.31
Mepiquat chloride/prohexadione-
calcium 150,787 20,923 0.04 0.07 1.18 0.26
Chlormequat/imazaquin 149,220 75,245 0.04 0.08 1.09 0.55
2-chloroethylphosphonic
acid/mepiquat 64,173 22,427 0.02 0.03 1.06 0.38
Page 13
10
Wheat – Insecticides
• Formulation area treated: 1,305,358 hectares
• Weight of active substances applied: 27.6 tonnes
• The five most common formulations were:
Formulation
area treated
(ha)
Weight of a.s.
applied (kg)
Proportion of
insecticide –
treated area
Proportion of
census area
treated
Average
number of
applications
(where
applied)
Average
proportion of
full label rate
Lambda-cyhalothrin 671,302 3,290 0.51 0.29 1.28 0.98
Cypermethrin 393,661 9,442 0.30 0.18 1.16 0.96
Esfenvalerate 103,101 374 0.08 0.05 1.09 0.88
Zeta-cypermethrin 50,787 642 0.04 0.02 1.34 0.84
Tau-fluvalinate 20,683 668 0.02 0.01 1.00 0.67
93%
2%
5%
Figure 14 - Wheat - Reasons for use of insecticides (where given)
aphids
orange wheat blossom midge
other pests
Wheat – Seed Treatments
• Formulation area treated: 1,922,502
• Weight of active substances applied: 116.6 tonnes
• 4% of the seed remained untreated
• Where specified the most common formulations were:
Formulation area
treated (ha)
Weight of a.s. applied
(kg)
Proportion of seed
treatment-treated area
Proportion of census
area treated
(excluding unspecified
treatments)
Clothianidin/prothioconazole 680,581 72,487 0.35 0.37
Prochloraz/triticonazole 249,085 7,276 0.13 0.13
Prothioconazole 208,735 3,739 0.11 0.11
Fludioxonil 124,965 1,145 0.07 0.07
Prothioconazole/tebuconazole 104,256 2,124 0.05 0.06
Page 14
11
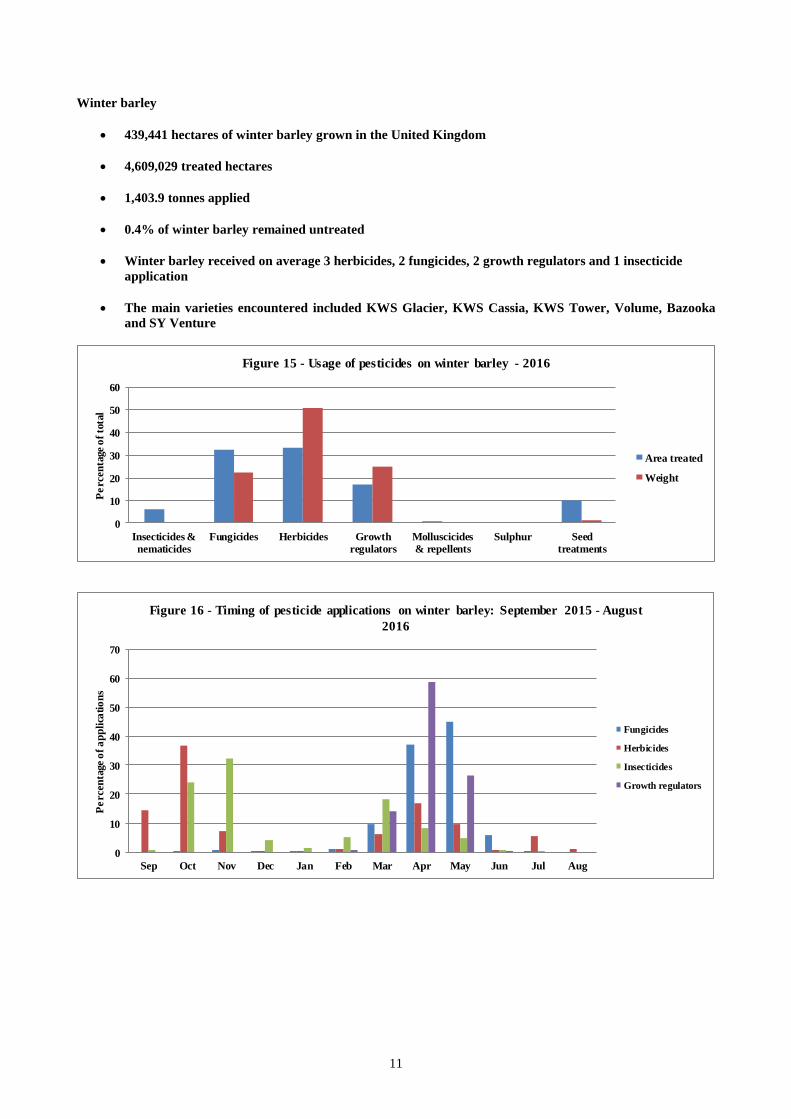
Winter barley
• 439,441 hectares of winter barley grown in the United Kingdom
• 4,609,029 treated hectares
• 1,403.9 tonnes applied
• 0.4% of winter barley remained untreated
• Winter barley received on average 3 herbicides, 2 fungicides, 2 growth regulators and 1 insecticide
application
• The main varieties encountered included KWS Glacier, KWS Cassia, KWS Tower, Volume, Bazooka
and SY Venture
0
10
20
30
40
50
60
Insecticides &
nematicides
Fungicides Herbicides Growth
regulators
Molluscicides
& repellents
Sulphur Seed
treatments
Pe
rcen
tage o
f to
tal
Figure 15 - Usage of pesticides on winter barley - 2016
Area treated
Weight
0
10
20
30
40
50
60
70
Sep Oct Nov Dec Jan Feb Mar Apr May Jun Jul Aug
Pe
rcen
tage o
f a
pp
lica
tio
ns
Figure 16 - Timing of pesticide applications on winter barley: September 2015 - August
2016
Fungicides
Herbicides
Insecticides
Growth regulators
Page 15
12
Winter barley – Fungicides
• Formulation area treated: 1,488,848 hectares
• Weight of active substances applied: 310.7 tonnes
• The five most common formulations were:
Formulation
area treated
(ha)
Weight of a.s.
applied (kg)
Proportion of
fungicide-
treated area
Proportion of
census area
treated
Average
number of
applications
(where
applied)
Average
proportion of
full label rate
Bixafen/prothioconazole 174,313 22,884 0.12 0.24 1.66 0.50
Chlorothalonil 141,595 65,517 0.10 0.27 1.21 0.46
Prothioconazole/spiroxamine 124,063 29,385 0.08 0.19 1.47 0.41
Prothioconazole/trifloxystrobin 118,319 17,784 0.08 0.20 1.35 0.69
Cyprodinil/isopyrazam 106,114 27,859 0.07 0.20 1.22 0.54
32%
21%10%
5%
3%
29%
Figure 17 - Winter barley - Reasons for use of fungicides (where given)
general disease control
rhynchosporium
net blotch/rhynchosporium
mildew
mildew/rhynchosporium
other diseases
Page 16
13
Winter barley – Herbicides
• Formulation area treated: 1,539,110 hectares
• Weight of active substances applied: 715.7 tonnes
• The five most common formulations were:
Formulation
area treated
(ha)
Weight of a.s.
applied (kg)
Proportion of
herbicide –
treated area
Proportion of
census area
treated
Average
number of
applications
(where
applied)
Average
proportion of
full label rate
Glyphosate 227,075 171,441 0.15 0.42 1.23 0.48
Diflufenican/flufenacet 215,919 49,552 0.14 0.47 1.03 0.83
Pinoxaden 142,515 5,019 0.09 0.32 1.00 0.59
Diflufenican 108,873 7,197 0.07 0.24 1.03 0.53
Pendimethalin 90,706 73,890 0.06 0.20 1.02 0.62
34%
21%10%
9%
7%
4%
15%
Figure 18 - Winter barley - Reasons for use of herbicides (where given)
general weed control
broad-leaved weeds
blackgrass
wild oats
cleavers
grass weeds
other weeds
Winter barley – Growth regulators
• Formulation area treated: 786,932 hectares
• Weight of active substances applied: 347.4 tonnes
• The five most common formulations encountered were:
Formulation
area treated
(ha)
Weight of a.s.
applied (kg)
Proportion of
growth
regulator –
treated area
Proportion of
census area
treated
Average
number of
applications
(where
applied)
Average
proportion of
full label rate
Chlormequat 330,689 288,393 0.42 0.63 1.19 0.58
Trinexapac-ethyl 259,907 9,066 0.33 0.49 1.20 0.23
Mepiquat chloride/prohexadione-
calcium 61,208 10,198 0.08 0.13 1.09 0.32
2-chloroethylphosphonic
acid/mepiquat 48,048 19,584 0.06 0.10 1.05 0.44
2-chloroethylphosphonic acid 44,967 8,852 0.06 0.10 1.01 0.41
Page 17
14
Winter barley – Insecticides
• Formulation area treated: 290,576 hectares
• Weight of active substances applied: 3.7 tonnes
• The five most common formulations were:
Formulation
area treated
(ha)
Weight of a.s.
applied (kg)
Proportion of
insecticide –
treated area
Proportion of
census area
treated
Average
number of
applications
(where
applied)
Average
proportion of
full label rate
Lambda-cyhalothrin 135,585 636 0.47 0.25 1.22 0.94
Cypermethrin 94,232 2,314 0.32 0.19 1.13 0.98
Esfenvalerate 34,688 122 0.12 0.08 1.03 0.85
Zeta-cypermethrin 12,320 151 0.04 0.03 1.08 0.82
Tau-fluvalinate 6,198 233 0.02 0.01 1.39 0.78
Almost all, 97%, of insecticide applications were for the control of aphids.
Winter barley – Seed Treatments
• Formulation area treated: 458,275 hectares
• Weight of active substances applied: 20.3 tonnes
• 4% of the seed remained untreated
• Where specified the most common formulations were:
Formulation area
treated (ha)
Weight of a.s. applied
(kg)
Proportion of seed
treatment-treated area
Proportion of census
area treated
(excluding unspecified
treatments)
Prochloraz/triticonazole 101,512 2,806 0.22 0.23
Clothianidin/prothioconazole 99,896 10,218 0.22 0.23
Fluopyram/prothioconazole/tebuconazole 74,839 1,204 0.16 0.17
Prothioconazole 33,346 572 0.07 0.08
Clothianidin 26,271 2,246 0.06 0.06
Page 18
15
Spring barley
• 682,968 hectares of spring barley grown in the United Kingdom
• 4,971,018 treated hectares
• 1,211.5 tonnes applied
• 1.4% of spring barley remained untreated
• Spring barley received on average 3 herbicides, 2 fungicides, 1 growth regulator and 1 insecticide
• The main varieties encountered included Propino, Concerto, Odyssey, KWS Irina and Waggon
0
10
20
30
40
50
60
70
Insecticides &
nematicides
Fungicides Herbicides Growth
regulators
Molluscicides
& repellents
Sulphur Seed
treatments
Pe
rcen
tage o
f to
tal
Figure 19 - Usage of pesticides on spring barley - 2016
Area treated
Weight
0.00
10.00
20.00
30.00
40.00
50.00
60.00
70.00
Sep Oct Nov Dec Jan Feb Mar Apr May Jun Jul Aug
Pe
rcen
tage o
f a
pp
lica
tio
ns
Figure 20 - Timing of pesticide applications on spring barley: September 2015 - August
2016
Fungicides
Herbicides
Insecticides
Growth regulators
Page 19
16
Spring barley – Fungicides
• Formulation area treated: 1,758,555 hectares
• Weight of active substances applied: 357.5 tonnes
• The five most common formulations were:
Formulation
area treated
(ha)
Weight of a.s.
applied (kg)
Proportion of
fungicide-
treated area
Proportion of
census area
treated
Average
number of
applications
(where
applied)
Average
proportion of
full label rate
Chlorothalonil 219,922 98,317 0.13 0.28 1.16 0.45
Prothioconazole/spiroxamine 219,061 45,421 0.12 0.23 1.42 0.36
Bixafen/prothioconazole 206,405 24,603 0.12 0.20 1.49 0.46
Prothioconazole/trifloxystrobin 145,576 19,581 0.08 0.16 1.30 0.62
Fluoxastrobin/prothioconazole/trifloxy
strobin 105,826 12,795 0.06 0.10 1.48 0.50
51%
22%
5%
4%
4%
14%
Figure 21- Spring barley - Reasons for use of fungicides (where given)
general disease control
rhynchosporium
net blotch/rhynchosporium
mildew/rhynchosporium
mildew
other diseases
Page 20
17
Spring barley – Herbicides
• Formulation area treated: 2,086,523 hectares
• Weight of active substances applied: 711.7 tonnes
• The five most common formulations were:
Formulation
area treated
(ha)
Weight of a.s.
applied (kg)
Proportion of
herbicide –
treated area
Proportion of
census area
treated
Average
number of
applications
(where
applied)
Average
proportion of
full label rate
Glyphosate 361,687 294,611 0.17 0.41 1.29 0.50
Metsulfuron-methyl/thifensulfuron-
methyl 263,512 9,034 0.13 0.37 1.05 0.78
Pinoxaden 227,448 7,657 0.11 0.32 1.05 0.56
Fluroxypyr 206,692 23,845 0.10 0.30 1.01 0.77
Mecoprop-P 161,571 102,214 0.08 0.23 1.03 0.49
36%
27%
8%
5%
3%
21%
Figure 22 - Spring barley - Reasons for use of herbicides (where given)
general weed control
broad-leaved weeds
wild oats
cleavers
crop desiccation
other weeds
Spring barley – Growth regulators
• Formulation area treated: 323,772 hectares
• Weight of active substances applied: 95.2 tonnes
• The five most common formulations were:
Formulation
area treated
(ha)
Weight of
a.s. applied
(kg)
Proportion of
growth
regulator –
treated area
Proportion of
census area
treated
Average
number of
applications
(where
applied)
Average
proportion of
full label rate
Chlormequat 99,763 64,458 0.31 0.14 1.01 0.75
Trinexapac-ethyl 91,872 3,050 0.28 0.12 1.10 0.27
2-chloroethylphosphonic acid 38,079 4,958 0.12 0.06 1.00 0.54
Mepiquat chloride/prohexadione-calcium 36,776 5,164 0.11 0.04 1.21 0.27
2-chloroethylphosphonic acid/mepiquat 34,499 9,916 0.11 0.05 1.00 0.42
Page 21
18
Spring barley – Insecticides
• Formulation area treated: 162,336 hectares
• Weight of active substances applied: 1.7 tonnes
• The five most common formulations were:
Formulation
area treated
(ha)
Weight of a.s.
applied (kg)
Proportion of
insecticide –
treated area
Proportion of
census area
treated
Average
number of
applications
(where
applied)
Average
proportion of
full label rate
Lambda-cyhalothrin 111,687 535 0.69 0.15 1.08 0.96
Esfenvalerate 16,252 60 0.10 0.02 1.04 0.89
Cypermethrin 13,014 226 0.08 0.02 1.00 0.70
Zeta-cypermethrin 12,367 175 0.08 0.02 1.00 0.94
Beta-cyfluthrin 4,235 21 0.03 0.01 1.00 0.65
83%
17%
Figure 23 - Spring barley - Reasons for use of insecticides (where given)
aphids
other pests
Spring barley – Seed Treatments
• Formulation area treated: 616,455 hectares
• Weight of active substances applied: 14.2 tonnes
• 9.8% of the seed remained untreated
• Where specified the most common formulations were:
Formulation area
treated (ha)
Weight of a.s. applied
(kg)
Proportion of seed
treatment-treated area
Proportion of census
area treated
(excluding unspecified
treatments)
Prochloraz/triticonazole 220,273 6,852 0.36 0.32
Fluopyram/prothioconazole/tebuconaz
ole 185,988 3,231 0.30 0.27
Fludioxonil 28,254 265 0.05 0.04
Imazalil/ipconazole 25,470 341 0.04 0.04
Prothioconazole 21,412 416 0.03 0.03
Page 22
19
Oats
• 140,897 hectares of oats grown in the United Kingdom
• 926,343 treated hectares
• 233.4 tonnes applied
• 6.2% of oats remained untreated
• Oats received on average 2 herbicides, 2 fungicides, 1 growth regulator and 1 insecticide
• 53% of the crop was winter sown
• The main varieties encountered included Mascani, Canyon, Gerald, Dalguise, Firth and Aspen
0
5
10
15
20
25
30
35
40
45
50
Insecticides &
nematicides
Fungicides Herbicides Growth
regulators
Molluscicides
& repellents
Sulphur Seed
treatments
Pe
rcen
tage o
f to
tal
Figure 24 - Usage of pesticides on oats - 2016
Area treated
Weight
0
10
20
30
40
50
60
70
Sep Oct Nov Dec Jan Feb Mar Apr May Jun Jul Aug
Pe
rcen
tage o
f a
pp
lica
tio
ns
Figure 25 - Timing of pesticide applications on oats: September 2015 - August 2016
Fungicides
Herbicides
Insecticides
Growth regulators
Page 23
20
Oats – Fungicides
• Formulation area treated: 281,067 hectares
• Weight of active substances applied: 43.7 tonnes
• The five most common formulations were:
Formulation
area treated
(ha)
Weight of a.s.
applied (kg)
Proportion of
fungicide-
treated area
Proportion of
census area
treated
Average
number of
applications
(where
applied)
Average
proportion of
full label rate
Tebuconazole 31,863 4,783 0.11 0.17 1.37 0.60
Proquinazid 26,977 722 0.10 0.16 1.23 0.54
Azoxystrobin/cyproconazole 24,403 4,376 0.09 0.15 1.14 0.64
Epoxiconazole 22,429 1,145 0.08 0.12 1.36 0.41
Azoxystrobin 16,680 1,942 0.06 0.11 1.07 0.47
23%
20%
19%
16%
11%
9%
2%
Figure 26 - Oats - Reasons for use of fungicides (where given)
mildew
general disease control
crown rust
rust
mildew/rust
crown rust/mildew
other diseases
Page 24
21
Oats – Herbicides
• Formulation area treated: 318,530 hectares
• Weight of active substances applied: 104.6 tonnes
• The five most common formulations were:
Formulation
area treated
(ha)
Weight of a.s.
applied (kg)
Proportion of
herbicide –
treated area
Proportion of
census area
treated
Average
number of
applications
(where
applied)
Average
proportion of
full label rate
Glyphosate 65,322 52,144 0.21 0.42 1.11 0.49
Fluroxypyr 31,568 4,189 0.10 0.22 1.02 0.73
Mecoprop-P 28,295 20,194 0.09 0.20 1.01 0.55
Diflufenican/flupyrsulfuron-methyl 22,734 1,653 0.07 0.16 1.02 0.92
Florasulam/fluroxypyr 22,184 1,667 0.07 0.15 1.01 0.54
37%
33%
10%
4%
3%13%
Figure 27 - Oats - Reasons for use of herbicides (where given)
general weed control
broad-leaved weeds
cleavers
crop desiccation
grass weeds
other weeds
Oats – Growth regulators
• Formulation area treated: 153,044 hectares
• Weight of active substances applied: 80.6 tonnes
• The five formulations encountered were:
Formulation
area treated
(ha)
Weight of a.s.
applied (kg)
Proportion of
growth
regulator –
treated area
Proportion of
census area
treated
Average
number of
applications
(where
applied)
Average
proportion of
full label rate
Chlormequat 81,187 75,882 0.53 0.52 1.11 0.62
Trinexapac-ethyl 54,561 1,963 0.36 0.34 1.13 0.36
Mepiquat chloride/prohexadione-
calcium 16,473 2,703 0.11 0.11 1.07 0.31
Prohexadione-calcium/trinexapac-ethyl 793 25 0.01 0.01 1.00 0.34
2-chloroethylphosphonic
acid/mepiquat 30 8 0.00 0.00 1.00 0.37
Page 25
22
Oats – Insecticides
• Formulation area treated: 61,844 hectares
• Weight of active substances applied: 0.7 tonnes
• The five most common formulations were:
Formulation
area treated
(ha)
Weight of a.s.
applied (kg)
Proportion of
insecticide –
treated area
Proportion of
census area
treated
Average
number of
applications
(where
applied)
Average
proportion of
full label rate
Lambda-cyhalothrin 37,930 180 0.61 0.25 1.06 0.95
Cypermethrin 14,213 347 0.23 0.09 1.06 0.98
Zeta-cypermethrin 7,073 69 0.11 0.05 1.00 0.65
Alpha-cypermethrin 1,516 15 0.02 0.01 1.00 0.67
Beta-cyfluthrin 855 2 0.01 0.01 1.00 0.38
Almost all, 94%, of insecticide applications were for the control of aphids.
Oats – Seed Treatments
• Formulation area treated: 108,844 hectares
• Weight of active substances applied: 3.4 tonnes
• 22.7% of the seed remained untreated
• Where specified the most common formulations were:
Formulation area
treated (ha)
Weight of a.s. applied
(kg)
Proportion of seed
treatment-treated area
Proportion of census
area treated
(excluding unspecified
treatments)
Prochloraz/triticonazole 28,591 765 0.26 0.20
Clothianidin/prothioconazole 18,711 1,716 0.17 0.13
Fludioxonil 12,133 110 0.11 0.08
Prothioconazole 11,953 217 0.11 0.08
Prothioconazole/tebuconazole 9,747 193 0.09 0.07
Page 26
23
Rye
• 29,765 hectares of rye grown in the United Kingdom
• 229,834 treated hectares
• 69.7 tonnes applied
• 0.4% of rye remained untreated
• Rye received on average 2 fungicides, 2 growth regulators, 2 herbicides, 2 insecticide and 1 molluscicide
• The main varieties encountered included KWS Magnifico, SU Cossani, SU Drive and Humbolt
0
5
10
15
20
25
30
35
40
45
50
Insecticides &nematicides
Fungicides Herbicides Growthregulators
Molluscicides &repellents
Seed treatments
Pe
rcen
tage o
f to
tal
Figure 28 - Usage of pesticides on rye - 2016
Area treated
Weight
0
10
20
30
40
50
60
70
Sep Oct Nov Dec Jan Feb Mar Apr May Jun Jul Aug
Pe
rcen
tage o
f a
pp
lica
tio
ns
Figure 29 - Timing of pesticide applications on rye: September 2015 - August 2016
Fungicides
Herbicides
Insecticides
Growth regulators
Page 27
24
Rye – Fungicides
• Formulation area treated: 65,398 hectares
• Weight of active substances applied: 11.6 tonnes
• The five most common formulations were:
Formulation
area treated
(ha)
Weight of a.s.
applied (kg)
Proportion of
fungicide-
treated area
Proportion of
census area
treated
Average
number of
applications
(where
applied)
Average
proportion of
full label rate
Azoxystrobin 12,527 1,611 0.19 0.31 1.41 0.51
Epoxiconazole/fenpropimorph 6,090 1,740 0.09 0.18 1.16 0.57
Fenpropimorph 5,773 1,822 0.09 0.16 1.25 0.42
Tebuconazole 5,183 672 0.08 0.14 1.33 0.52
Azoxystrobin/cyproconazole 4,849 1,205 0.07 0.17 1.00 0.89
Septoria/rust accounted for 29% of the reasons for use of fungicides, with mildew/rust being specified on 27% of the
area. General disease control and mildew each accounted for 19% of the area, with other diseases making up the
remaining 6%. Rye – Herbicides
• Formulation area treated: 68,402 hectares
• Weight of active substances applied: 30.0 tonnes
• The five most common formulations were:
Formulation
area treated
(ha)
Weight of a.s.
applied (kg)
Proportion of
herbicide –
treated area
Proportion of
census area
treated
Average
number of
applications
(where
applied)
Average
proportion of
full label rate
Glyphosate 12,772 11,355 0.19 0.37 1.15 0.52
Pendimethalin 11,853 10,145 0.17 0.41 1.00 0.65
Diflufenican/flufenacet 11,678 2,895 0.17 0.41 1.00 0.90
Metsulfuron-methyl/tribenuron-methyl 8,066 77 0.12 0.28 1.00 0.79
Diflufenican 6,113 310 0.09 0.21 1.00 0.49
Page 28
25
Rye – Growth regulators
• Formulation area treated: 53,639 hectares
• Weight of active substances applied: 27.1 tonnes
• The five most common formulations were:
Formulation
area treated
(ha)
Weight of a.s.
applied (kg)
Proportion of
growth
regulator –
treated area
Proportion of
census area
treated
Average
number of
applications
(where
applied)
Average
proportion of
full label rate
Chlormequat 22,491 21,533 0.42 0.62 1.26 0.64
Trinexapac-ethyl 18,528 733 0.35 0.60 1.08 0.39
2-chloroethylphosphonic acid/mepiquat 7,182 3,956 0.13 0.25 1.02 0.60
Mepiquat chloride/prohexadione-
calcium 3,231 641 0.06 0.11 1.00 0.38
Prohexadione-calcium/trinexapac-
ethyl 1,524 48 0.03 0.05 1.00 0.25
Rye – Insecticides
• Formulation area treated: 18,931 hectares
• Weight of active substances applied: 0.2 tonnes
• The five formulations encountered were:
Formulation
area treated
(ha)
Weight of a.s.
applied (kg)
Proportion of
insecticide –
treated area
Proportion of
census area
treated
Average
number of
applications
(where
applied)
Average
proportion of
full label rate
Lambda-cyhalothrin 10,357 52 0.55 0.24 1.48 1.00
Cypermethrin 5,917 145 0.31 0.19 1.07 0.98
Zeta-cypermethrin 2,325 23 0.12 0.03 3.00 0.67
Tau-fluvalinate 275 13 0.01 0.01 1.00 0.98
Esfenvalerate 57 0 0.00 0.00 1.00 1.01
Rye – Seed Treatments
• Formulation area treated: 17,947 hectares
• Weight of active substances applied: 0.2 tonnes
• 35.9% of seed remained untreated
• The five formulations encountered were:
Formulation area
treated (ha)
Weight of a.s. applied
(kg)
Proportion of seed
treatment-treated area
Proportion of census
area treated
(excluding unspecified
treatments)
Prochloraz/triticonazole 4,009 62 0.22 0.14
Fludioxonil 2,319 9 0.13 0.08
Clothianidin/prothioconazole 1,628 99 0.09 0.06
Difenoconazole/fludioxonil/tebuconazole 545 4 0.03 0.02
Difenoconazole/fludioxonil 282 2 0.02 0.01
Page 29
26
Triticale
• 11,018 hectares of triticale grown in the United Kingdom
• 103,998 treated hectares
• 30.9 tonnes applied
• 1.2% of triticale remained untreated
• Triticale received on average 3 herbicides, 3 fungicides, 1 insecticide and 2 growth regulators
• The main varieties encountered included Tribeca, Ragtac, Dublet, KWS Fido and Agostino
0
5
10
15
20
25
30
35
40
45
50
Insecticides &nematicides
Fungicides Herbicides Growthregulators
Molluscicides &repellents
Seed treatments
Pe
rcen
tage o
f to
tal
Figure 30 - Usage of pesticides on triticale - 2016
Area treated
Weight
0
5
10
15
20
25
30
35
40
45
50
Sep Oct Nov Dec Jan Feb Mar Apr May Jun Jul Aug
Pe
rcen
tage o
f a
pp
lica
tio
ns
Figure 31 - Timing of pesticide applications on triticale: September 2015 - August 2016
Fungicides
Herbicides
Insecticides
Growth regulators
Page 30
27
Triticale – Fungicides
• Formulation area treated: 30,743 hectares
• Weight of active substances applied: 5.0 tonnes
• The five most common formulations were:
Formulation
area treated
(ha)
Weight of
a.s. applied
(kg)
Proportion of
fungicide-
treated area
Proportion of
census area
treated
Average
number of
applications
(where
applied)
Average
proportion of
full label rate
Epoxiconazole/metconazole 6,903 518 0.22 0.31 2.00 0.39
Tebuconazole 4,640 663 0.15 0.29 1.44 0.57
Epoxiconazole 3,110 207 0.10 0.23 1.24 0.53
Chlorothalonil 2,590 1,207 0.08 0.12 2.00 0.47
Epoxiconazole/fenpropimorph/kresoxim-
methyl 2,301 611 0.07 0.10 2.00 0.66
Most fungicides applied to triticale were used for the control of yellow rust, 50%, general disease control accounted for
44%. Septoria (3%) and mildew/septoria (3%) comprised the remainder. Triticale – Herbicides
• Formulation area treated: 36,757 hectares
• Weight of active substances applied: 13.5 tonnes
• The five most common formulations were:
Formulation
area treated
(ha)
Weight of a.s.
applied (kg)
Proportion of
herbicide –
treated area
Proportion of
census area
treated
Average
number of
applications
(where
applied)
Average
proportion of
full label rate
Glyphosate 7,733 7,151 0.21 0.64 1.09 0.54
Fluroxypyr 7,063 902 0.19 0.64 1.00 0.64
Pendimethalin 4,238 3,368 0.12 0.38 1.00 0.60
Metsulfuron-methyl/tribenuron-
methyl 4,109 47 0.11 0.37 1.00 0.96
Diflufenican/flufenacet 4,009 1,090 0.11 0.36 1.00 0.92
27%
27%12%
11%
6%
12%
5%
Figure 32 - Triticale - Reasons for use of herbicides (where given)
broad-leaved weeds
general weed control
blackgrass
volunteers
wild oats
grass weeds
cleavers
Page 31
28
Triticale – Growth regulators
• Formulation area treated: 19,343 hectares
• Weight of active substances applied: 12.1 tonnes
• The five most common formulations were:
Formulation
area treated
(ha)
Weight of a.s.
applied (kg)
Proportion of
growth
regulator –
treated area
Proportion of
census area
treated
Average
number of
applications
(where
applied)
Average
proportion of
full label rate
Chlormequat 8,219 8,845 0.42 0.73 1.03 0.74
2-chloroethylphosphonic
acid/mepiquat 5,213 2,712 0.27 0.47 1.00 0.57
Trinexapac-ethyl 3,260 111 0.17 0.30 1.00 0.34
Mepiquat chloride/prohexadione-calcium 1,263 269 0.07 0.10 1.17 0.41
Prohexadione-calcium/trinexapac-
ethyl 897 28 0.05 0.08 1.00 0.33
Triticale – Insecticides
• Formulation area treated: 11,170 hectares
• Weight of active substances applied: 0.1 tonnes
• The three formulations encountered were:
Formulation
area treated
(ha)
Weight of a.s.
applied (kg)
Proportion of
growth
regulator –
treated area
Proportion of
census area
treated
Average
number of
applications
(where
applied)
Average
proportion of
full label rate
Lambda-cyhalothrin 7,679 38 0.69 0.38 1.82 1.00
Cypermethrin 2,297 57 0.21 0.21 1.00 1.00
Zeta-cypermethrin 1,194 16 0.11 0.11 1.00 0.92
Triticale – Seed Treatments
• Formulation area treated: 4,531 hectares
• Weight of active substances applied: 0.1 tonnes
• 58.9% of the seed remained untreated
• The four formulations encountered were:
Formulation area
treated (ha)
Weight of a.s. applied
(kg)
Proportion of seed
treatment-treated area
Proportion of census
area treated
(excluding unspecified
treatments)
Prothioconazole 1,295 21 0.29 0.12
Clothianidin/prothioconazole 911 87 0.20 0.08
Fludioxonil 228 2 0.05 0.02
Prochloraz/triticonazole 96 3 0.02 0.01
Page 32
29
PESTICIDE USAGE ON OILSEEDS
Oilseed rape
• 579,111 hectares of oilseed rape grown in the United Kingdom (98% of which is winter sown)
• 6,719,034 treated hectares
• 1,828.3 tonnes applied
• 0.1% of oilseed rape remained untreated
• Oilseed rape received on average 4 herbicides, 3 fungicides, 3 insecticides, 1 growth regulator and 2
molluscicides (metaldehyde accounted for 89% of all molluscicide usage)
• The main winter varieties encountered included DK Extrovert, Incentive, Charger, Picto, and Campus;
spring varieties included Tamirin, Mirakel, Delight and Ability
0
10
20
30
40
50
60
70
80
Insecticides &
nematicides
Fungicides Herbicides Growth
regulators
Molluscicides &
repellents
Sulphur Seed treatments
Pe
rcen
tage o
f to
tal
Figure 33 - Usage of pesticides on oilseed rape (spring & winter) - 2016
Area treated
Weight
0
10
20
30
40
50
60
Sep Oct Nov Dec Jan Feb Mar Apr May Jun Jul Aug
Pe
rcen
tage o
f a
pp
lica
tio
ns
Figure 34 - Timing of pesticide applications on winter oilseed rape: September 2015 -
August 2016
Fungicides
Herbicides
Insecticides
Growth regulators
Page 33
30
Oilseed rape – Fungicides
• Formulation area treated: 2,042,188 hectares
• Weight of active substances applied: 336.7 tonnes
• The five most common formulations were:
Formulation
area treated
(ha)
Weight of a.s.
applied (kg)
Proportion of
fungicide-
treated area
Proportion of
census area
treated
Average
number of
applications
(where
applied)
Average
proportion of
full label rate
Prothioconazole 370,221 38,502 0.18 0.40 1.60 0.60
Tebuconazole 339,820 57,020 0.17 0.44 1.30 0.67
Prothioconazole/tebuconazole 280,518 42,676 0.14 0.32 1.53 0.63
Azoxystrobin 169,799 24,564 0.08 0.23 1.24 0.58
Penthiopyrad/picoxystrobin 144,051 19,053 0.07 0.24 1.04 0.55
30%
23%14%
12%
7%
14%
Figure 35 - Oilseed rape - Reasons for use of fungicides (where given)
sclerotinia
phoma
light leaf spot
light leaf spot/phoma
general disease control
other diseases
Page 34
31
Oilseed rape – Herbicides
• Formulation area treated: 2,308,920 hectares
• Weight of active substances applied: 1,376.2 tonnes
• The five most common formulations were:
Formulation
area treated
(ha)
Weight of a.s.
applied (kg)
Proportion of
herbicide –
treated area
Proportion of
census area
treated
Average
number of
applications
(where
applied)
Average
proportion of
full label rate
Glyphosate 500,488 520,517 0.22 0.66 1.30 0.69
Propaquizafop 302,041 16,122 0.13 0.50 1.03 0.36
Propyzamide 235,289 179,287 0.10 0.40 1.01 0.90
Aminopyralid/propyzamide 170,194 137,083 0.07 0.29 1.03 0.94
Dimethenamid-P/metazachlor/quinmerac 162,994 148,962 0.07 0.25 1.12 0.73
21%
16%
14%11%
10%
8%
20%
Figure 36 - Oilseed rape - Reasons for use of herbicides (where given)
general weed control
broad-leaved weeds
blackgrass
crop desiccation
volunteer cereals
grass weeds
other weeds
Oilseed rape – Growth regulators
• Formulation area treated: 45,713 hectares
• Weight of active substances applied: 8.9 tonnes
• The 2 formulations encountered were:
Formulation
area treated
(ha)
Weight of a.s.
applied (kg)
Proportion of
growth
regulator –
treated area
Proportion of
census area
treated
Average
number of
applications
(where
applied)
Average
proportion of
full label rate
Mepiquat chloride/metconazole 45,545 8,923 1.00 0.08 1.00 0.58
Trinexapac-ethyl 33 1 0.00 0.00 1.00 0.37
Unspecified growth regulators accounted for 134 ha of the area treated.
It should be noted that the fungicides metconazole and tebuconazole, both have effective plant growth regulation
properties and therefore can have a dual purpose on oilseed rape.
Page 35
32
Oilseed rape – Insecticides
• Formulation area treated: 1,278,472 hectares
• Weight of active substances applied: 24.6 tonnes
• The five most common formulations were:
Formulation
area treated
(ha)
Weight of a.s.
applied (kg)
Proportion of
insecticide –
treated area
Proportion of
census area
treated
Average
number of
applications
(where
applied)
Average
proportion of
full label rate
Lambda-cyhalothrin 610,836 4,044 0.48 0.63 1.66 0.88
Cypermethrin 295,781 7,113 0.23 0.34 1.47 0.87
Tau-fluvalinate 166,191 7,636 0.13 0.27 1.05 0.96
Zeta-cypermethrin 77,654 757 0.06 0.11 1.17 0.97
Alpha-cypermethrin 40,660 488 0.03 0.05 1.41 0.77
58%
12%
11%
7%
12%
Figure 37 - Oilseed rape - Reasons for use of insecticides (where given)
cabbage stem flea beetle
aphids
pollen beetle
seed weevil
other pests
Oilseed rape – Seed Treatments
• Formulation area treated: 529,578 hectares
• Weight of active substances applied: 9.7 tonnes
• 11.8% of the seed remained untreated
• Where specified the most common formulations were:
Formulation area
treated (ha)
Weight of a.s. applied
(kg)
Proportion of seed
treatment-treated area
Proportion of census
area treated
(excluding unspecified
treatments)
Prochloraz/thiram 331,227 8,713 0.63 0.57
Thiram 34,111 595 0.06 0.06
Methiocarb 15,399 185 0.03 0.03
Beta-cyfluthrin/clothianidin 4,183 151 0.01 0.01
Fludioxonil/metalaxyl-
M/thiamethoxam 2,197 63 <0.01 <0.01
Page 36
33
Linseed
• 27,817 hectares of linseed grown in the United Kingdom
• 155,898 treated hectares
• 46.9 tonnes applied
• 5.6% of linseed remained untreated
• Linseed received on average 4 herbicides, 2 fungicides, 1 insecticide and 1 growth regulator
• 81% of the crop was spring sown
• The main varieties encountered included Altess, Juliet, Marquise, Nulin VT 50 and Everest (winter)
0
10
20
30
40
50
60
70
80
90
100
Insecticides &nematicides
Fungicides Herbicides Growthregulators
Molluscicides& repellents
PhysicalControl
Seedtreatments
Pe
rcen
tage o
f to
tal
Figure 38 - Usage of pesticides on linseed - 2016
Area treated
Weight
0
10
20
30
40
50
60
70
80
90
Sep Oct Nov Dec Jan Feb Mar Apr May Jun Jul Aug
Pe
rcen
tage o
f a
pp
lica
tio
ns
Figure 39 - Timing of pesticide applications on linseed: September 2015 - August 2016
Fungicides
Herbicides
Insecticides
Page 37
34
Linseed – Fungicides
• Formulation area treated: 33,337 hectares
• Weight of active substances applied: 3.8 tonnes
• The five most common formulations encountered were:
Formulation
area treated
(ha)
Weight of a.s.
applied (kg)
Proportion of
fungicide-
treated area
Proportion of
census area
treated
Average
number of
applications
(where
applied)
Average
proportion of
full label rate
Tebuconazole 16,261 2,619 0.49 0.53 1.13 0.64
Difenoconazole 8,413 661 0.25 0.20 1.55 0.63
Metconazole 5,958 279 0.18 0.21 1.06 0.65
Difenoconazole/paclobutrazol 1,816 108 0.05 0.07 1.00 0.45
Boscalid 598 83 0.02 0.02 1.00 0.56
22%
19%
17%
15%
11%
11%
5%
Figure 40 - Linseed - Reasons for use of fungicides (where given)
botrytis
mildew
alternaria
sclerotinia
rust
mildew/rust
fusarium
Page 38
35
Linseed – Herbicides
• Formulation area treated: 97,182 hectares
• Weight of active substances applied: 40.0 tonnes
• The five most common formulations were:
Formulation
area treated
(ha)
Weight of a.s.
applied (kg)
Proportion of
herbicide –
treated area
Proportion of
census area
treated
Average
number of
applications
(where
applied)
Average
proportion of
full label rate
Glyphosate 26,769 22,208 0.28 0.61 1.55 0.50
Clethodim 9,232 1,100 0.09 0.34 1.00 0.99
Bromoxynil 8,359 2,346 0.09 0.30 1.00 0.70
Amidosulfuron/iodosulfuron-methyl-
sodium 8,349 216 0.09 0.27 1.12 0.94
Amidosulfuron 7,391 178 0.08 0.27 1.00 0.80
33%
23%
12%
12%
8%
8%
2% 2%
Figure 41 - Linseed - Reasons for use of herbicides (where given)
broad-leaved weeds
general weed control
blackgrass
grass weeds
desiccation
wild oats
volunteer cereals
other weeds
Page 39
36
Linseed – Insecticides
• Formulation area treated: 12,750 hectares
• Weight of active substances applied: 0.2 tonnes
• The three formulations encountered were:
Formulation
area treated
(ha)
Weight of a.s.
applied (kg)
Proportion of
insecticide –
treated area
Proportion of
census area
treated
Average
number of
applications
(where
applied)
Average
proportion of
full label rate
Lambda-cyhalothrin 6,026 42 0.47 0.20 1.13 0.93
Cypermethrin 3,470 82 0.27 0.13 1.00 0.79
Zeta-cypermethrin 3,254 32 0.26 0.09 1.29 1.00
Control of flax flea beetles accounted for 88% of insecticide usage.
Linseed – Seed Treatments
• Formulation area treated: 10,574 hectares
• Weight of active substances applied: 2.6 tonnes
• 60% of the seed remained untreated
• A single formulation was encountered:
Formulation area
treated (ha)
Weight of a.s. applied
(kg)
Proportion of seed
treatment-treated area
Proportion of census
area treated
(excluding unspecified
treatments)
Prochloraz 1,928 39 0.18 0.07
Page 40
37
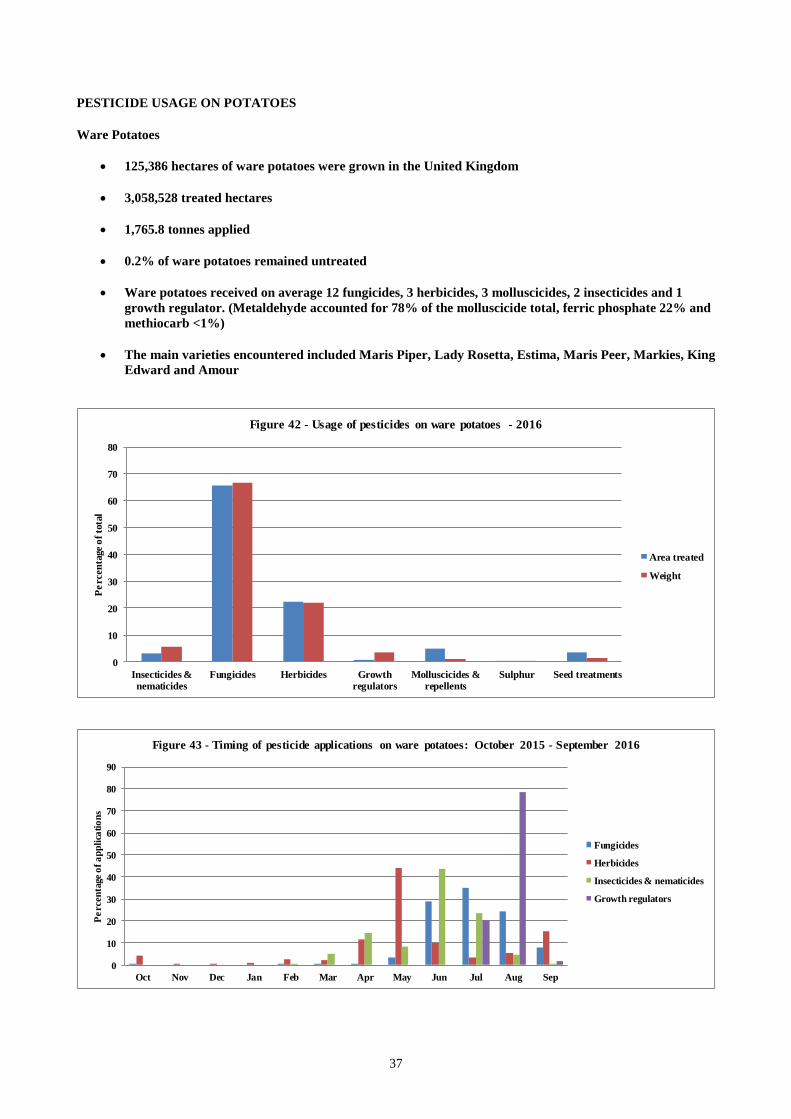
PESTICIDE USAGE ON POTATOES
Ware Potatoes
• 125,386 hectares of ware potatoes were grown in the United Kingdom
• 3,058,528 treated hectares
• 1,765.8 tonnes applied
• 0.2% of ware potatoes remained untreated
• Ware potatoes received on average 12 fungicides, 3 herbicides, 3 molluscicides, 2 insecticides and 1
growth regulator. (Metaldehyde accounted for 78% of the molluscicide total, ferric phosphate 22% and
methiocarb <1%)
• The main varieties encountered included Maris Piper, Lady Rosetta, Estima, Maris Peer, Markies, King
Edward and Amour
0
10
20
30
40
50
60
70
80
Insecticides &nematicides
Fungicides Herbicides Growthregulators
Molluscicides &repellents
Sulphur Seed treatments
Pe
rcen
tage o
f to
tal
Figure 42 - Usage of pesticides on ware potatoes - 2016
Area treated
Weight
0
10
20
30
40
50
60
70
80
90
Oct Nov Dec Jan Feb Mar Apr May Jun Jul Aug Sep
Pe
rcen
tage o
f a
pp
lica
tio
ns
Figure 43 - Timing of pesticide applications on ware potatoes: October 2015 - September 2016
Fungicides
Herbicides
Insecticides & nematicides
Growth regulators
Page 41
38
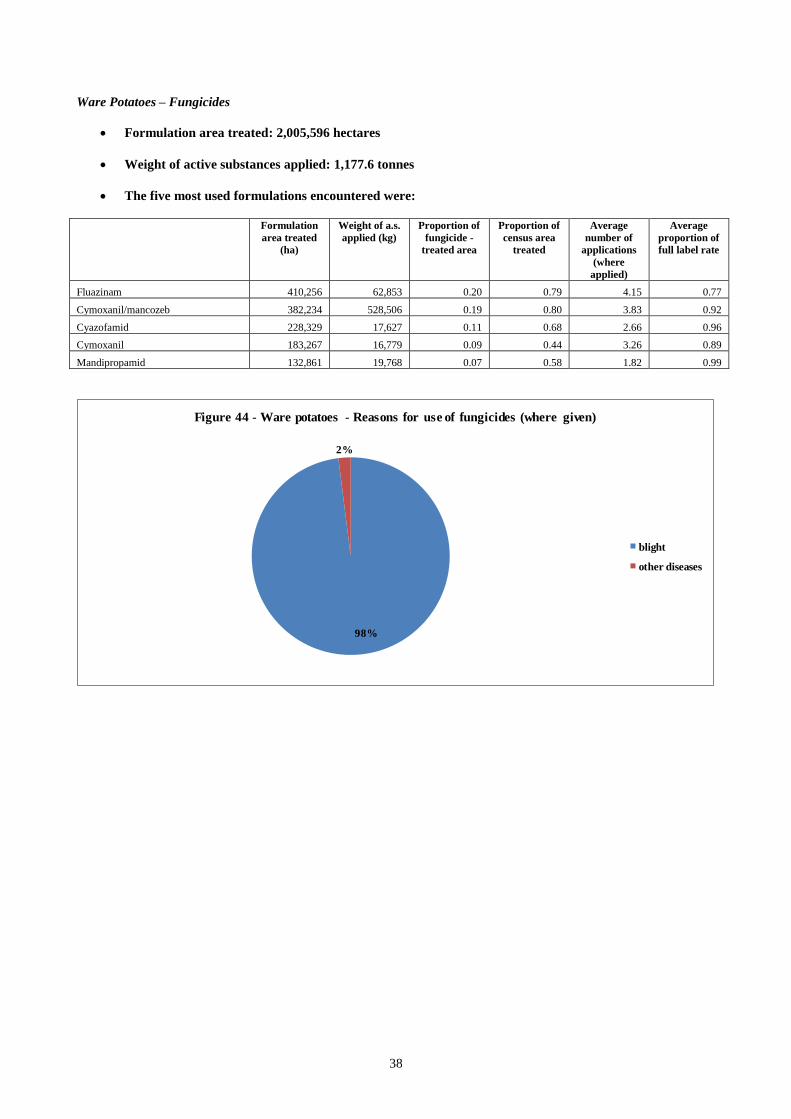
Ware Potatoes – Fungicides
• Formulation area treated: 2,005,596 hectares
• Weight of active substances applied: 1,177.6 tonnes
• The five most used formulations encountered were:
Formulation
area treated
(ha)
Weight of a.s.
applied (kg)
Proportion of
fungicide -
treated area
Proportion of
census area
treated
Average
number of
applications
(where
applied)
Average
proportion of
full label rate
Fluazinam 410,256 62,853 0.20 0.79 4.15 0.77
Cymoxanil/mancozeb 382,234 528,506 0.19 0.80 3.83 0.92
Cyazofamid 228,329 17,627 0.11 0.68 2.66 0.96
Cymoxanil 183,267 16,779 0.09 0.44 3.26 0.89
Mandipropamid 132,861 19,768 0.07 0.58 1.82 0.99
98%
2%
Figure 44 - Ware potatoes - Reasons for use of fungicides (where given)
blight
other diseases
Page 42
39
Ware potatoes – Herbicides & dessicants
• Formulation area treated: 679,182 hectares
• Weight of active substances applied: 386.77 tonnes
• The five most used formulations encountered were:
Formulation
area treated
(ha)
Weight of a.s.
applied (kg)
Proportion of
herbicide –
treated area
Proportion of
census area
treated
Average
number of
applications
(where
applied)
Average
proportion of
full label rate
Diquat 239,893 95,853 0.35 0.93 2.04 0.53
Linuron 95,140 54,811 0.14 0.75 1.00 0.77
Metribuzin 78,247 28,409 0.12 0.58 1.07 0.58
Glyphosate 65,304 60,770 0.10 0.45 1.12 0.61
Carfentrazone-ethyl 55,572 2,232 0.08 0.38 1.16 0.91
33%
27%
27%
3%
6%
4%
Figure 45 - Ware potatoes - Reasons for use of herbicides (where given)
desiccation
broad-leaved weeds
general weed control
cleavers
grass weeds
other weeds
Ware potatoes – Growth regulators
• Formulation area treated: 19,863 hectares
• Weight of active substances applied: 58.74 tonnes
• There was a single formulation encountered:
Formulation
area treated
(ha)
Weight of a.s.
applied (kg)
Proportion of
growth
regulator –
treated area
Proportion of
census area
treated
Average
number of
applications
(where
applied)
Average
proportion of
full label rate
Maleic hydrazide 19,863 58,738 1.00 0.16 1.00 0.99
Page 43
40
Ware potatoes – Insecticides & nematicides
• Formulation area treated: 98,873 hectares
• Weight of active substances applied: 101.27 tonnes
• The five most common formulations were:
Formulation
area treated
(ha)
Weight of a.s.
applied (kg)
Proportion of
insecticide –
treated area
Proportion of
census area
treated
Average
number of
applications
(where
applied)
Average
proportion of
full label rate
Lambda-cyhalothrin 31,285 226 0.32 0.17 1.44 0.96
Thiacloprid 18,145 1,702 0.18 0.13 1.15 0.98
Fosthiazate 17,833 49,057 0.18 0.14 1.03 0.92
Ethoprophos 7,635 42,671 0.08 0.06 1.00 0.93
Esfenvalerate 7,298 35 0.07 0.04 1.26 0.95
Please note that Ethoprophos is primarily used as a nematicide for potato cyst nematode control although it has activity
against other soil pests.
96%
4%
Figure 46 - Ware potatoes - Reasons for use of insecticides (where given)
aphids
other pests
Potato cyst nematode accounted for 100% of reasons given for nematicide usage.
Ware potatoes – Seed Treatments
• Formulation area treated: 108,366 hectares
• Weight of active substances applied: 23.65 tonnes
• 16% of the seed remained untreated, but other fungicides may have been applied at the time of planting
• The five most common formulations encountered were:
Formulation area
treated (ha)
Weight of a.s. applied
(kg)
Proportion of seed
treatment-treated area
Proportion of census
area treated
(excluding unspecified
treatments)
Pencycuron 31,733 18,985 0.29 0.25
Imazalil 29,534 761 0.27 0.23
Flutolanil 6,089 1,580 0.06 0.05
Imazalil/pencycuron 2,901 1,830 0.03 0.02
Imazalil/thiabendazole 1,821 234 0.02 0.01
Page 44
41
Seed Potatoes
• 16,733 hectares of seed potatoes were grown in the United Kingdom
• 399,797 treated hectares
• 148.2 tonnes applied
• All seed potatoes encountered were treated
Seed potatoes received on average 10 fungicides, 7 insecticides, 3 herbicides and 3 molluscicides • Where information was provided, the main varieties encounted were
Hermes, Cara, Maris Piper Maris Peer, Brooke and Harmony
0
10
20
30
40
50
60
70
80
Insecticides &nematicides
Fungicides Herbicides Molluscicides &repellents
Seed treatments
Pe
rcen
tage o
f to
tal
Figure 47 - Usage of pesticides on seed potatoes - 2016
Area treated
Weight
0
10
20
30
40
50
60
Jan Feb Mar Apr May Jun Jul Aug Sep Oct Nov Dec
Pe
rcen
tage o
f a
pp
lica
tio
ns
Figure 48 - Timing of pesticide applications on seed potatoes: January 2016 - December
2016
Fungicides
Herbicides
Insecticides & nematicides
Page 45
42
Seed Potatoes – Fungicides
• Formulation area treated: 204,833 hectares
• Weight of active substances applied: 102.5 tonnes
• The five most common formulations were:
Formulation
area treated
(ha)
Weight of a.s.
applied (kg)
Proportion of
fungicide -
treated area
Proportion of
census area
treated
Average
number of
applications
(where
applied)
Average
proportion of
full label rate
Cyazofamid 32,647 2,609 0.16 0.83 2.36 1.00
Cymoxanil 32,621 2,734 0.16 0.63 3.08 0.82
Cymoxanil/mancozeb 24,969 30,784 0.12 0.60 2.50 0.84
Fluazinam 24,533 7,511 0.12 0.76 1.93 0.65
Mandipropamid 23,201 3,352 0.11 0.74 1.88 0.96
100%
<1%
Figure 49 - Seed potatoes - Reasons for use of fungicides (where given)
blight
mildew
Page 46
43
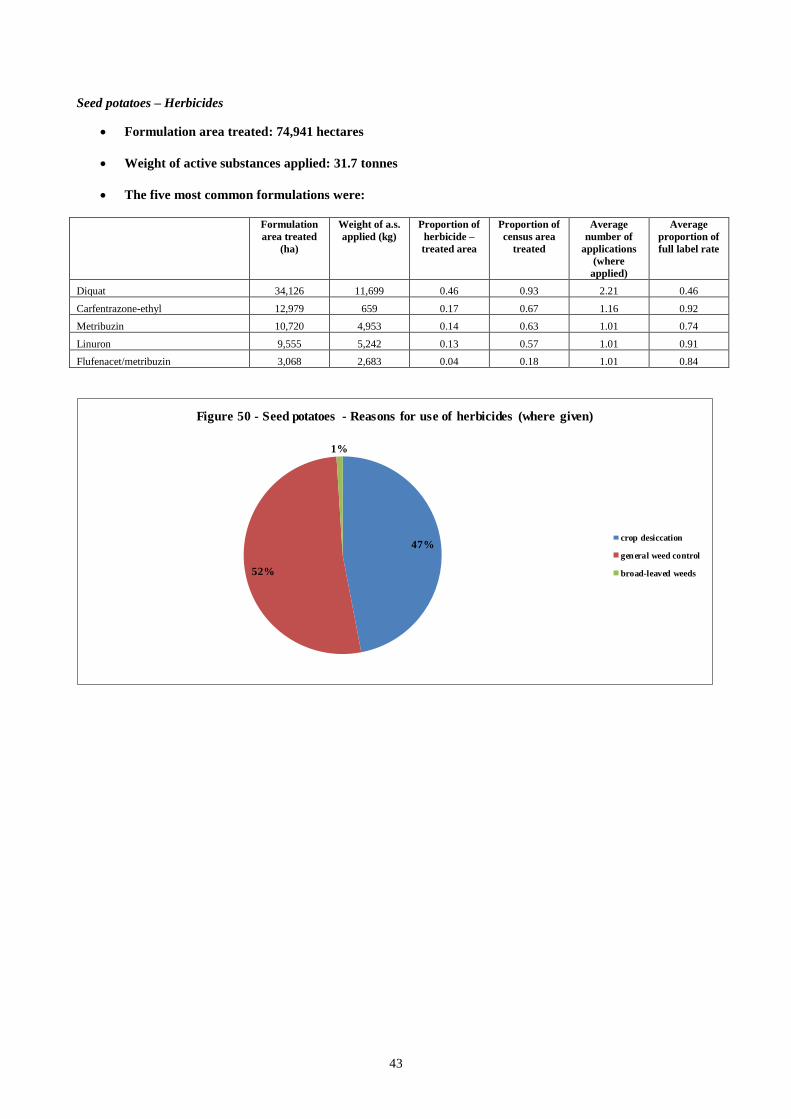
Seed potatoes – Herbicides
• Formulation area treated: 74,941 hectares
• Weight of active substances applied: 31.7 tonnes
• The five most common formulations were:
Formulation
area treated
(ha)
Weight of a.s.
applied (kg)
Proportion of
herbicide –
treated area
Proportion of
census area
treated
Average
number of
applications
(where
applied)
Average
proportion of
full label rate
Diquat 34,126 11,699 0.46 0.93 2.21 0.46
Carfentrazone-ethyl 12,979 659 0.17 0.67 1.16 0.92
Metribuzin 10,720 4,953 0.14 0.63 1.01 0.74
Linuron 9,555 5,242 0.13 0.57 1.01 0.91
Flufenacet/metribuzin 3,068 2,683 0.04 0.18 1.01 0.84
47%
52%
1%
Figure 50 - Seed potatoes - Reasons for use of herbicides (where given)
crop desiccation
general weed control
broad-leaved weeds
Page 47
44
Seed potatoes – Insecticides & nematicides
• Formulation area treated: 90,623 hectares
• Weight of active substances applied: 4.2 tonnes
• The five most common formulations were:
Formulation
area treated
(ha)
Weight of a.s.
applied (kg)
Proportion of
insecticide –
treated area
Proportion of
census area
treated
Average
number of
applications
(where
applied)
Average
proportion of
full label rate
Lambda-cyhalothrin 34,888 235 0.38 0.68 3.15 0.90
Esfenvalerate 22,678 107 0.25 0.60 2.25 0.95
Pymetrozine 10,927 1,583 0.12 0.43 1.53 0.97
Thiacloprid 10,324 934 0.11 0.43 1.44 0.94
Flonicamid 6,529 520 0.07 0.26 1.58 1.00
Aphids were the main pests controlled, accounting for 99% of insecticide applications. The main reason for the control
of the aphids would have been to prevent virus spreading into the plants and resultant tubers.
Seed potatoes – Seed Treatments
• Formulation area treated: 14,617 hectares
• Weight of active substances applied: 8.1 tonnes
• 14.8% of the seed remained untreated, but other fungicides may have been applied at the time of
planting
• The five formulations encountered were:
Formulation area
treated (ha)
Weight of a.s. applied
(kg)
Proportion of seed
treatment-treated area
Proportion of census
area treated
(excluding unspecified
treatments)
Pencycuron 9,334 7,069 0.64 0.55
Flutolanil 1,936 807 0.13 0.12
Imazalil/thiabendazole 1,011 171 0.07 0.06
Fludioxonil 453 45 0.03 0.03
Imazalil 303 11 0.02 0.02
Page 48
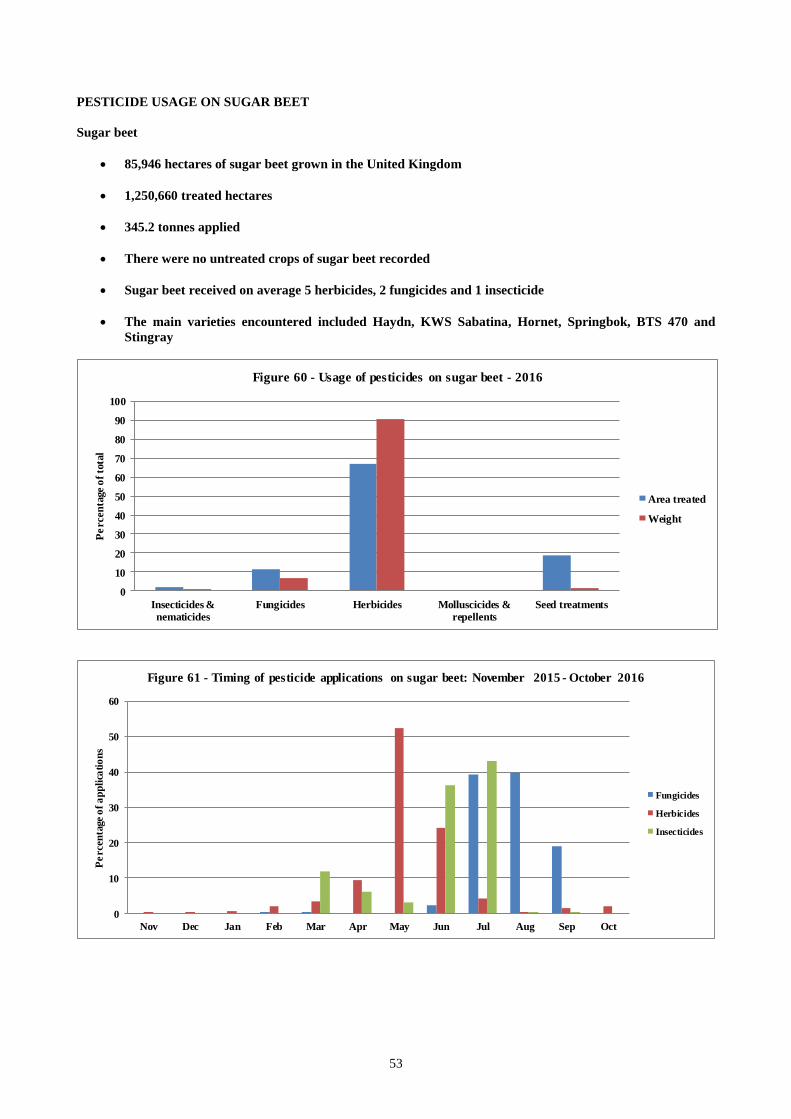
45
PESTICIDE USAGE ON PULSES
Dry harvest peas
• 50,718 hectares of dry harvest peas grown in the United Kingdom
• 429,356 treated hectares
• 196.4 tonnes applied
• 0.4% of dry harvest peas remained untreated
• Dry harvest peas received on average 4 herbicides, 3 insecticides and 2 fungicides
• The main varieties encountered included Prophet, Kabuki, Daytona and Sakura
• All crops encountered were spring-sown
0
10
20
30
40
50
60
70
80
90
Insecticides &nematicides
Fungicides Herbicides Molluscicides &repellents
Sulphur Seed treatments
Pe
rcen
tage
of
tota
l
Figure 51 - Usage of pesticides on dry-harvest peas - 2016
Area treated
Weight
0
10
20
30
40
50
60
70
80
Sep Oct Nov Dec Jan Feb Mar Apr May Jun Jul Aug
Pe
rcen
tage o
f a
pp
lica
tio
ns
Figure 52 - Timing of pesticide applications on dry-harvest peas: September 2015 -
August 2016
Fungicides
Herbicides
Insecticides
Page 49
46
Dry harvest peas – Fungicides
• Formulation area treated: 82,328 hectares
• Weight of active substances applied: 30.4 tonnes
• The five most common formulations were:
Formulation
area treated
(ha)
Weight of a.s.
applied (kg)
Proportion of
fungicide-
treated area
Proportion of
census area
treated
Average
number of
applications
(where
applied)
Average
proportion of
full label rate
Chlorothalonil/cyproconazole 45,618 23,871 0.55 0.67 1.34 0.63
Azoxystrobin 24,781 3,291 0.30 0.41 1.20 0.53
Chlorothalonil 4,270 2,391 0.05 0.06 1.32 0.41
Metconazole 2,842 114 0.03 0.06 1.00 0.55
Tebuconazole 2,261 364 0.03 0.04 1.00 0.64
21%
19%
19%
8%
7%
7%
19%
Figure 53 - Dry harvest peas - Reasons for use of fungicides (where given)
unspecified mildews
botrytis/downy mildew
botrytis
leaf spot/mildew
downy mildew
botrytis/rust
other diseases
Page 50
47
Dry harvest peas – Herbicides
• Formulation area treated: 193,062 hectares
• Weight of active substances applied: 153.9 tonnes
• The five most common formulations were:
Formulation
area treated
(ha)
Weight of a.s.
applied (kg)
Proportion of
herbicide –
treated area
Proportion of
census area
treated
Average
number of
applications
(where
applied)
Average
proportion of
full label rate
Glyphosate 46,629 40,719 0.24 0.67 1.36 0.53
Imazamox/pendimethalin 28,732 27,758 0.15 0.57 1.00 0.80
MCPB 23,448 25,346 0.12 0.46 1.00 0.60
Bentazone 21,134 17,010 0.11 0.42 1.00 0.56
Pendimethalin 12,846 12,437 0.07 0.25 1.00 0.73
43%
23%
11%
8%
3%
2%10%
Figure 54 - Dry harvest peas - Reasons for use of herbicides (where given)
broad-leaved weeds
general weed control
blackgrass
grass weeds
charlock
wild oats
other weeds
Page 51
48
Dry harvest peas – Insecticides
• Formulation area treated: 106,433 hectares
• Weight of active substances applied: 4.0 tonnes
• The five most common formulations were:
Formulation
area treated
(ha)
Weight of a.s.
applied (kg)
Proportion of
insecticide –
treated area
Proportion of
census area
treated
Average
number of
applications
(where
applied)
Average
proportion of
full label rate
Lambda-cyhalothrin 55,229 342 0.52 0.60 1.81 0.83
Pirimicarb 26,970 2,888 0.25 0.43 1.25 0.76
Zeta-cypermethrin 9,421 127 0.09 0.19 1.00 0.90
Cypermethrin 6,385 159 0.06 0.12 1.00 1.00
Thiacloprid 6,035 478 0.06 0.10 1.21 0.82
46%
24%
16%
14%
Figure 55 - Dry harvest peas - Reasons for use of insecticides (where given)
aphids
pea moth
weevil
other pests
Dry harvest peas – Seed Treatments
• Formulation area treated: 40,359 hectares
• Weight of active substances applied: 4.7 tonnes
• 20.8% of the seed remained untreated
• The two formulations encountered were:
Formulation area
treated (ha)
Weight of a.s. applied
(kg)
Proportion of seed
treatment-treated area
Proportion of census
area treated
(excluding unspecified
treatments)
Thiram 18,316 2,686 0.45 0.36
Cymoxanil/fludioxonil/metalaxyl-M 12,337 2,061 0.31 0.24
Page 52
49
Field beans
• 177,492 hectares of field beans grown in the United Kingdom (79% were spring sown)
• 1,295,166 treated hectares
• 579.9 tonnes applied
• 0.8% of field beans remained untreated
• Field beans received on average 3 herbicides, 2 insecticides and 2 fungicides
• The main varieties encountered included Fuego, Vertigo and Fanfare (spring) and Wizard (winter)
0
10
20
30
40
50
60
70
80
Insecticides &nematicides
Fungicides Herbicides Molluscicides &repellents
Sulphur Seed treatments
Pe
rcen
tage o
f to
tal
Figure 56 - Usage of pesticides on field beans - 2016
Area treated
Weight
0
10
20
30
40
50
60
70
Sep Oct Nov Dec Jan Feb Mar Apr May Jun Jul Aug
Pe
rcen
tage o
f a
pp
lica
tio
ns
Figure 56a - Timing of pesticide applications on winter field beans: September 2015 -
August 2016
Fungicides
Herbicides
Insecticides
Page 53
50
0
10
20
30
40
50
60
70
80
Sep Oct Nov Dec Jan Feb Mar Apr May Jun Jul Aug
Pe
rcen
tage o
f a
pp
lica
tio
ns
Figure 56b - Timing of pesticide applications on spring field beans: September 2015 -
August 2016
Fungicides
Herbicides
Insecticides
Field beans – Fungicides
• Formulation area treated: 383,104 hectares
• Weight of active substances applied: 143.6 tonnes
• The five most common formulations were:
Formulation
area treated
(ha)
Weight of a.s.
applied (kg)
Proportion of
fungicide-
treated area
Proportion of
census area
treated
Average
number of
applications
(where
applied)
Average
proportion of
full label rate
Chlorothalonil/cyproconazole 177,474 100,108 0.46 0.70 1.44 0.68
Tebuconazole 45,797 7,261 0.12 0.19 1.34 0.63
Azoxystrobin 44,466 6,243 0.12 0.22 1.14 0.56
Boscalid/pyraclostrobin 42,227 7,700 0.11 0.21 1.14 0.55
Chlorothalonil 34,711 20,450 0.09 0.14 1.40 0.57
46%
17%
8%
7%
4%
18%
Figure 57 - Field beans - Reasons for use of fungicides (where given)
chocolate spot
chocolate spot/rust
rust
downy mildew
chocolate spot/downy mildew
other diseases
Page 54
51
Field beans – Herbicides
• Formulation area treated: 557,392 hectares
• Weight of active substances applied: 415.4 tonnes
• The five most common formulations were:
Formulation
area treated
(ha)
Weight of a.s.
applied (kg)
Proportion of
herbicide –
treated area
Proportion of
census area
treated
Average
number of
applications
(where
applied)
Average
proportion of
full label rate
Glyphosate 143,351 124,475 0.26 0.57 1.41 0.57
Pendimethalin 83,626 79,534 0.15 0.47 1.00 0.72
Clomazone/linuron 58,203 31,412 0.10 0.32 1.03 0.91
Imazamox/pendimethalin 56,888 52,375 0.10 0.32 1.00 0.77
Clomazone 43,049 3,043 0.08 0.24 1.00 0.73
36%
32%
7%
7%
4%
14%
Figure 58 - Field beans - Reasons for use of herbicides (where given)
general weed control
broad-leaved weeds
grass weeds
blackgrass
wild oats
other weeds
Page 55
52
Field beans – Insecticides
• Formulation area treated: 338,619 hectares
• Weight of active substances applied: 6.0 tonnes
• The five most common formulations were:
Formulation
area treated
(ha)
Weight of a.s.
applied (kg)
Proportion of
insecticide –
treated area
Proportion of
census area
treated
Average
number of
applications
(where
applied)
Average
proportion of
full label rate
Lambda-cyhalothrin 218,450 1,555 0.65 0.67 1.85 0.95
Cypermethrin 36,380 851 0.11 0.15 1.35 0.94
Pirimicarb 29,727 3,078 0.09 0.15 1.07 0.74
Esfenvalerate 20,579 92 0.06 0.09 1.32 0.89
Zeta-cypermethrin 18,947 277 0.06 0.07 1.50 0.97
33%
31%
13%
5%
18%
Figure 59 - Field beans - Reasons for use of insecticides (where given)
bruchid beetle
weevil
aphids
aphids/bruchid beetle
other pests
The weevils indicated in the figure above are most likely to be pea & bean weevils Sitona spp.
Field beans – Seed Treatments
• Formulation area treated: 11,054 hectares
• Weight of active substances applied: 0.4 tonnes
• 93% of the seed remained untreated
• The two formulations encountered were:
Formulation area
treated (ha)
Weight of a.s. applied
(kg)
Proportion of seed
treatment-treated area
Proportion of census
area treated
(excluding unspecified
treatments)
Thiram 1,029 220 0.09 0.01
Cymoxanil/fludioxonil/metalaxyl-M 1,026 142 0.09 0.01
Page 56
53
PESTICIDE USAGE ON SUGAR BEET
Sugar beet
• 85,946 hectares of sugar beet grown in the United Kingdom
• 1,250,660 treated hectares
• 345.2 tonnes applied
• There were no untreated crops of sugar beet recorded
• Sugar beet received on average 5 herbicides, 2 fungicides and 1 insecticide
• The main varieties encountered included Haydn, KWS Sabatina, Hornet, Springbok, BTS 470 and
Stingray
0
10
20
30
40
50
60
70
80
90
100
Insecticides &nematicides
Fungicides Herbicides Molluscicides &repellents
Seed treatments
Pe
rcen
tage o
f to
tal
Figure 60 - Usage of pesticides on sugar beet - 2016
Area treated
Weight
0
10
20
30
40
50
60
Nov Dec Jan Feb Mar Apr May Jun Jul Aug Sep Oct
Pe
rcen
tage o
f a
pp
lica
tio
ns
Figure 61 - Timing of pesticide applications on sugar beet: November 2015 - October 2016
Fungicides
Herbicides
Insecticides
Page 57
54
Sugar beet – Fungicides
• Formulation area treated: 146,000 hectares
• Weight of active substances applied: 23.0 tonnes
• The five most common formulations were:
Formulation
area treated
(ha)
Weight of a.s.
applied (kg)
Proportion of
fungicide-
treated area
Proportion of
census area
treated
Average
number of
applications
(where
applied)
Average
proportion of
full label rate
Cyproconazole/trifloxystrobin 96,566 16,882 0.66 0.74 1.52 0.93
Cyproconazole 14,116 475 0.10 0.08 2.05 0.56
Epoxiconazole/pyraclostrobin 13,972 2,002 0.10 0.12 1.33 0.78
Azoxystrobin/cyproconazole 7,335 1,459 0.05 0.08 1.11 0.79
Cyproconazole/picoxystrobin 5,201 1,118 0.04 0.05 1.22 0.77
70%
9%
7%
6%
8%
Figure 62 - Sugar beet - Reasons for use of fungicides (where given)
mildew/rust
unspecified mildew
mildew/ramularia
ramularia/rust
other diseases
Page 58
55
Sugar beet – Herbicides
• Formulation area treated: 838,512 hectares
• Weight of active substances applied: 313.1 tonnes
• The five most common formulations were:
Formulation
area treated
(ha)
Weight of a.s.
applied (kg)
Proportion of
herbicide –
treated area
Proportion of
census area
treated
Average
number of
applications
(where
applied)
Average
proportion of
full label rate
Metamitron 148,405 90,779 0.18 0.84 2.05 0.28
Desmedipham/ethofumesate/lenacil/p
henmedipham 94,342 21,110 0.11 0.62 1.76 0.71
Triflusulfuron-methyl 88,890 933 0.11 0.61 1.69 0.70
Glyphosate 73,758 66,918 0.09 0.58 1.29 0.53
Lenacil 58,240 9,607 0.07 0.41 1.59 0.61
53%
24%
2%
2%
2%
17%
Figure 63 - Sugar beet - Reasons for use of herbicides (where given)
broad-leaved weeds
general weed control
volunteer potatoes
annual meadow grass
blackgrass
other weeds
Page 59
56
Sugar Beet – Insecticides
• Formulation area treated: 27,096 hectares
• Weight of active substances applied: 3.2 tonnes
• The five most common formulations encountered were:
Formulation
area treated
(ha)
Weight of a.s.
applied (kg)
Proportion of
insecticide –
treated area
Proportion of
census area
treated
Average
number of
applications
(where
applied)
Average
proportion of
full label rate
Lambda-cyhalothrin 13,744 92 0.51 0.14 1.06 0.89
Thiacloprid 7,210 622 0.27 0.08 1.00 0.90
Oxamyl 2,966 1,856 0.11 0.03 1.00 1.04
Chlorpyrifos 1,856 559 0.07 0.01 1.09 0.41
Beta-cyfluthrin 870 4 0.03 0.01 1.00 0.67
Please note that oxamyl is an insecticide/nematicide primarily used to control free-living nematodes and/or beet cyst
nematodes. However, it does control a range of pests including millipedes, pygmy mangold beetle & beet leaf miners.
The apparent high rate of oxamyl is an anomaly due to the variability of rates according to row spacing. None of the
rates encountered in the survey exceeded the maximum recommended for this product.
57%31%
12%
Figure 64 - Sugar beet - Reasons for use of insecticides (where given)
aphids
leaf miner
flea beetle
Sugar beet – Seed Treatments
• Formulation area treated: 233,695 hectares
• Weight of active substances applied: 5.2 tonnes
• No untreated seed was encountered
• The area of some of the insecticidal seed treatments is possibly an under-estimate of the total used
Formulation area
treated (ha)
Weight of a.s. applied
(kg)
Proportion of seed
treatment-treated area
Proportion of census
area treated
Hymexazol 85,946 1,679 0.37 1.00
Thiram 85,946 107 0.37 1.00
Thiamethoxam 29,645 1,779 0.13 0.34
Beta-cyfluthrin/clothianidin 19,527 1,328 0.08 0.23
Tefluthrin 10,560 106 0.05 0.12
Page 60
57
APPENDIX 1 – ARABLE APPLICATION TABLES
Table 1 Area of arable crops grown in the United Kingdom 2016 (hectares)
East
Midlands
Eastern London &
South East
North
East
North
West
South
West
West
Midlands
Yorkshire &
the Humber
Wales Scotland Northern
Ireland
United
Kingdom
Wheat1 335,039 467,514 218,760 67,600 37,314 159,034 163,494 234,961 21,410 109,594 8,616 1,823,336
Winter barley 49,331 89,775 36,415 28,748 16,382 48,869 35,086 71,044 8,132 48,031 7,628 439,441
Spring barley 60,087 89,247 66,093 12,271 24,073 85,289 28,498 50,046 13,757 238,899 14,708 682,968
Oats1 11,683 12,331 19,227 8,279 4,709 20,935 17,013 8,228 5,025 31,210 2,257 140,897
Rye 4,702 7,412 4,103 390 298 3,864 2,217 1,816 1,119 3,725 119 29,765
Triticale1 1,206 1,679 1,334 223 813 3,129 1,028 992 . 614 . 11,018
Oilseed rape1 139,412 129,946 71,461 23,506 4,963 50,135 49,076 74,308 5,080 30,672 552 579,111
Linseed1 4,799 6,306 6,128 178 184 5,071 2,672 1,942 537 . . 27,817
Potatoes 15,612 36,031 3,295 1,213 7,534 7,865 15,011 17,539 3,140 14,766 3,380 125,386
Seed potatoes 9 637 122 179 2 412 128 1,960 117 12,760 407 16,733
Peas 7,455 21,312 8,955 1,135 669 4,009 3,944 2,463 . 776 . 50,718
Beans1 35,634 49,396 32,502 4,551 2,799 13,262 15,116 20,071 870 3,002 289 177,492
Sugar beet 19,964 53,617 808 77 684 1,859 2,531 6,406 . . . 85,946
All arable crops 684,933 965,203 469,203 148,350 100,424 403,733 335,814 491,776 59,187 494,049 37,956 4,190,628
1 Includes spring and winter sown crops
Page 61
58
Table 2 Treated areas of arable crops in the United Kingdom 2016 by crop group (spray hectares)
Wheat Winter
barley
Spring
barley
Oats Rye Triticale Oilseed
rape
Linseed Potatoes
ware
Potatoes
seed
Peas Beans Sugar beet All crops
Insecticides & nematicides 1,305,358 290,576 162,336 61,844 18,931 11,170 1,278,472 12,750 98,873 90,623 106,433 338,619 27,096 3,803,081
Fungicides 11,463,897 1,488,848 1,758,555 281,067 65,398 30,743 2,042,188 33,337 2,005,596 204,833 82,328 383,104 146,000 19,985,894
Herbicides 7,270,944 1,539,190 2,086,523 318,530 68,402 36,757 2,308,920 97,182 679,182 75,067 193,062 557,392 838,512 16,069,663
Growth regulators 4,011,183 786,932 323,772 153,044 53,639 19,343 45,713 914 19,863 . . . . 5,414,403
Molluscicides & repellents 673,582 44,547 18,621 2,877 5,517 1,454 509,768 787 146,370 14,657 5,485 585 5,357 1,429,607
Sulphur 17,500 661 4,756 137 . . 4,395 . 278 . 1,689 4,412 . 33,828
Physical control agents . . . . . . 354 . . . . . 354
All seed treatments 1,922,502 458,275 616,455 108,844 17,947 4,531 529,578 10,574 108,366 14,617 40,359 11,054 233,695 4,076,797
All pesticides 26,664,966 4,609,029 4,971,018 926,343 229,834 103,998 6,719,034 155,898 3,058,528 399,797 429,356 1,295,166 1,250,660 50,813,627
Table 2a Weight of pesticides applied to arable crops in the United Kingdom 2016 by crop group (tonnes of active substance)
Wheat Winter
barley
Spring
barley
Oats Rye Triticale Oilseed
rape
Linseed Potatoes
ware
Potatoes
seed
Peas Beans Sugar beet All crops
Insecticides & nematicides 27.6 3.7 1.7 0.7 0.2 0.1 24.5 0.2 101.3 4.2 4.0 6.0 3.2 177.4
Fungicides 3,138.5 310.7 357.5 43.7 11.6 5.0 336.7 3.8 1,177.6 102.5 30.4 143.6 23.0 5,684.4
Herbicides 3,477.8 715.7 711.7 104.6 30.0 13.5 1,376.2 40.0 386.8 31.7 153.9 415.4 313.1 7,770.4
Growth regulators 2,008.6 347.4 95.2 80.6 27.1 12.1 8.9 0.1 58.7 . . . . 2,638.7
Molluscicides & repellents 77.2 5.3 2.0 0.3 0.6 0.1 54.3 0.1 17.3 1.7 0.7 0.1 0.7 160.4
Sulphur 27.9 0.8 29.3 0.2 . . 17.8 . 0.4 . 2.7 14.5 . 93.7
Physical control agents . . . . . . <0.1 . . . . . . <0.1
All seed treatments 116.6 20.3 14.2 3.4 0.2 0.1 9.7 0.0 23.7 8.1 4.7 0.4 5.2 206.7
All pesticides 8,874.3 1,403.9 1,211.5 233.4 69.7 30.9 1,828.2 44.2 1,765.8 148.2 196.4 579.9 345.2 16,731.7
Page 62
59
Table 3 Usage of pesticides on arable crops in the United Kingdom 2016 - percentage area of crops treated with pesticides
Crop group Insecticides &
nematicides Fungicides Herbicides Growth regulators
Molluscicides &
repellents Seed treatments Not treated
Wheat 50.97 98.97 98.19 90 25.52 96.16 0.26
Winter barley 51.81 97.51 98.21 82.97 7.67 95.4 0.45
Spring barley 22.05 94.49 97.19 36.14 1.63 89.77 1.25
Oats 38.04 84.48 91.22 65.34 2.01 76.17 6.13
Rye 36.36 81.07 89.39 70.99 16.51 62.65 0.44
Triticale 70.04 96.62 98.85 76.47 13.04 41.12 1.15
Oilseed rape 87.79 94.97 98.18 7.69 61.07 88.26 0.08
Linseed 38.62 60.84 92.33 3.35 2.89 38.76 5.73
Potatoes 50.37 99.82 99.22 16.18 38.87 83.47 0.17
Seed potatoes 82.7 100 95.27 . 35.75 84.36 .
Peas 82.38 80.76 97.19 . 5.8 79.92 0.39
Beans 82 88.77 96.07 . 0.34 6.4 0.79
Sugar beet 25.65 95.74 100 . 4.46 99.43 .
All crops 52.3 95.95 97.65 58.27 22.32 88.04 0.67
Table 4a Usage of pesticides on arable crops in the United Kingdom 2016 - number of spray rounds applied to crops (excluding seed treatments)
Crop group Insecticides & nematicides Fungicides Herbicides Growth regulators Molluscicides & repellents All pecticides
Wheat 1.4 3.6 3.1 1.7 1.4 6.6
Winter barley 1.2 2.4 2.7 1.6 1.3 5
Spring barley 1.1 1.9 2.5 1.4 1.2 3.6
Oats 1.1 1.8 2.1 1.3 1.2 3.5
Rye 2.1 2.4 2.3 2.1 1.3 4.6
Triticale 1 2.6 3.1 2 1.1 5.6
Oilseed rape 2.6 3.1 3.7 1 1.5 7.5
Linseed 1.4 1.7 3.8 1 1 5.2
Potatoes 1.5 11.6 3.3 1 2.9 15.9
Seed potatoes 6.5 9.6 2.8 . 2.6 12.6
Peas 2.5 1.5 3.5 . 1.1 5.8
Beans 2.3 2 2.5 . 1 5
Sugar beet 1.2 1.7 5.1 . 1.5 6.9
All crops 1.8 3.3 3.1 1.7 1.5 6.3
Page 63
60
Table 4b Usage of pesticides on arable crops in the United Kingdom 2016 – number of products (other than seed treatments) applied to crops
Crop group Insecticides & nematicides Fungicides Herbicides Growth regulators Molluscicides & repellents All pecticides
Wheat 1.4 6.6 4.5 2.6 1.5 14.5
Winter barley 1.3 3.7 3.9 2.3 1.5 10.3
Spring barley 1.1 2.8 3.5 1.4 1.6 7.2
Oats 1.1 2.5 2.7 1.6 1.2 6.5
Rye 2.1 3.7 3.3 3 1.3 10.5
Triticale 1 4.1 4 2.7 1.1 11
Oilseed rape 2.6 3.7 4.4 1 1.5 11.3
Linseed 1.4 1.9 4.4 1 1 6.2
Potatoes 1.5 16.3 5.7 1 3 24.4
Seed potatoes 7.9 13.2 4.8 . 2.6 26
Peas 3.1 2.2 4.8 . 1.1 9.6
Beans 2.5 2.6 3.4 . 1 7.9
Sugar beet 1.3 1.8 10.5 . 1.5 12.7
All crops 1.8 5.2 4.3 2.3 1.6 12.3
Table 4c Usage of pesticides on arable crops in the United Kingdom 2016 – number of active substances (other than seed treatments) applied to crops
Crop group Insecticides & nematicides Fungicides Herbicides Growth regulators Molluscicides & repellents All pecticides
Wheat 1.4 10.1 6.7 2.9 1.5 20.5
Winter barley 1.3 6.2 5.4 2.7 1.5 14.7
Spring barley 1.1 4.9 5 1.9 1.6 10.8
Oats 1.1 3.8 3.9 1.9 1.2 8.9
Rye 2.1 5.9 4.5 3.8 1.3 14.5
Triticale 1 5.7 5.5 3.6 1.1 14.7
Oilseed rape 2.6 5.2 5.6 2 1.5 14.1
Linseed 1.4 2 4.6 1 1 6.6
Potatoes 1.5 22.7 5.8 1 3 31
Seed potatoes 7.9 18.6 5.1 . 2.6 31.6
Peas 3.1 3.7 5.5 . 1.1 11.5
Beans 2.5 4.1 4.2 . 1 10
Sugar beet 1.3 3.4 16.1 . 1.5 19.8
All crops 1.8 8 6.1 2.7 1.6 16.9
Page 64
61
Table 5 Usage of pesticides on arable crops grown in the United Kingdom, 2016 (spray hectares)
Wheat Winter
barley
Spring
barley
Oats Rye Triticale Oilseed
rape
Linseed All
potatoes
Peas Beans Sugar
beet
All
crops
Fungicides Azoxystrobin 110,904 9,729 8,975 16,680 12,527 2,155 169,799 . 15,811 24,781 44,466 . 415,826
Azoxystrobin/chlorothalonil 203,166 11,604 11,428 . . 364 . . 1,409 . . . 227,971
Azoxystrobin/cyproconazole 9,380 921 1,686 24,403 4,849 . 47,749 . . . 7,335 96,323
Bixafen/fluoxastrobin/prothioconazole 85,816 24 55 . . . . . . . . 85,895
Bixafen/prothioconazole 308,430 174,313 206,406 1,705 . . . . . . . 690,854
Bixafen/prothioconazole/spiroxamine 147,267 . . . . . . . . . . 147,267
Bixafen/prothioconazole/tebuconazole 205,040 . . . . . 55,730 . . . . 260,770
Boscalid . . . . . . 98,595 598 . . . 99,193
Boscalid/epoxiconazole 204,509 4,449 6,778 1,461 904 451 . . . . . 218,553
Boscalid/pyraclostrobin . . . . . . . . 12,183 1,936 42,227 . 56,346
Chlorothalonil 2,694,253 141,595 219,922 1,036 . 2,590 76 . 4,270 34,711 . 3,098,453
Chlorothalonil/cyproconazole 94,544 757 1,281 . . . . . 45,618 177,474 . 319,674
Chlorothalonil/cyproconazole/propiconazole 252,738 6,402 4,295 . . . . . . . . 263,435
Chlorothalonil/penthiopyrad 125,603 11,022 11,121 . . . . . . . . 147,746
Chlorothalonil/picoxystrobin 4,190 11,593 39,108 . . . . . . . . 54,891
Chlorothalonil/proquinazid 51,393 12,706 4,448 . . . . . . . . 68,547
Chlorothalonil/tebuconazole 278,621 955 . . . 476 . . . . . 280,051
Copper oxychloride 33,200 8,848 13,645 1,619 1,264 . 373 . 2,251 . 1,667 . 62,867
Cyazofamid . . . . . . . . 260,976 . . . 260,976
Cyflufenamid 55,886 9,906 4,182 11,962 . . . . . . . 81,936
Cymoxanil . . . . . . . . 215,888 . . . 215,888
Cymoxanil/fluazinam . . . . . . . . 50,955 . . . 50,955
Cymoxanil/mancozeb . . . . . . . . 407,203 . . . 407,203
Cymoxanil/propamocarb hydrochloride . . . . . . . . 52,677 . . . 52,677
Cyproconazole 36,274 . 30 924 2,646 . . . . 4,380 14,116 58,371
Cyproconazole/penthiopyrad 58,242 . . . . . . . . . . 58,242
Cyproconazole/trifloxystrobin . . . . . . . . . . 96,566 96,566
Cyprodinil 49 55,834 14,010 39 . . . . . . . 69,932
Cyprodinil/isopyrazam . 106,114 67,669 . . . . . . . . 173,783
Difenoconazole . . . . . . 96,006 8,413 5,144 . . . 109,562
Dimethomorph/fluazinam . . . . . . . . 50,889 . . . 50,889
Dimethomorph/mancozeb . . . . . . . . 53,958 . . . 53,958
Epoxiconazole 882,158 11,525 10,851 22,429 3,232 3,110 . . . . 4,662 937,966
Epoxiconazole/fenpropimorph 146,590 30,029 22,939 5,471 6,090 1,333 . . . . . 212,452
Epoxiconazole/fenpropimorph/kresoxim-methyl 66,173 4,646 11,913 15,034 2,942 2,301 . . . . . 103,010
Epoxiconazole/fenpropimorph/metrafenone 46,659 2,050 4,651 13,789 . . . . . . . 67,150
Epoxiconazole/fluxapyroxad 477,838 16,925 6,495 . 545 128 . . . . . 501,931
Epoxiconazole/fluxapyroxad/pyraclostrobin 160,318 24,967 45,418 745 . . . . . . . 231,447
Epoxiconazole/folpet 132,675 4,747 5,320 . . . . . . . . 142,742
Epoxiconazole/isopyrazam 108,100 10,393 5,685 . 1,937 . . . . . . 126,115
Epoxiconazole/metconazole 376,543 38 499 . . 6,903 . . . . . 383,983
Epoxiconazole/metrafenone 49,569 6,760 . 12,449 4,196 1,350 . . . . . 74,324
Epoxiconazole/prochloraz 67,089 2,258 3,882 . . 96 . . . . . 73,325
Epoxiconazole/pyraclostrobin 53,574 . 2,314 11,362 152 183 . . . . 13,972 81,557
Page 65
62
Table 5 (cont.) Usage of pesticides on arable crops grown in the United Kingdom, 2016 (spray hectares)
Wheat Winter
barley
Spring
barley
Oats Rye Triticale Oilseed
rape
Linseed All
potatoes
Peas Beans Sugar
beet
All
crops
Fungicides (cont.) Fenpropimorph 67,174 50,529 24,959 15,156 5,774 163 476 . . . . 164,231
Fenpropimorph/pyraclostrobin 15,255 11,340 20,780 9,765 . . . . . . . 57,141
Fluazinam . . . . . . . . 434,789 . . . 434,789
Fluopicolide/propamocarb hydrochloride . . . . . . . . 120,794 . . . 120,794
Fluopyram/prothioconazole . . . . . . 60,376 . . . . 60,376
Fluoxastrobin/prothioconazole 197,025 33,844 49,479 9,291 3,625 . 35 . . . . 293,300
Fluoxastrobin/prothioconazole/trifloxystrobin 2,938 76,930 105,826 . 149 . . . . . . 185,842
Fluxapyroxad 542,870 20,770 26,481 476 . 897 . . . . . 591,493
Fluxapyroxad/metconazole 81,030 793 . . . . . . . . . 81,822
Fluxapyroxad/pyraclostrobin 104,599 19,761 9,027 279 . 183 . . . . . 133,848
Folpet 51,303 30,512 44,085 1,325 . . . . . . . 127,226
Isopyrazam . 39,685 60,583 . . . . . . . . 100,268
Mancozeb 9,547 . . . . . . . 110,924 . . . 120,471
Mandipropamid . . . . . . . . 156,063 . . . 156,063
Metconazole 6,575 96 1,074 188 . 228 34,854 5,958 2,842 1,705 . 53,519
Penthiopyrad 345,398 25,481 24,258 . . . . . . . . 395,137
Penthiopyrad/picoxystrobin 32,168 5,930 1,479 1,688 . 304 144,052 . . . . 185,619
Picoxystrobin 1,695 753 . 4,223 . . 46,953 . . . . 53,624
Prochloraz/proquinazid/tebuconazole 50,679 12,907 8,854 1,159 . . . . . . . 73,599
Prochloraz/tebuconazole 198,173 481 4,050 . 1,445 . 129,426 . . . . 333,574
Proquinazid 69,126 13,229 5,791 26,977 1,704 938 . . . . . 117,765
Prothioconazole 291,821 53,529 42,046 4,071 222 . 370,221 . . . . 761,910
Prothioconazole/spiroxamine 24,962 124,063 219,061 4,925 549 . . . . . . 373,559
Prothioconazole/spiroxamine/tebuconazole 50,207 18,583 28,973 1,310 . . . . . . . 99,073
Prothioconazole/tebuconazole 499,953 68,894 104,026 5,655 2,319 897 280,518 292 . . . 962,555
Prothioconazole/trifloxystrobin 31,582 118,319 145,576 15 . . . . . . . 295,492
Pyraclostrobin 212,861 16,941 31,050 12,835 2,844 872 . . . . . 277,404
Tebuconazole 845,103 14,158 10,112 31,863 5,183 4,640 339,820 16,261 2,261 45,797 . 1,315,198
Trifloxystrobin . 22,517 40,505 . . . . . . . . 63,022
Other fungicides1,2 205,058 27,698 15,476 8,759 300 183 167,132 1,816 258,517 620 30,677 9,349 725,584
All fungicides 11,463,89
6
1,488,848 1,758,555 281,067 65,398 30,743 2,042,188 33,337 2,210,429 82,328 383,104 146,000 19,985,893
1Throughout all tables, “Other” refers to chemicals grouped together because they were applied to less than 0.1% of the total area treated with pesticides
2Other fungicides include ametoctradin/dimethomorph, ametoctradin/mancozeb, amisulbrom, azoxystrobin/isopyrazam, azoxystrobin/tebuconazole, benthiavalicarb-isopropyl/mancozeb, boscalid/dimoxystrobin,
boscalid/epoxiconazole/pyraclostrobin, boscalid/metconazole, carbendazim/flusilazole, chlorothalonil/cymoxanil, chlorothalonil/mancozeb, chlorothalonil/propiconazole, cymoxanil/famoxadone, cymoxanil/mandipropamid,
cymoxanil/zoxamide, cyproconazole/picoxystrobin, cyproconazole/propiconazole, cyprodinil/picoxystrobin, difenoconazole/fenpropidin, difenoconazole/mandipropamid, difenoconazole/paclobutrazol,
difenoconazole/propiconazole, dimethomorph/zoxamide, dimoxystrobin/epoxiconazole, epoxiconazole/fenpropimorph/pyraclostrobin, fenamidone/propamocarb hydrochloride, fenpropidin/prochloraz/tebuconazole,
fenpropimorph/flusilazole, flusilazole, flutriafol, iprodione/thiophanate-methyl, mancozeb/metalaxyl-M, mancozeb/zoxamide, metalaxyl-M, metrafenone, pencycuron, prochloraz, prochloraz/propiconazole, propiconazole,
pyriofenone, quinoxyfen, spiroxamine, spiroxamine/tebuconazole, thiophanate-methyl and unspecified fungicides.
Page 66
63
Table 5 (cont.) Usage of pesticides on arable crops grown in the United Kingdom, 2016 (spray hectares)
Wheat Winter
barley
Spring
barley
Oats Rye Triticale Oilseed
rape
Linseed All
potatoes
Peas Beans Sugar
beet
All
crops
Herbicides & desiccants
Amidosulfuron/iodosulfuron-methyl-sodium 41,979 9,130 7,518 . . . . 8,349 . . . 66,976
Aminopyralid/propyzamide . . . . . . 170,194 . . . . 170,194
Bentazone . . . . . . . 1,146 783 21,134 33,366 . 56,429
Bifenox 848 . . . . . 72,661 . . . . 73,508
Carbetamide . . . . . . 55,709 1,119 . 8,667 . 65,495
Carfentrazone-ethyl 264 557 265 . . . . 258 68,550 . 192 914 71,000
Clethodim . . 44 32 . . 157,104 9,232 584 146 19,350 186,491
Clodinafop-propargyl 173,150 . 450 . 152 1,856 . . . . . 175,608
Clomazone . . . . . . 113,749 . 24,748 9,706 43,050 . 191,252
Clomazone/linuron . . . . . . . . 2,679 9,684 58,203 . 70,566
Clopyralid 423 610 739 117 . . 32,669 3,432 . . 56,473 94,461
Clopyralid/florasulam/fluroxypyr 20,063 5,407 40,356 4,941 . . . . . . . 70,767
Desmedipham/ethofumesate/lenacil/phenmedipham . . . . . . . . . . 94,342 94,342
Dicamba/mecoprop-P 3,990 431 90,619 9,588 . . . . . . . 104,627
Diflufenican 446,131 108,873 29,456 15,060 6,113 1,075 . . . . . 606,707
Diflufenican/flufenacet 798,781 215,919 101,020 18,065 11,678 4,009 . . . . . 1,149,472
Diflufenican/flufenacet/flurtamone 337,211 30,891 . . . . . . . . . 368,102
Diflufenican/flupyrsulfuron-methyl 25,949 7,397 . 22,734 . . . . . . . 56,080
Diflufenican/iodosulfuron-methyl-sodium/mesosulfuron-methyl 83,379 20 . . . . . . . . . 83,399
Dimethenamid-P/metazachlor/quinmerac . . . . . . 162,994 . . . . 162,994
Diquat 1,172 2,248 199 244 70 . 9,301 5,321 274,020 7,521 4,838 216 305,148
Fenoxaprop-P-ethyl 33,037 10,160 13,931 . . . . . . . . 57,128
Florasulam 43,275 9,522 5,149 6,947 . . . . . . . 64,892
Florasulam/fluroxypyr 227,106 59,198 60,177 22,184 4,302 128 . . . . . 373,095
Florasulam/pyroxsulam 136,608 . . . 331 411 . . . . . 137,350
Fluazifop-P-butyl . . . . . . 57,981 2,119 413 3,305 2,208 66,026
Flufenacet 85,099 14,302 . . . . . . . . . 99,400
Flufenacet/pendimethalin 351,704 78,873 32,930 81 . . . . . . . 463,588
Flupyrsulfuron-methyl 134,530 52,538 . 1,960 275 . . . . . . 189,302
Fluroxypyr 513,087 84,764 206,692 31,568 460 7,063 . . . . . 843,632
Glyphosate 1,075,162 227,075 361,687 65,322 12,772 7,733 500,488 26,769 66,956 46,629 143,351 73,758 2,607,702
Imazamox/pendimethalin . . . . . . . . 28,732 56,888 . 85,621
Iodosulfuron-methyl-sodium/mesosulfuron-methyl 664,557 1,451 147 . 5,700 1,246 . . . . . 673,101
Lenacil . . . . . . . . . . 58,240 58,240
Linuron . . . . . . . . 104,695 4,254 14,593 . 123,541
Page 67
64
Table 5 (cont.) Usage of pesticides on arable crops grown in the United Kingdom, 2016 (spray hectares)
Wheat Winter
barley
Spring
barley
Oats Rye Triticale Oilseed
rape
Linseed All
potatoes
Peas Beans Sugar
beet
All
crops
Herbicides & desiccants (cont.)
MCPA 29,468 1,264 18,208 6,691 806 476 . . 118 . 68 83 57,181
Mecoprop-P 138,429 27,762 161,571 28,295 1,666 550 . . . . . 358,273
Metamitron . . . . . . . . . . 148,405 148,405
Metazachlor . . . . . . 111,937 1,398 . . . 113,335
Metazachlor/quinmerac . . . . . . 98,665 . . . . 98,665
Metribuzin . . . . . . . . 88,967 . . . 88,967
Metsulfuron-methyl 196,499 35,481 64,886 11,481 . 2,383 . 5,813 . . . 316,544
Metsulfuron-methyl/thifensulfuron-methyl 143,018 36,083 263,512 6,035 . . . . . . . 448,648
Metsulfuron-methyl/tribenuron-methyl 162,515 44,657 131,569 22,052 8,066 4,109 . . . . . 372,969
Pendimethalin 359,456 90,706 48,295 914 11,853 4,238 . . 23,836 12,846 83,626 . 635,771
Pendimethalin/picolinafen 175,863 73,245 41,516 1,746 . 128 . . . . . 292,497
Pinoxaden 62,687 142,515 227,448 23 . . . . . . . 432,673
Propaquizafop . . . . . . 302,041 5,172 3,076 7,427 16,794 12,839 347,348
Propyzamide . . . . . . 235,289 . . 25,269 . 260,558
Prosulfocarb 312,865 51,983 9,695 . 750 . . . 35,229 . 11,045 . 421,567
Quizalofop-P-tefuryl . . . . . . 60,839 2,135 . 1,195 501 64,670
Thifensulfuron-methyl/tribenuron-methyl 42,985 13,524 76,316 16,870 . 476 . . . . . 150,171
Tri-allate 240,816 36,832 10,759 . 775 . . 2,539 5,908 6,549 219 304,396
Tribenuron-methyl 29,828 8,203 16,869 7,117 671 . . . . . . 62,688
Triflusulfuron-methyl . . . . . . . . . . 88,891 88,891
Other herbicides & desicants1 179,014 57,570 64,504 18,463 1,961 877 167,301 22,382 60,594 38,225 46,246 282,075 939,212
All herbicides & desiccants 7,270,944 1,539,191 2,086,523 318,530 68,402 36,757 2,308,920 97,183 754,249 193,062 557,392 838,513 16,069,663
1Other herbicides include 2,4-D, 2,4-D/glyphosate, 2,4-D/MCPA, 2,4-DB, 2,4-DB/MCPA, amidosulfuron, aminopyralid/metazachlor/picloram, bromoxynil, bromoxynil/diflufenican, bromoxynil/ioxynil, carfentrazone-
ethyl/flupyrsulfuron-methyl, carfentrazone-ethyl/mecoprop-p, chloridazon, chloridazon/metamitron, chlorotoluron/diflufenican, chlorotoluron/diflufenican/pendimethalin, clodinafop-propargyl/pinoxaden, clodinafop-propargyl/prosulfocarb, clomazone/metazachlor, clomazone/metribuzin, clomazone/pendimethalin, clopyralid/florasulam, clopyralid/picloram, cycloxydim, desmedipham/ethofumesate/phenmedipham,
desmedipham/phenmedipham, dicamba/MCPA/mecoprop-P, dichlorprop-P/MCPA/mecoprop-P, diflufenican/florasulam, diflufenican/flurtamone, diflufenican/Isoproturon, diflufenican/metsulfuron-methyl,
diflufenican/pendimethalin, dimethachlor, dimethenamid-p/metazachlor, ethametsulfuron-methyl, ethofumesate, ethofumesate/metamitron, ethofumesate/metamitron/phenmedipham, ethofumesate/phenmedipham, florasulam/tribenuron-methyl, flufenacet/metribuzin, flufenacet/picolinafen, flumioxazine, flupyrsulfuron-methyl/pyroxsulam, flupyrsulfuron-methyl/thifensulfuron-methyl, fluroxypyr/halauxifen-methyl, fluroxypyr/triclopyr,
glyphosate/pyraflufen-ethyl, imazamox/metazachlor, imazamox/metazachlor/quinmerac, iodosulfuron-methyl-sodium, Isoproturon, lenacil/triflusulfuron-methyl, MCPB, mesotrione, metobromuron, napropamide,
pendimethalin/pyroxsulam, phenmedipham, picolinafen, propoxycarbazone-sodium, pyridate, pyraflufen-ethyl, quizalofop-p-ethyl, rimsulfuron, S-metolachlor, sulfosulfuron, tepraloxydim, thifensulfuron-methyl, thifensulfuron-methyl/tribenuron methyl and unspecified herbicides.
Page 68
65
Table 5 (cont.) Usage of pesticides on arable crops grown in the United Kingdom, 2016 (spray hectares)
Wheat Winter
barley
Spring
barley
Oats Rye Triticale Oilseed
rape
Linseed All
potatoes
Peas Beans Sugar
beet
All
crops
Insecticides & nematicides
Alpha-cypermethrin 11,861 2,618 402 1,516 . . 40,660 . 477 340 . 57,873
Cypermethrin 393,661 94,232 13,014 14,213 5,917 2,297 295,781 3,471 1,865 6,385 36,380 . 867,213
Esfenvalerate 103,101 34,688 16,252 61 57 . . . 29,976 567 20,579 . 205,282
Lambda-cyhalothrin 671,302 135,585 111,687 37,930 10,357 7,679 610,836 6,026 66,173 55,229 218,450 13,744 1,944,997
Pirimicarb 4,194 1,415 . . . . 1,497 . 3,456 26,970 29,727 451 67,709
Tau-fluvalinate 20,683 6,198 1,645 . 275 . 166,191 . . 1,950 . 196,942
Thiacloprid 775 . . . . . 32,904 . 28,469 6,035 . 7,210 75,394
Zeta-cypermethrin 50,787 12,320 12,367 7,073 2,325 1,194 77,654 3,254 440 9,421 18,947 . 195,782
Other insecticides & nematicides1 48,994 3,521 6,970 1,051 52,950 59,117 1,349 12,246 5,692 191,889
All insecticides & nematicides 1,305,358 290,576 162,336 61,844 18,931 11,170 1,278,472 12,750 189,496 106,433 338,619 27,096 3,803,080
Molluscicides & repellents
Ferric phosphate 94,057 5,555 3,681 120 266 . 46,337 . 34,794 . . 1,399 186,208
Metaldehyde 571,346 38,992 14,939 2,757 5,251 1,454 452,806 787 125,387 5,485 585 3,957 1,223,746
Other molluscicides & repellents2 8,179 10,626 846 19,651
All molluscicides & repellents 673,582 44,547 18,621 2,877 5,517 1,454 509,768 787 161,027 5,485 585 5,357 1,429,606
Sulphur 17,500 661 4,756 137 . . 4,395 . 278 1,689 4,412 . 33,828
Other Physical Controls
Garlic . . . . . . . 354 . . . 354
1Other insecticides and nematicides include acetamiprid, beta-cyfluthrin, chlorpyrifos, deltamethrin, dimethoate, ethoprophos, flonicamid, fosthiazate, indoxacarb, oxamyl, pymetrozine, rotenone, thiamethoxam and unspecified
insecticides.
2Other molluscicides & repellents include methiocarb and unspecified molluscicides.
Page 69
66
Table 5 (cont.) Usage of pesticides on arable crops grown in the United Kingdom, 2016 (spray hectares)
Wheat Winter
barley
Spring
barley
Oats Rye Triticale Oilseed
rape
Linseed All
potatoes
Peas Beans Sugar
beet
All
crops
Growth regulators
2-chloroethylphosphonic acid 58,174 44,967 38,079 . 559 128 . . . . . 141,907
2-chloroethylphosphonic acid/mepiquat 64,173 48,048 34,499 30 7,182 5,213 . . . . . 159,144
Chlormequat 2,158,837 330,689 99,763 81,187 22,491 8,219 . 914 . . . 2,702,099
Chlormequat/imazaquin 149,220 . . . 123 . . . . . . 149,343
Mepiquat chloride/prohexadione-calcium 150,787 61,208 36,776 16,473 3,231 1,263 . . . . . 269,738
Prohexadione-calcium/trinexapac-ethyl 61,747 14,531 764 793 1,524 897 . . . . . 80,257
Trinexapac-ethyl 1,295,712 259,907 91,872 54,561 18,528 3,260 33 . . . . 1,723,874
Other growth regulators1 72,532 27,583 22,020 364 45,679 19,863 188,041
All growth regulators 4,011,183 786,932 323,772 153,044 53,639 19,344 45,713 914 19,863 5,414,402
1Other growth regulators include 2-chloroethylphosphonic acid/mepiquat chloride, chlormequat chloride, chlormequat chloride/2-chloroethylphosphonic acid, chlormequat chloride/2-chloroethylphosphonic acid/mepiquat
chloride, chlormequat/2-chloroethylphosphonic acid, maleic hydrazide, mepiquat chloride/metconazole and unspecified growth regulators.
Page 70
67
Table 5 (cont.) Usage of pesticides on arable crops grown in the United Kingdom, 2016 (spray hectares)
Wheat Winter
barley
Spring
barley
Oats Rye Triticale Oilseed
rape
Linseed All
potatoes
Peas Beans Sugar
beet
All
crops
Seed treatments
Fungicide seed treatments
Fludioxonil 124,965 11,189 28,254 12,133 2,319 228 . . 634 . . . 179,723
Fluopyram/prothioconazole/tebuconazole . 74,839 185,988 . . . . . . . . 260,827
Fluquinconazole/prochloraz 68,473 3,176 . . . . . . . . . 71,649
Hymexazol . . . . . . . . . . 85,947 85,947
Prochloraz/thiram . . . . . . 331,227 . . . . 331,227
Prochloraz/triticonazole 249,085 101,512 220,273 28,591 4,009 96 . . . . . 603,566
Prothioconazole 208,735 33,346 21,412 11,953 . 1,295 . . . . . 276,741
Prothioconazole/tebuconazole 104,256 5,648 13,627 9,748 . . . . . . . 133,279
Silthiofam 100,624 11,741 . . . . . . . . . 112,365
Tebuconazole . 438 . . . . . . . . . 438
Thiram . . . . . . 34,111 . 18,316 1,029 85,947 139,403
Fungicide/insecticide seed treatments
Clothianidin/prothioconazole 680,581 99,896 10,593 18,711 1,628 911 . . . . . 812,321
Insecticide seed treatments
Clothianidin 47,461 26,271 . 311 . . . . . . . 74,043
Unspecified seed treatments 247,433 68,349 89,640 23,202 9,164 2,001 139,763 8,646 36,797 9,442 8,998 . 643,435
Other seed treatments1 90,888 21,870 46,668 4,196 827 . 24,477 1,928 85,552 12,600 1,026 61,801 351,834
All seed treatments 1,922,502 458,275 616,455 108,844 17,947 4,531 529,578 10,574 122,983 40,359 11,054 233,695 4,076,797
1Other seed treatments include beta-cyfluthrin/clothianidin, carboxin/thiram, cymoxanil/fludioxonil/metalaxyl-M, difenoconazole/fludioxonil, difenoconazole/fludioxonil/tebuconazole, fludioxonil/metalaxyl-m/thiamethoxam,
fludioxonil/tefluthrin, fluquinconazole, flutolanil, imazalil, imazalil/ipconazole, imazalil/pencycuron, imazalil/thiabendazole, imidacloprid, ipconazole, methiocarb, pencycuron, prochloraz, tefluthrin, thiamethoxam, unspecified
growth promoters and zinc ammonium.
Page 71
68
Table 6 Usage of pesticides on arable crops grown in the United Kingdom, 2016 (kg of active substances applied)
Wheat Winter
barley
Spring
barley
Oats Rye Triticale Oilseed
rape
Linseed All
potatoes
Peas Beans Sugar
beet
All
crops
Fungicides
Azoxystrobin 11,174 925 959 1,942 1,612 170 24,564 . 10,317 3,291 6,243 . 61,197
Azoxystrobin/chlorothalonil 111,422 6,102 6,078 . . 200 . . 676 . . . 124,478
Azoxystrobin/cyproconazole 1,364 129 157 4,376 1,205 . 9,756 . . . 1,459 18,446
Bixafen/fluoxastrobin/prothioconazole 19,238 6 5 . . . . . . . . 19,249
Bixafen/prothioconazole 72,094 22,884 24,603 185 . . . . . . . 119,765
Bixafen/prothioconazole/spiroxamine 72,575 . . . . . . . . . . 72,575
Bixafen/prothioconazole/tebuconazole 62,516 . . . . . 14,056 . . . . 76,573
Boscalid . . . . . . 11,764 83 . . . 11,847
Boscalid/epoxiconazole 59,668 902 1,288 438 271 96 . . . . . 62,662
Boscalid/pyraclostrobin . . . . . . . . 1,017 323 7,700 . 9,041
Chlorothalonil 1,285,185 65,517 98,317 523 . 1,207 19 . 2,391 20,450 . 1,473,609
Chlorothalonil/cyproconazole 44,729 328 451 . . . . . 23,872 100,108 . 169,487
Chlorothalonil/cyproconazole/propiconazole 127,324 3,129 2,396 . . . . . . . . 132,848
Chlorothalonil/penthiopyrad 55,769 3,718 4,407 . . . . . . . . 63,894
Chlorothalonil/picoxystrobin 1,504 5,464 16,539 . . . . . . . . 23,506
Chlorothalonil/proquinazid 22,623 4,834 2,098 . . . . . . . . 29,554
Chlorothalonil/tebuconazole 160,514 545 . . . 243 . . . . . 161,301
Copper oxychloride 3,662 1,232 1,536 190 106 . 39 . 1,976 . 201 . 8,942
Cyazofamid . . . . . . . . 20,236 . . . 20,236
Cyflufenamid 351 65 26 85 . . . . . . . 526
Cymoxanil . . . . . . . . 19,514 . . . 19,514
Cymoxanil/fluazinam . . . . . . . . 15,477 . . . 15,477
Cymoxanil/mancozeb . . . . . . . . 559,290 . . . 559,290
Cymoxanil/propamocarb hydrochloride . . . . . . . . 49,389 . . . 49,389
Cyproconazole 1,536 . 1 27 93 . . . . 170 475 2,302
Cyproconazole/penthiopyrad 9,185 . . . . . . . . . . 9,185
Cyproconazole/trifloxystrobin . . . . . . . . . . 16,882 16,882
Cyprodinil 5 10,771 2,159 3 . . . . . . . 12,938
Cyprodinil/isopyrazam . 27,859 17,012 . . . . . . . . 44,871
Difenoconazole . . . . . . 6,790 661 628 . . . 8,079
Dimethomorph/fluazinam . . . . . . . . 15,246 . . . 15,246
Dimethomorph/mancozeb . . . . . . . . 92,643 . . . 92,643
Epoxiconazole 66,666 807 576 1,145 232 207 . . . . 291 69,923
Epoxiconazole/fenpropimorph 47,977 7,416 6,270 1,425 1,740 385 . . . . . 65,213
Epoxiconazole/fenpropimorph/kresoxim-methyl 18,177 881 2,126 4,130 878 611 . . . . . 26,802
Epoxiconazole/fenpropimorph/metrafenone 10,553 556 706 3,904 . . . . . . . 15,718
Epoxiconazole/fluxapyroxad 64,024 1,822 701 . 68 21 . . . . . 66,635
Epoxiconazole/fluxapyroxad/pyraclostrobin 35,454 3,599 6,699 109 . . . . . . . 45,861
Epoxiconazole/folpet 88,480 2,610 1,971 . . . . . . . . 93,060
Epoxiconazole/isopyrazam 18,798 1,429 683 . 316 . . . . . . 21,225
Epoxiconazole/metconazole 26,791 4 9 . . 518 . . . . . 27,323
Epoxiconazole/metrafenone 5,480 801 . 1,709 588 134 . . . . . 8,711
Epoxiconazole/prochloraz 12,756 339 963 . . 28 . . . . . 14,086
Page 72
69
Table 6 (cont.) Usage of pesticides on arable crops grown in the United Kingdom, 2016 (kg of active substances applied)
Wheat Winter
barley
Spring
barley
Oats Rye Triticale Oilseed
rape
Linseed All
potatoes
Peas Beans Sugar
beet
All
crops
Fungicides (cont.)
Epoxiconazole/pyraclostrobin 6,476 . 142 1,565 18 22 . . . . 2,002 10,225
Fenpropimorph 15,261 12,889 6,421 4,854 1,822 73 36 . . . . 41,356
Fenpropimorph/pyraclostrobin 5,036 2,831 6,597 3,780 . . . . . . . 18,244
Fluazinam . . . . . . . . 70,365 . . . 70,365
Fluopicolide/propamocarb hydrochloride . . . . . . . . 129,655 . . . 129,655
Fluopyram/prothioconazole . . . . . . 11,537 . . . . 11,537
Fluoxastrobin/prothioconazole 32,230 5,434 6,461 1,215 540 . 6 . . . . 45,885
Fluoxastrobin/prothioconazole/trifloxystrobin 336 11,141 12,795 . 22 . . . . . . 24,294
Fluxapyroxad 33,308 718 886 12 . 45 . . . . . 34,969
Fluxapyroxad/metconazole 8,779 46 . . . . . . . . . 8,825
Fluxapyroxad/pyraclostrobin 17,606 2,481 1,004 31 . 29 . . . . . 21,151
Folpet 23,007 12,970 16,961 596 . . . . . . . 53,535
Isopyrazam . 2,324 3,236 . . . . . . . . 5,561
Mancozeb 8,974 . . . . . . . 116,983 . . . 125,958
Mandipropamid . . . . . . . . 23,120 . . . 23,120
Metconazole 142 4 21 8 . 1 1,603 279 114 74 . 2,247
Penthiopyrad 50,873 3,243 2,488 . . . . . . . . 56,603
Penthiopyrad/picoxystrobin 5,436 874 178 229 . 18 19,053 . . . . 25,788
Picoxystrobin 73 43 . 533 . . 9,847 . . . . 10,495
Prochloraz/proquinazid/tebuconazole 12,534 3,095 2,027 292 . . . . . . . 17,948
Prochloraz/tebuconazole 67,319 114 1,188 . 612 . 48,187 . . . . 117,420
Proquinazid 1,726 294 160 722 45 24 . . . . . 2,971
Prothioconazole 29,119 4,732 3,538 411 22 . 38,502 . . . . 76,324
Prothioconazole/spiroxamine 5,405 29,385 45,421 1,324 129 . . . . . . 81,663
Prothioconazole/spiroxamine/tebuconazole 13,902 4,926 7,043 450 . . . . . . . 26,322
Prothioconazole/tebuconazole 83,031 8,953 12,959 825 232 179 42,676 44 . . . 148,900
Prothioconazole/trifloxystrobin 3,768 17,784 19,581 2 . . . . . . . 41,135
Pyraclostrobin 13,928 1,562 2,225 1,051 274 60 . . . . . 19,100
Tebuconazole 131,419 1,701 1,145 4,783 672 663 57,020 2,619 364 7,261 . 207,647
Trifloxystrobin . 2,217 3,457 . . . . . . . . 5,675
Epoxiconazole/prochloraz 12,756 339 963 . . 28 . . . . . 14,086
Epoxiconazole/pyraclostrobin 6,476 . 142 1,565 18 22 . . . . 2,002 10,225
Fenpropimorph 15,261 12,889 6,421 4,854 1,822 73 36 . . . . 41,356
Other fungicides1,2 51,202 6,258 2,790 779 97 57 41,266 108 153,557 6 1,375 1,877 259,371
All fungicides 3,138,484 310,689 357,457 43,652 11,594 4,989 336,721 3,794 1,280,089 30,360 143,582 22,987 5,684,397
1Throughout all tables, “Other” refers to chemicals grouped together because they were applied to less than 0.1% of the total area treated with pesticides.
2Other fungicides include ametoctradin/dimethomorph, ametoctradin/mancozeb, amisulbrom, azoxystrobin/isopyrazam, azoxystrobin/tebuconazole, benthiavalicarb-isopropyl/mancozeb, boscalid/dimoxystrobin,
boscalid/epoxiconazole/pyraclostrobin, boscalid/metconazole, carbendazim/flusilazole, chlorothalonil/cymoxanil, chlorothalonil/mancozeb, chlorothalonil/propiconazole, cymoxanil/famoxadone, cymoxanil/mandipropamid, cymoxanil/zoxamide, cyproconazole/picoxystrobin, cyproconazole/propiconazole, cyprodinil/picoxystrobin, difenoconazole/fenpropidin, difenoconazole/mandipropamid, difenoconazole/paclobutrazol,
difenoconazole/propiconazole, dimethomorph/zoxamide, dimoxystrobin/epoxiconazole, epoxiconazole/fenpropimorph/pyraclostrobin, fenamidone/propamocarb hydrochloride, fenpropidin/prochloraz/tebuconazole,
fenpropimorph/flusilazole, flusilazole, flutriafol, iprodione/thiophanate-methyl, mancozeb/metalaxyl-M, mancozeb/zoxamide, metalaxyl-M, metrafenone, pencycuron, prochloraz, prochloraz/propiconazole, propiconazole, pyriofenone, quinoxyfen, spiroxamine, spiroxamine/tebuconazole, thiophanate-methyl and unspecified fungicides.
Page 73
70
Table 6 (cont.) Usage of pesticides on arable crops grown in the United Kingdom, 2016 (kg of active substances applied)
Wheat Winter
barley
Spring
barley
Oats Rye Triticale Oilseed
rape
Linseed All
potatoes
Peas Beans Sugar
beet
All
crops
Herbicides & desiccants
Amidosulfuron/iodosulfuron-methyl-sodium 676 200 158 . . . . 216 . . . 1,249
Aminopyralid/propyzamide . . . . . . 137,083 . . . . 137,083
Bentazone . . . . . . . 1,083 625 17,010 26,437 . 45,154
Bifenox 610 . . . . . 31,313 . . . . 31,923
Carbetamide . . . . . . 86,454 1,678 . 15,228 . 103,360
Carfentrazone-ethyl 2 10 5 . . . . 3 2,892 . 4 7 2,923
Clethodim . . <1 4 . . 18,339 1,100 69 17 2,284 21,814
Clodinafop-propargyl 5,202 . 16 . 5 57 . . . . . 5,280
Clomazone . . . . . . 8,562 . 1,500 758 3,043 . 13,863
Clomazone/linuron . . . . . . . . 1,376 5,309 31,412 . 38,097
Clopyralid 18 43 49 8 . . 3,745 315 . . 5,298 9,477
Clopyralid/florasulam/fluroxypyr 3,705 1,006 5,860 938 . . . . . . . 11,509
Desmedipham/ethofumesate/lenacil/phenmedipham . . . . . . . . . . 21,110 21,110
Dicamba/mecoprop-P 1,996 354 47,768 5,490 . . . . . . . 55,609
Diflufenican 30,573 7,197 1,286 1,147 310 89 . . . . . 40,602
Diflufenican/flufenacet 185,177 49,552 14,608 3,234 2,895 1,090 . . . . . 256,554
Diflufenican/flufenacet/flurtamone 128,366 6,003 . . . . . . . . . 134,369
Diflufenican/flupyrsulfuron-methyl 1,263 401 . 1,653 . . . . . . . 3,317
Diflufenican/iodosulfuron-methyl-sodium/mesosulfuron-methyl 4,548 <1 . . . . . . . . . 4,548
Dimethenamid-P/metazachlor/quinmerac . . . . . . 148,962 . . . . 148,962
Diquat 703 1,289 20 163 49 . 4,233 3,083 107,553 4,036 2,671 129 123,928
Fenoxaprop-P-ethyl 2,007 661 830 . . . . . . . . 3,498
Florasulam 171 43 16 29 . . . . . . . 258
Florasulam/fluroxypyr 18,571 5,242 4,728 1,667 319 7 . . . . . 30,532
Florasulam/pyroxsulam 2,861 . . . 7 9 . . . . . 2,877
Fluazifop-P-butyl . . . . . . 4,611 229 26 333 310 5,509
Flufenacet 16,607 2,877 . . . . . . . . . 19,484
Flufenacet/pendimethalin 379,132 85,593 23,614 59 . . . . . . . 488,398
Flupyrsulfuron-methyl 1,046 497 . 9 1 . . . . . . 1,553
Fluroxypyr 65,258 11,510 23,845 4,189 52 902 . . . . . 105,757
Glyphosate 843,343 171,441 294,611 52,144 11,355 7,151 520,517 22,208 62,630 40,719 124,475 66,918 2,217,512
Imazamox/pendimethalin . . . . . . . . 27,758 52,375 . 80,133
Iodosulfuron-methyl-sodium/mesosulfuron-methyl 9,863 20 2 . 88 19 . . . . . 9,993
Lenacil . . . . . . . . . . 9,607 9,607
Linuron . . . . . . . . 60,053 2,421 7,822 . 70,295
Page 74
71
Table 6 (cont.) Usage of pesticides on arable crops grown in the United Kingdom, 2016 (kg of active substances applied)
Wheat Winter
barley
Spring
barley
Oats Rye Triticale Oilseed
rape
Linseed All
potatoes
Peas Beans Sugar
beet
All
crops
Herbicides & desiccants (cont.)
MCPA 27,259 792 12,103 7,224 906 168 . . 59 . 34 42 48,585
Mecoprop-P 90,549 19,212 102,223 20,194 1,050 498 . . . . . 233,725
Metamitron . . . . . . . . . . 90,779 90,779
Metazachlor . . . . . . 71,328 699 . . . 72,027
Metazachlor/quinmerac . . . . . . 84,794 . . . . 84,794
Metribuzin . . . . . . . . 33,362 . . . 33,362
Metsulfuron-methyl 854 155 288 56 . 12 . 27 . . . 1,392
Metsulfuron-methyl/thifensulfuron-methyl 4,250 1,082 9,034 159 . . . . . . . 14,524
Metsulfuron-methyl/tribenuron-methyl 1,538 440 1,358 208 77 47 . . . . . 3,667
Pendimethalin 316,625 73,890 45,021 834 10,145 3,368 . . 27,013 12,437 79,534 . 568,868
Pendimethalin/picolinafen 138,141 59,562 34,972 1,472 . 97 . . . . . 234,242
Pinoxaden 2,193 5,019 7,657 <1 . . . . . . . 14,871
Propaquizafop . . . . . . 16,122 360 300 623 1,133 1,083 19,620
Propyzamide . . . . . . 179,287 . . 19,736 . 199,023
Prosulfocarb 562,227 92,524 20,570 . 907 . . . 94,960 . 25,094 . 796,281
Quizalofop-P-tefuryl . . . . . . 1,794 84 . 82 26 1,985
Thifensulfuron-methyl/tribenuron-methyl 943 325 1,854 457 . 14 . . . . . 3,593
Tri-allate 538,412 81,839 24,237 . 1,744 . . 5,619 13,292 14,747 493 680,383
Tribenuron-methyl 271 74 122 77 10 . . . . . . 553
Triflusulfuron-methyl . . . . . . . . . . 933 933
Other herbicides1 92,870 36,875 34,811 3,143 32 19 59,044 3,285 26,138 29,473 11,220 114,122 411,033
All herbicides 3,477,829 715,724 711,665 104,556 29,951 13,547 1,376,189 39,988 418,459 153,928 415,395 313,139 7,770,375
1Other herbicides include 2,4-D, 2,4-D/glyphosate, 2,4-D/MCPA, 2,4-DB, 2,4-DB/MCPA, amidosulfuron, aminopyralid/metazachlor/picloram, bromoxynil, bromoxynil/diflufenican, bromoxynil/ioxynil, carfentrazone-
ethyl/flupyrsulfuron-methyl, carfentrazone-ethyl/mecoprop-p, chloridazon, chloridazon/metamitron, chlorotoluron/diflufenican, chlorotoluron/diflufenican/pendimethalin, clodinafop-propargyl/pinoxaden, clodinafop-
propargyl/prosulfocarb, clomazone/metazachlor, clomazone/metribuzin, clomazone/pendimethalin, clopyralid/florasulam, clopyralid/picloram, cycloxydim, desmedipham/ethofumesate/phenmedipham, desmedipham/phenmedipham, dicamba/MCPA/mecoprop-P, dichlorprop-P/MCPA/mecoprop-P, diflufenican/florasulam, diflufenican/flurtamone, diflufenican/Isoproturon, diflufenican/metsulfuron-methyl,
diflufenican/pendimethalin, dimethachlor, dimethenamid-p/metazachlor, ethametsulfuron-methyl, ethofumesate, ethofumesate/metamitron, ethofumesate/metamitron/phenmedipham, ethofumesate/phenmedipham,
florasulam/tribenuron-methyl, flufenacet/metribuzin, flufenacet/picolinafen, flumioxazine, flupyrsulfuron-methyl/pyroxsulam, flupyrsulfuron-methyl/thifensulfuron-methyl, fluroxypyr/halauxifen-methyl, fluroxypyr/triclopyr, glyphosate/pyraflufen-ethyl, imazamox/metazachlor, imazamox/metazachlor/quinmerac, iodosulfuron-methyl-sodium, Isoproturon, lenacil/triflusulfuron-methyl, MCPB, mesotrione, metobromuron, napropamide,
pendimethalin/pyroxsulam, phenmedipham, picolinafen, propoxycarbazone-sodium, pyridate, pyraflufen-ethyl, quizalofop-p-ethyl, rimsulfuron, S-metolachlor, sulfosulfuron, tepraloxydim, thifensulfuron-methyl, thifensulfuron-
methyl/tribenuron methyl and unspecified herbicides.
Page 75
72
Table 6 (cont.) Usage of pesticides on arable crops grown in the United Kingdom, 2016 (kg of active substances applied)
Wheat Winter
barley
Spring
barley
Oats Rye Triticale Oilseed
rape
Linseed All
potatoes
Peas Beans Sugar
beet
All
crops
Insecticides & nematicides
Alpha-cypermethrin 137 31 3 15 . . 488 . 5 4 . 683
Cypermethrin 9,442 2,314 226 347 145 57 7,113 82 47 160 851 . 20,784
Esfenvalerate 374 122 60 <1 <1 . . . 142 3 92 . 792
Lambda-cyhalothrin 3,290 636 535 180 52 38 4,044 42 461 342 1,555 92 11,267
Pirimicarb 327 178 . . . . 183 . 432 2,888 3,078 63 7,148
Tau-fluvalinate 668 233 58 . 13 . 7,636 . . 70 . 8,678
Thiacloprid 74 . . . . . 2,281 . 2,636 478 . 622 6,092
Zeta-cypermethrin 642 151 175 69 23 16 757 32 6 127 277 . 2,276 1Other insecticides & nematicides 12,645 29 606 117 1,991 101,759 10 85 2,420 119,663
All insecticides & nematicides 27,598 3,694 1,663 728 233 112 24,493 157 105,482 4,012 6,012 3,197 177,381
Molluscicides & repellents
Ferric phosphate 12,075 547 340 14 48 . 5,838 . 4,586 . . 161 23,608
Metaldehyde 64,953 4,709 1,684 279 563 119 47,660 115 14,320 666 75 543 135,684
Other molluscicides & repellents2 211 852 85 1,147
All molluscicides & repellents 77,239 5,256 2,023 292 610 119 54,349 115 18,991 666 75 704 160,439
Sulphur 27,947 794 29,266 219 . . 17,784 . 445 2,725 14,490 . 93,669
Other physical controls
Garlic . . . . . . . 71 . . . 71
1 Other insecticides and nematicides include acetamiprid, beta-cyfluthrin, chlorpyrifos, deltamethrin, dimethoate, ethoprophos, flonicamid, fosthiazate, indoxacarb, oxamyl, pymetrozine, rotenone, thiamethoxam and unspecified
insecticides 2Other molluscicides & repellents include methiocarb and unspecified molluscicides.
Page 76
73
Table 6 (cont.) Usage of pesticides on arable crops grown in the United Kingdom, 2016 (kg of active substances applied)
Wheat Winter
barley
Spring
barley
Oats Rye Triticale Oilseed
rape
Linseed All
potatoes
Peas Beans Sugar
beet
All
crops
Growth regulators
2-chloroethylphosphonic acid 8,794 8,852 4,958 . 134 6 . . . . . 22,744
2-chloroethylphosphonic acid/mepiquat 22,427 19,584 9,916 8 3,956 2,712 . . . . . 58,603
Chlormequat 1,804,577 288,393 64,458 75,882 21,533 8,846 . 112 . . . 2,263,801
Chlormequat/imazaquin 75,245 . . . 57 . . . . . . 75,302
Mepiquat chloride/prohexadione-calcium 20,923 10,198 5,164 2,703 641 269 . . . . . 39,898
Prohexadione-calcium/trinexapac-ethyl 1,280 334 20 25 48 28 . . . . . 1,736
Trinexapac-ethyl 41,121 9,066 3,050 1,963 733 111 1 . . . . 56,044
Other growth regulators1 34,251 10,946 7,633 79 8,923 58,738 120,569
All growth regulators 2,008,618 347,372 95,199 80,580 27,102 12,050 8,924 112 58,738 2,638,696
1Other growth regulators include 2-chloroethylphosphonic acid/mepiquat chloride, chlormequat chloride, chlormequat chloride/2-chloroethylphosphonic acid, chlormequat chloride/2-chloroethylphosphonic acid/mepiquat
chloride, chlormequat/2-chloroethylphosphonic acid, maleic hydrazide, mepiquat chloride/metconazole and unspecified growth regulators.
Page 77
74
Table 6 (cont.) Usage of pesticides on arable crops grown in the United Kingdom, 2016 (kg of active substances applied)
Wheat Winter
barley
Spring
barley
Oats Rye Triticale Oilseed
rape
Linseed All
potatoes
Peas Beans Sugar
beet
All
crops
Seed treatments
Fungicide seed treatments
Fludioxonil 1,145 98 265 111 9 2 . . 57 . . . 1,686
Fluopyram/prothioconazole/tebuconazole . 1,204 3,231 . . . . . . . . 4,436
Fluquinconazole/prochloraz 10,836 497 . . . . . . . . . 11,333
Hymexazol . . . . . . . . . . 1,680 1,680
Prochloraz/thiram . . . . . . 8,713 . . . . 8,713
Prochloraz/triticonazole 7,276 2,806 6,852 765 62 3 . . . . . 17,764
Prothioconazole 3,739 572 416 217 . 21 . . . . . 4,965
Prothioconazole/tebuconazole 2,124 110 298 193 . . . . . . . 2,724
Silthiofam 4,462 502 . . . . . . . . . 4,964
Tebuconazole . 2 . . . . . . . . . 2
Thiram . . . . . . 595 . 2,686 220 107 3,608
Fungicide/insecticide seed treatments
Clothianidin/prothioconazole 72,487 10,218 1,208 1,716 99 88 . . . . . 85,814
Insecticide seed treatments
Clothianidin 4,172 2,246 . 22 . . . . . . . 6,440
Unspecified seed treatments1
Other seed treatments2 10,354 2,067 1,964 356 6 431 39 31,744 2,063 142 3,398 52,565
All seed treatments 116,595 20,321 14,234 3,380 176 113 9,740 39 31,801 4,749 362 5,185 206,694
1There is no weight associated with unspecified seed treatments
2Other seed treatments include beta-cyfluthrin/clothianidin, carboxin/thiram, cymoxanil/fludioxonil/metalaxyl-M, difenoconazole/fludioxonil, difenoconazole/fludioxonil/tebuconazole, fludioxonil/metalaxyl-m/thiamethoxam,
fludioxonil/tefluthrin, fluquinconazole, flutolanil, imazalil, imazalil/ipconazole, imazalil/pencycuron, imazalil/thiabendazole, imidacloprid, ipconazole, methiocarb, pencycuron, prochloraz, tefluthrin, thiamethoxam, unspecified growth promoters and zinc ammonium.
Page 78
75
Table 7 Estimated area (ha) of application of the fifty most extensively-used active substances on all arable crops surveyed in 2016 in the
United Kingdom (excluding seed treatments)
Active substance Area treated 2016 (ha) Area treated 2014 (ha) % change on 2014 Movement
1 Chlorothalonil 4,494,175 3,686,182 22 2 Prothioconazole 4,216,893 4,287,365 -2
3 Tebuconazole 3,393,146 3,586,686 -5
4 Epoxiconazole 3,224,771 3,783,353 -15
5 Chlormequat 2,877,710 3,049,229 -6
6 Glyphosate 2,613,343 2,099,259 24
7 Diflufenican 2,391,128 2,298,974 4 8 Flufenacet 2,091,902 1,803,104 16
9 Lambda-cyhalothrin 1,944,997 1,494,737 30 10 Trinexapac-ethyl 1,804,131 1,550,525 16
11 Pendimethalin 1,567,918 1,431,714 10
12 Fluxapyroxad 1,540,541 1,100,162 40
13 Fluroxypyr 1,293,286 1,187,401 9 14 Metaldehyde 1,223,746 920,317 33
15 Bixafen 1,184,787 1,167,682 1
16 Metsulfuron-methyl 1,138,599 1,055,465 8
17 Cyproconazole 927,576 1,214,206 -24
18 Pyraclostrobin 884,063 988,504 -11
19 Cypermethrin 867,213 1,135,462 -24
20 Iodosulfuron-methyl-sodium 825,915 999,493 -17
21 Cymoxanil 788,907 694,159 14
22 Penthiopyrad 786,745 573,332 37
23 Mesosulfuron-methyl 756,500 887,037 -15
24 Azoxystrobin 749,345 914,909 -18
25 Florasulam 663,603 683,428 -3
26 Spiroxamine 652,454 711,931 -8
27 Mancozeb 646,116 666,922 -3
28 Trifloxystrobin 640,922 584,651 10
29 Thifensulfuron-methyl 615,245 599,578 3
30 Fenpropimorph 604,122 771,253 -22
31 Tribenuron-methyl 594,377 531,370 12
32 Metconazole 591,215 1,033,903 -43
33 Prochloraz 580,434 684,227 -15
34 Fluoxastrobin 565,037 560,538 1
35 Fluazinam 536,633 387,234 39
36 Mecoprop-P 482,712 679,121 -29
37 Boscalid 475,052 724,495 -34
38 Pinoxaden 439,333 506,361 -13
39 Prosulfocarb 436,525 280,246 56
40 Propyzamide 430,752 424,310 2
41 Metazachlor 424,433 557,479 -24
42 Isopyrazam 408,582 401,236 2
43 2-chloroethylphosphonic acid 402,088 511,131 -21
44 Flurtamone 387,751 273,354 42
45 Prohexadione-calcium 349,995 318,623 10
46 Propaquizafop 347,348 381,042 -9
47 Mepiquat chloride 344,299 439,261 -22
48 Propiconazole 322,802 517,373 -38
49 Picoxystrobin 311,777 199,896 56
50 Diquat 305,148 287,178 6
Page 79
76
Table 8 Estimated amount (tonnes) of the 50 active substances, used most by weight, on all arable crops surveyed in 2016 in the United
Kingdom (excluding seed treatments)
Active substance Amount used 2016 (t) Amount used 2014 (t) % change on 2014 Movement
1 Chlormequat 2,388,776 -2
2 Glyphosate 2,221,505 1,766,770 26 3 Chlorothalonil 2,055,854 1,612,575 27
4 Pendimethalin 1,344,470 1,210,847 11
5 Prosulfocarb 831,063 572,533 45 6 Mancozeb 804,668 754,506 7
7 Tri-allate 680,383 310,286 119 8 Prothioconazole 409,908 418,682 -2
9 Tebuconazole 398,701 385,366 3 10 Flufenacet 381,410 329,720 16
11 Propyzamide 334,406 326,995 2
12 Mecoprop-P 287,776 365,257 -21
13 Metazachlor 225,640 305,094 -26
14 Epoxiconazole 209,792 226,686 -7
15 Propamocarb hydrochloride 192,778 200,704 -4
16 Fluroxypyr 142,316 135,156 5 17 Metaldehyde 135,684 112,124 21
18 Folpet 135,651 154,491 -12
19 Diflufenican 134,059 124,590 8
20 Fenpropimorph 123,974 142,816 -13
21 Diquat 123,928 114,482 8 22 Prochloraz 121,386 129,768 -6
23 Spiroxamine 118,342 131,672 -10
24 Metamitron 109,539 162,629 -33
25 Carbetamide 103,360 129,448 -20
26 Linuron 102,582 76,224 35 27 Penthiopyrad 98,548 75,799 30 28 Azoxystrobin 96,585 112,187 -14
29 Sulphur 93,669 60,706 54 30 Fluxapyroxad 93,195 68,812 35
31 Fluazinam 87,076 67,150 30 32 Boscalid 79,156 129,685 -39
33 Cymoxanil 75,113 62,220 21
34 Dimethenamid-P 69,135 105,628 -35
35 Pyraclostrobin 68,432 73,551 -7
36 Bixafen 67,443 69,052 -2
37 Maleic hydrazide 58,738 69,410 -15
38 MCPA 57,435 94,108 -39
39 Trinexapac-ethyl 57,085 50,176 14 40 2-chloroethylphosphonic acid 55,303 80,245 -31
41 Quinmerac 49,521 66,221 -25
42 Fosthiazate 49,149 34,305 43
43 Cyproconazole 46,854 59,357 -21
44 Cyprodinil 46,451 55,700 -17
45 Mepiquat chloride 45,238 60,730 -26
46 Bentazone 45,154 40,505 11 47 Ethoprophos 43,247 9,082 376
48 Trifloxystrobin 39,783 39,249 1 49 Mepiquat 38,854 45,431 -14
50 Flurtamone 38,692 28,067 38
Page 80
77
Table 9 Pesticides recorded at a significant level in the United Kingdom in 2016 but not in 2014
Active substance Area treated 2016 (ha) Amount used 2016 (t)
1 Paclobutrazol 15,429 523
2 Metobromuron 11,392 12,743
3 Halauxifen-methyl 5,734 28
4 Rotenone 337 114
5 Ethametsulfuron-methyl 134 2
Table 10 Major increases in the use of individual active substances on arable crops in the United Kingdom since 2016 (area treated- ha)
Active substance Area treated 2016 (ha) Area treated 2014 (ha) % change on 2014
1 Sulfosulfuron 6,476 351 1,746
2 Triclopyr 58 8 637
3 Ethoprophos 7,736 1,211 539
4 Isoproturon 962 308 212
5 Dimoxystrobin 52,308 17,688 196
6 Zoxamide 52,516 18,961 177
7 Aminopyralid 172,022 65,460 163
8 Acetamiprid 6,986 2,777 152
9 Ferric phosphate 186,208 74,426 150
10 2,4-D 13,619 5,696 139
11 Tri-allate 304,396 135,029 125
12 Propoxycarbazone-sodium 72 32 125
13 MCPB 23,448 12,724 84
14 Amisulbrom 46,021 26,180 76
15 Thiacloprid 75,393 43,103 75
16 Pyraflufen-ethyl 3,917 2,260 73
17 Pymetrozine 30,921 18,314 69
18 Mesotrione 4,536 2,708 68
19 Cyflufenamid 81,936 49,385 66
20 Picoxystrobin 311,777 199,896 56
Table 11 Major decreases in the use of individual active substances on arable crops in the United Kingdom since 2014 (area treated- ha)
Active substance Area treated 2016 (ha) Area treated 2014 (ha) % change on 2014
1 Carbendazim 1,366 281,457 -100
2 Flusilazole 3,939 304,575 -99
3 Methiocarb 9,767 106,165 -91
4 Dimethoate 307 3,112 -90
5 Ioxynil 12,767 109,097 -88
6 Pencycuron 1,898 13,729 -86
7 S-metolachlor 497 3,495 -86
8 Pyridate 102 691 -85
9 Chlorotoluron 28,516 178,366 -84
10 Oxamyl 5,295 28,162 -81
11 Alpha-cypermethrin 57,873 257,973 -78
12 Tepraloxydim 33,804 132,507 -74
13 Quinoxyfen 1,808 5,917 -69
14 Chlorpyrifos 21,690 57,513 -62
15 Famoxadone 24,302 63,990 -62
16 Flutriafol 8,056 19,565 -59
17 Iprodione 11,926 28,615 -58
18 Thiamethoxam 2,171 4,870 -55
19 Dichlorprop-P 9,513 20,895 -54
20 Flumioxazine 2,968 6,389 -54
Page 81
78
Table 12 – Comparison of pesticide usage in the United Kingdom between 2010 and 2016
2010 2012 2014 2016
Area
treated (ha)
Weight
applied (t)
Area
treated (ha)
Weight
applied (t)
Area
treated (ha)
Area
treated (ha)
Area
treated (ha)
Weight
applied (t)
Insecticides
Total - all insecticides1 3,807,619 222 4,800,960 252 4,084,765 194 3,785,202 128
Biological control agents . . . . . . . .
Sulphuric acid . . . . . . . .
Fungicides 17,701,996 4,565 20,252,722 5,061 20,540,899 5,441 19,985,893 5,684
Sulphur 39,971 107 33,732 119 29,167 61 33,828 94
Growth regulators 4,293,759 2,631 5,517,515 2,804 5,450,453 2,729 5,414,402 2,639
Herbicides & desiccants 14,077,040 6,252 14,940,062 6,619 15,757,137 7,048 16,069,663 7,770
Molluscicides & repellents 926,140 174 877,965 126 1,102,152 132 1,429,606 160
Nematicides 15,203 36 6,232 14 11,928 34 17,879 49
Seed treatments 4,531,578 223 4,744,969 192 4,406,781 200 4,076,797 207
Total - all registered pesticides 45,393,307 14,210 51,174,157 15,187 51,383,282 15,839 50,813,270 16,731
Area grown 4,160,983 4,310,390 4,259,083 4,190,628
1Includes oxamyl which has both insecticidal and nematicidal properties
Page 82
79
APPENDIX 2 – DEFINITIONS
a) 'Pesticide' is used throughout this report to include commercial formulations containing active substances
used as acaricides, biological control agents, defoliants, desiccants, fungicides, growth regulators, herbicides,
insecticides, molluscicides, nematicides or urea.
b) 'Treated area' is the gross area treated with a pesticide, including all repeat applications, some of which may
have been applied to the land in preparation for planting, or applied to the margins of the crop and thus may
appear as an inappropriate use on that crop.
c) Where quoted in the text or within figures, reasons for application are the grower's stated reasons for use of
that pesticide product on that crop and may not always seem entirely appropriate.
d) Where individual active substances are mentioned in the text, they are listed in descending order of use by
hectares treated.
e) Throughout all tables, “Other” refers to chemicals grouped together because they were applied to less than
0.1% of the total area treated with pesticides.
f) Throughout all tables, “.” indicates that there was no recorded usage.
g) The term “formulation(s)” used within the text is used here to describe either single active substances or
mixtures of active substances contained within an individual product. It does not refer to any of the solvents,
pH modifiers or adjuvants also contained within a product that contribute to its efficacy.
h) For the purposes of this survey arable crops include the following: wheat; winter barley; spring barley; oats;
rye; triticale; oilseed rape; linseed; flax; ware potatoes; seed potatoes; peas for harvesting dry; field beans, sugar
beet and other combinable crops including borage, hemp, lupins and poppies.
i) Pesticide applications included those applied prior to planting, or in some cases to crops that failed and were
subsequently re-planted, and as these are associated with that crop they may appear as inappropriate uses.
j) Within the seed treatment tables at the end of each crop section, unspecified or unknown seed treatments have
been excluded from the last column in order to express the known seed treatment areas as a proportion of the
total area of each crop grown. The increased area of unspecified seed treatments within this report has resulted
from the extraction of data directly from farm management software reports where seed treatment information
has not been included.
k) The average number of applications indicated in the text for each crop, e.g. page 7, is based on the occurrence
of a chemical group on at least 10% of the area grown (Table 3). Within tables 4a, b and c, the average number
of applications is calculated only on the areas using each chemical group and therefore the minimum number of
applications is always going to be 1.
Page 83
80
APPENDIX 3 – METHODOLOGY
METHODS
The samples of holdings to be surveyed were selected using data from the Agricultural Census Returns, June
2015 for England & Wales (Anon., 2016a, 2016b), for Scotland (Anon., 2016c) and Northern Ireland (Anon,
2016d).
The samples were drawn from the census returns so as to represent the area of all arable crops grown throughout
England, Scotland, Wales and Northern Ireland. For England the sample was selected within each of the eight
Government Office Regions (GOR’s), the Welsh Assembly Government provided a further sample, which
represented the area grown in Wales, and for Scotland the country was divided into 11 land-use regions (Wood,
1931).
For the purposes of this survey the total area of arable farm crops was taken as the sum of the areas of the
following crops: wheat; winter barley; spring barley; oats; rye; triticale; oilseed rape; linseed; ware potatoes;
seed potatoes; peas for harvesting dry; field beans and sugar beet. A number of minor combinable crops were
encountered in the survey, including borage, echium, hemp, lupins, millet and quinoa. Together the minor crops
accounted for 0.45 % of the total arable area grown in the United Kingdom and data relating to these crops are
not presented in this report.
The samples were stratified according to the total area of all arable crops grown in each region and by farm size
group based on the total area of arable crops on each farm. The area of arable crops sampled in each size group
and each region was proportional to the total area of arable crops grown on holdings of each size group in each
region. All three survey teams followed the same methodology for data collection and used the same forms and
instructions for their completion. The size groups, based on the total arable area are as follows: <50ha (A); >50-
<=100 ha (B); >100-<=150 ha (C); >150-<=250 ha (D); >250-<=500 ha (E) and >500 ha (F).
The 2016 arable survey is the third survey for which the majority of data for holdings in England & Wales were
obtained electronically from a commercial research company, GfK Kynetec, who have a long history (over 20
years) of managing arable farm pesticide usage surveys. As part of the agreement with GfK Kynetec and as part
of the Long Term Service Agreement (LTSA) that Fera had in place with the Health & Safety Executive (HSE)
during the period of the survey, they provide data to Fera on pesticide usage for the arable survey. The GfK
Kynetec survey has a large (over 1,100 farms in England & Wales) existing panel of farmers who provide data
on their arable pesticide usage annually, by not only completing farm record books, but also by speaking to an
interviewer twice during the season. A final phone call at the end of the season ensures that any additional data
are collected.
The main benefit to this approach is that the burden on the farming community is reduced and 600 farms that
would have been contacted as part of the previous Fera pesticide usage survey programme now no longer have
to be contacted. It also contributes to the requirements of the UK Statistics Authority Code of Practice for
Official Statistics in that it enables a proportionate burden to be placed on those providing the data.
Fera subject all data, including data obtained from GfK Kynetec, Scotland & Northern Ireland, to the same
detailed and rigorous checks as they have to those collected previously by the England & Wales survey team.
Data were collected from 1,246 holdings throughout the United Kingdom in 2016. In order to ensure that the
sample was fully representative, in addition to data collected on 600 holdings (a stratified sample of the 1,100
holdings available) by GfK Kynetec an additional sample of 141 larger arable holdings (>250 hectares) within
England & Wales were also collected. A total of 221 arable farms were initially contacted to provide this
supplementary data, of these, 22 (10%) were unwilling to help with the survey. Data from 288 holdings in
Scotland and 217 holdings in Northern Ireland were also provided by SASA and AFBI respectively.
One of the requirements placed on growers by their customers is the membership of farm assurance schemes.
These schemes require detailed pesticide records (computer based or hand written) which ensure traceability and
Page 84
81
can be examined by crop assurance auditors at any time, but normally at least once each year. These records are
used extensively by those collecting pesticide data.
Of the 1,029 holdings visited in Great Britain (no data were available from Northern Ireland) and where
information was available (872 holdings), 98% were members of one or more crop assurance schemes.
However, in terms of area grown, farms with a crop assurance scheme accounted for 99% of the total area
surveyed. Sixteen of the holdings (2%) were registered organic on all or part of their farm.
Commercial farm management software and in-house electronic record keeping systems are now used
extensively, these combined with spray books and agronomists’ recommendation sheets provide the main
sources of data used by surveyors on farm. Where information was available (141 larger holdings, size groups
E & F, in England), electronic record keeping was used by 95% of the holdings contacted in England, with these
records accounting for 97% of the total pesticide-treated area. Paper based record keeping accounted for the
remainder.
The use of electronic data is now vitally important to maintain accuracy of data collection and reducing the
burden on farmers and growers. In total, electronic downloads, normally in the form of CSV files, accounted
for over 99% of the number of rows of data collected in England (total 136,043 rows of data). All data from
GfK, and the Scotland & Northern Ireland survey teams were received electronically.
The Questionnaire
For some of the farms in England & Wales and all of the farms in Scotland & Northern Ireland the questionnaire
for the main part of the survey consisted of two forms, which were completed during an interview with the
grower.
Form 1 summarised the areas of arable crops grown on the designated holding during the 2015/2016 season
(autumn 2015 through to harvest in 2016).
Form 2 dealt with all aspects of pesticide usage on the individual crops grown on the holding and harvested in
2016, a separate form being used for each field/crop combination. These included pesticides applied prior to
planting, or in some cases to crops that failed and were subsequently re-planted, as these are associated with that
crop they may appear as inappropriate uses. Certain agronomic details that may have influenced pesticide usage
(including drilling methods, sowing & harvest times, use of adjuvants and the volume of spray applied) were
also recorded on form 2.
The data supplied by GfK Kynetec were derived from the farm spray books provided to their participating
farmers and these books meet the same requirements and contain the same level of detail as the forms used by
each of the survey teams in England, Wales, Scotland and Northern Ireland.
Raising factors
The pesticide usage data collected from each holding were raised by a ratio of two factors to give an estimate of
regional usage using a standard ratio raising statistical technique; the first factor being dependent on farm size
group and region (see Appendix 5) and the second dependent on crop area and region. The data were further
adjusted by a third factor to compensate for regions in which specific crops were not sampled and to make
estimates of total pesticide usage related to the national cropping areas in the United Kingdom (Thomas, 1999).
The raising factors were based on the areas of arable crops grown and harvested in 2016 as recorded in the June
Survey of Agriculture and Horticulture for England & Wales (Anon., 2017a, b), Scotland (Anon., 2017c) and
Northern Ireland (Anon., 2017d).
Page 85
82
Rounding
Due to rounding of figures, the sum of constituent items in the tables may not agree exactly with the totals
shown.
Error checking
Extensive checks are made on the data before, at the time of and following data entry. Data checking routines
are used to verify the authenticity of the data collected including: the approval status of all crop/pesticide
combinations; high and low rates of application; the methods of application used to apply pesticides; crop
growth stages at the time of application; the timing of pesticide applications and consistency within a tank mix.
Further checks are made on the integrity of the relational database used to store the raw data collected ensuring
that links to product databases are in place prior to the production of the report. The product databases used for
the pesticide usage surveys are maintained alongside the commercial product database, LIAISON, which is used
extensively by agronomists and the major farm management software companies.
Where inconsistencies are found, for example where there are high rates of application or non-approved product
usage, these are checked first against the farm records and secondly with the grower and amended if necessary.
Reports are written and checked within the team after which they are sent to reviewers within the Working Party
on Pesticide Usage Surveys for their comments and checking.
The final report is pre-announced and published via the ONS Publication Hub and the Fera website in line with
the Code of Practice for Official Statistics.
Data limitations and use of data
Our experience (Fera, SASA, AFBI & GfK) has shown that the face to face interview and ‘main contact plus
reserves approach’ delivers the highest quality data and minimises non-response bias; no other approach is
likely to yield fit for purpose data to meet the quality requirements of the UKSA Code of Practice for Official
Statistics. Drawing a fresh stratified random sample each year is clearly an appropriate survey methodology.
As part of this survey Fera has implemented the UK Statistics Authority Code of Practice for Official Statistics,
published in 2009. Whilst all eight principles apply, we acknowledge in particular, the following:
• Integrity – in particular that, statistical reports must be issued separately from other statements or comments
about the figures, that the public interest prevails.
• Confidentiality – the identity of individuals or their information is not revealed, information is kept secure
and respondents are informed how their confidentiality will be protected.
• Proportionate burden - seeking participation through informed consent.
• Accessibility – to all users, providing information on the quality and reliability of the statistics, adopting
formats that enhance clarity and consistency, disseminate in formats that encourage analysis and re-use.
In accordance with UKSA Code of Practice for Official Statistics, we work with Defra & HSE statisticians to
build on our existing extensive and effective relationships with users of the surveys to further enhance user
engagement. There are a broad spectrum of users and stakeholders across policy, research, agricultural supply
industry (including consultancies), farming and horticultural businesses, NGOs and members of the public. Over
the years we have an excellent record of listening to our users and incorporating their feedback into the way we
collect and report our statistics.
Page 86
83
A review has been conducted of the statistical validity of collecting independent annual samples, as is Fera’s
standard practice, versus sampling from a panel, as is GFK’s approach. The review, conducted by Fera and
submitted to HSE, concluded that there is no particular reason why moving from taking a sample each year to
sampling from a panel should require any change in the method used to estimate the quantity of pesticides used
and their standard errors as long as certain assumptions hold (see the link below).
The full review is available at https://secure.fera.defra.gov.uk/pusstats/surveys/documents/pesticideAnalysis.pdf
Page 87
84
APPENDIX 4 – ARABLE STANDARD ERRORS
Analysis of pesticide usage survey
The aim of the analysis of the results was to provide an estimate of the pesticide usage associated with by crop
type within each region and nationally.
Estimates are derived from pesticide usage survey data which are stratified by region and holding size within
each crop type. The survey reports the mass of pesticide applied and the area to which it is applied. The survey
information is combined with the total cultivated area within each stratum to provide an estimate of the total
mass of pesticide used on that crop type by region and nationally, and of the area sprayed. Each estimate (E) is
provided with a standard error (se). In general we expect, with approximately 95% confidence, that the true
quantity of pesticide used will lie within the interval:
Estimation method
We are provided with information about holdings in J regions. Holdings are assigned one of K size classes. L
holdings are surveyed within each stratum (j,k). In addition the total area and number of holdings in each
stratum from which samples have been taken is reported. Hence, we are given:
: the total area of the stratum (in holdings of size class k, in region j)
: the total number of holdings in the stratum
: number of holdings surveyed within the stratum
: area of each holding surveyed within the stratum
: area of each holding sprayed within the surveyed stratum
: mass of pesticide applied to each holding in the surveyed stratum
Then we estimate:
: mean area sprayed per area surveyed within the stratum
: mean mass applied per area surveyed within the stratum
: the between-holding standard deviation of the area sprayed per area surveyed within the stratum
: the between holding standard deviation of the mass sprayed per area surveyed within the stratum
: estimated total area sprayed in a region
: standard error of estimated total area sprayed in a region
: estimated total mass applied in a region
: standard error of estimated total mass applied in a region
: estimated total area sprayed nationally
: standard error of estimated total area sprayed nationally
: estimated total mass applied nationally
: standard error of estimated total mass applied nationally
Page 88
85
Estimates are provided using the following formulas
Estimators
Equation 1
Equation 2
Equation 3
Equation 4
Equation 5
Equation 6
Equation 7
Equation 8
Equation 9
Equation 10
Equation 11
Equation 12
Equation 13
Equation 14
Page 89
86
Standard errors , , and are estimated by a first order Taylor approximation [1] (Equations
9,10,13,14) with a finite population correction [2] (Equations 9 and 10)
95% confidence intervals for estimates , , and as estimated as mean±1.96×standard error.
Estimates of use derived from this survey were based on a stratification by region only because of a number of
strata (region and size) which contained no holdings or a low number of holdings (less than 5). One survey entry
for potatoes in Northern Ireland and one from Scotland each with a crop area of zero was removed from the
data. Estimates of the use of pesticides on sugar beet and potatoes in Wales each based on a survey of a single
holding were not included in the estimates. Upper and lower confidence intervals were not reported where the
relative standard error was estimated to be larger than 30%
Estimates of area of application and mass applied by crop (including the total for all arable crops) and region are
provided in Tables 1 and 2. Estimates of the total area of application and mass applied for each crop and for all
arable crops are given in tables 3 and 4.
Assumptions
1) The survey is unbiased. This means that there is no correlation between the use of pesticides on the
holding and the probability of holdings being included or excluded from a survey. The simplest way of
achieving this is to sample holdings at random from the population of holdings within a stratum.
2) Samples are not correlated between strata. This means that if by chance the holdings sampled from one
stratum have a higher average pesticide use than the population within the stratum, then this provides
no information about the relation between samples and populations in other strata.
3) The values of number of holdings per strata are correct.
4) The size of the potential error in estimates of the total area of holdings [se(H)] within each stratum is
small compared with the standard error of the estimates for the ratios “mean area sprayed per area
surveyed within the stratum” and “mean mass applied per area surveyed within the stratum” [se(R)].
For uncorrelated errors “small” might mean rse(H)<0.3×rse(R)3
5) The error associated with estimates , , , and is assumed to be described by a normal
distribution
Independent annual samples v sampling from a panel
There is no particular reason why moving from taking a sample each year to sampling from a panel should
require any change in the method used to estimate the quantity of pesticides used and their standard errors as
long as assumptions 1 to 4 continue to hold.
The survey company has indicated that it is possible that farms that have a very low use of products, such as
organic farms, may decline to take part in surveys more often than other farms. We don’t know whether this is a
particular issue with their panel surveys, other whether it has an appreciable effect.
1 BIPM, (2008). Evaluation of measurement data — Guide to the expression of uncertainty in
measurement, JCGM 100:2008
2 Isserlis, L. (1918). "On the value of a mean as calculated from a sample". Journal of the Royal
Statistical Society. 81 (1): 75–81. 3 If given estimates of relative standard errors (rse) rse(R)=1 and rse(H)=0.3 then rse(R.H)=1.04
Page 90
87
Table 1: Estimates of area of application by crop and region
Crop Region Total area
Number of
holdings
Number of
holdings
surveyed
Estimate
(Ha) s.e (Ha) RSE (%) 95% C.I. (Ha)
sugar beet East Midlands 19964 940 32 201154 11897 5.9 177836 224471
sugar beet Eastern 53618 2123 65 614491 26172 4.3 563193 665789
sugar beet Yorks. & the Humber 6407 466 4 48670 8597 17.7 31819 65520
potatoes ware East Midlands 662 256 18 16109 1474 9.2 13220 18998
potatoes ware Eastern 4449 477 24 102803 7376 7.2 88346 117260
potatoes ware London & SE 342 75 2 8340 548 6.6 7267 9414
potatoes ware North East 100 27 2 2050 1030 50.2 NA NA
potatoes ware North West 759 264 2 17197 896 5.2 15440 18953
potatoes ware Northern Ireland 3374 454 40 52165 2280 4.4 47697 56634
potatoes ware Scotland 14766 1680 46 322905 10292 3.2 302732 343078
potatoes ware South West 1462 273 6 36469 4959 13.6 26749 46188
potatoes ware West Midlands 1493 284 9 42218 3633 8.6 35097 49340
potatoes ware Yorks. & the Humber 936 288 11 23396 1475 6.3 20504 26287
oilseed rape East Midlands 139411 2964 116 1540971 38296 2.5 1465910 1616031
oilseed rape Eastern 129945 3171 123 1420690 43553 3.1 1335327 1506053
oilseed rape London & SE 71462 1577 63 842028 36128 4.3 771216 912839
oilseed rape North East 23506 735 22 168049 16118 9.6 136457 199641
oilseed rape North West 4963 256 4 35791 10940 30.6 NA NA
oilseed rape Northern Ireland 552 45 13 3093 349 11.3 2410 3777
oilseed rape Scotland 30141 1036 78 246889 8192 3.3 230832 262946
oilseed rape South West 50134 1515 43 530276 25010 4.7 481257 579295
oilseed rape Wales 5080 154 2 53642 1386 2.6 50925 56360
oilseed rape West Midlands 49075 1716 41 377540 27725 7.3 323199 431881
oilseed rape Yorks. & the Humber 74309 2431 71 714277 31258 4.4 653011 775543
winter barley East Midlands 49331 1932 58 493895 20327 4.1 454053 533736
winter barley Eastern 89775 2846 108 906984 27273 3.0 853528 960440
winter barley London & SE 36415 1225 51 397801 17711 4.5 363087 432515
winter barley North East 28748 1019 26 213559 14905 7.0 184345 242774
winter barley North West 16383 1052 13 128976 7798 6.0 113692 144259
winter barley Northern Ireland 7628 691 133 62937 1826 2.9 59357 66517
winter barley Scotland 48030 2009 96 493494 13602 2.8 466834 520154
winter barley South West 48869 2607 48 522378 24523 4.7 474314 570443
winter barley Wales 8131 657 8 48972 3733 7.6 41654 56290
winter barley West Midlands 35087 1880 34 287798 14454 5.0 259467 316128
winter barley Yorks. & the Humber 71044 2953 76 626778 23594 3.8 580534 673022
Page 91
88
spring barley East Midlands 60087 2161 74 423167 17121 4.0 389610 456725
spring barley Eastern 89247 3079 98 582345 22761 3.9 537733 626958
spring barley London & SE 66092 1672 53 553684 27471 5.0 499842 607526
spring barley North East 12272 595 15 78680 8495 10.8 62029 95331
spring barley North West 24073 1556 14 103886 11074 10.7 82182 125591
spring barley Northern Ireland 14708 1608 162 93535 2854 3.1 87942 99129
spring barley Scotland 238900 7154 240 1417905 25712 1.8 1367509 1468301
spring barley South West 85290 3957 56 566163 28771 5.1 509773 622554
spring barley Wales 13758 1341 12 57125 3831 6.7 49616 64635
spring barley West Midlands 28499 1718 13 168667 16385 9.7 136552 200781
spring barley Yorks. & the Humber 50046 2507 47 331704 16829 5.1 298719 364688
wheat East Midlands 335039 4822 139 4644256 113327 2.4 4422134 4866378
wheat Eastern 467515 6250 187 6788693 134927 2.0 6524236 7053150
wheat London & SE 218759 3308 102 3220744 99149 3.1 3026413 3415076
wheat North East 67600 1290 29 770297 43110 5.6 685802 854793
wheat North West 37315 1438 10 317661 38108 12.0 242968 392353
wheat Northern Ireland 8616 659 119 83516 2513 3.0 78591 88441
wheat Scotland 109593 2846 171 1435902 28060 2.0 1380903 1490900
wheat South West 159035 4266 72 2029244 74732 3.7 1882769 2175719
wheat Wales 21411 623 8 183268 34112 18.6 116408 250128
wheat West Midlands 163494 3723 60 1907170 63358 3.3 1782988 2031353
wheat Yorks. & the Humber 234960 4388 87 2829111 81426 2.9 2669517 2988705
all arable East Midlands 687630 5915 142 8151812 209381 2.6 7741424 8562199
all arable Eastern 970309 7515 196 11783584 259682 2.2 11274608 12292560
all arable London & SE 471418 4347 102 5741044 170953 3.0 5405976 6076112
all arable North East 148676 1633 31 1272118 85890 6.8 1103773 1440462
all arable North West 100998 2886 18 664732 76361 11.5 515065 814398
all arable Northern Ireland 37499 2467 213 312644 9086 2.9 294836 330452
all arable Scotland 494168 9373 278 4286591 106512 2.5 4077827 4495355
all arable South West 407582 7594 84 4203726 161382 3.8 3887417 4520035
all arable Wales 58526 2292 14 333717 30901 9.3 273151 394283
all arable West Midlands 337384 5072 61 3443346 173515 5.0 3103256 3783436
all arable Yorks. & the Humber 491387 5382 92 5115949 156742 3.1 4808735 5423162
Page 92
89
Table 2: Estimates of mass applied by crop and region
Crop Region Total area
Number of
holdings
Number of
holdings
surveyed
Estimate
(Kg) s.e (Kg) RSE (%) 95% C.I. (Kg)
sugar beet East Midlands 19964 940 32 70010 3861 5.5 62442 77579
sugar beet Eastern 53618 2123 65 209148 8955 4.3 191597 226698
sugar beet Yorks. & the Humber 6407 466 4 15971 1729 10.8 12582 19360
potatoes ware East Midlands 662 256 18 8828 885 10.0 7094 10562
potatoes ware Eastern 4449 477 24 71129 5380 7.6 60584 81675
potatoes ware London & SE 342 75 2 4166 369 8.8 3444 4888
potatoes ware North East 100 27 2 658 400 60.8 NA NA
potatoes ware North West 759 264 2 11853 108 0.9 11641 12066
potatoes ware Northern Ireland 3374 454 40 28797 1542 5.4 25775 31819
potatoes ware Scotland 14766 1680 46 155024 8732 5.6 137908 172140
potatoes ware South West 1462 273 6 17349 3336 19.2 10810 23888
potatoes ware West Midlands 1493 284 9 24721 2456 9.9 19906 29535
potatoes ware Yorks. & the Humber 936 288 11 13012 1381 10.6 10305 15719
oilseed rape East Midlands 139411 2964 116 459392 15602 3.4 428813 489972
oilseed rape Eastern 129945 3171 123 393179 13943 3.5 365852 420506
oilseed rape London & SE 71462 1577 63 249145 11999 4.8 225627 272663
oilseed rape North East 23506 735 22 52444 4505 8.6 43615 61273
oilseed rape North West 4963 256 4 10341 2372 22.9 5692 14990
oilseed rape Northern Ireland 552 45 13 1304 86 6.6 1135 1473
oilseed rape Scotland 30141 1036 78 82902 5599 6.8 71929 93875
oilseed rape South West 50134 1515 43 159259 9779 6.1 140093 178425
oilseed rape Wales 5080 154 2 16964 4611 27.2 7925 26002
oilseed rape West Midlands 49075 1716 41 109385 7805 7.1 94088 124683
oilseed rape Yorks. & the Humber 74309 2431 71 197706 9408 4.8 179266 216147
winter barley East Midlands 49331 1932 58 169171 10419 6.2 148749 189592
winter barley Eastern 89775 2846 108 316391 14929 4.7 287129 345653
winter barley London & SE 36415 1225 51 166034 10522 6.3 145410 186657
winter barley North East 28748 1019 26 74546 7107 9.5 60616 88476
winter barley North West 16383 1052 13 37099 5597 15.1 26129 48070
winter barley Northern Ireland 7628 691 133 21675 768 3.5 20170 23179
winter barley Scotland 48030 2009 96 164521 5008 3.0 154705 174337
winter barley South West 48869 2607 48 172527 10926 6.3 151113 193942
winter barley Wales 8131 657 8 14608 2057 14.1 10576 18640
winter barley West Midlands 35087 1880 34 82431 6362 7.7 69962 94900
winter barley Yorks. & the Humber 71044 2953 76 199549 11942 6.0 176142 222955
Page 93
90
spring barley East Midlands 60087 2161 74 117831 8445 7.2 101278 134384
spring barley Eastern 89247 3079 98 150463 10005 6.6 130853 170072
spring barley London & SE 66092 1672 53 174246 14651 8.4 145529 202963
spring barley North East 12272 595 15 18934 3042 16.1 12971 24896
spring barley North West 24073 1556 14 23918 4340 18.1 15410 32425
spring barley Northern Ireland 14708 1608 162 26810 1045 3.9 24762 28858
spring barley Scotland 238900 7154 240 408951 13129 3.2 383219 434683
spring barley South West 85290 3957 56 153109 10574 6.9 132384 173833
spring barley Wales 13758 1341 12 14079 2079 14.8 10004 18153
spring barley West Midlands 28499 1718 13 33528 6050 18.0 21670 45387
spring barley Yorks. & the Humber 50046 2507 47 76720 6969 9.1 63062 90379
wheat East Midlands 335039 4822 139 1731127 59899 3.5 1613726 1848528
wheat Eastern 467515 6250 187 2384258 63557 2.7 2259687 2508829
wheat London & SE 218759 3308 102 1159916 42459 3.7 1076696 1243135
wheat North East 67600 1290 29 259890 15647 6.0 229222 290557
wheat North West 37315 1438 10 119578 22959 19.2 74577 164578
wheat Northern Ireland 8616 659 119 26845 995 3.7 24896 28795
wheat Scotland 109593 2846 171 484602 9995 2.1 465012 504192
wheat South West 159035 4266 72 714957 35524 5.0 645329 784585
wheat Wales 21411 623 8 52743 11613 22.0 29981 75505
wheat West Midlands 163494 3723 60 606423 26352 4.3 554773 658073
wheat Yorks. & the Humber 234960 4388 87 938041 37739 4.0 864072 1012010
all arable East Midlands 687630 5915 142 2928419 102992 3.5 2726554 3130283
all arable Eastern 970309 7515 196 4212074 126521 3.0 3964093 4460055
all arable London & SE 471418 4347 102 2016527 68044 3.4 1883161 2149893
all arable North East 148676 1633 31 417886 30985 7.4 357155 478616
all arable North West 100998 2886 18 215613 41068 19.0 135121 296106
all arable Northern Ireland 37499 2467 213 117654 5347 4.5 107175 128133
all arable Scotland 494168 9373 278 1406510 47635 3.4 1313146 1499874
all arable South West 407582 7594 84 1407629 70184 5.0 1270067 1545190
all arable Wales 58526 2292 14 97990 12654 12.9 73188 122791
all arable West Midlands 337384 5072 61 1188888 98641 8.3 995551 1382225
all arable Yorks. & the Humber 491387 5382 92 1672116 73112 4.4 1528816 1815416
Page 94
91
Table 3: Estimates of total area of application for each crop
Crop Estimate (Ha) s.e (Ha) RSE(%) 95% C.I (Ha)
sugar beet 864315 30007 3.5 805501 923129
potatoes ware 623652 14486 2.3 595259 652044
oilseed rape 5933246 86536 1.5 5763635 6102858
winter barley 4183572 57645 1.4 4070588 4296557
spring barley 4376862 61839 1.4 4255658 4498066
wheat 24209861 249752 1.0 23720347 24699376
all arable 45309262 496800 1.1 44335535 46282989
Table 4: Estimates of total mass applied for each crop
Crop Estimate (Kg) s.e (Kg) RSE(%) 95% C.I (Kg)
sugar beet 295129 9904 3.4 275718 314540
potatoes ware 335538 11302 3.4 313386 357691
oilseed rape 1732021 30089 1.7 1673046 1790996
winter barley 1418551 29264 2.1 1361195 1475908
spring barley 1198588 28088 2.3 1143536 1253640
wheat 8478378 117552 1.4 8247977 8708780
all arable 15681304 237383 1.5 15216034 16146575
Page 95
92
APPENDIX 5 – FIRST RAISING FACTORS FOR ARABLE CROPS (2016)
Region/Country Farm size group rf1 Regional area (ha) Area surveyed (ha) Number of farms
visited
East Midlands A 107.03 59,791 559 16
B 54.94 78,290 1,425 19
C 25.77 78,087 3,031 25
D 22.27 131,588 5,909 31
E 17.00 173,511 10,208 30
F 7.14 166,363 23,300 21
Eastern A 79.05 68,039 861 25
B 43.95 105,409 2,398 31
C 34.47 122,224 3,546 29
D 24.90 198,848 7,987 40
E 22.11 260,365 11,777 35
F 7.00 215,424 30,757 36
London & South East A 178.92 46,952 262 8
B 79.30 52,624 664 9
C 56.09 55,515 990 8
D 22.15 96,424 4,354 23
E 11.15 126,661 11,364 35
F 5.31 93,242 17,574 20
North East A 345.53 17,985 52 *
B 53.59 26,919 502 7
C 32.36 27,470 849 7
D 13.89 26,165 1,884 9
E 24.13 32,482 1,346 *
F 10.11 17,655 1,745 *
North West A 300.15 42,146 140 7
B 73.75 20,903 283 *
C 34.83 11,724 337 *
D 20.17 12,081 599 *
E 24.88 9,247 372 *
Northern Ireland A 7.73 22,644 2,929 138
B 2.13 8,095 3,794 57
C 1.64 2,665 1,621 14
D 1.95 2,499 1,280 6
E 2.48 1,596 644 *
Scotland A 56.46 100,514 1,780 67
B 22.43 111,759 4,982 69
C 12.10 91,092 7,531 60
D 8.09 98,539 12,183 64
E 8.51 66,384 7,802 25
F 13.50 25,880 1,917 *
South West A 196.97 95,199 483 17
B 84.53 68,403 809 12
C 20.11 50,052 2,490 20
D 37.35 66,641 1,784 9
E 15.26 81,928 5,370 17
F 5.32 45,359 8,521 9
Wales A 125.16 23,239 186 7
B 43.33 11,999 277 *
C 26.83 6,291 234 *
D 35.66 8,489 238 *
West Midlands A 232.19 64,402 277 9
B 81.73 65,823 805 11
C 42.56 52,052 1,223 10
D 21.87 68,958 3,153 17
E 14.36 55,325 3,854 12
F 18.55 30,824 1,662 *
Yorkshire & the Humber A 266.29 57,503 216 8
B 73.69 85,807 1,164 16
C 49.30 71,402 1,448 12
D 18.82 107,643 5,721 29
E 15.35 105,665 6,884 20
F 9.13 63,367 6,943 7
For confidentiality reasons a * has been used where 5 or less holdings have been sampled. The first raising factor (rf1) is the largest of the three raising
factors and gives an indication of the robustness of the sample with smaller numbers indicating a larger area sampled within each size group and region.
Page 96
93
ACKNOWLEDGEMENTS
Thanks are due to all of the growers who willingly participated in this survey, providing invaluable information upon
which this report is based. Many thanks are also due to Jackie Hughes, Stephen Jess, Trudyann Kelly, Michael Lavery,
David Matthews, Carol Monie, Gillian Reay, Johan Wardlaw, David Williams and Alan Withers for their role in the
collection and provision of data; Yvonne Powell-Wainwright and Josephine Roberts for their role in maintaining the
pesticides database; and Jennie Blackburn, Sarah Thompson and John Bleasdale for their help with the cropping areas of
arable crops in England & Wales respectively. Thanks also go to the members of the ECP Working Party on Pesticide
Usage Surveys, in particular Sarah Cook, Peter Gladders and Mike Lole, for their invaluable comments.
REFERENCES
Anon. (2016a) Agricultural Statistics in England 2015. London: HMSO
Anon. (2016b) Agricultural Statistics in Wales 2015. London: HMSO
Anon. (2016c) Agricultural Statistics in Scotland 2015. Edinburgh: HMSO
Anon. (2016d) Agricultural Statistics, Northern Ireland 2015. Belfast: HMSO
Anon. (2017a) Agricultural Statistics in England 2016. London: HMSO
Anon. (2017b) Agricultural Statistics in Wales 2016. London: HMSO
Anon. (2017c) Agricultural Statistics in Scotland 2016. Edinburgh: HMSO
Anon. (2017d) Agricultural Statistics, Northern Ireland 2016. Belfast: HMSO
Garthwaite, D.G., Barker, I., Laybourn, R., Huntly, A., Parrish, G., Hudson, S., & Thygesen, S. (2015) Pesticide Usage
Survey Report 263 - Arable Crops in the United Kingdom, 2014. London: Defra
Thomas, M. R., (1999), Guidelines for the Collection of Pesticide Usage Statistics within Agriculture and Horticulture,
OECD, Eurostat, http://www.oecd.org/chemicalsafety/pesticides-biocides/2078031.pdf [online](last accessed 02.08.2015)
Wood, H.J. (1931) An Agricultural Atlas of Scotland. London: George Gill & Sons