PG&E AC Cycling Ancillary Service Pilot Design & Outcomes of Operations Bashar Kellow Bashar Kellow Sr. Program Manager Sr. Program Manager Emerging DR Technologies Emerging DR Technologies March 23, 2010 March 23, 2010
Transcript
PG&E AC Cycling Ancillary Service PilotDesign & Outcomes of Operations
Bashar KellowBashar KellowSr. Program ManagerSr. Program Manager
Emerging DR TechnologiesEmerging DR TechnologiesMarch 23, 2010March 23, 2010
2Overview
• Ancillary Services Market Overview• Pilot Objectives• Test Plan • Design Description• Data Analysis & Results:
- Load Impact - Response Time/Signal Latency
3What are Spinning and non-Spinning Ancillary Services?
• Spinning and non-spinning reserves provide on-call resources to ensure system reliability despite contingencies – e.g. forced generator outage, forced transmission outages.
• Must be available immediately on command from system operator – resource needs to ramp up within a minute.
• Must reach full dispatch from CAISO within 10 minutes.
0 5 10 15 20 25 30 35 40 45 50
Minutes
Spinning and Non‐spinning reserve
4Participation in Spinning/Non-Spinning Reserve Market
• Spinning reserve historically has been supplied by generators that are running but not operating at full power.
• Non-Spinning in CAISO can accommodate load acting as a resource.
• They are bid into the market on a day ahead/real-time basis.
• Real-time telemetry is required for CAISO operations.• Can AC cycling programs participate?
- AC load and load impacts need to be predicted in advance and incorporate uncertainty in the weather forecast.
- Telemetry requirement needs to be met.- Response times need to be proven.
5Pilot Objective
• Determine how long it takes for the PG&E load control system to respond to an instruction to interrupt AC load.
• Determine how much load reduction can be obtained under different operating conditions (including temperature, time of day and day of week and climate).
• Identify an appropriate design for telemetry, data base management and displays that can provide minute by minute measurements and estimates of the AC loads available for curtailment before an operation and the load impacts of the operation once it is underway.
6Approach to the Pilot
• Observe load impact of simulated non-spinning reserve operations on feeders and samples of individual premises.
• Run tests under varying time of day, day of week and ambient temperatures.
• Measure and display feeder and AC load impacts in real time.
• Use resulting data to improve the system to support operations and to develop load prediction model.
7Sample Design
• Four feeders were selected with the potential to recruit at least 500 subscribers in each feeder (total of 2000).
• Control device distribution as follows:- 400 DLC’s (Direct Load Control) per feeder (1600 total DLC’s)- 100 PCT’s (Programmable Communicating Thermostat) per
feeder (400 total PCT’s)• Feeder selection criteria:
- Less noisy to allow a comparison of telemetry data with feeder SCADA load data.
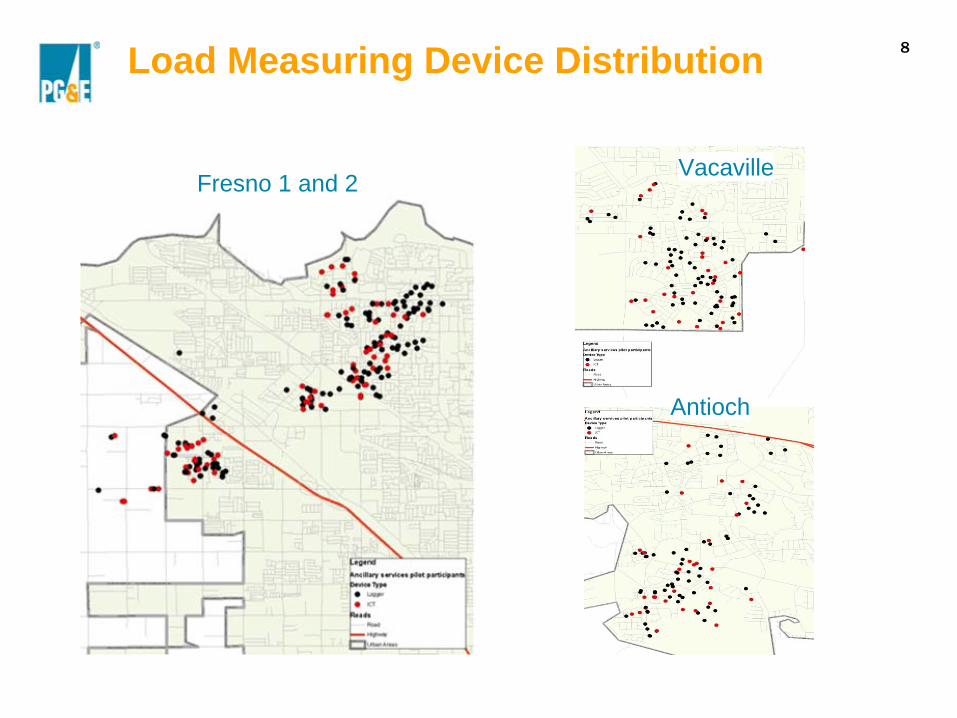
- Sufficiently large population of Smart AC customers.• Random distribution of load measuring devices:
- 100 devices per feeder (400 total devices)• 30-40 telemeters per feeder (110 total telemeters)• 70 Onset Hobo loggers per feeder (280 total Hobos)
8Load Measuring Device Distribution
Fresno 1 and 2Vacaville
Antioch
9Testing Protocol
• Notch testing:- 15 minutes shed.- Loads interrupt immediately on receipt of signal.- Completely off for 15 minutes.- Control returns to thermostats randomly over 2 minute interval.
• Testing schedule:- Two tests daily between 12:00 and 19:00 separated by 2 hours.- Weekdays only.- Live event monitoring: 15 minutes before event, during event and 15 minutes
after event.- Between events: hourly system observation on the hour.
• Load measurements:- By feeder and for all feeders taken together.- Aggregated monitored AC load by minute.
• Aggregated extrapolated AC load by minute.- Percentage of monitored units active.- Baseline measurements – average aggregate monitored load 5 minutes before
operation.
10Control & Measurement System Design
11Real-Time Telemetry Load Measurement Technology
• Instrumentation- Dent PowerScout 3 (WIMeter)- Two current transformers with voltage reference for power
measurements• Data logging and communication
- EICT WebRTU-Z2- 500 ms modbus sampling- kW, kWh & AMP per phase- Store data at one minute intervals- GPRS communications- One minute data transmission frequency during event- One hour data transmission frequency for non-event periods
• Central Software- EICT EIServer MDM software running in ASP to house telemetry
and SCADA data.
12User Interface – Real Time Feeder and Sampled Units Data
13Load Impact Dependencies
• Significant load impacts observed in real time on all feeders on certain days.
• Load impacts vary by time of day, temperature and climate- The higher the temperature the higher the impacts.- The later in the afternoon the higher the impacts.- The hotter the climate zone the higher the impacts.
• Better device response rate during events with higher number of active AC units.
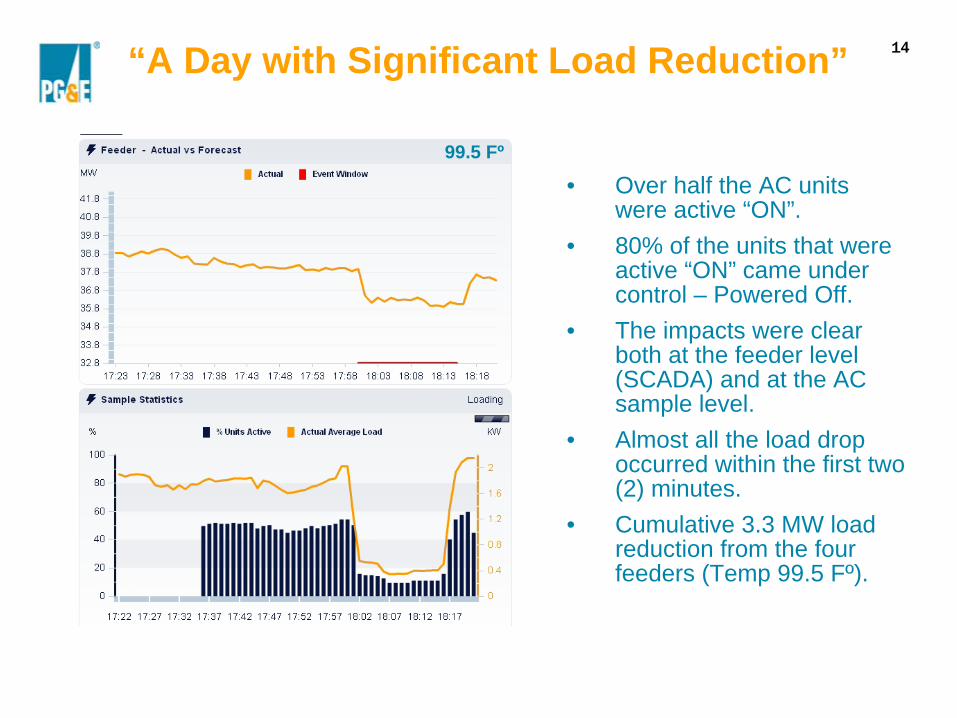
14“A Day with Significant Load Reduction”
• Over half the AC units were active “ON”.
• 80% of the units that were active “ON” came under control – Powered Off.
• The impacts were clear both at the feeder level (SCADA) and at the AC sample level.
• Almost all the load drop occurred within the first two (2) minutes.
• Cumulative 3.3 MW load reduction from the four feeders (Temp 99.5 Fº).
99.5 Fº
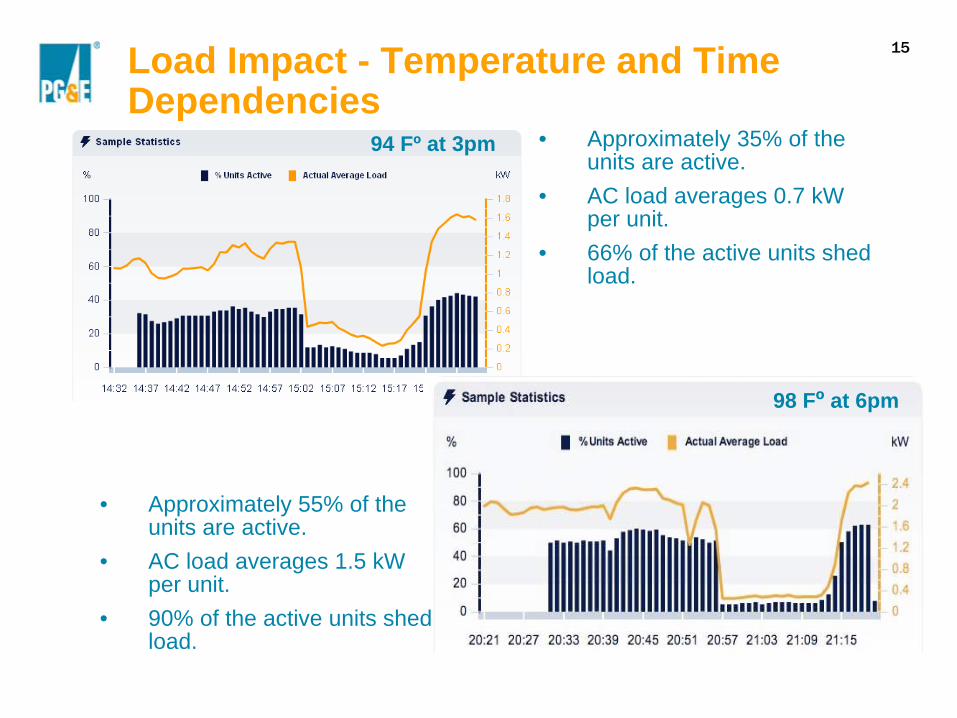
15Load Impact - Temperature and Time Dependencies
• Approximately 35% of the units are active.
• AC load averages 0.7 kW per unit.
• 66% of the active units shed load.
94 Fº at 3pm
98 Fº at 6pm
• Approximately 55% of the units are active.
• AC load averages 1.5 kW per unit.
• 90% of the active units shed load.
16Load Impact Performance Issues
Several performance issues were encountered during testing:
• Intermittent performance by control devices due to communication network coverage and device configuration issues.
• Multiple events scheduled in Yukon at the same time – communication system congestion.
17
• Regression model was applied on aggregated data to develop a forecasting model based on temperature.
• The regression model was applied to the 5 minute prior to the event and the 15 minutes of the event.
• The post-event period was excluded to avoid confusing AC snapback after curtailment with unperturbed load patterns.
• This prediction model can support a 24 hour lead time with a 24 hour forecasting window.
Load Impact Predictability
>100 Fº
95-100 Fº
18Load Impact Results
• AC load and load impact depends substantially on weather conditions.
• Average AC load can range from zero to over 4 kW per unit; which causing a variance in the load impact in return.
• The relationship between AC load/load impact and temperature in non-linear:
- On 91 Fº days load impact is more than double the impact on an 86 Fº days .
- On 100 Fº days load impact is 3.5 times the impact on an 86 Fº days.
• In spite of all the variations due to dependencies, AC load and load impact is highly predictable.
• Generally, more load reduction is available under extreme summer weather events.
19Signal Propagation
Yukon begins the scheduled event
Yukon sends event to comm.
queue
Establish connection with paging company
via dial-up modem
Control message is broadcasted to control devices
Control device receives the message and
shuts AC compressor
(resulting in a load drop)
NOTE: This pilot did not measure the time NOTE: This pilot did not measure the time delay from CAISO to PG&E.delay from CAISO to PG&E.
20Signal Latency Analysis
Device response time for all the events over the entire 15 minute period
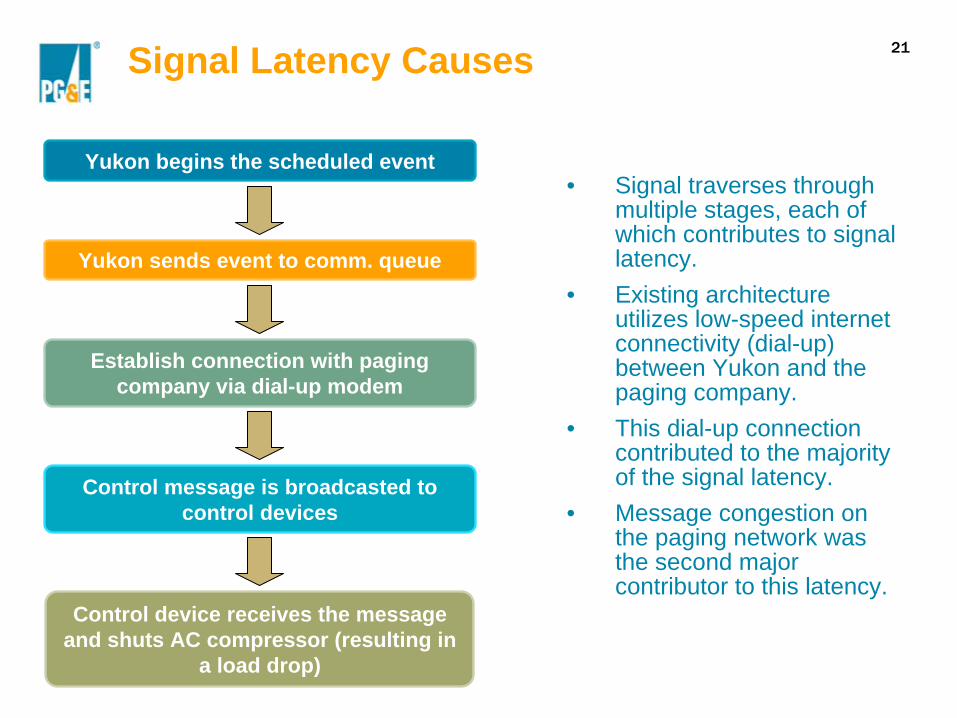
21Signal Latency Causes
• Signal traverses through multiple stages, each of which contributes to signal latency.
• Existing architecture utilizes low-speed internet connectivity (dial-up) between Yukon and the paging company.
• This dial-up connection contributed to the majority of the signal latency.
• Message congestion on the paging network was the second major contributor to this latency.
Yukon begins the scheduled event
Yukon sends event to comm. queue
Establish connection with paging company via dial-up modem
Control message is broadcasted to control devices
Control device receives the message and shuts AC compressor (resulting in
a load drop)
22Signal Latency Results
•• 60 seconds60 seconds median response time.
•• 92%92% response rate at 120 seconds120 seconds.
•• 69.4 seconds69.4 seconds average time.
•• 60.6 60.6 –– 78.3 seconds78.3 seconds average response time at 95%95% confidence interval.
• These values are well within the 10 minute time interval required to deliver the dispatched load as defined by CA-ISO to participate in the non- spinning Ancillary Services market.
0
20
40
60
80
100
120
140
0% 20% 40% 60% 80% 100%
Percentage of responding devices
Tim
e to
AC
com
pres
sor s
huto
ff du
ring
even
ts (s
econ
ds)
AVERAGE
23Conclusion
• The pilot presented substantial load impacts in some tests.• The magnitude of the load impact depended heavily on the ambient
temperature and the time of day.- On 80 Fº days, impact was about 0.2 kW.- On 95 Fº days, impact was between 0.54 kW and 1.4 kW.- On 100 Fº days, impact was between 0.62 kW and 1.44 kW.
• Relationship between load impact and weather is highly predictable and non-linear.
• Much higher load reductions were observed between 2:00 pm and 6:00 pm than at other times of the day.
• Load impacts ranged from almost zero (on 75 Fº days or less) to upwards of 3.3 MW (on 99 Fº days) for the pilot sample (2000 AC units).
• On Average, AC load was reduced within 70.1 seconds.• About half of the times, load reductions were present within 60 seconds.• On 95% of the test occasions, load reductions began within 126 seconds.• Virtually all of the load reduction obtainable from the pilot participants
occurred within the first 3 minutes of operations.