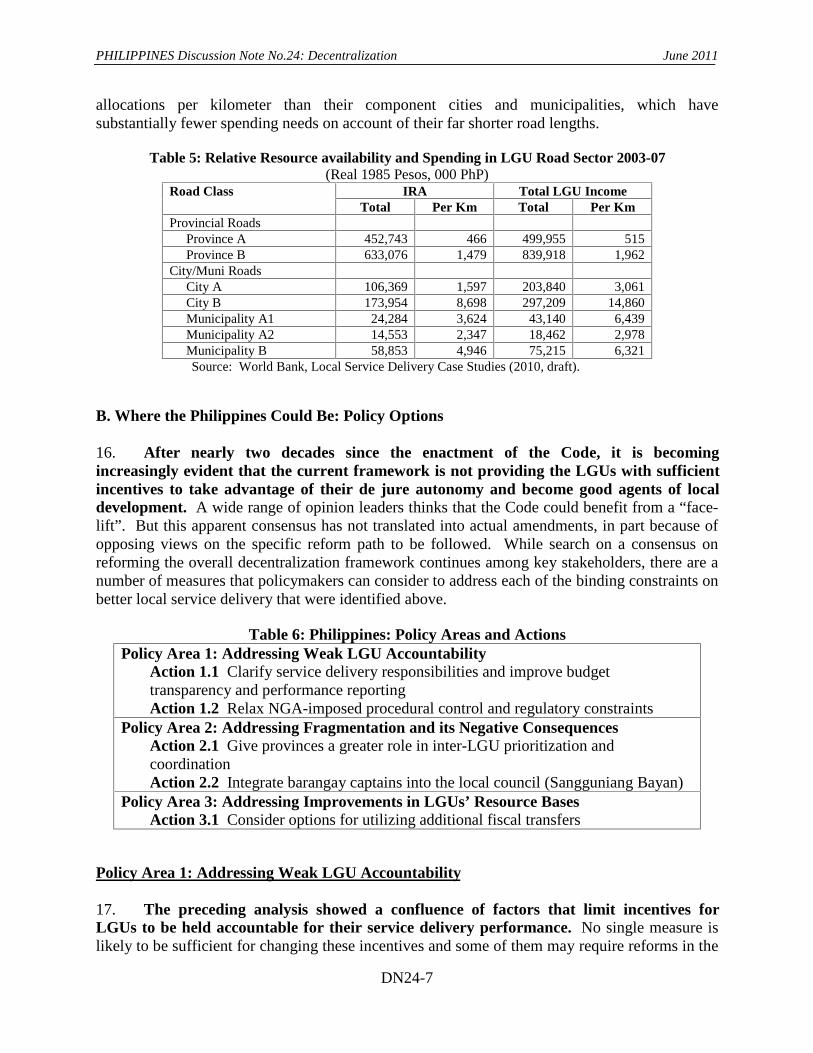
Report No. 55655 - PH Philippines Discussion Notes Challenges and Options for 2010 and Beyond June 2011 Philippines Country Team, World Bank East Asia and Pacific Region The International Finance Corporation East Asia and Pacific Department Document of the World Bank This document has a restricted distribution and may be used by recipients only in the performance of their official duties. Public Disclosure Authorized Public Disclosure Authorized Public Disclosure Authorized Public Disclosure Authorized Public Disclosure Authorized Public Disclosure Authorized Public Disclosure Authorized Public Disclosure Authorized
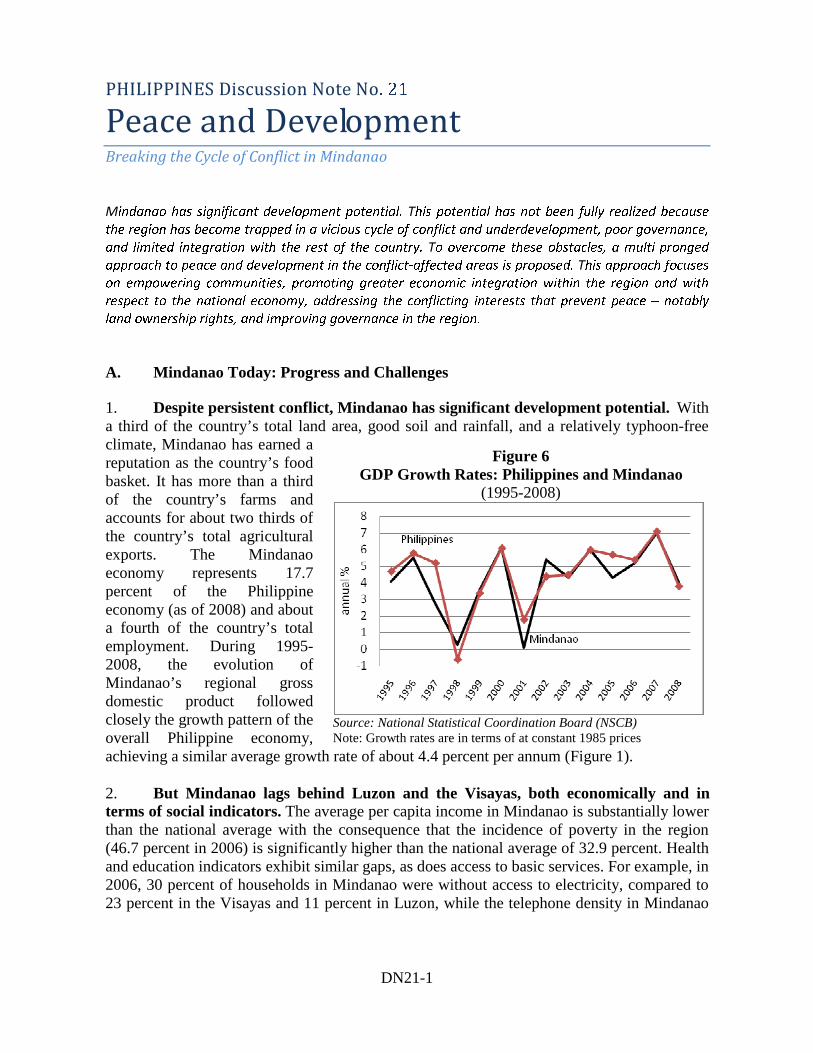
Transcript
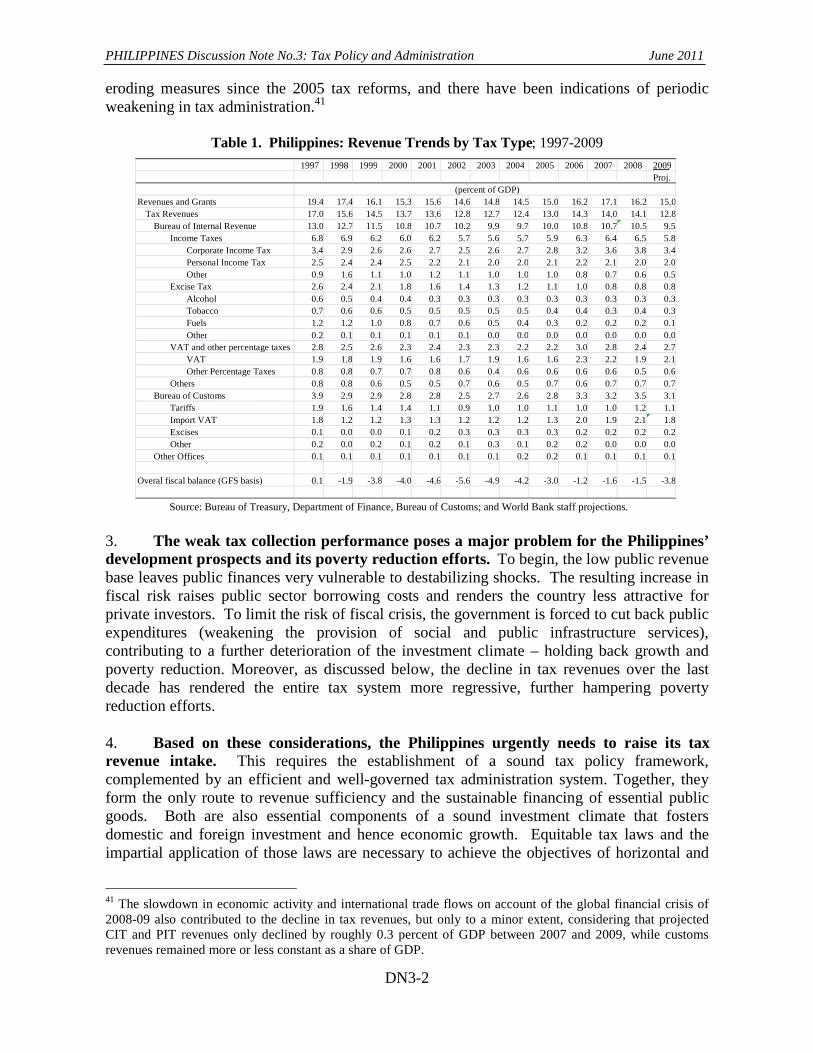
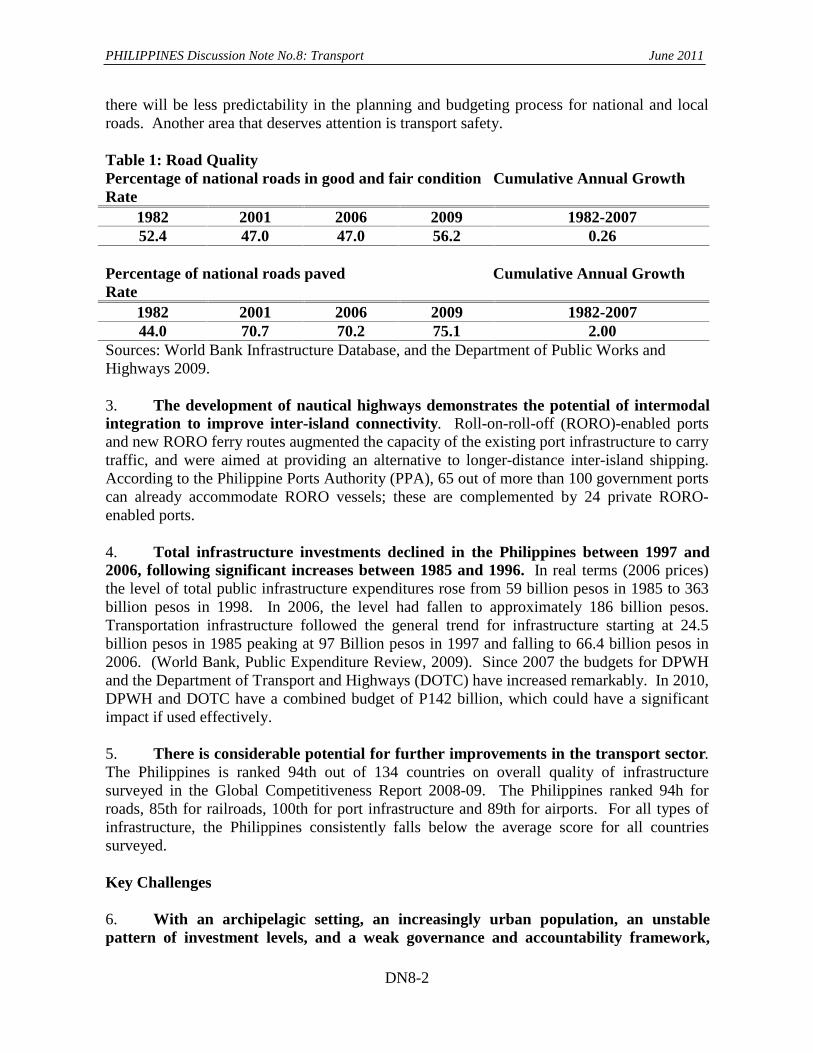
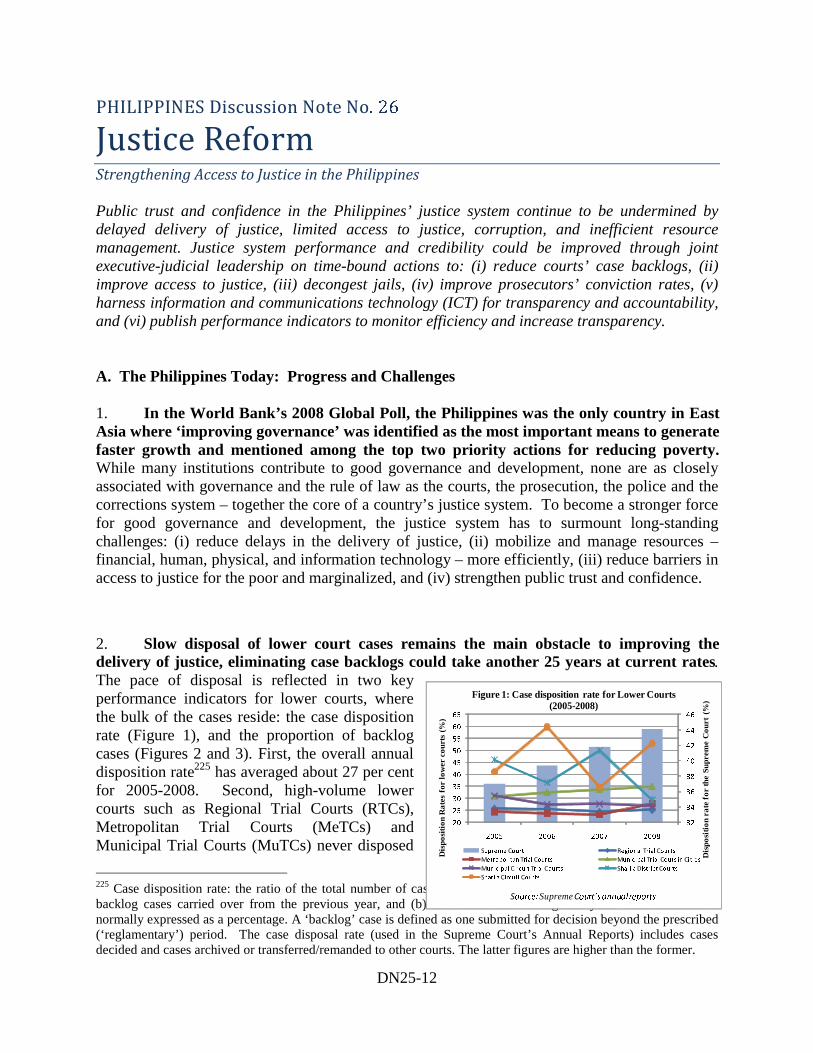
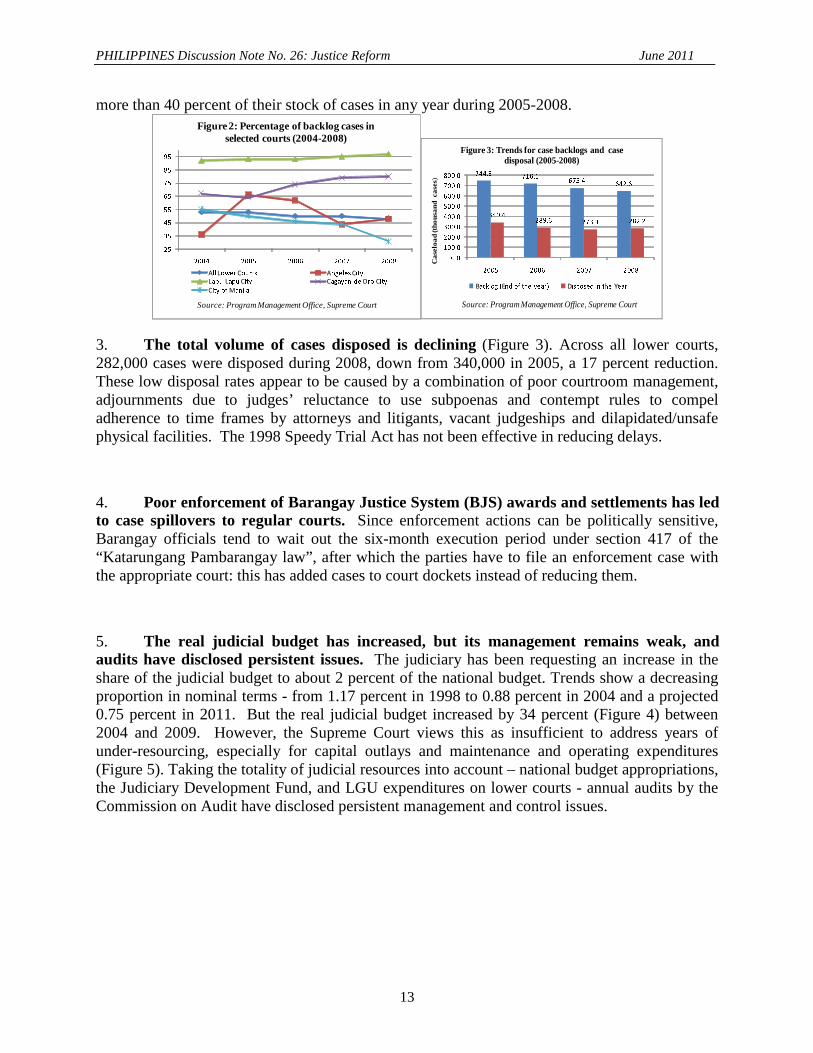
Report No. 55655 - PH
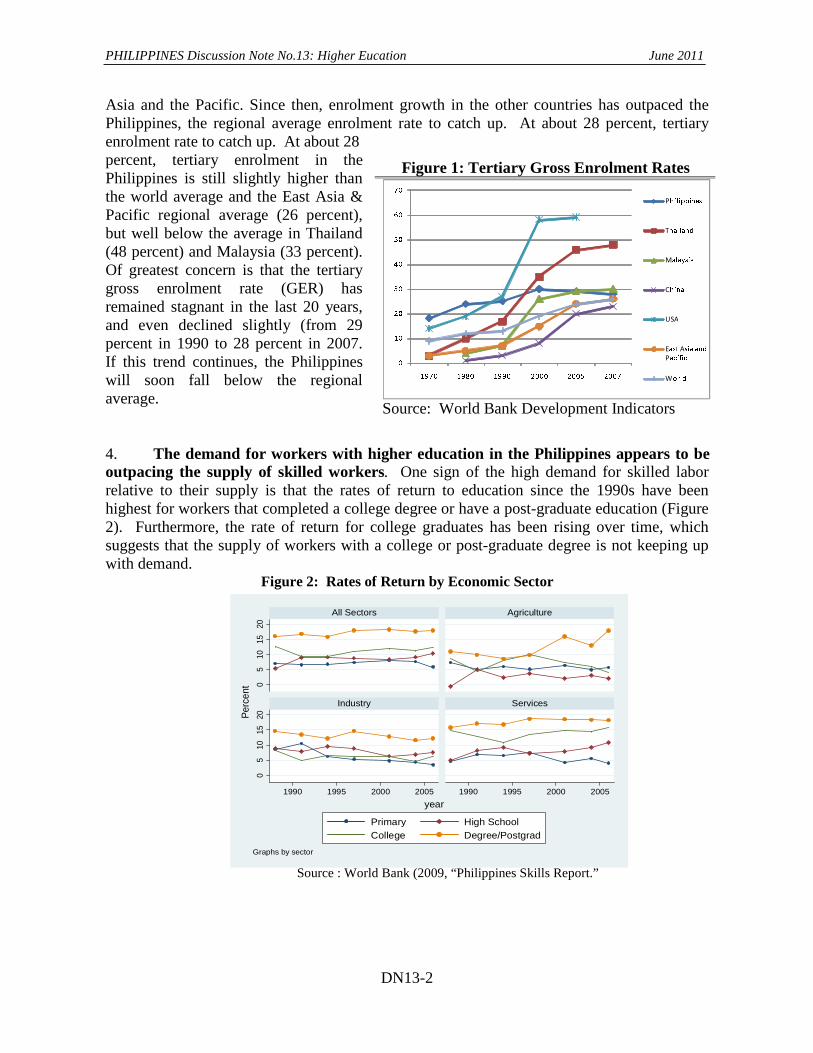
Philippines Discussion Notes Challenges and Options for 2010 and Beyond
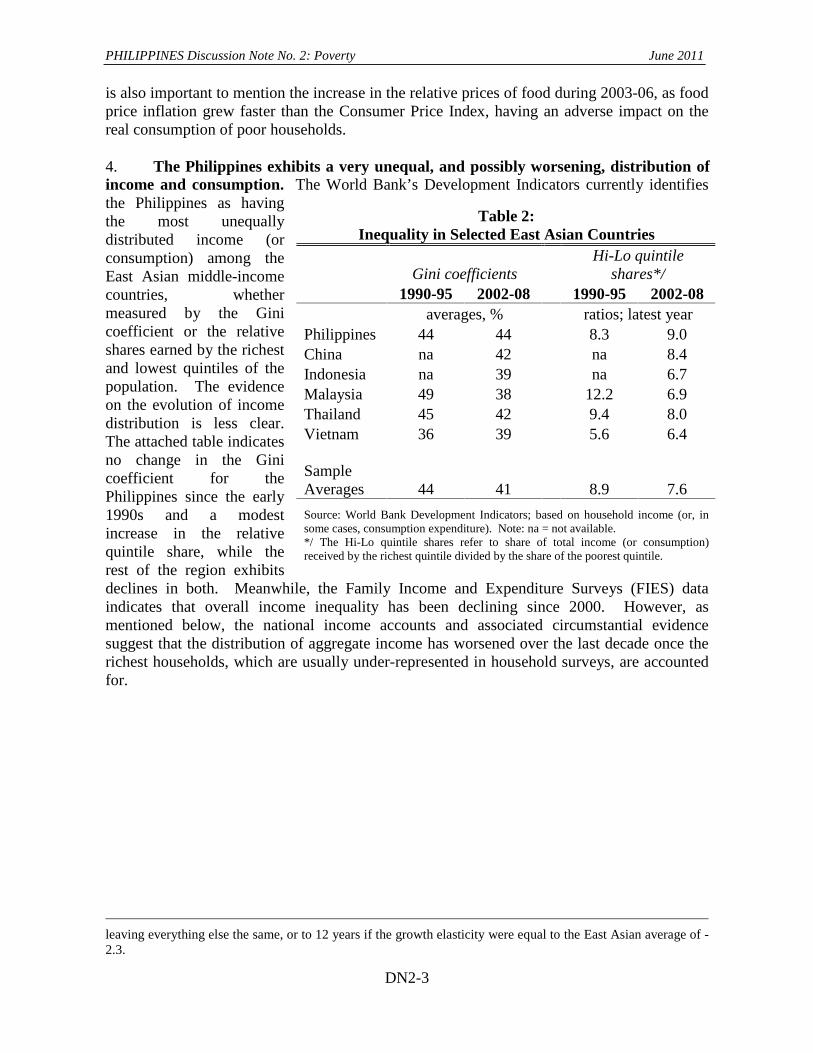
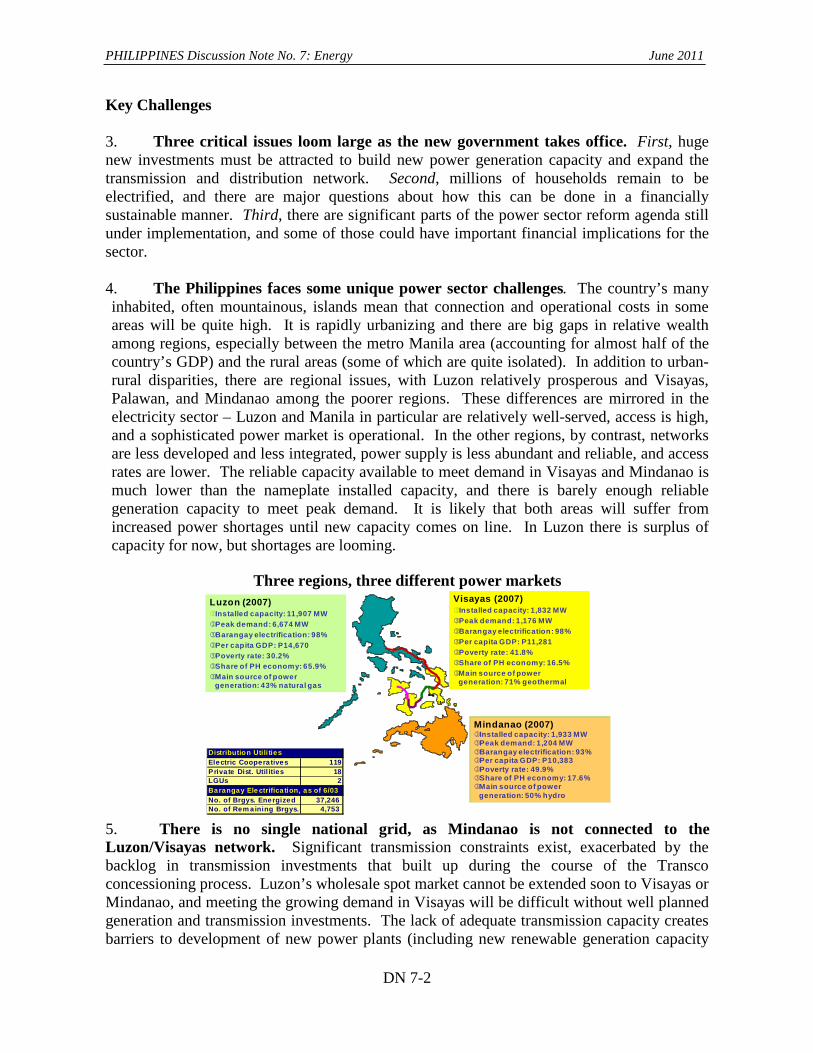
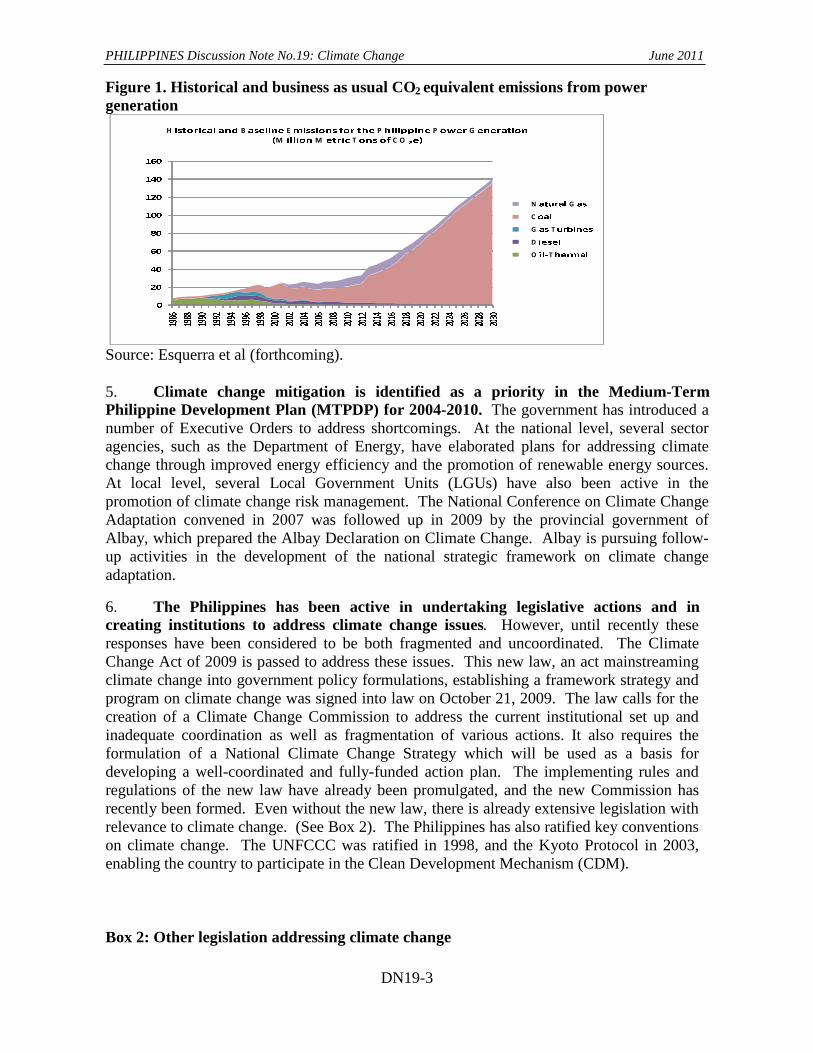
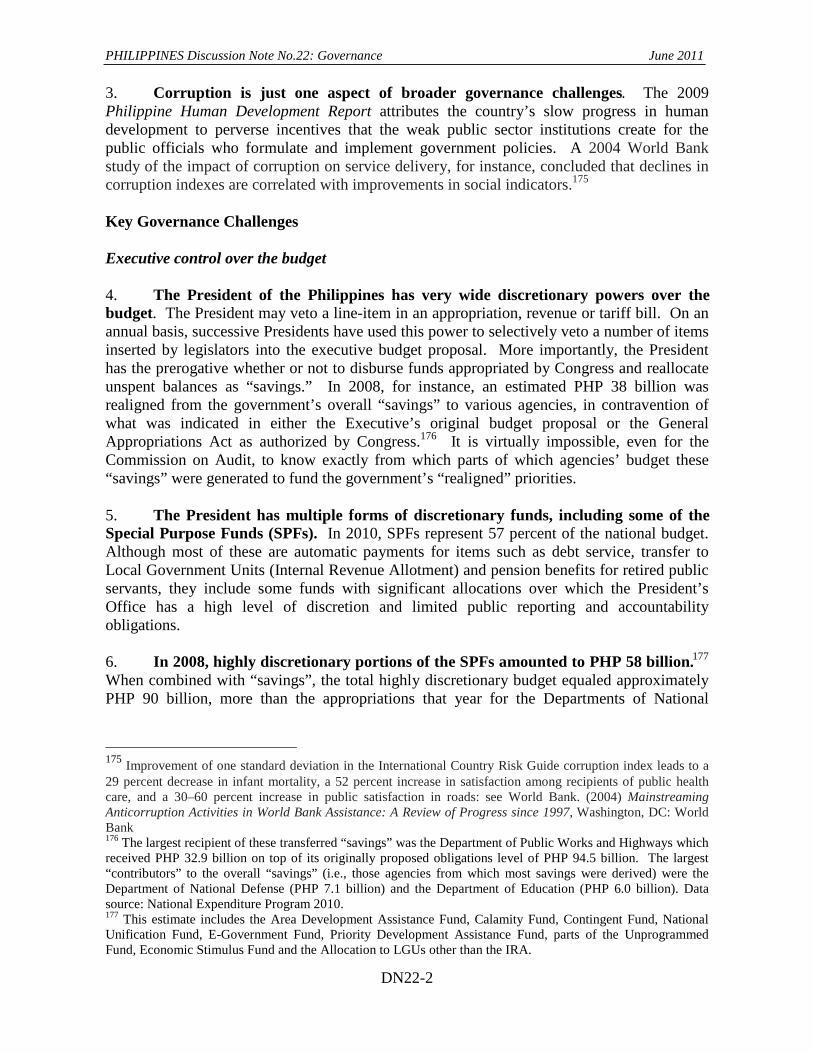
June 2011
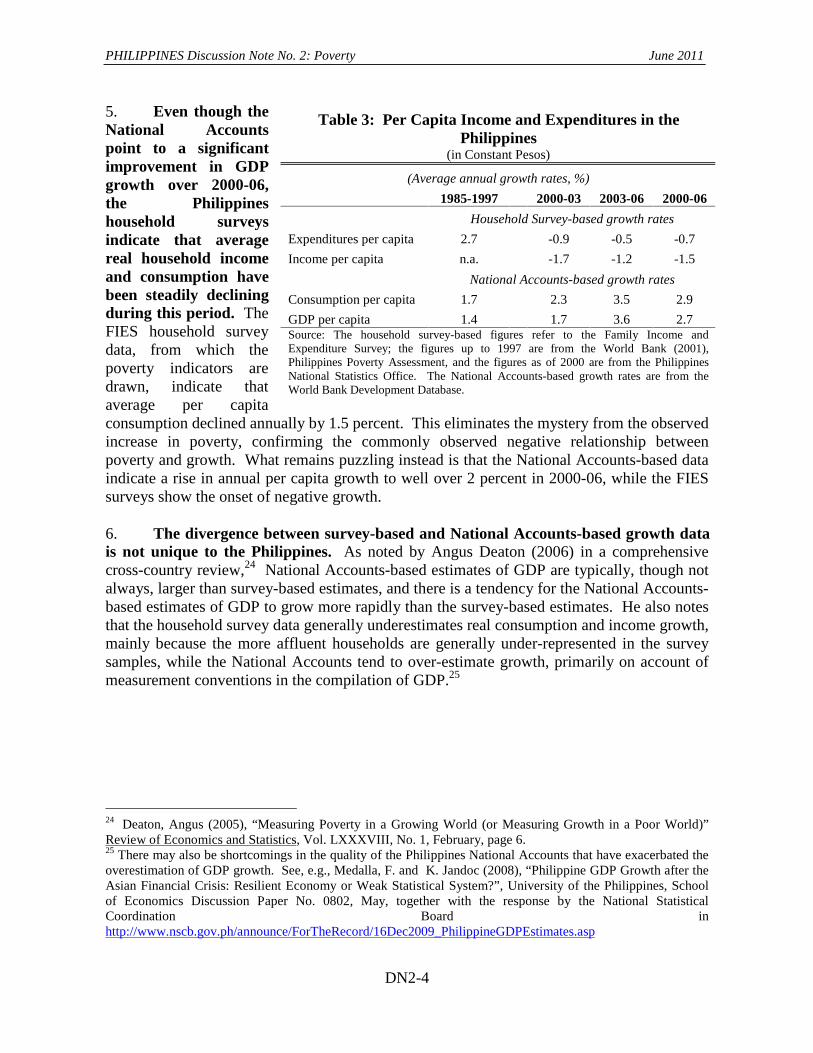
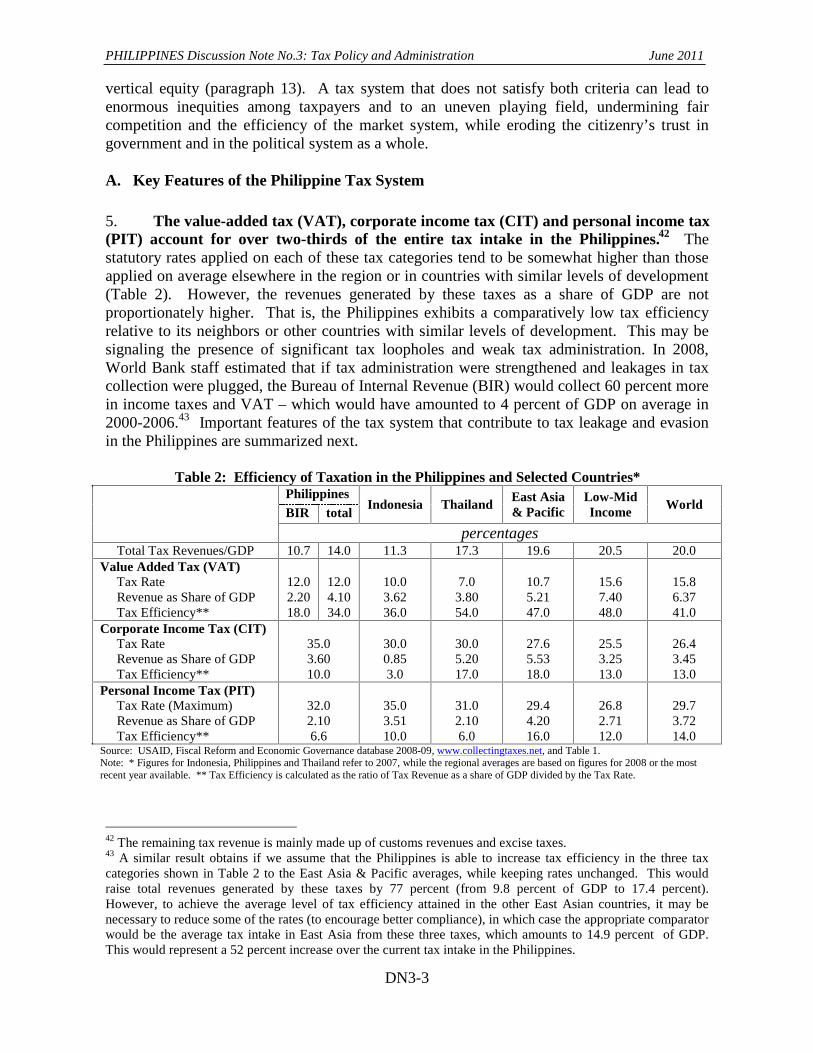
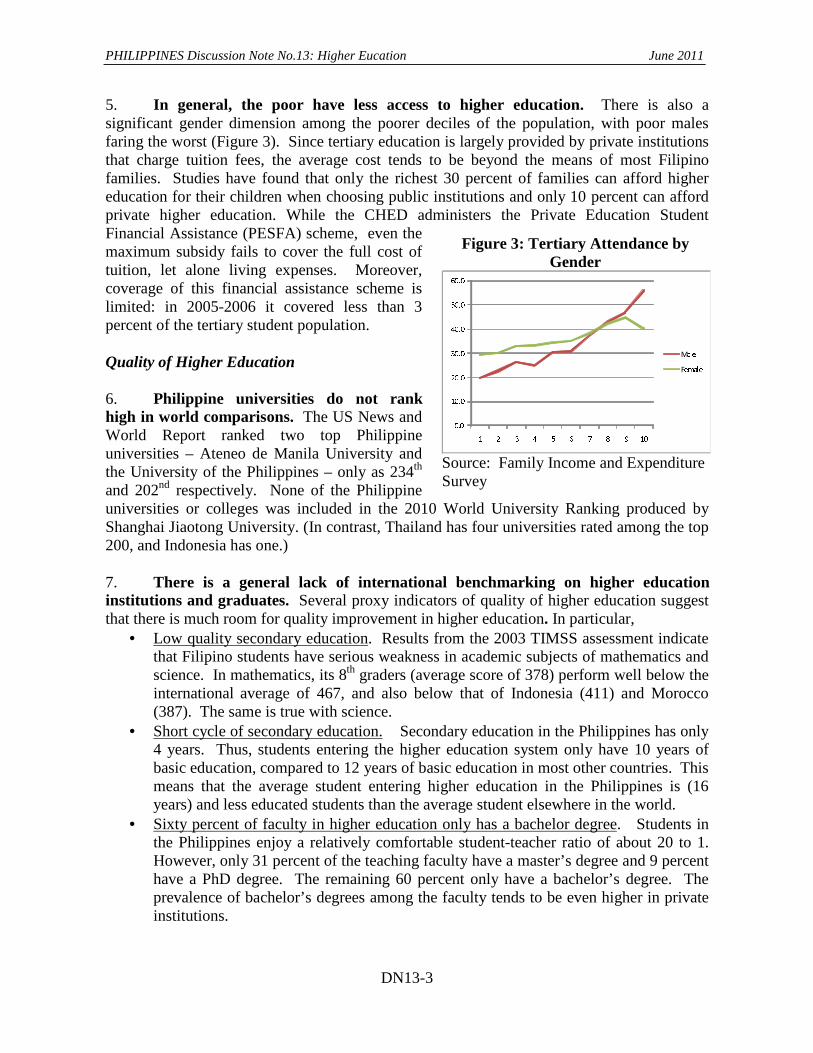
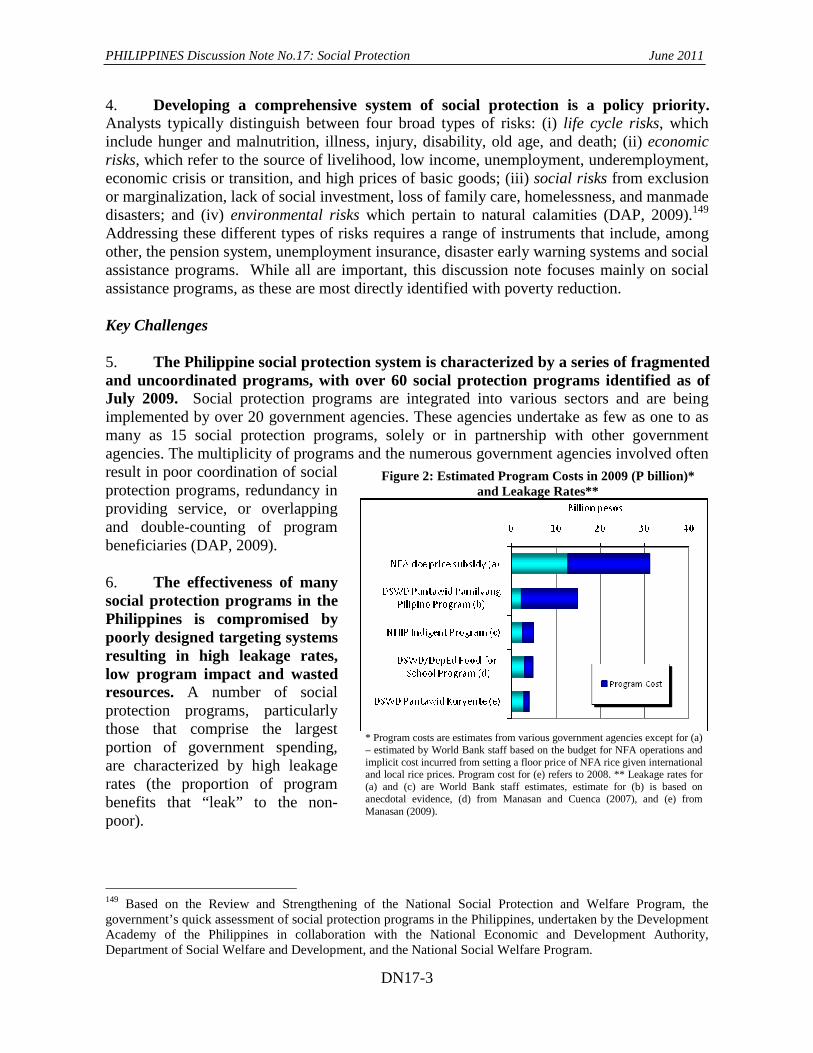
Philippines Country Team, World Bank East Asia and Pacific Region The International Finance Corporation East Asia and Pacific Department
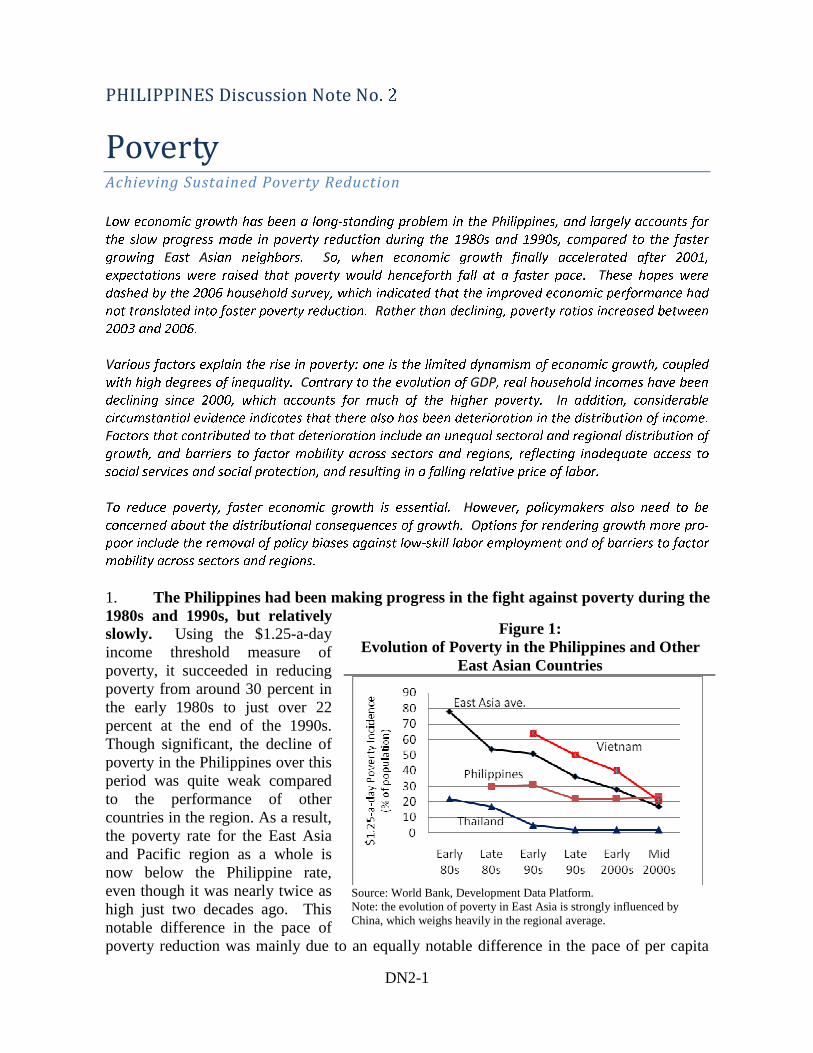
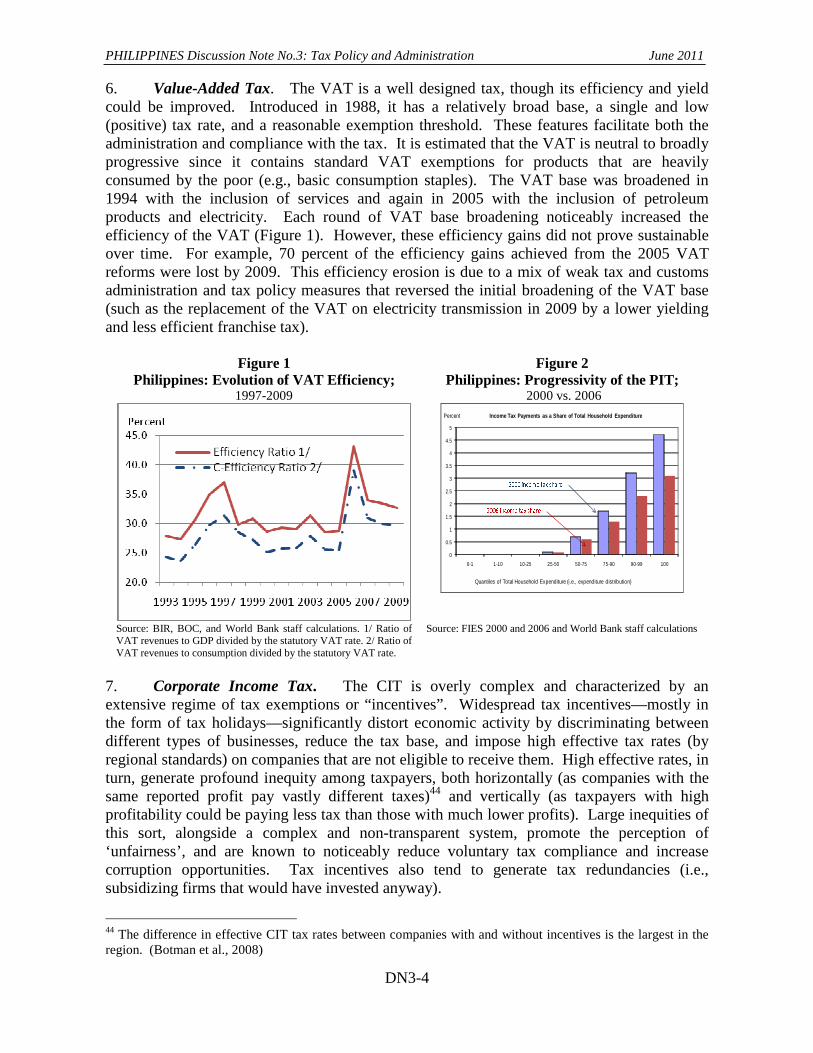
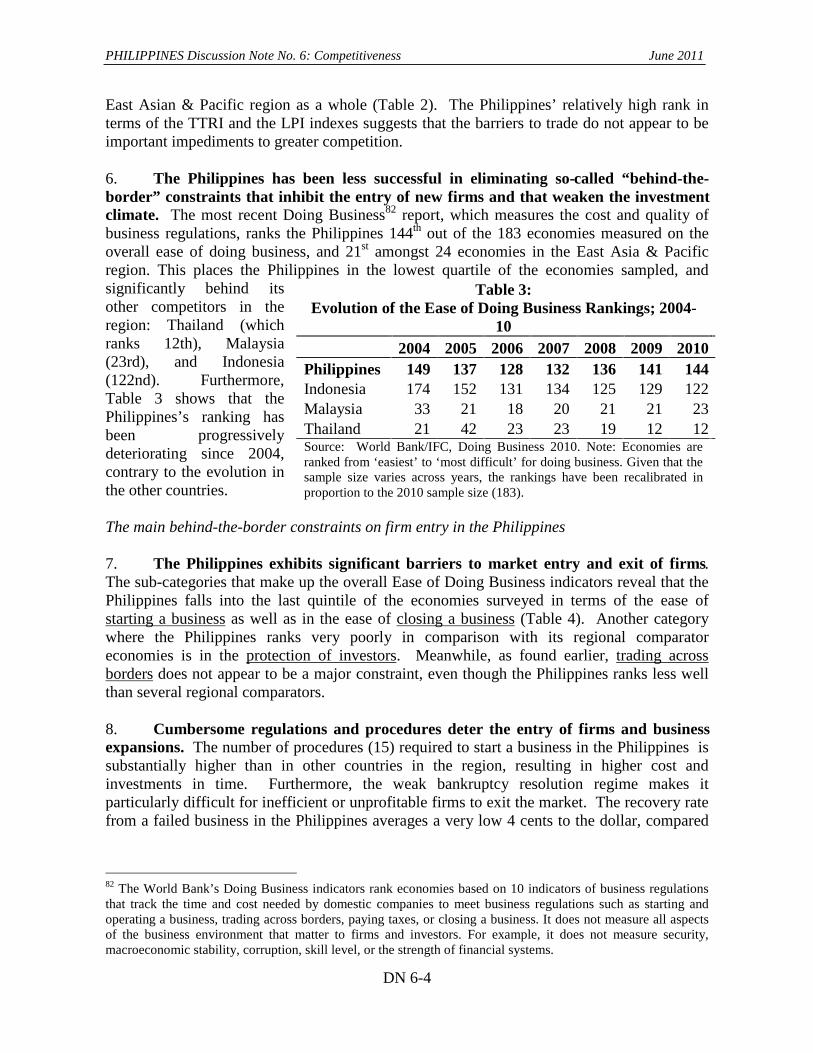
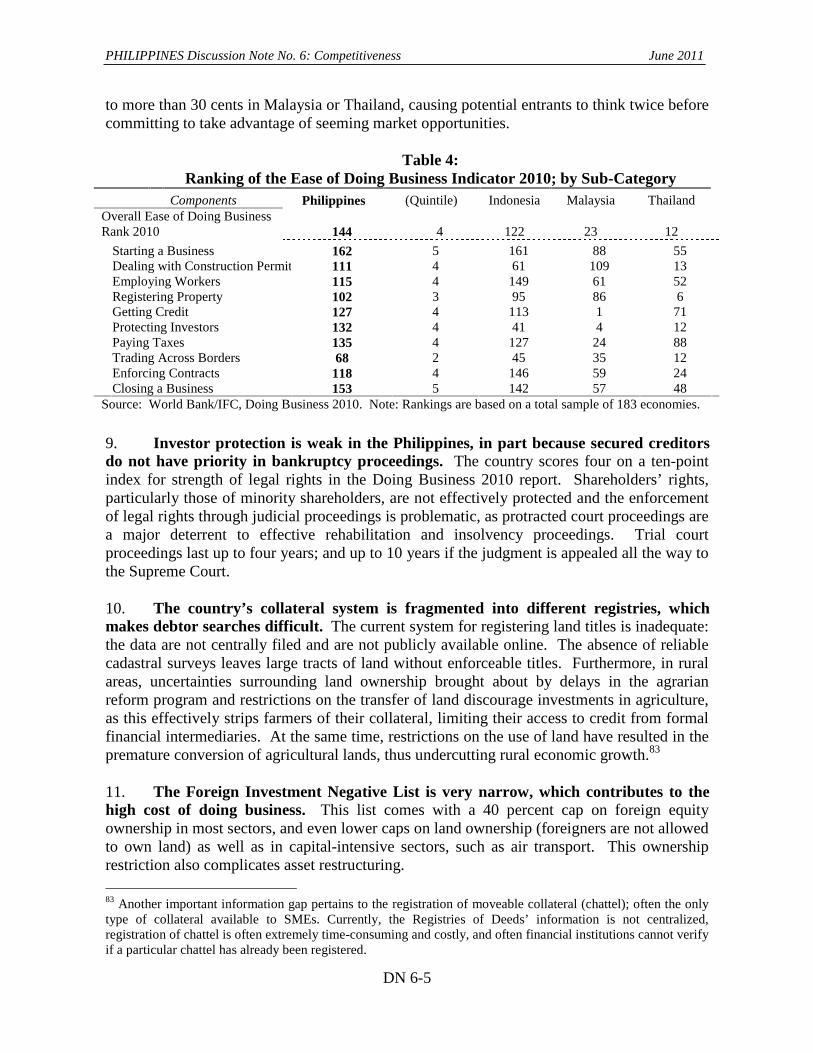
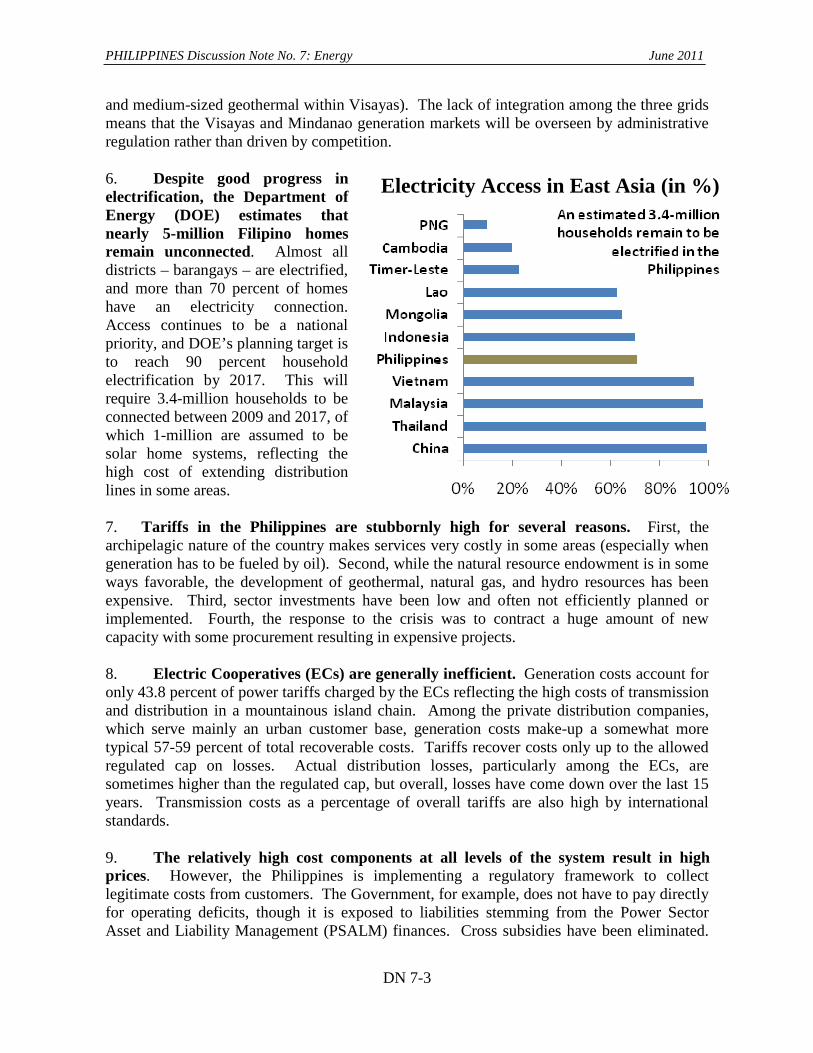
Document of the World Bank This document has a restricted distribution and may be used by recipients only in the performance of their official duties.
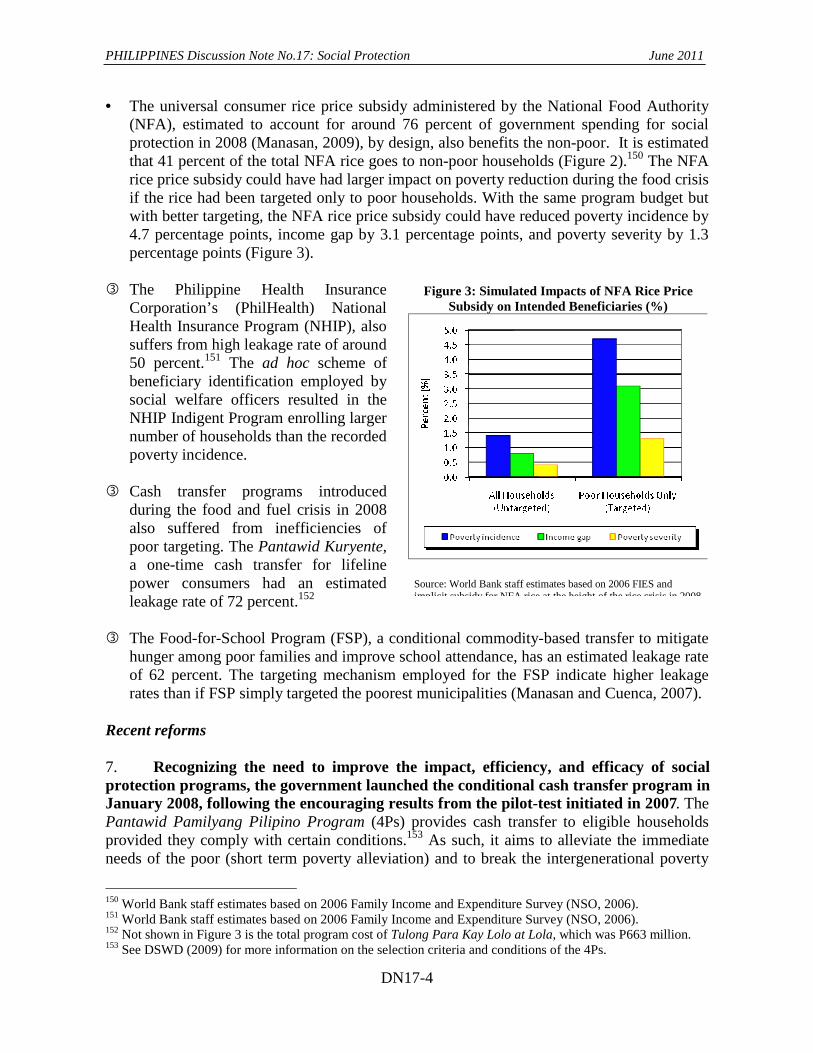
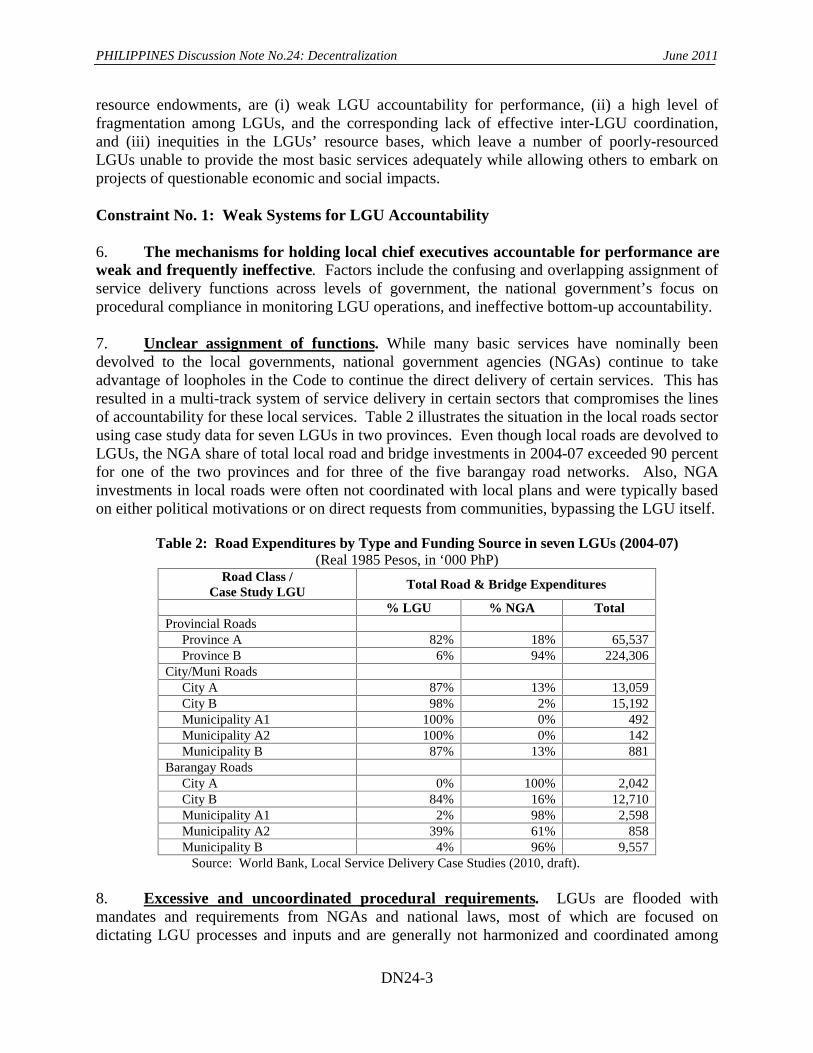
World Bank IFC Vice President James W. Adams Rashad-R. Kaldany
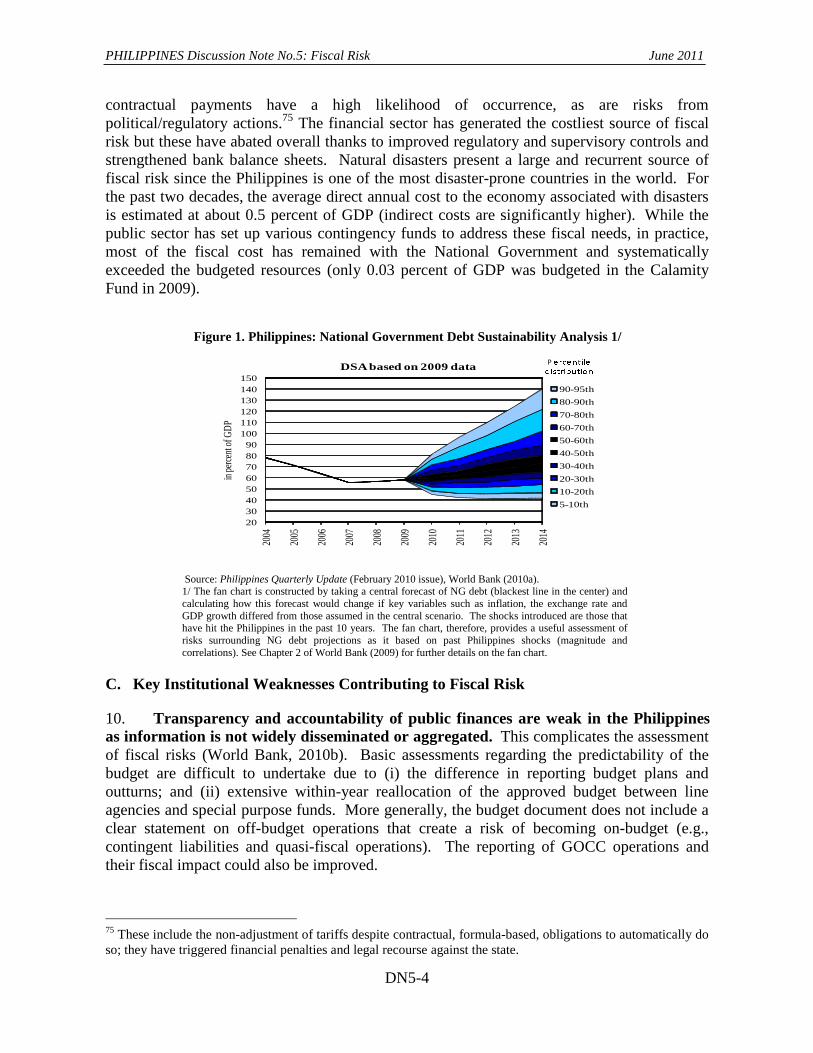
Karin Finkelston Country Director/ Resident Representative
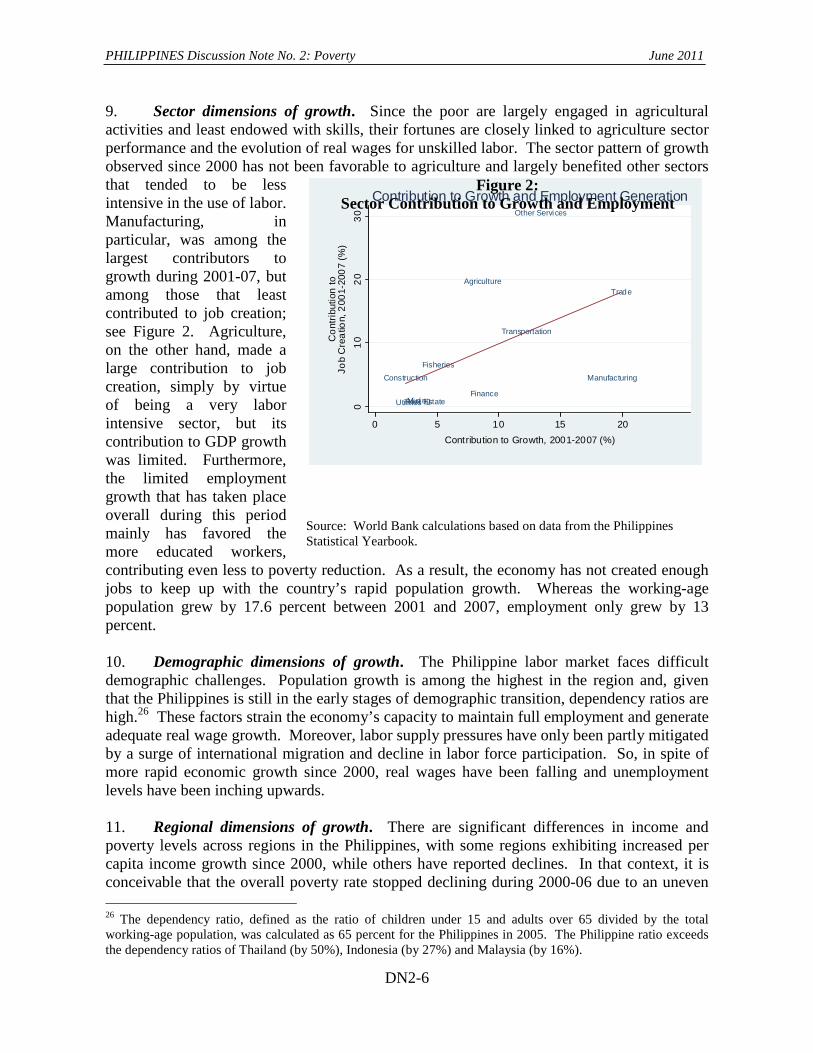
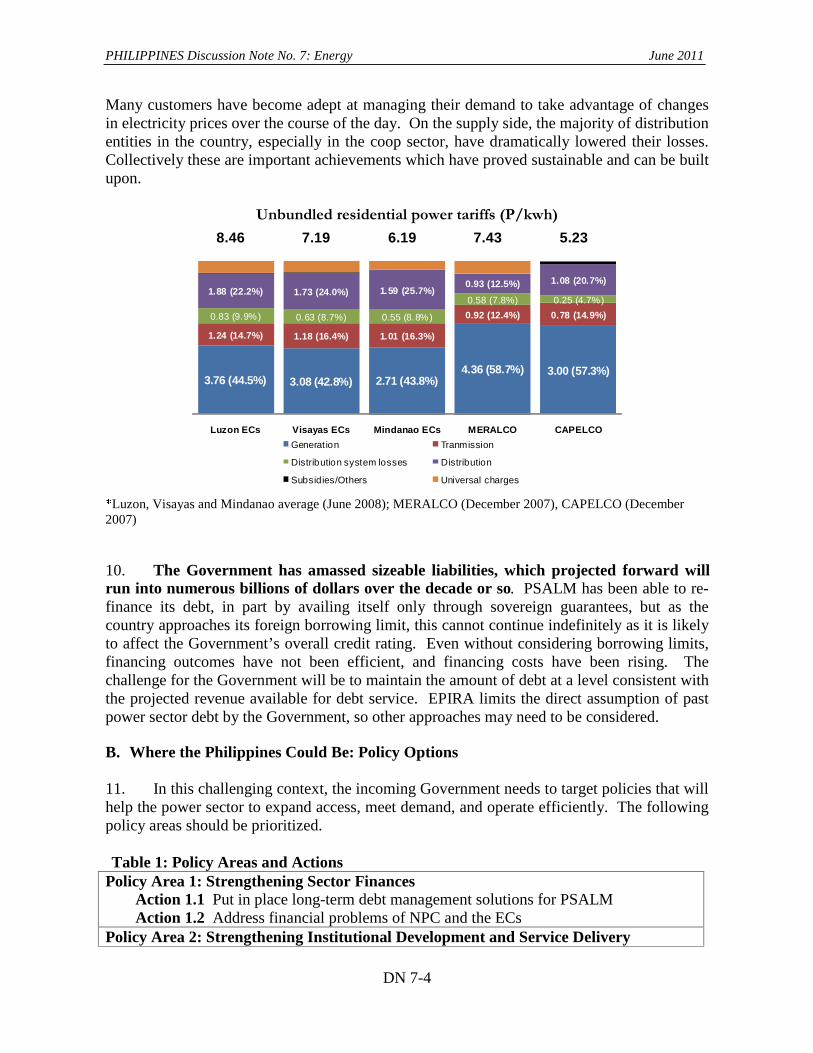
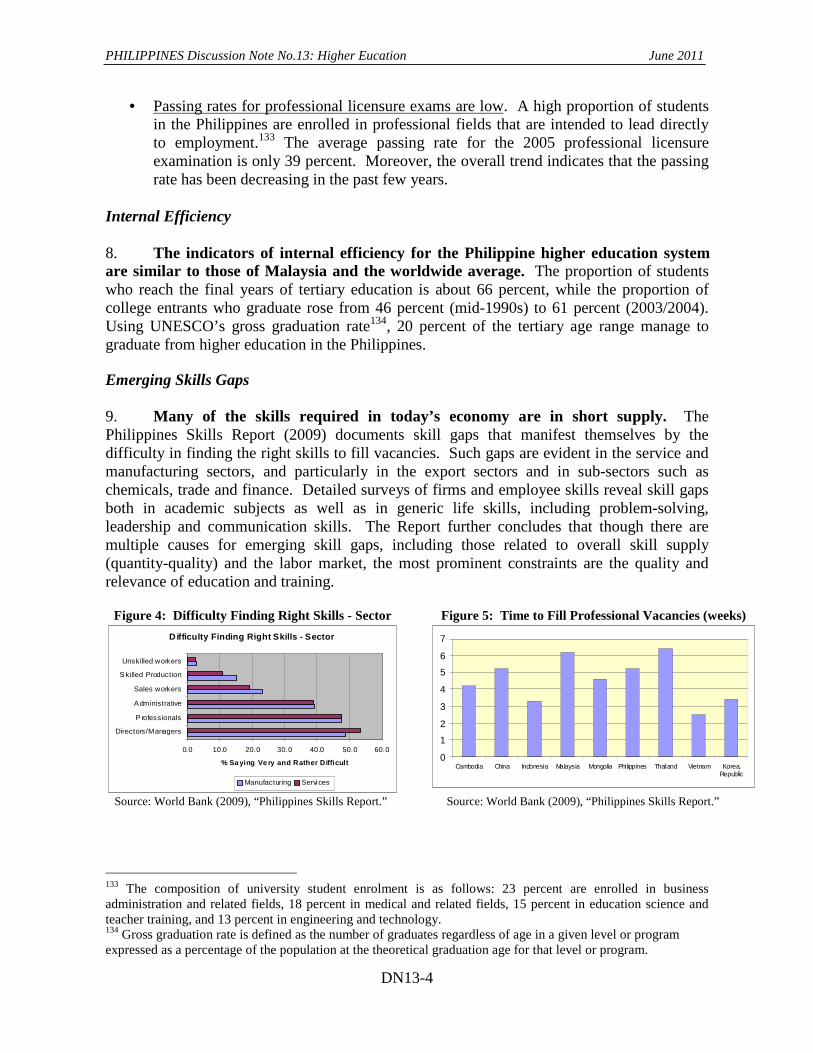
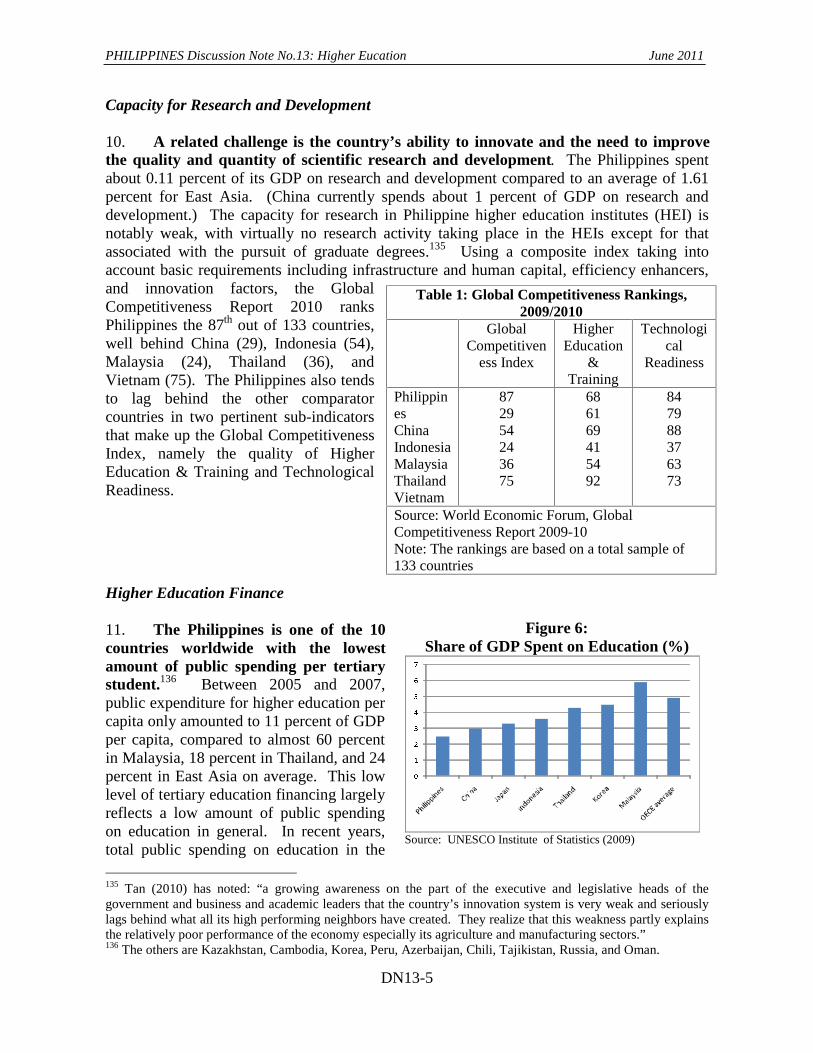
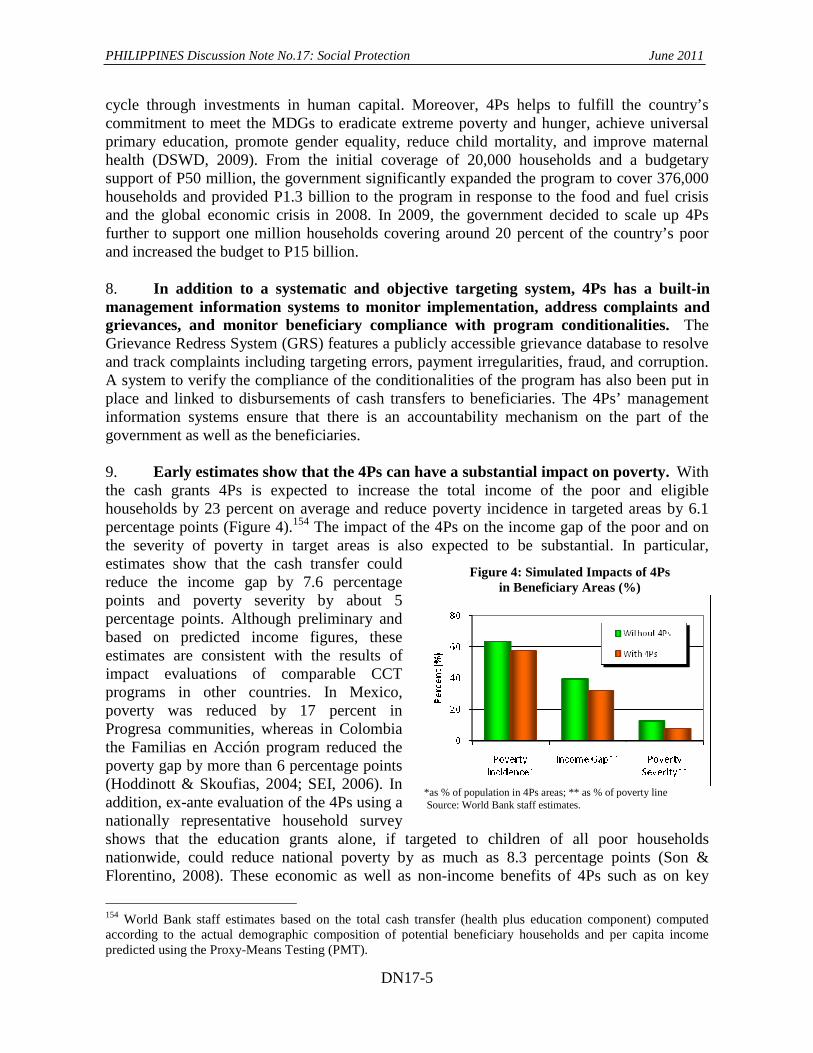
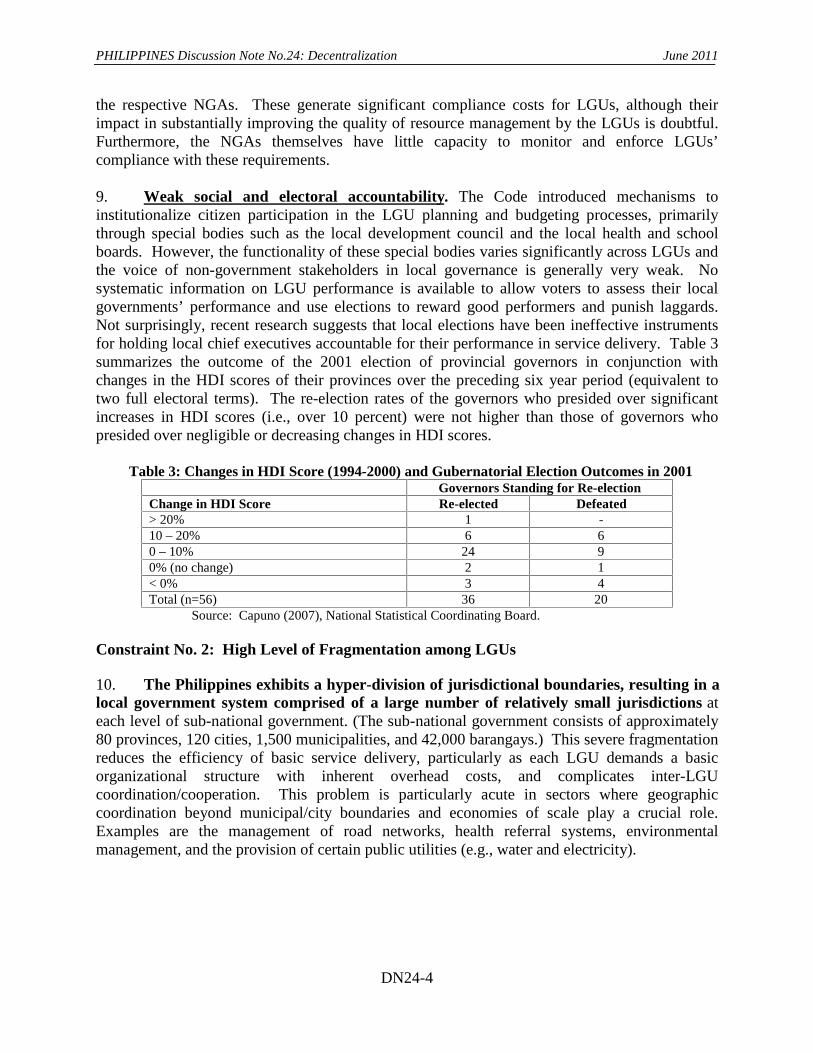
Bert Hofman Jesse Ang
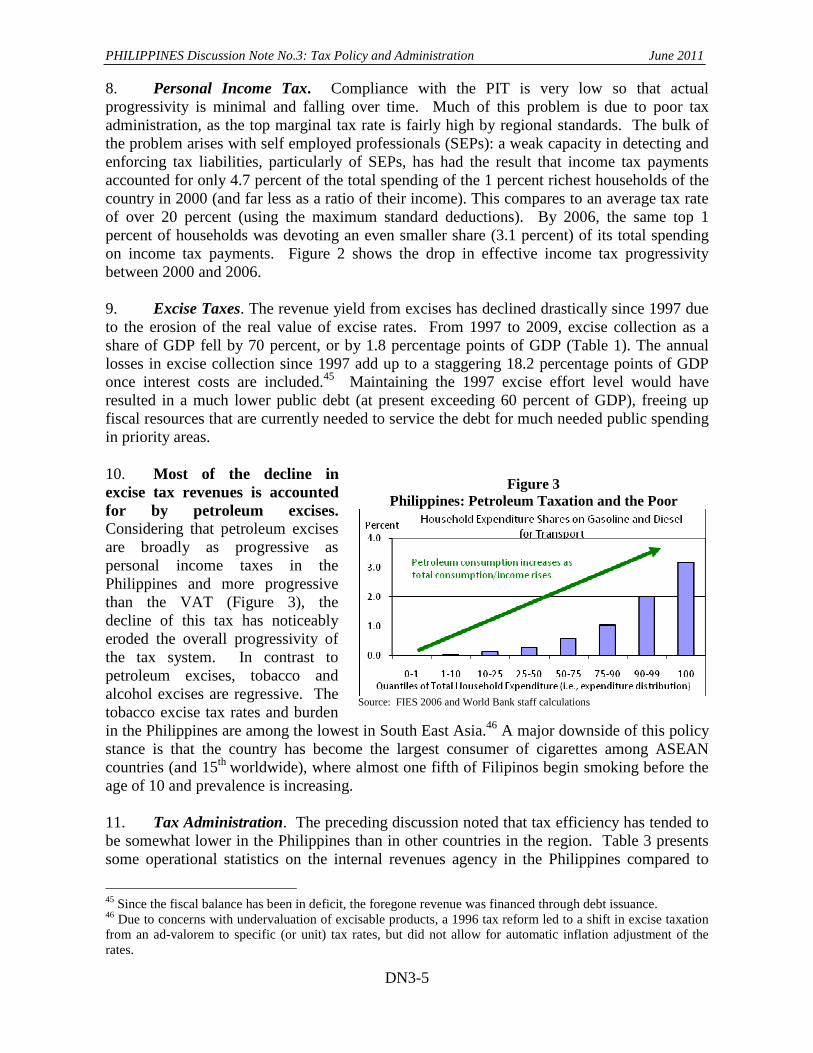
Task Team Leaders
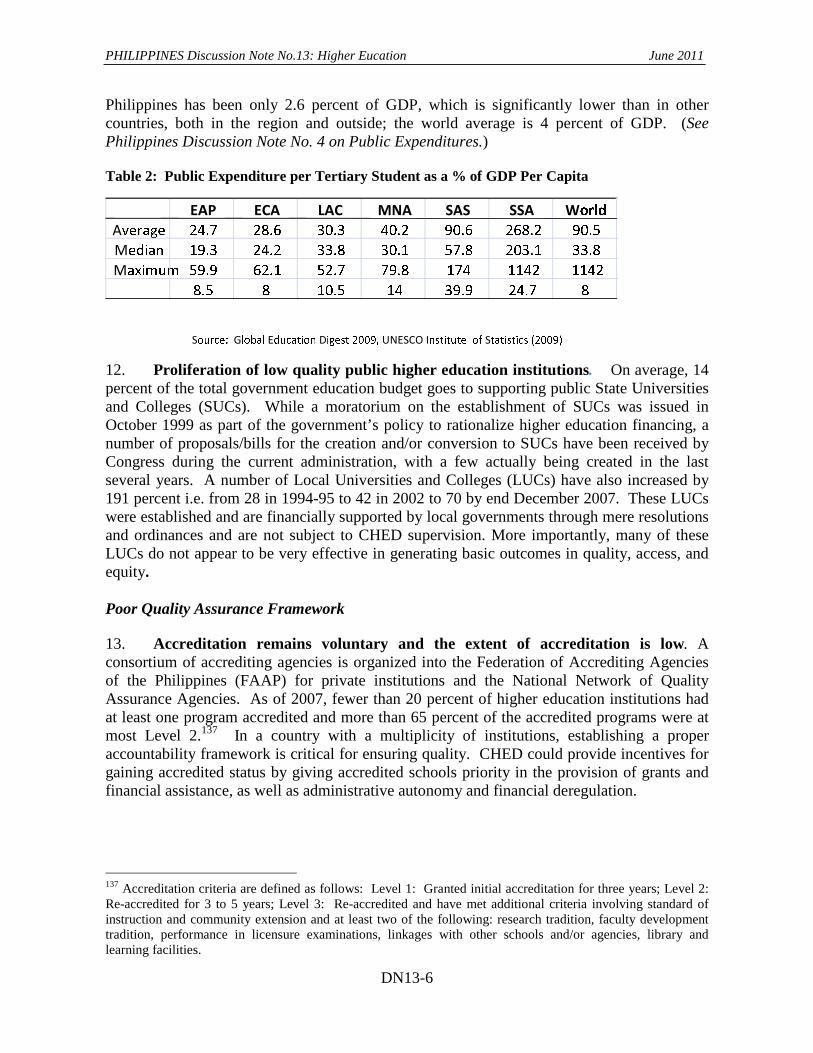
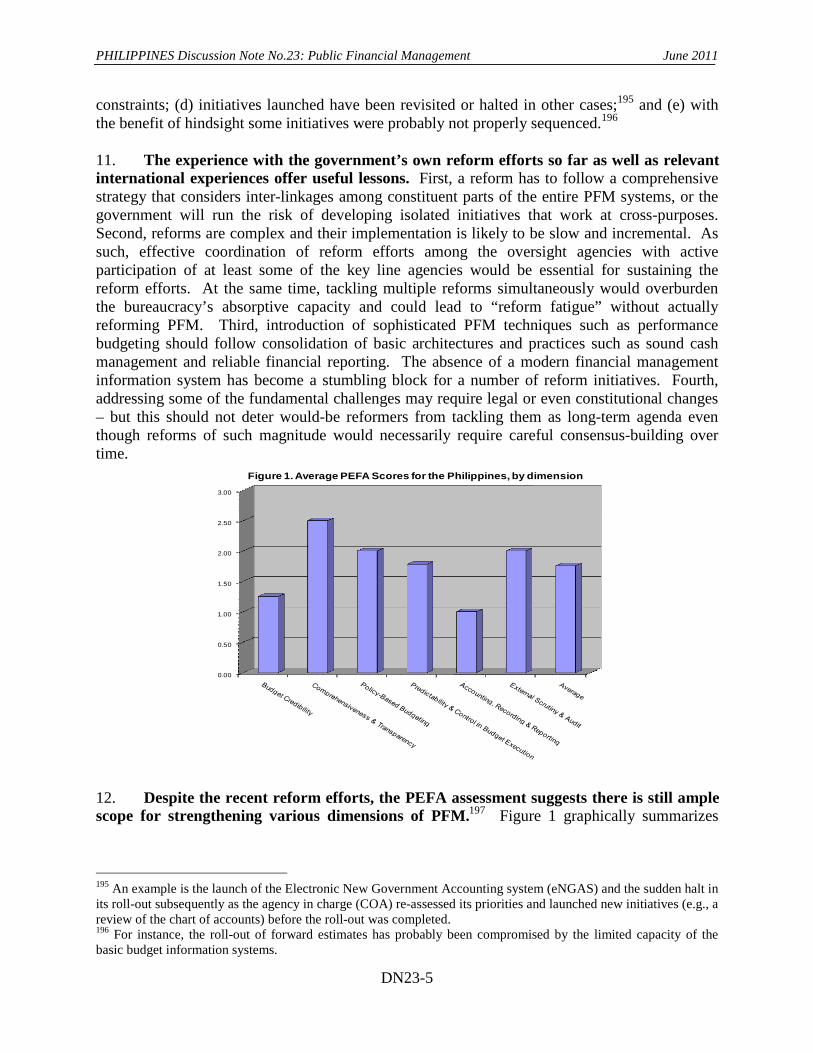
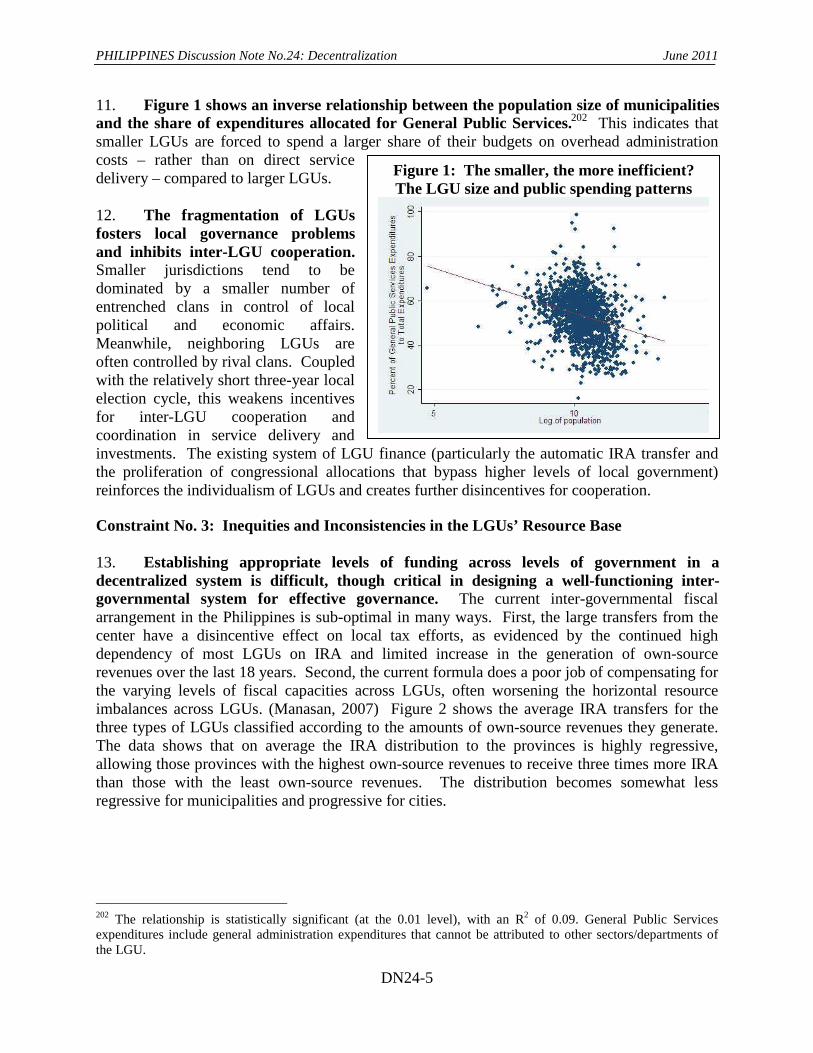
Lada Strelkova Ulrich Lachler Mark Woodward Jehan Arulpragasam
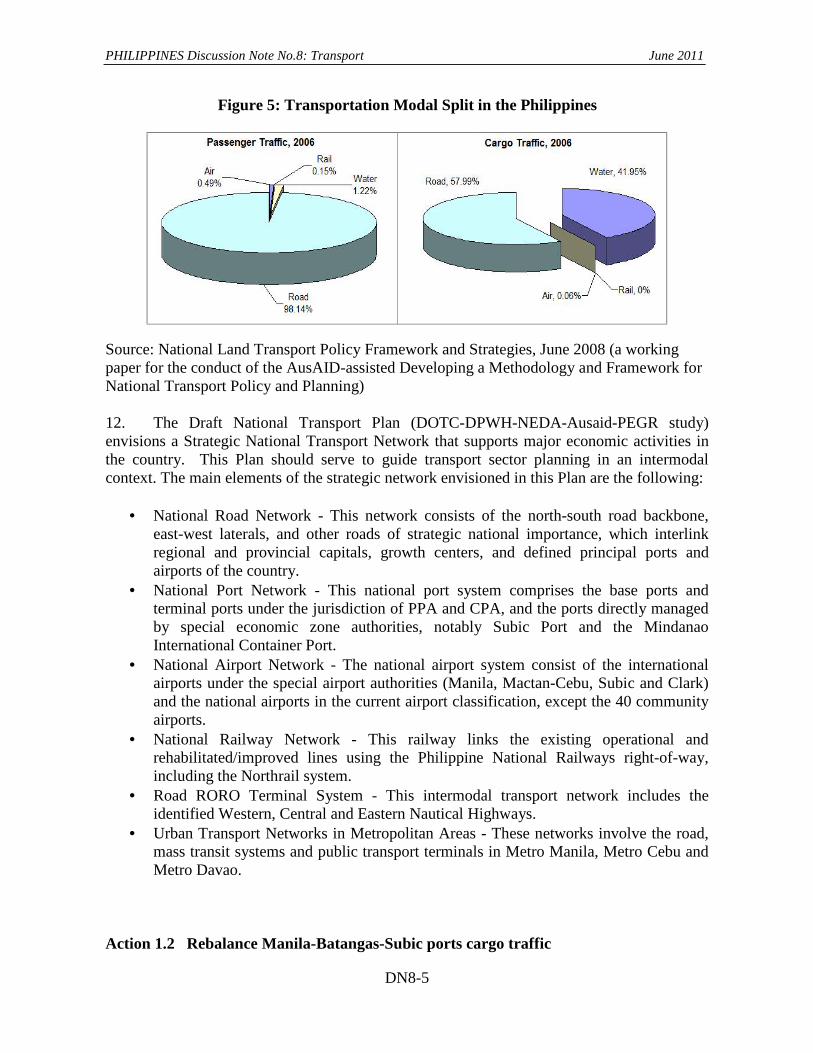
Magdi Amin
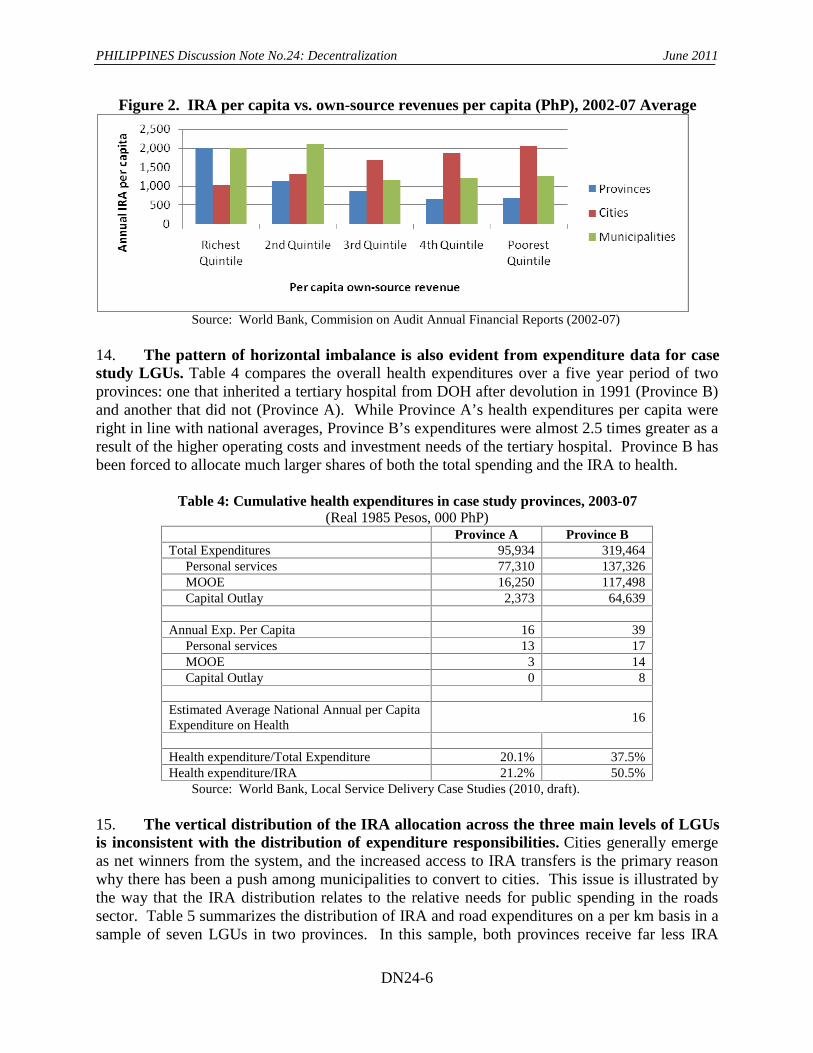
This report was prepared under the guidance of Bert Hofman, IBRD Country Director, and Jesse Ang, IFC Resident Representative, by a team led by: Lada Strelkova, Ulrich Lachler, Mark Woodward, and Jehan Arulpragasam. Daniella Gressani and Carlos Felipe Jaramillo served as peer reviewers.
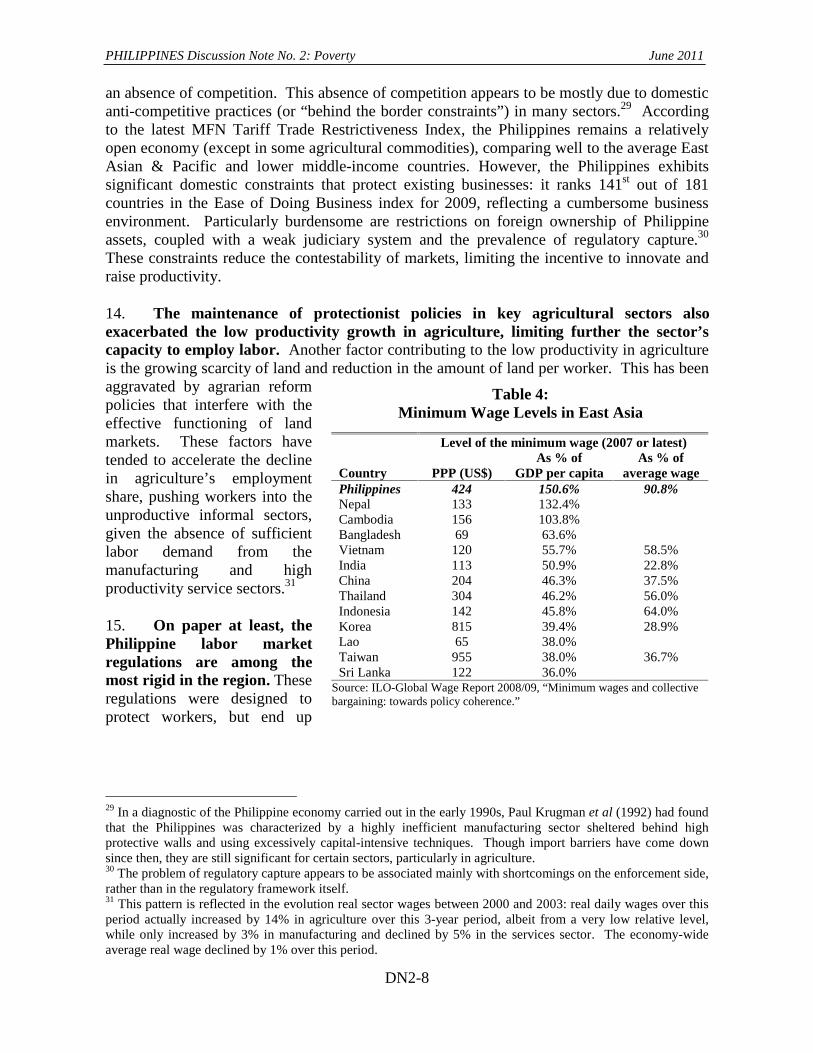
The following World Bank Group staff have made important contributions to the Philippines Discussion Notes: Ajay Tandon, Alan Townsend, Amitabha Mukherjee, Andrew Parker, Anne Sevilla, Baher El-Hifnawi, Ben Gericke, Carol Figueroa-Geron, Catherine Vidar, Christopher Ancheta, Christopher Pablo, David Llorito, Dennis Streveler, Douglas Forno, Eduardo Banzon, Eric Le Borgne, Fabrizio Bresciani, Felizardo Virtucio, Fermin Adriano, George Shieber, Gerardo Parco, Gerlin May U. Catangui, Iain Shuker, Jan Bojo, Josefo Tuyor, Junko Onishi, Karl Kendrick Chua, Lawrence Tang, Leonora Gonzales, Loraine Hawkins, Luisa Patricia Fernandez Delgado, Lynnette Dela Cruz Perez, Maribelle Zonaga, Maryse Gautier, Matthew Stephens, Maya Villaluz, Natasha Beschorner, Nora Moreno, Oscar Picazo, Patrick Labaste, Rajesh Pandey, Ramesh Siva, Rashiel Velarde, Roberto Rosadia, Rosa Alonso I. Terme, Rosechin Olfindo, Rozanno Rufino, Sarbani Chakraborty, Sheryll Namingit, Soonhwa Yi, Sudipto Sarkar, Victor Dato, Victor Dumas, Victor Vergara, Xiaoyan Liang, Yasuhiko Matsuda, and Zoe Elena Trohanis. Core team support was provided by: Maria Liberty Cardenas and Necitas Garcia; and Zafar Ahmed and Jayasankar Shivakumar (consultants).
Special thanks are extended to the Australian Agency for International Development (AusAID) for supporting the preparation of this report, and to Andrew Cumpston and Ken Vine of AusAID for their contribution to individual discussion notes.
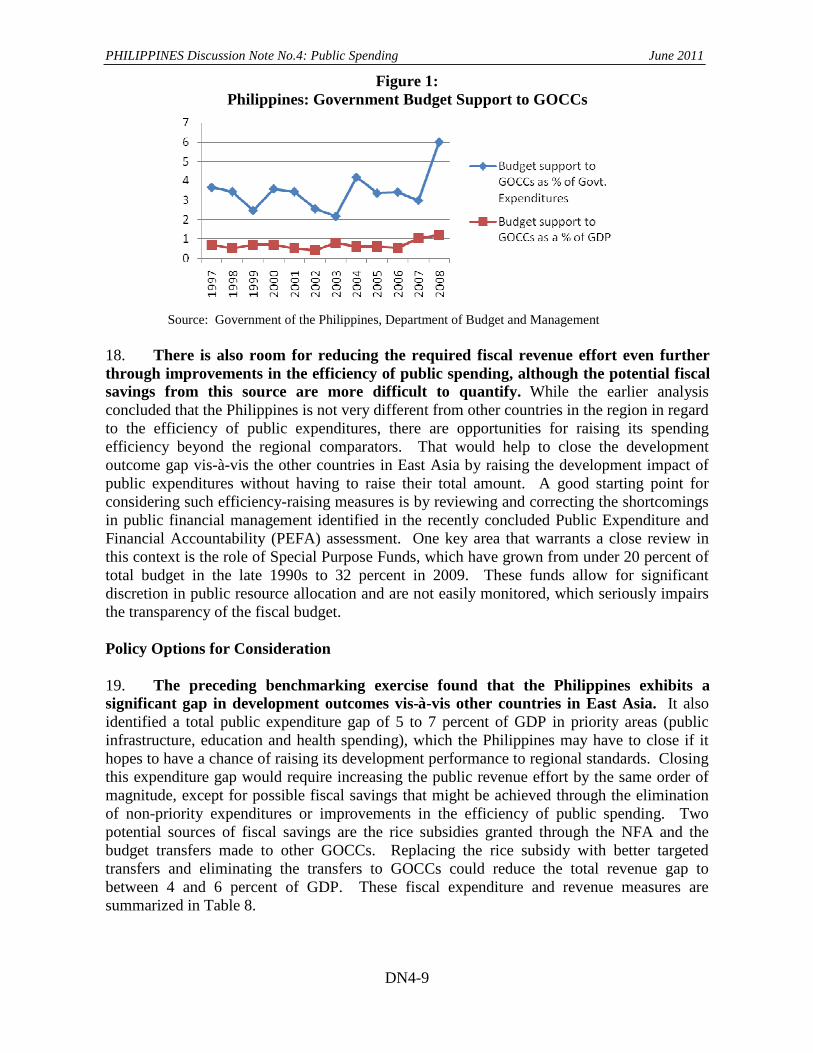
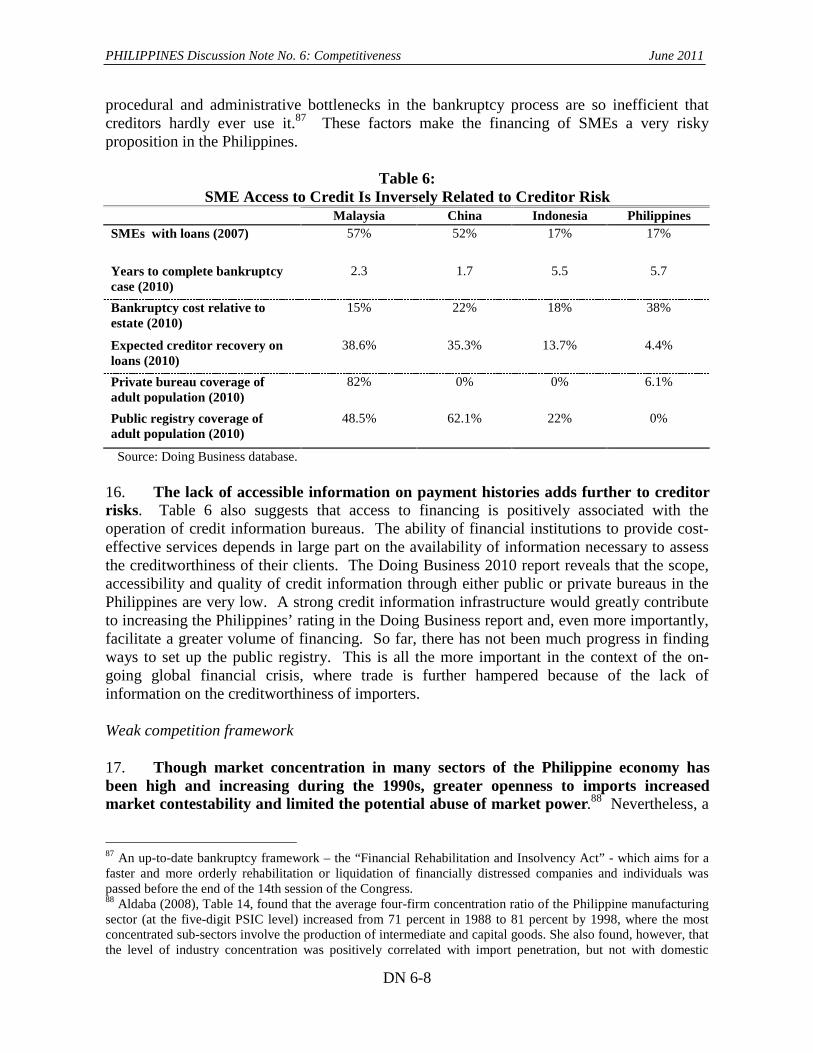
ACRONYMS AND ABBREVIATIONS
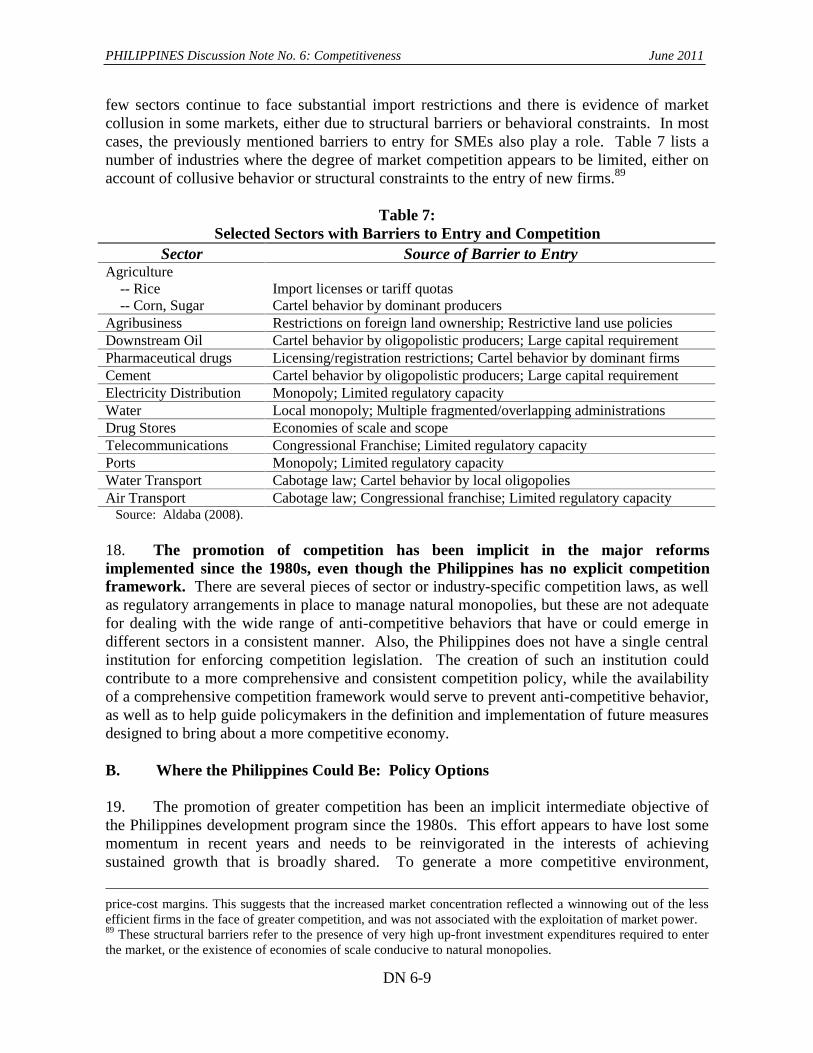
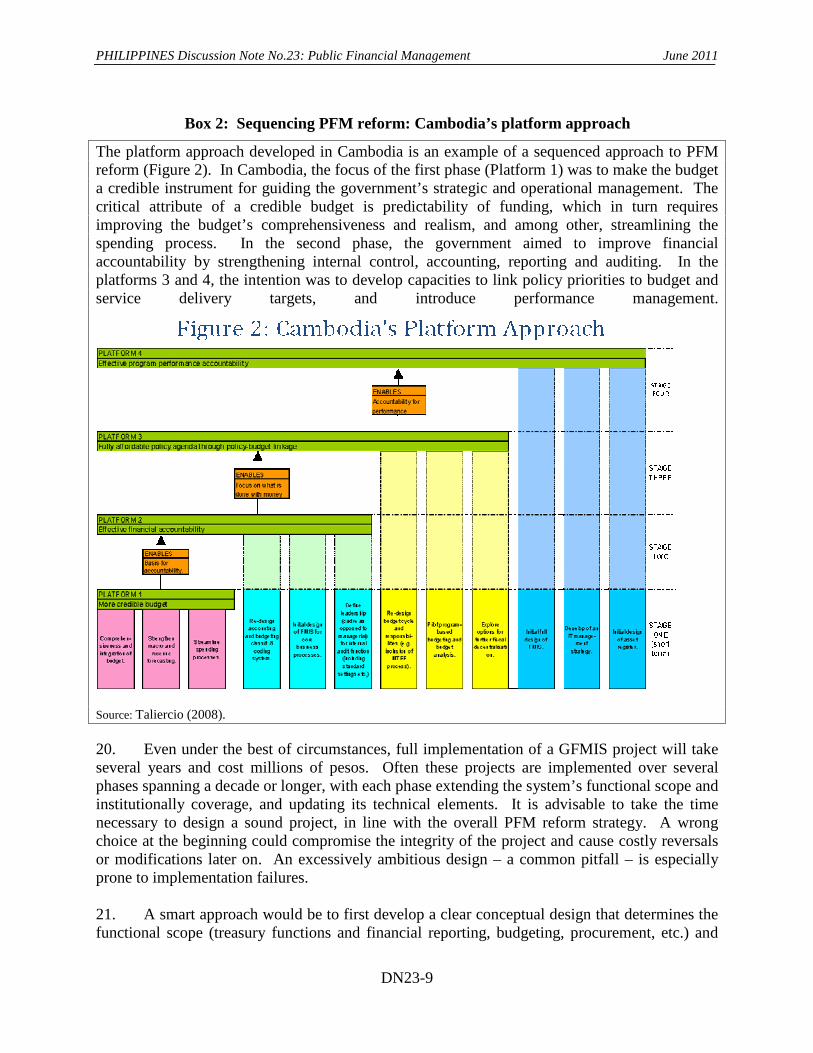
ABA-ROLI American Bar Association’s Rule of Law Initiative
ACEF Agriculture Competitiveness Enhancement Fund
AFMA Agriculture and Fishery Modernization Act
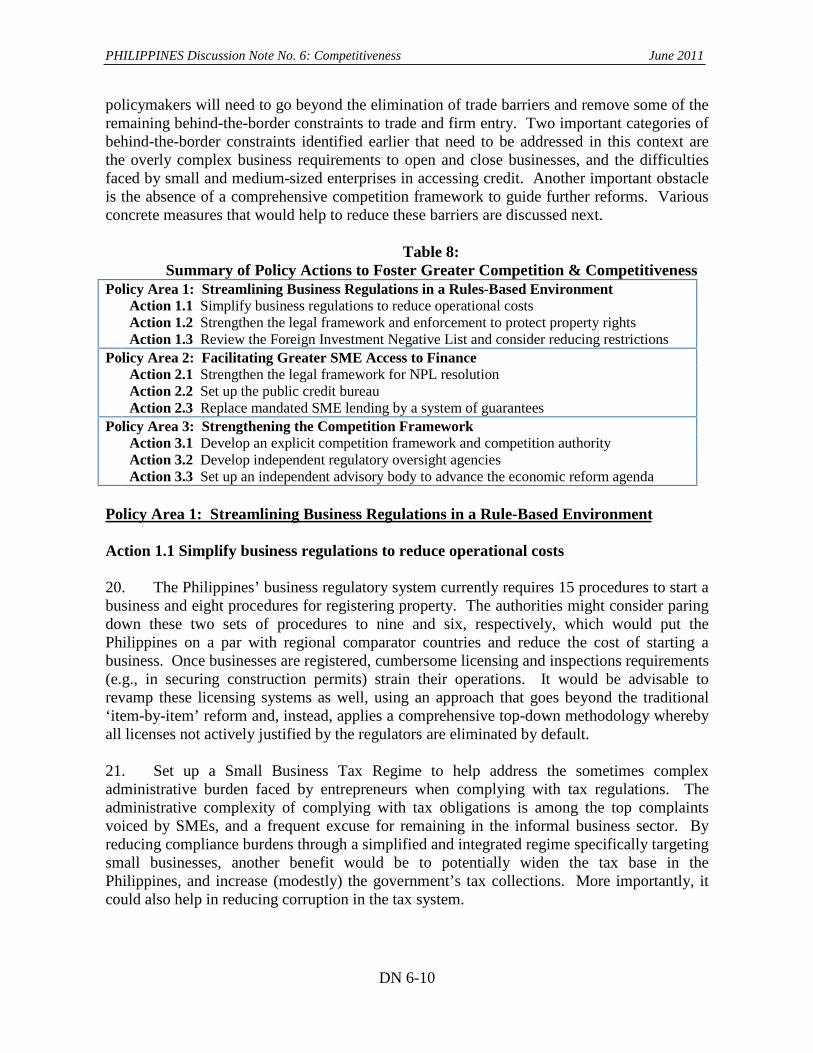
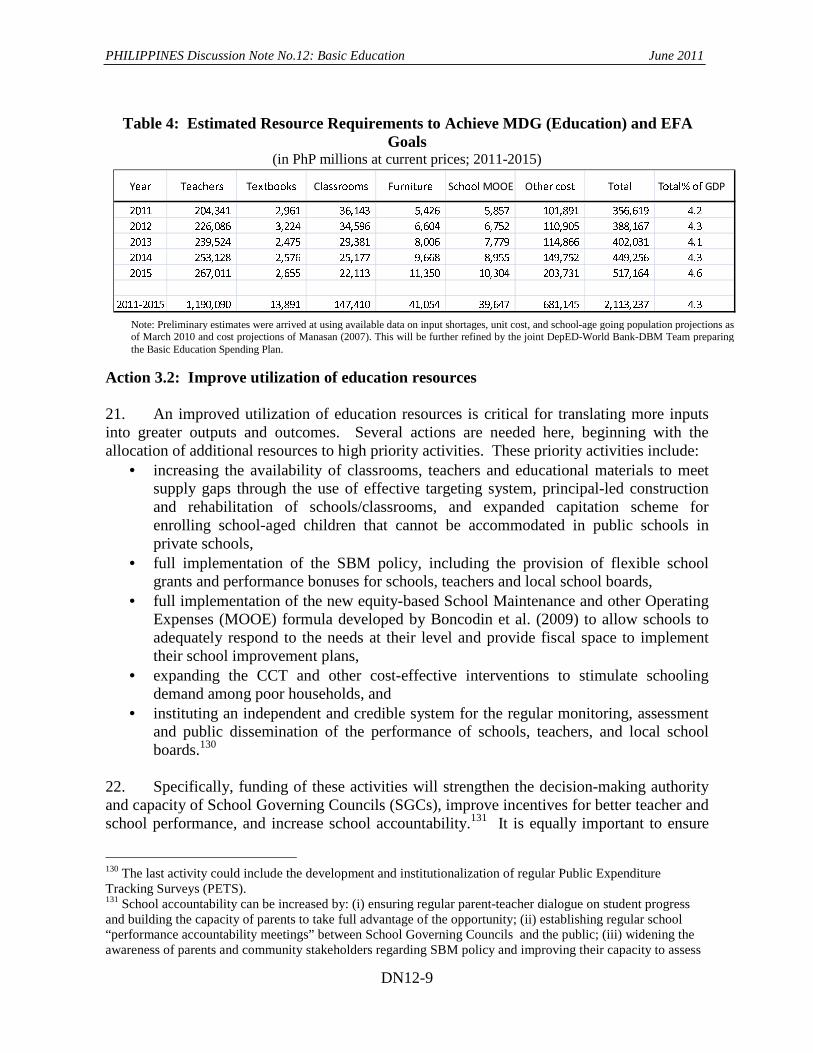
APIS Annual Poverty Indicator Survey APJR Action Program for Judicial Reform ARMM Autonomous Region in Muslim
Mindanao BAS Bureau of Agricultural Statistics BEAM Basic Education Assistance for
Mindanao BESF Budget of Expenditures and Sources
of Financing BIR Bureau of Internal Revenue BFAD Bureau of Food and Drugs BFAR Bureau of Fisheries and Aquatic
Resources BJE Bangsamoro Juridical Entity BLES Bureau of Labor and Employment
Statistics BOC Bureau of Customs BOD Burden of Disease BOT Build-Operate-Transfer BPAP Business Processing Association of
the Philippines BPO Business Process Outsourcing BSP Bangko Sentral ng Pilipinas CAAP Civil Aviation Authority of the
Information System CARP Comprehensive Agricultural Reform
Program CBA Cost-benefit analysis CBFM Community-Based Forest
Management CIT Corporate income tax CC Climate Change CCL Committee on Computerization and
Library CCT Conditional Cash Transfer CDD Community-driven development CDM Clean Development Mechanism CDS City Development Strategies CER Certified emission reduction CHED Commission on Higher Education CICT Commission on ICT CIIP Comprehensive and Integrated
Infrastructure Program
CIPHs City Investment Plans for Health CLUPs Comprehensive land use plans CMIS Case Management Information
System CO2 Carbon dioxide COA Commission on Audit CoST Construction Sector Transparency CPF Carbon Partnership Facility CSC Civil Service Commission CTF Clean Technology Fund CVOs Civilian Volunteer Organizations DA Department of Agriculture DAP Development Academy of the
Philippines DAR Department of Agrarian Reform DBM Department of Budget Management DENR Department of Environment and
Natural Resources DepED Department of Education DICT Department ICT DILG Department of Interior and Local
Government DMIA Diosdado Macapagal International
Airport DOE Department of Energy DOF Department of Finance DOH Department of Health DOJ Department of Justice DOLE Department of Labor and
Employment DOST Department of Science and
Technology DOTC Department of Transportation and
Communications DPWH Department of Public Works and
Highways DRRM Disaster Risk Reduction and
Management DSWD Department of Social Welfare and
Development EAP East Asia and Pacific EC Electric Cooperative e-CFM Enhanced Case Flow management ECPC Electronic Commerce Promotion
Council EFA Education-for-All EISP Enterprise Information Systems Plan EITI Extractive Industries Transparency
Initiative e-JOW Enhanced Justice on Wheels EMOC Emergency and Obstetric Care ENR Environment and Natural Resources EPIRA Electric Power Industry
Restructuring Act ERC Electricity Regulatory Commission ERR Economic rate of return ESC Education Service Contracting FAAP Federation of Accrediting Agencies
of the Philippines FAC Family Access Cards FDA Food and Drug Administration FIES Family Income and Expenditure
Surveys FLEMMS Functional Literacy, Education and
Mass Media Survey FMBO Financial Management and Budget
Office FOI Freedom of Information FSP Food-for-School Program FPA Final Peace Agreement FRI Financial Rehabilitation and
Insolvency FSI Floor-surface-index FSP Food-for-School Program GAA General Appropriations Act GCI Global Competitiveness Index GDP Gross Domestic Product GEF Global Environment Facility GER Gross enrolment rate GFDRR Global Facility for Disaster
Reduction and Recovery GFMIS Government financial management
information system GHGs Greenhouse gases GISP Government Information Systems
Plan GNP Gross National Product GOCCs Government-Owned and Controlled
Corporations GRS Grievance Redress System HEI Higher education institutes HDI Human Development Index HRH Human Resources for Health HSRA Health Sector Reform Agenda HUDCC Housing and Urban Development
Coordinating Council IBP Integrated Bar of the Philippines ICC Interagency Coordination
Committee ICOR Incremental Capital-Output Ratio ICG International Contact Group ICT Information and Communications
Technology IDPs Internally displaced persons IFC International Finance Corporation ILO International Labour Organization IMF International Monetary Fund IMR Infant Mortality Rate IMT International Monitoring Team
IP Indigenous people IPPUC Institute of Research and Urban
Planning of Curitiba IRA Individual Retirement Arrangement IRA Internal Revenue Allotment IRR Implementing rules and regulations IRRI International Rice Research Institute ISCED International Standard Classification
of Education ISPs Internet Service Providers ITES IT-enabled services ITU Internet User JCMS Judiciary Case Management System JRI Judicial Reform index JURIS Justice Reform Initiatives Support KALAHI-CIDSS
Kapitbisig Laban sa Kahirapan –Comprehensive and Integrated Delivery of Social Services
KDP Kecamatan Development Program KFR Kidnap-for-ransom LDF Local Development Fund LFS Labor Force Survey LGC Local Government Code LGU Local Government Unit LPI Logistics Performance Index LRT Light Rail Transport LRTA Light Rail Transport Authority LSMS Living Standard Measurement
Survey LTS Large taxpayers’ service LTFRB Land Transportation and Franchise
Regulatory Board LUCs Local Universities and Colleges LWUA Local Water Utilities Administration MA-TTRI Market Access Tariff Trade
Restrictiveness Index MDGs Millennium Development Goals MERALCO Manila Electric Company MeTCs Metropolitan Trial Courts MFIs Microfinance Institutions MILF Moro Islamic Liberation Front MISO Management Systems Information
Office MMR Maternal Mortality Rate MNLF Moro National Liberation Front MOA-AD Memorandum of Agreement on
Ancestral Domain MOOE Maintenance and other Operating
Expenses MPAs Marine protected areas MuTCs Municipal Trial Courts MVUC Motor Vehicle User’s Charge MRT Mass Rail Transit MRDP MISO Re-engineering and
Development Plan MSAs Major Statistical Agencies
MSME Micro small and medium-sized enterprises
MTEF Medium-Term Expenditure Framework
MTPDP Medium Term Philippine Development Plan
MT Metric Tons MWCI Manila Water Company, Inc. MWSS Metropolitan Waterworks and
Sewerage System NAIA3 Ninoy Aquino International Airport
Terminal 3 NAPC National Anti-Poverty Commission NAT National Achievement Test NCC National Computer Centre NCD Non-Communicable Diseases NCR National Capital Region NCBTS National Competency-Based
Teacher Standards NDCC National Disaster Coordinating
Council NDHS National Demographic and Health
Survey NEA National Electrification
Administration NEDA National Economic and
Development Authority NER Net Enrollment Rate NESTS National Environmentally
Sustainable Transport Strategy NFA National Food Authority NGAs National Government Agencies NGICS National Guidelines on Internal
Control Systems NGO Non-governmental organizations NGPC National Grid Company of the
Philippines NHIP National Health Insurance Program NHTS-PR National Household Target System
for Poverty Reduction NITC National Information Technology
Council NTS National Tax Services NPC National Power Company NPC-SPUG National Power Company Small
Power Utilities Group NPL Non-Performing Loans NSCB National Statistical Coordination
Board NSO National Statistics Office NSSHRP National Sector Support for Health
Reform Project NTC National Telecommunications
Commission NWRD National Water Regulatory Board OECD Organization for Economic Co-
operation and Development OFW Overseas workers OJTs On-the-job trainings OMB Office of the Ombudsman OOP Out-of-pocket payments OPIF Organizational Performance
Indicator Framework OPRCs Output and performance-based road
contracts 4Ps Pantawid Pamilyang Pilipino
Program PAGC Presidential Anti-Graft Commission PAMBs Protected Area Management Boards PCIC Philippine Crop Insurance
Corporation PDAF Priority Development Assistance
Fund PDP Philippine Development Plan PEFA Public Expenditure and Financial
Accountability PEP Philippine Environmental Policy PER Public Expenditure Review PESFA Private Education Student Financial
Assistance PETS Public Expenditure Tracking
Surveys PDNA Post-Disaster Needs Assessment PFM Public Financial Management PhilHealth Philippine Health Insurance
Corporation’s PHILJA Philippines Judicial Academy PHIC Philippines Health insurance
Corporation PIPH Provincial Investment Plans for
Health PIT Personal Income tax PLDT Philippine Long Distance Telephone
Company PMCO Philippines Mediation Centre office PMT Proxy-Means Testing PPA Philippine Ports Authority PPP Public-Private Partnerships PSALM Power Sector Asset and Liability
Management PSDP Philippine Statistical Development
Program PSNA Philippine System of National
Accounts PSS Philippine Statistical System QAAF Quality Assurance and
RHUs Rural Health Units RORO Roll-on-roll-off RTCs Regional Trial Courts SAE Small Area Estimates SALN Statements of Assets, Liabilities and
Net Worth SAOBs Statements of Allotments and
Obligations Balances SBM School-Based Management SBMA Subic Bay Metropolitan Authority SCC Small Claims Courts SCM Subsidies and Countervailing
Measures SC-MISO Supreme Court’s Management
Information System SDC Social Development Committee SDDS Special Data Dissemination System SEC Securities and Exchange
Commission SEP Self-employed professionals SGCs School Governing Councils SHI Social Health Insurance SIJ Strengthening the Integrity of
Judiciary SMEs Small and Medium-sized Enterprises SNAP Strategic National Action Plan SNITS Simplified Net Income Taxation
Scheme SP Sponsored Program SPFs Special Purpose Funds
SPSC Social Protection Sub-Committee SRTC Statistical Research and Training
Center SUCs State Universities and Colleges SWS Social Weather Station SZOPAD Special Zones for Peace and
Development Tariff-TRI Tariff Trade Restrictiveness Index TEEP Third Elementary Education Project TESDA Technical Education and Skills
Development Authority Telof Telecommunications Office TDRs Transferable Development Rights TFR Total Fertility Rate TIMMS Trends in International Math and
Science Study TRB Toll Regulatory Board TRO Temporary Restraining Order UMID Unified Multipurpose Identification UNESCO United Nations Educational,
Scientific and Cultural Organization UNFCCC United Nations Framework
Convention on Climate Change UPP Urban Poverty Program VAT Value-added Tax WESM Wholesale Electricity Spot Market WHSMP Women’s Health and Safe
Motherhood Project WMO World Meteorological Organization WTO World Trade Organization
Philippines Discussion Notes Challenges and Options for 2010 and Beyond
Table of Contents
DN No. OVERVIEW …………………………………………………………………..….….. i Economic Growth ...…………………..………………………………………..... DN 1 Poverty …………………………………………………………………………… DN 2 I. STABLE MACRO ECONOMY
Tax Policy and Administration …………………………………………….……. DN 3 Public Spending ……………..……………………………………..………….... DN 4 Fiscal Risk ………………………………………………………………………. DN 5
II. IMPROVED INVESTMENT CLIMATE
Competitiveness …………………………………………………………..…….. DN 6 Energy …………………………………………………………………………… DN 7 Transport ………………………………………………………………………… DN 8 Information and Communications Technology …………………………..….…. DN 9 Agribusiness …………..…………………………………….………………….. DN 10
III. BETTER PUBLIC SERVICE DELIVERY
Health …………………………………………………….…………………….. DN 11 Basic Education …..…………………........…………….……………………… DN 12 Higher Education ………………………....………………….………………… DN 13 Water and Sanitation ……………………………………………………..…….. DN 14 Urbanization ...…………………………………..……………………………… DN 15 Community-Driven Development. …………………………………………….. DN 16
IV. REDUCED VULNERABILITIES
Social Protection ………………………………………………………………… DN 17 Disaster Risk Management ……………………………………………………… DN 18 Climate Change …………………………………………………………….…… DN 19 Environment …………………………………………………………………….. DN 20 Peace and Development ……………………………………..…………………... DN 21
Philippines Discussion Notes Challenges and Options for 2010 and Beyond
OVERVIEW
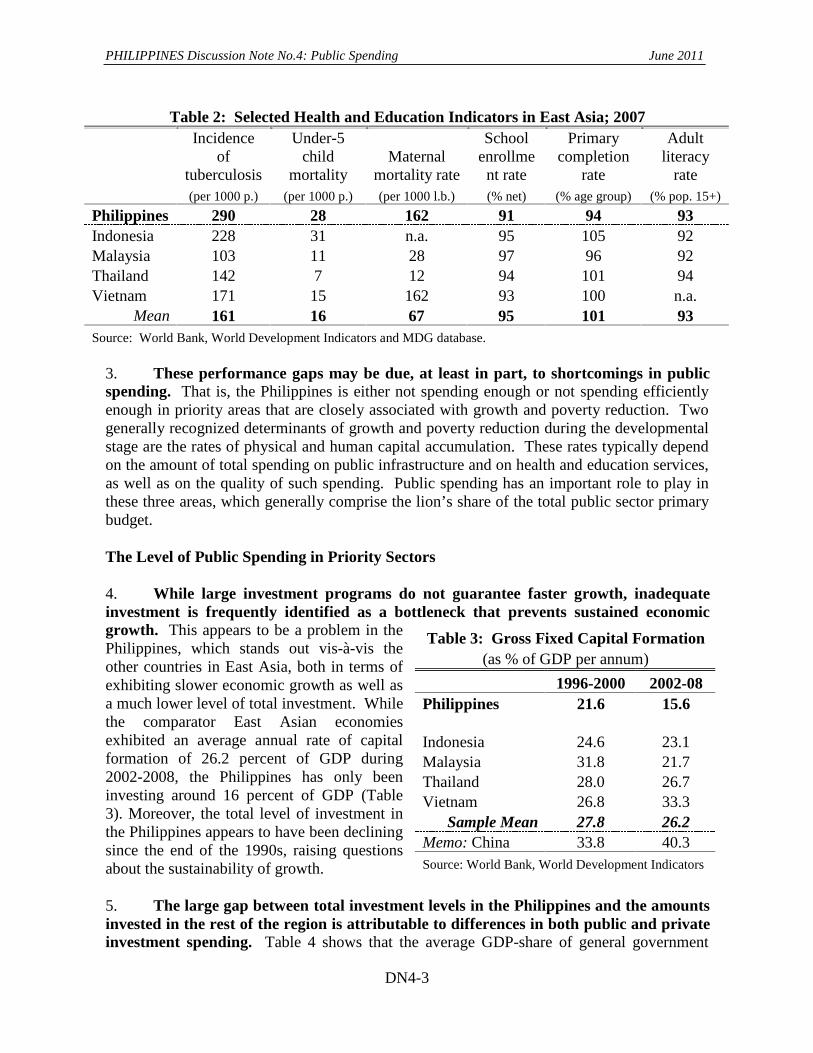
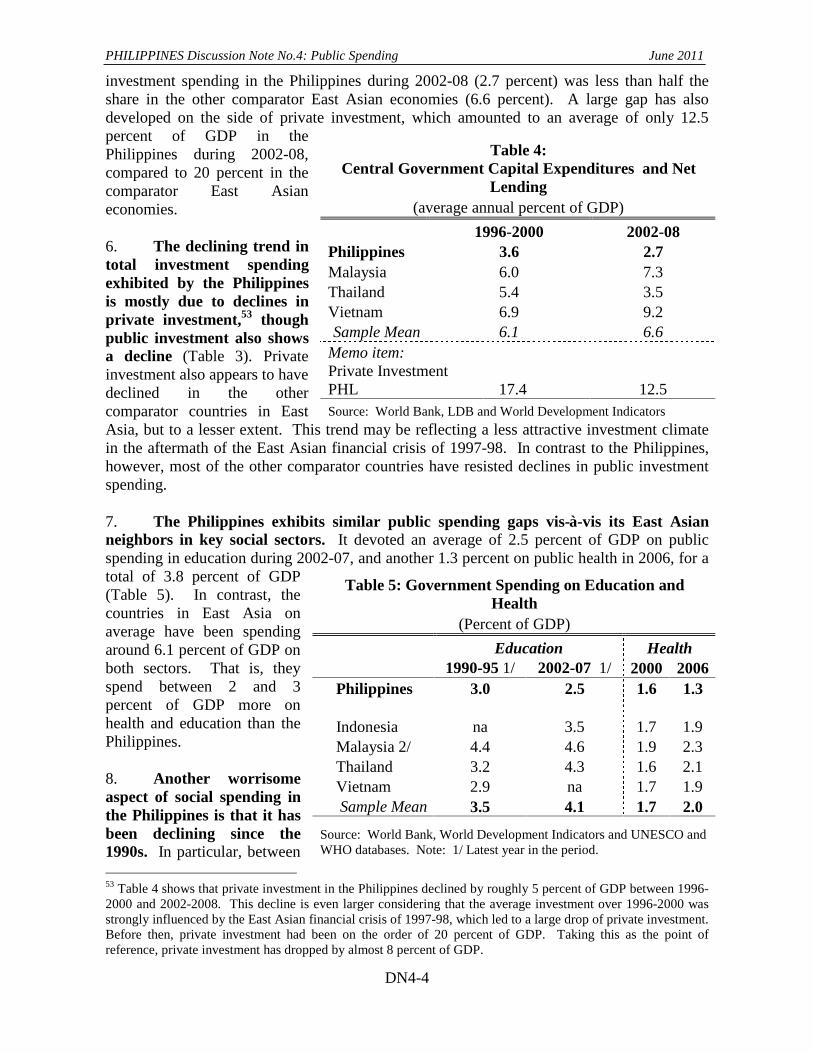
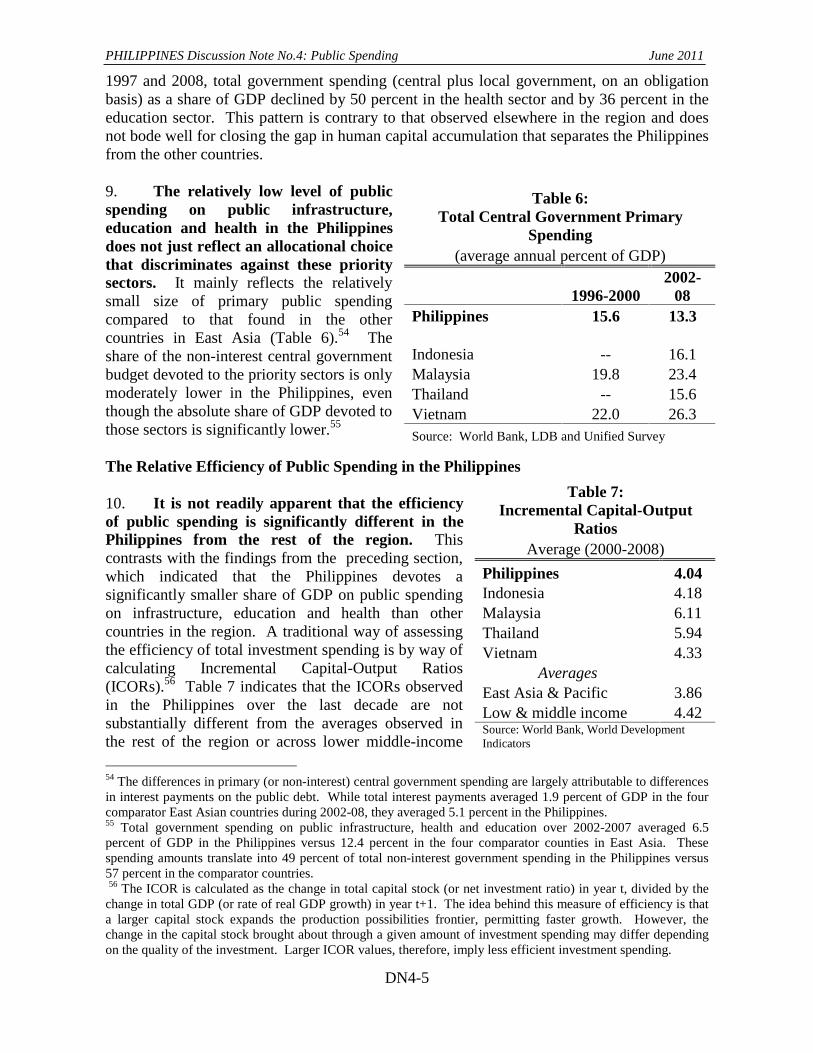
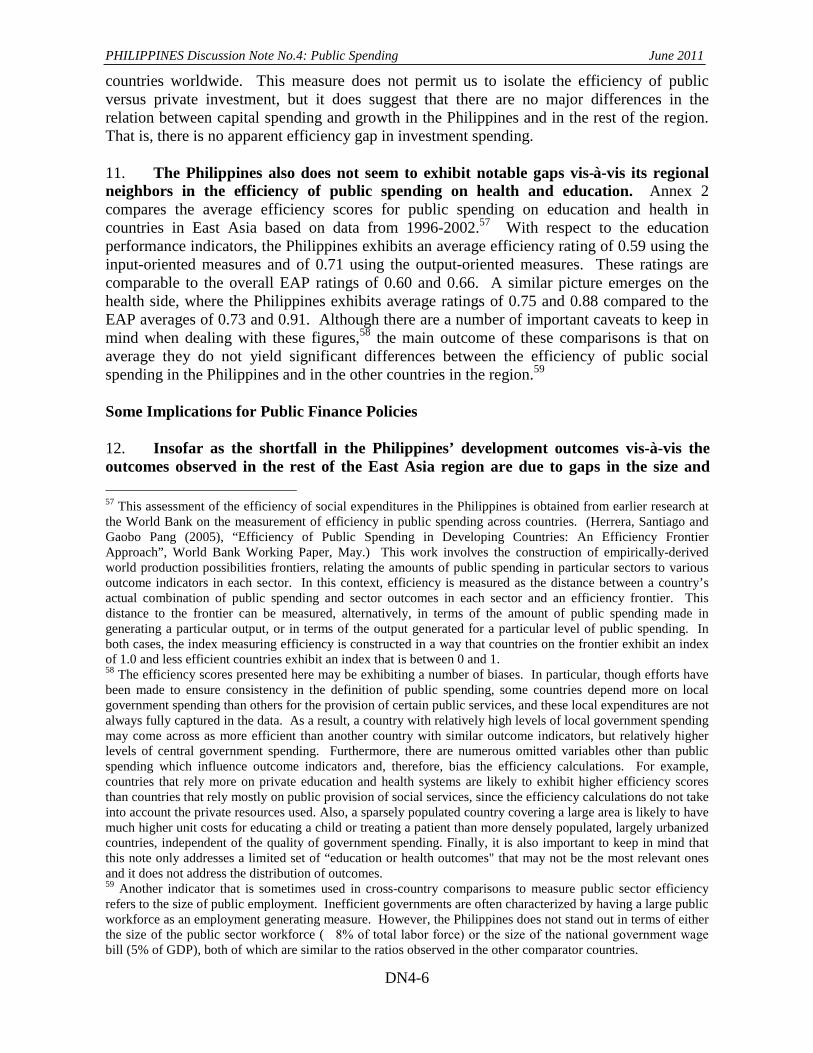
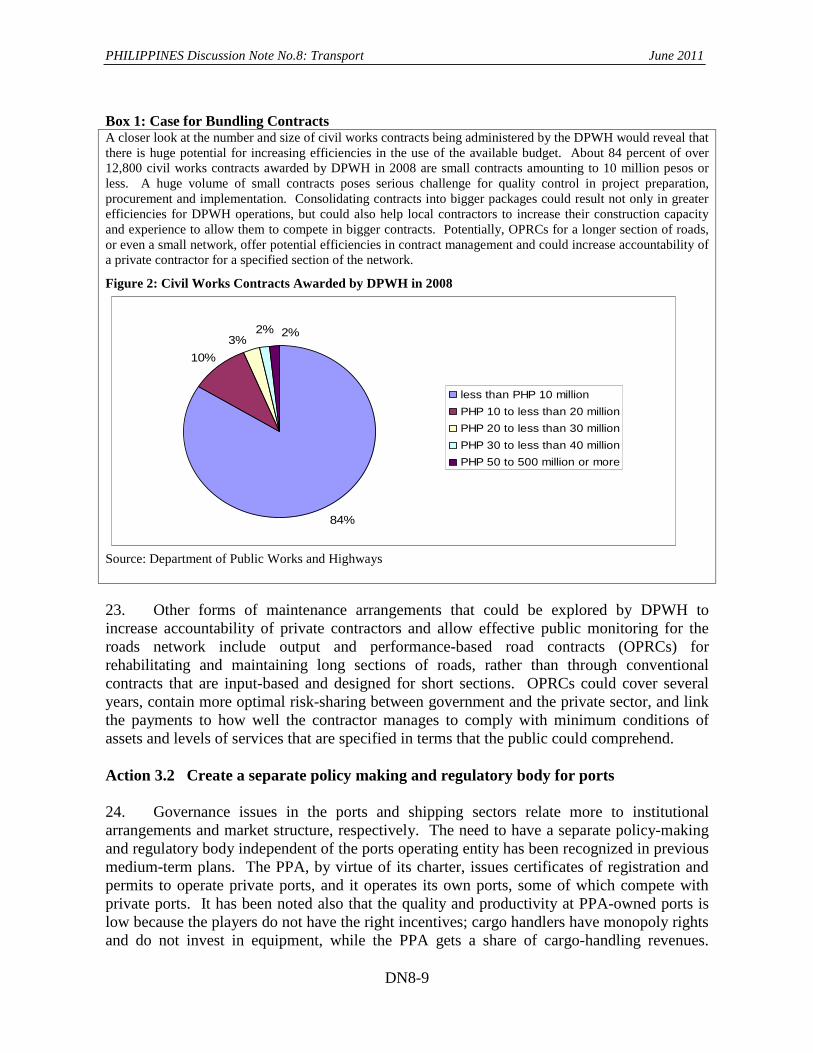
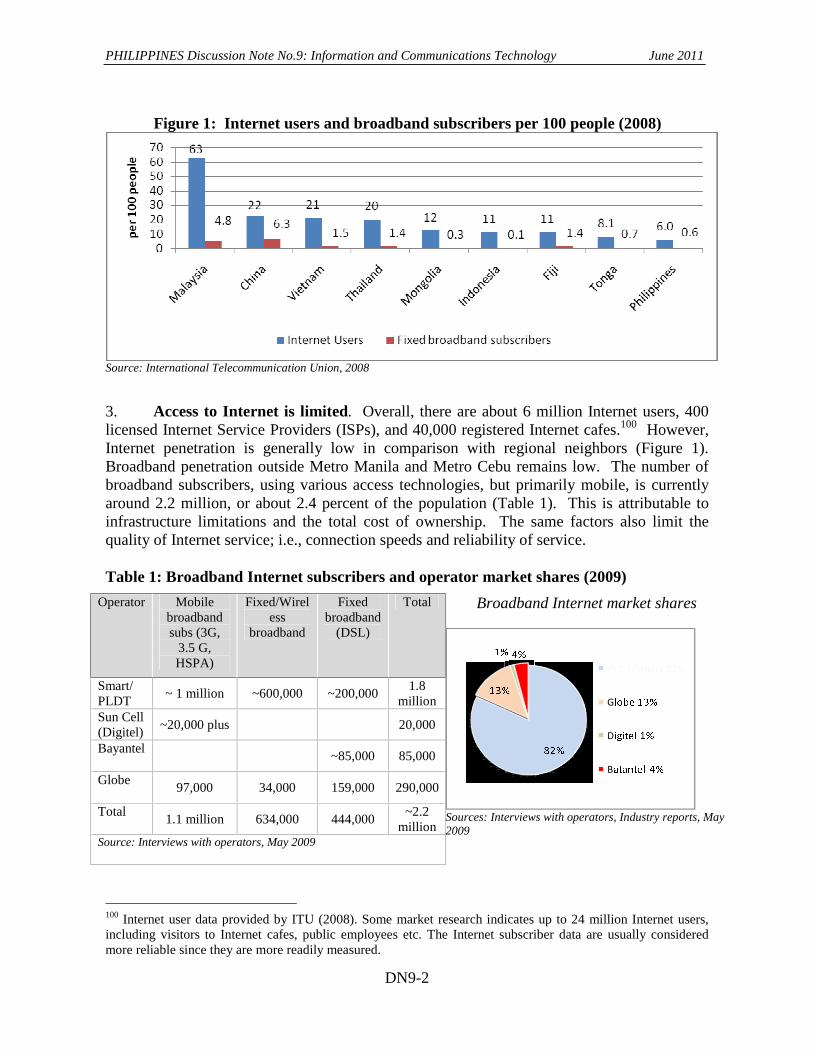
INTRODUCTION 1. With the global economy on the way to recovery from the financial crisis, the Asian economies appear poised to bounce back strongly. For most people in the Philippines, however, a return to the status quo ante would offer little consolation. That is because when economic growth accelerated during 2002-08, poverty did not decline as hoped. With a third of the population currently below the poverty line, and high and rising inequality in incomes, the country’s main development challenge is to achieve growth that is much more widely shared—to make growth work for the poor. 2. The new administration that assumed office on June 30, 2010 faces significant opportunities as well as considerable challenges: an opportunity for new policy directions and new coalitions to push the development agenda forward with renewed vigor, but a need to overcome the inertial forces that slow down decision making and program implementation during a transition. These Discussion Notes have been prepared to help inform policy discussions in the period leading up to and following the 2010 elections. Their aim is to support the creating of a shared focus among government, civil society, business groups, and development partners on the key elements of a long-term development strategy focused on inclusive growth. Deliberately selective in their coverage, the Notes offer sectoral and thematic analyses to identify key challenges, and recommend a prioritized set of actions for consideration by the new government. The actions are consistent with the long-term strategy envisaged in the Notes and can in most cases be implemented immediately, building on successes. The analysis draws on extensive international experience and worldwide best practices, as well as past experience with what works well in the Philippines and what does not. 3. The vision underlying the Notes is one of inclusive growth, characterized by improved income opportunities and enhanced abilities of households and communities, especially the poor, to participate in markets through strengthened human capital, reduced vulnerability to shocks, and increased economic empowerment. While there are difficult choices to be made, the proposed actions could evoke strong support from key stakeholders, particularly from beneficiaries and front-line implementing agencies, as well as from development partners. KEY MESSAGES 4. For the Philippines, the main building blocks for achieving more inclusive growth are continued macroeconomic stability, an improved investment climate, better public services for the poor, and stronger protection against income shocks. An overarching challenge in the pursuit of development in the Philippines is to achieve better governance. The quality of
PHILIPPINES Discussion Notes: Overview June 2011
ii
governance is a recognized constraint on sustained growth and poverty reduction, and its improvement is a development goal aspired to by Filipinos in its own right. ¾ To maintain macroeconomic stability and cope with increased macroeconomic
uncertainty, special attention is needed to: • Strengthen the fiscal revenue base, • Improve public expenditure efficiency and targeting, and • Develop institutions for better fiscal risk management.
¾ To improve the investment climate it will be important to create an enabling business
environment by: • Promoting competitiveness, • Developing better models of infrastructure finance and management, particularly in
energy, transport, and information and communications technology (ICT) in unserved and under-served areas of the country, and
• Enhancing productivity and employment, especially in sectors of particular importance to the poor, such as agriculture.
¾ To increase the poor’s access to better public services it is important to:
• Deepen the reform agendas in key public services sectors such as basic education, health, and early childhood development, and
• Expand delivery of basic services such as water and sanitation, and urban services. ¾ To reduce vulnerabilities, actions are needed to:
• Expand and rationalize the country’s social safety net, • Engage in pro-active disaster risk reduction and management actions, and • Mainstream climate-change adaptation measures in policies, plans and programs and
expand climate-change mitigation programs in key sectors where emissions are on the rise.
¾ Good governance requires more capable and accountable government institutions at the
national, local, and agency levels. To develop such institutions requires actions to: • Strengthen core governance systems in public financial management, • Mitigate binding constraints that weaken LGU performance, including addressing
weak systems for LGU accountability, addressing hyper-fragmentation among LGUs, and improving LGUs’ resource bases, and
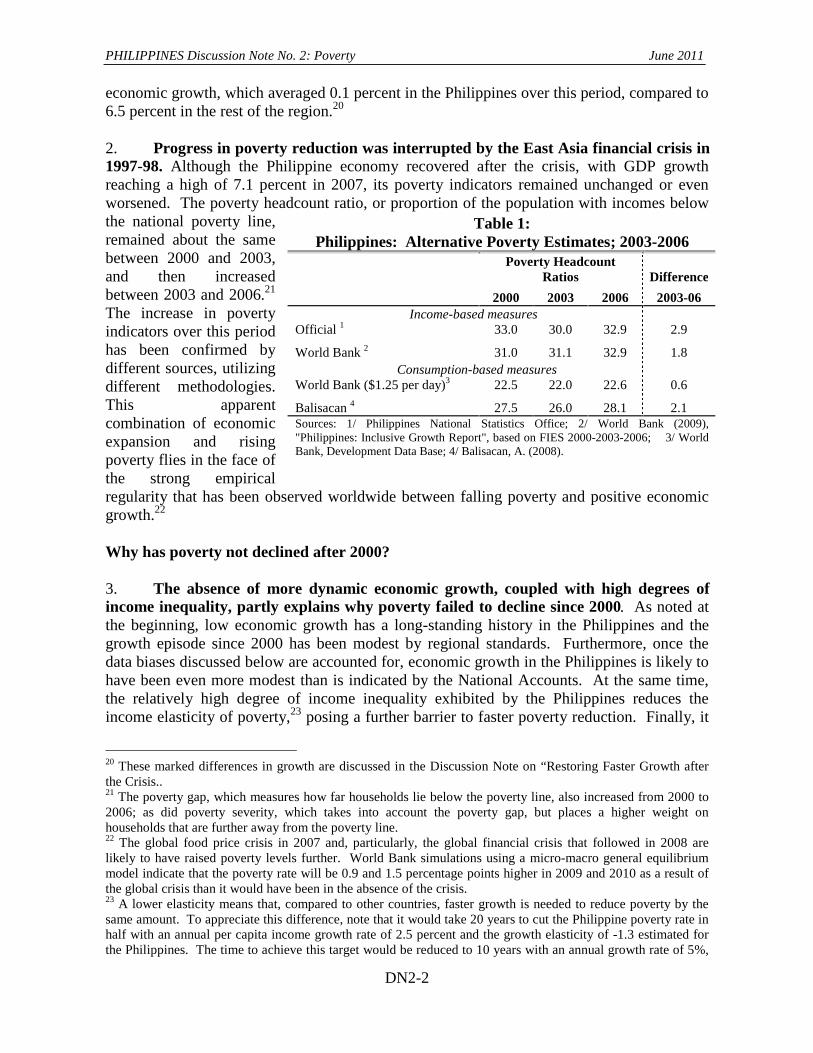
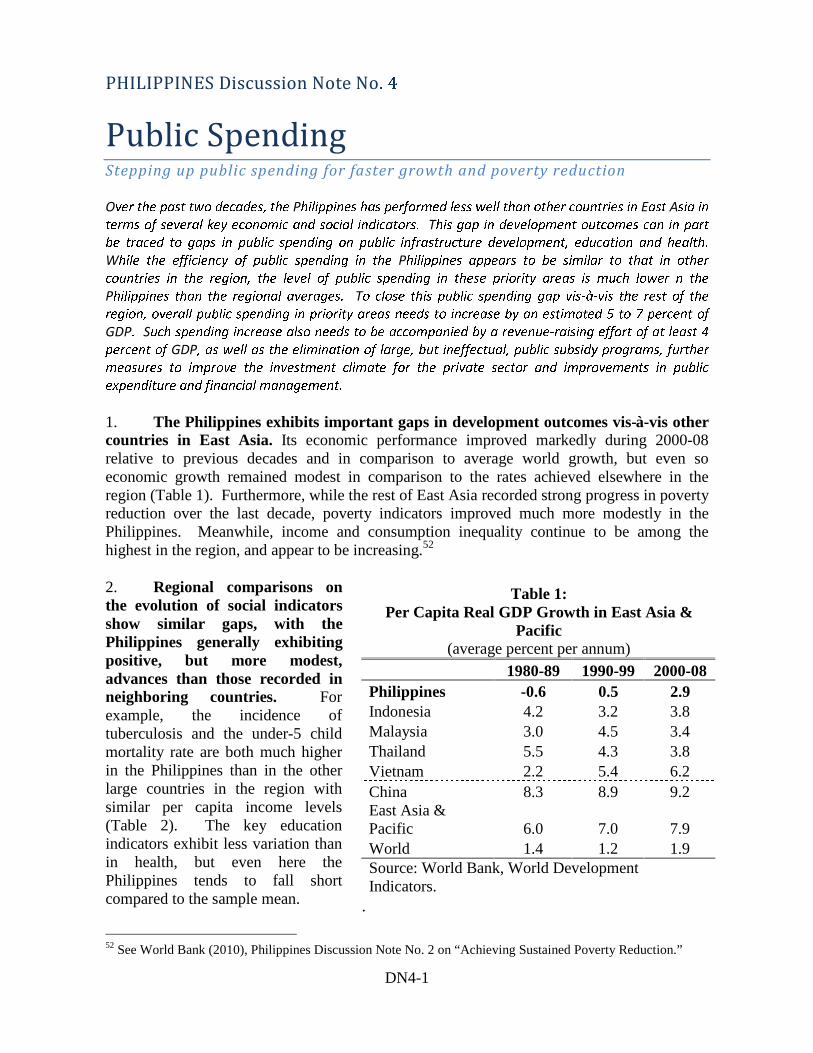
• Improve statistics and strengthen capacity of statistical agencies. PRIORITY POLICY ACTIONS 5. The 2006 household survey showed that though economic performance had improved since 2000, poverty reduction had not. Various factors explain the persistence of poverty, including slow economic growth and high inequality. Even though per capita GDP has been rising since 2000, real household incomes have been declining and considerable circumstantial evidence shows that income distribution has deteriorated, partly because of an
PHILIPPINES Discussion Notes: Overview June 2011
iii
unequal sectoral and regional distribution of growth, and partly because of barriers to factor mobility across sectors and regions. 6. To reduce poverty, faster economic growth is essential. Recent diagnostic studies point to three key constraints on growth in the Philippines: (i) a vulnerable fiscal situation, due largely to weaknesses in tax collection, (ii) inadequate infrastructure, particularly in transport and energy, and (iii) a weak investment climate, largely because of governance concerns. Reforms in these areas have been pending for a long time and it is difficult to envisage a sustained resumption of growth without major improvements in all three. 7. Eliminating these constraints is essential for restoring growth, but may not be enough for accelerating poverty reduction. Policymakers also need to be concerned about the distributional consequences of growth and ensure that it is sufficiently broad-based. This requires the removal of policy biases against low-skill labor employment and of barriers to factor mobility across regions and sectors. Such actions are needed to encourage the fastest growing sectors in the economy (such as manufacturing) to absorb more low-skilled labor (the poor’s main asset) and to encourage the most labor intensive sectors (such as agriculture) to grow faster and, thereby, generate more employment opportunities. These actions also are needed to allow workers to migrate from the slowest growing regions and sectors to the faster growing ones, thus maximizing their income earning opportunities. At the same time, actions are needed to upgrade workers’ human capital, enabling their participation in more productive activities.
I. Maintaining Macroeconomic Stability 8. The Philippines succeeded in maintaining macroeconomic stability despite the recent adverse developments associated with the global financial crisis. In 2009, as world GDP contracted, the Philippines’ GDP continued to grow by 0.9 percent, supported by private consumption spending that was partly fueled by remittance inflows and expansionary fiscal spending. Thanks to previous fiscal consolidation efforts, the government was able to undertake a countercyclical fiscal policy to address the economic slowdown. This has resulted in the largest fiscal easing in more than two decades. Meanwhile, prices have been stable and the balance of payments has remained strong throughout the past two years, also in large part due to the steady inflow of workers’ remittances. The economy is now recovering from the 2008-09 global recession, and the challenge will be to keep this recovery on track while the government mends its structural fiscal balance, which was weakened by the earlier countercyclical measures (a large part of which are permanent in nature), and while the central bank implements an exit strategy from its extraordinary crisis-related liquidity-support and easy monetary stance.
9. Aside from maintaining good macroeconomic management, the government also needs to address issues of medium and longer-term fiscal sustainability. To achieve sustained poverty reduction, access to essential public services needs to be expanded without jeopardizing fiscal stability. Policy actions to speed up economic growth will need to focus on strengthening tax policy and administration, significantly raising the public investment effort over the next five years, and improving governance to create a better climate for private investment.
PHILIPPINES Discussion Notes: Overview June 2011
iv
Improving public expenditure efficiency and targeting
10. The Philippines lags behind other East Asian countries in several key areas of economic and social development, largely because of its lower public spending on infrastructure development, education, and health. To achieve regional spending parity, the Philippines would have to increase public spending in these priority sectors by a combined 5 to 7 percent of GDP. In particular, public investment spending on infrastructure falls short of the regional average by 3 to 4 percent of GDP, while public spending on education and health falls short by 2 to 3 percent of GDP. This combined spending gap can be financed partly by strengthening public financial management and by eliminating large, ineffectual public subsidy programs. In this last regard, it is advisable to phase out the National Food Authority (NFA) rice subsidy and transfer part of the fiscal savings to the Conditional Cash Transfer (CCT) program. The fiscal savings achieved through these measures, however, will not suffice to close the entire spending gap. Moreover, since NFA is off-budget, the replacement of NFA spending by CCT spending would increase the central government deficit, even though it leaves the overall non-financial public sector deficit unchanged. Therefore, additional revenues on the order of 4 percent of GDP will also be needed to close this spending gap.
Strengthening the fiscal revenue base
11. The government will face an increased likelihood of a fiscal crisis if public expenditures are expanded without adequate increases in public revenues that reverse the decline in tax collection that has taken place since 2007. To raise revenues in the amount indicated above, the government has various options for improving tax administration and tax policies. There are some immediate actions that the government can take to raise revenues through improved governance in tax administration, such as (i) the adoption of performance indicators in the Bureau of Internal Revenues (BIR) and approval of the BIR’s rationalization plan, and (ii) obligating the public disclosure of all assets and net worth of BIR managers, accompanied by random audits. Other important reforms include actions to strengthen the BIR’s and BOC’s capacity to prevent smuggling and detect tax evasion. In this connection, the partial lifting of the bank secrecy law and outsourcing of key customs tasks to external contractors could yield major improvements in tax collection. Such tax administrative reforms, however, would not be expected to generate more than 1 to 2 percent of GDP in the best of circumstances. To close the spending gap identified earlier, therefore, some reliance on tax policy reforms is also likely to be needed. Reforms of the excise tax and VAT systems to increase yields offer “quick win” solutions because they could be introduced quite rapidly, raising revenues immediately and, on aggregate, equitably. Specific short-term measures that can be considered include: (i) raising excises on petroleum products, (ii) rationalizing and increasing excise taxes on tobacco and alcohol, (iii) broadening of the VAT base, reversing the progressive proliferation of exemptions that took place in recent years, and (iv) indexing all excise taxes to inflation. Beyond that, it is advisable to adopt more fundamental tax reforms, including reforms of the personal and corporate tax to improve their effectiveness and progressivity.
PHILIPPINES Discussion Notes: Overview June 2011
v
Developing institutions for better fiscal risk management
12. Macroeconomic stability is critical for poverty reduction, but easily undermined by external and internal shocks. To be sure, fiscal risks are large and diverse in the Philippines, but their poor assessment and management needlessly expose the country to immiserizing fiscal crises. Effective measures to mitigate these risks could be rapidly implemented. They include strengthening the legal and institutional framework for risk management, improving the management of public debt, and improving the analysis and dissemination of data on fiscal risks. Suggested policy actions include (i) establishing a dedicated Fiscal Risk Unit and a Debt Management Office in the Department of Finance (DOF), (ii) developing and publishing an explicit debt management strategy, and (iii) strengthening the Department of Finance’s Corporate Affairs Group.
II. Improving the Investment Climate 13. Strengthening the investment climate for more vigorous private sector development remains a key challenge in the Philippines. Policy reforms and programs are needed to increase competitiveness and improve governance in order to attract more investment and thereby raise labor productivity and employment. Major constraints on improving the investment climate include the lack of infrastructure, a weak regulatory framework and limited access to finance.
Promoting competitiveness
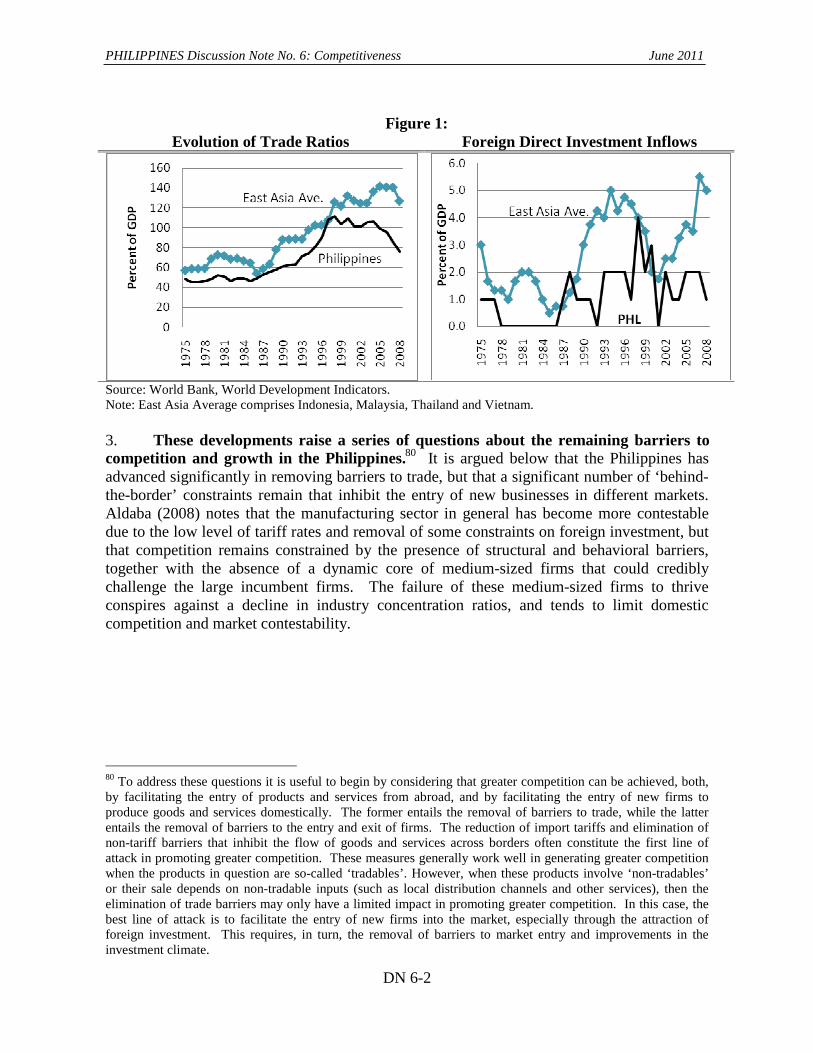
14. The Philippines can achieve much higher growth if it can tackle the long-standing bottlenecks that discourage private investment. While much progress has been made in eliminating trade barriers and improving trade logistics, the country has been less successful in reducing behind-the-border constraints, including the cumbersome procedures required to open and close a business, inadequate investor protection, and poor access to credit among small and medium-sized enterprises (SMEs). Consideration may be given to developing an explicit competition framework policy and implementing a series of measures designed to simplify business regulations within a transparent, rules-based business operating environment and facilitate greater access to credit for SMEs. Such measures include (i) expanding the scope, quality, and accessibility of credit information by setting up the public credit bureau, (ii) strengthening the legal framework for resolving non-performing loans, (iii) simplifying business regulations to reduce operational costs, (iv) developing an explicit competition framework and competition authority, and (v) strengthening the legal framework and enforcement mechanisms to protect property rights.
Developing better models of infrastructure finance and management
15. Expanding access to energy. Reliable availability of energy, including the elimination of brown-outs, is crucial to achieving a better investment climate in the Philippines. In the power sector the restructuring and liberalization of the electricity market sparked by passage of the Electric Power Industry Restructuring Act of 2001 has progressed well, but remains incomplete in several critical areas. This process needs to be brought to completion and a long-term debt management solution put in place to deal with the government’s sizeable
PHILIPPINES Discussion Notes: Overview June 2011
vi
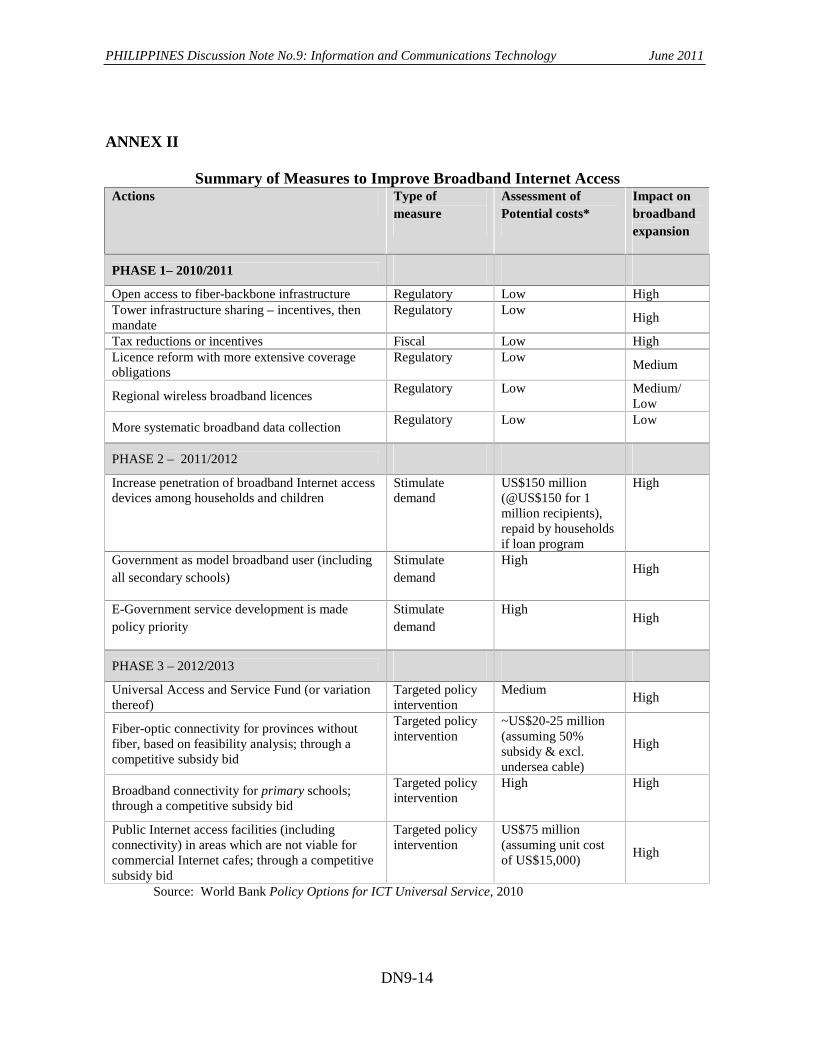
contingent liabilities stemming from the Power Sector Asset and Liability Management (PSALM) finances. Meanwhile, the goal of universal electrification entails connecting over four million new customers. To achieve these goals, the authorities will need to (i) advance the private ownership/administration of power plants and manage the privatization of remaining National Power Corporation assets, (ii) accelerate transmission investment, (iii) reform the electric cooperative sector and address the issue of non-bankable electric cooperatives, (iv) take measures to lower operating costs, and (v) accelerate the development of renewable energy. 16. Improving transport infrastructure. Adequate transport infrastructure is another vital element for improving the investment climate and therefore economic growth, especially in an archipelago like the Philippines. Inland transport is deteriorating due to poor road conditions and weak intermodal integration. To meet these challenges does not simply require more public spending; it calls for greatly strengthened transport development planning, approached in an intermodal context, with a joint focus on trunk highways, ports, and airport development in relation to economic activity hubs and population centers. Much more attention also needs to be given to highway maintenance. Both sets of actions require a stronger policy presence at the national level to overcome the parochial interests at the local level, and a determined focus on strengthening governance and anti-corruption mechanisms in the sector. 17. Promoting ICT. Further development of the ICT potential in the Philippines can provide additional income-generating opportunities and help improve public service delivery. The ICT sector, including business process outsourcing, is already a significant and growing segment of the economy and policies can build on its strengths. Key policy areas for consideration include the establishment of clear sector leadership, reducing skills shortages to stimulate further development of IT-enabled services, improving access to broadband Internet particularly outside major cities, and using ICT to deliver public services in a more coordinated and cost-effective manner. Policy actions to consider are the (i) assignment of clear and accountable leadership for government-ICT/e-government, (ii) partial financing of ICT infrastructure through “smart subsidies”, (iii) leveraging of the government’s role as a major user of broadband Internet, and (iv) support of fast-track skills development programs in partnership with the private sector.
Enhancing productivity and employment
18. Because most of the country’s poor live in rural areas, robust agricultural growth and productivity increases will continue to be crucial to poverty reduction. There is much room for improving agricultural performance, and the sector has significant potential for income generation, job creation, and agro-business linkages. Critical constraints include a public policy and expenditure framework centered on the pursuit of food security with a particular bias in favor of rice, and the underdevelopment of land markets. Product diversification and improved competiveness are needed to support long-term growth in the agriculture sector and strengthen its linkages to agri-business activities. Policy areas for attention include reforming the rice-focused sector policy, ensuring more equitable access to land and addressing the barriers to competitiveness. Measures recommended for early action include (i) redirecting public expenditures away from subsidies (such as rice production support programs based on fertilizer and hybrid seed subsidies) to support services enhancing agribusiness
PHILIPPINES Discussion Notes: Overview June 2011
vii
competitiveness (e.g., market access and information, regulatory and supervision functions, extension services and research and development), (ii) developing a decentralized and participatory approach to agrarian reform, and (iii) ensuring security of land tenure.
III. Increasing the Poor’s Access to Better Public Services 19. The Philippines is lagging behind in several social sector Millennium Development Goals (MDGs), and improving access to and quality of public services for the poor remains a major challenge. The achievement of the MDGs is a shared responsibility of the national and local governments, and an improved coordination of activities is essential. Strengthened transparency, coordination and cooperation, and promotion of social inclusion and empowerment can lead to improved service delivery and outcomes for the poor. Better inter-agency coordination and institutional strengthening are also needed to realize greater synergy between anti-poverty initiatives in rural and urban areas.
Deepening the reform agendas in key public services sectors
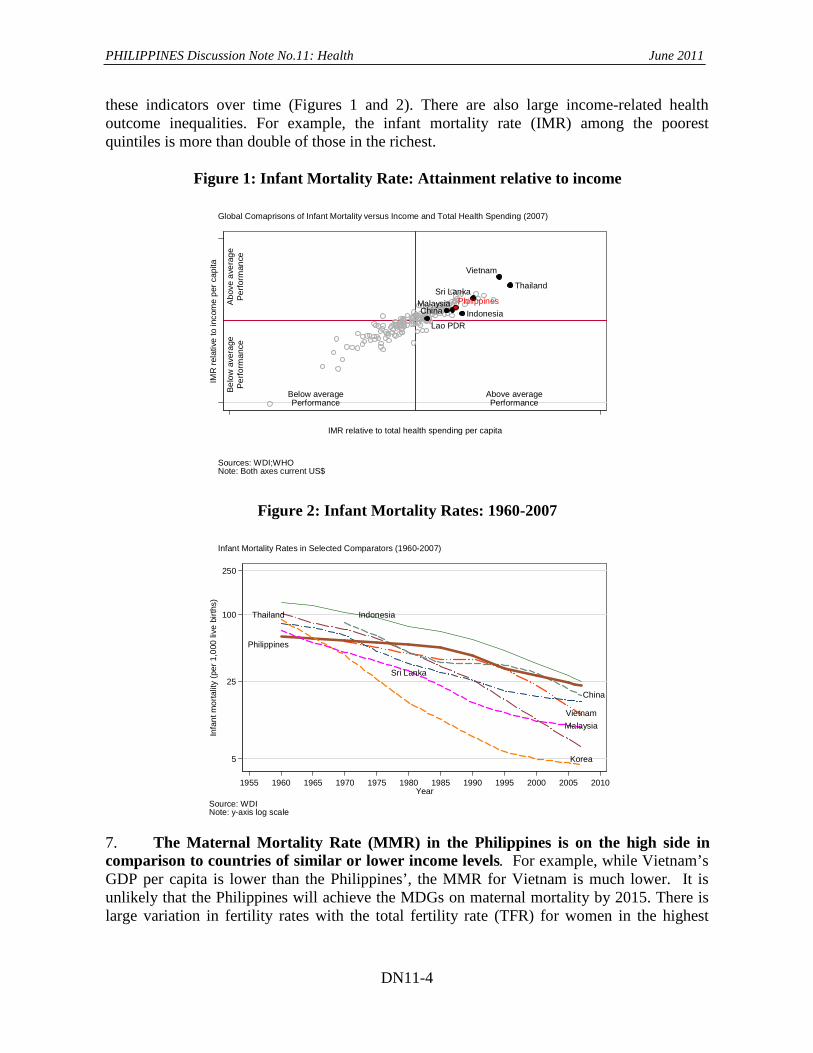
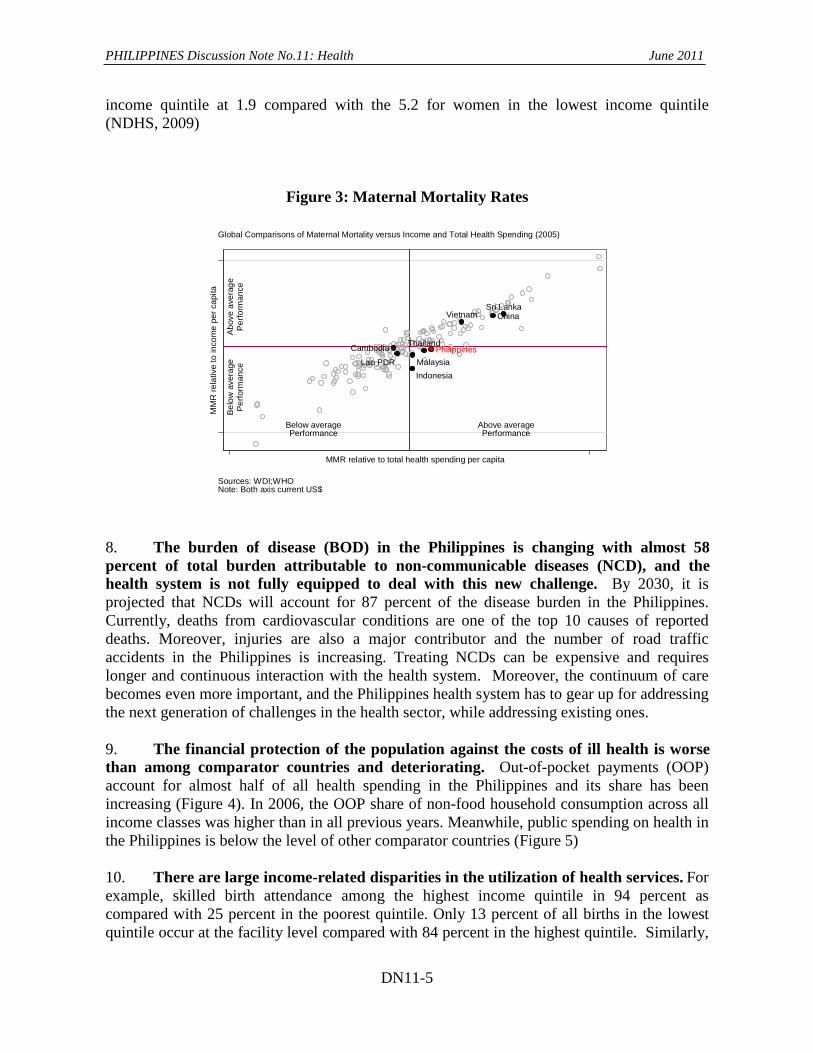
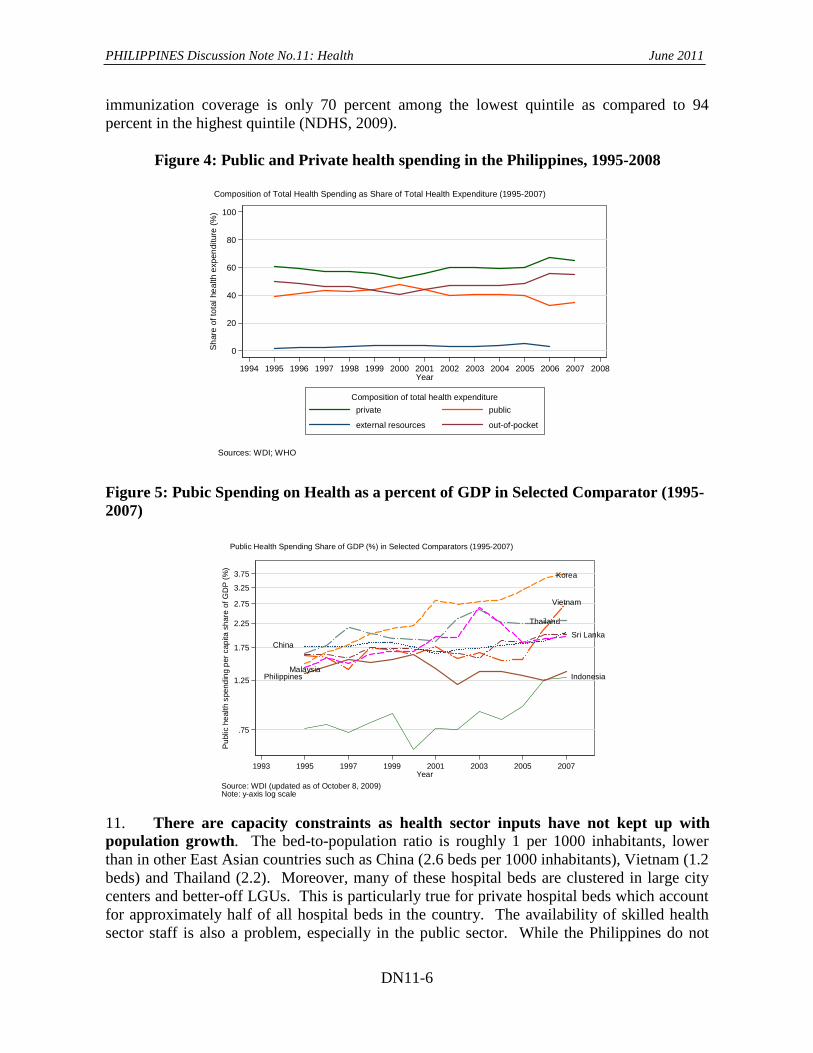
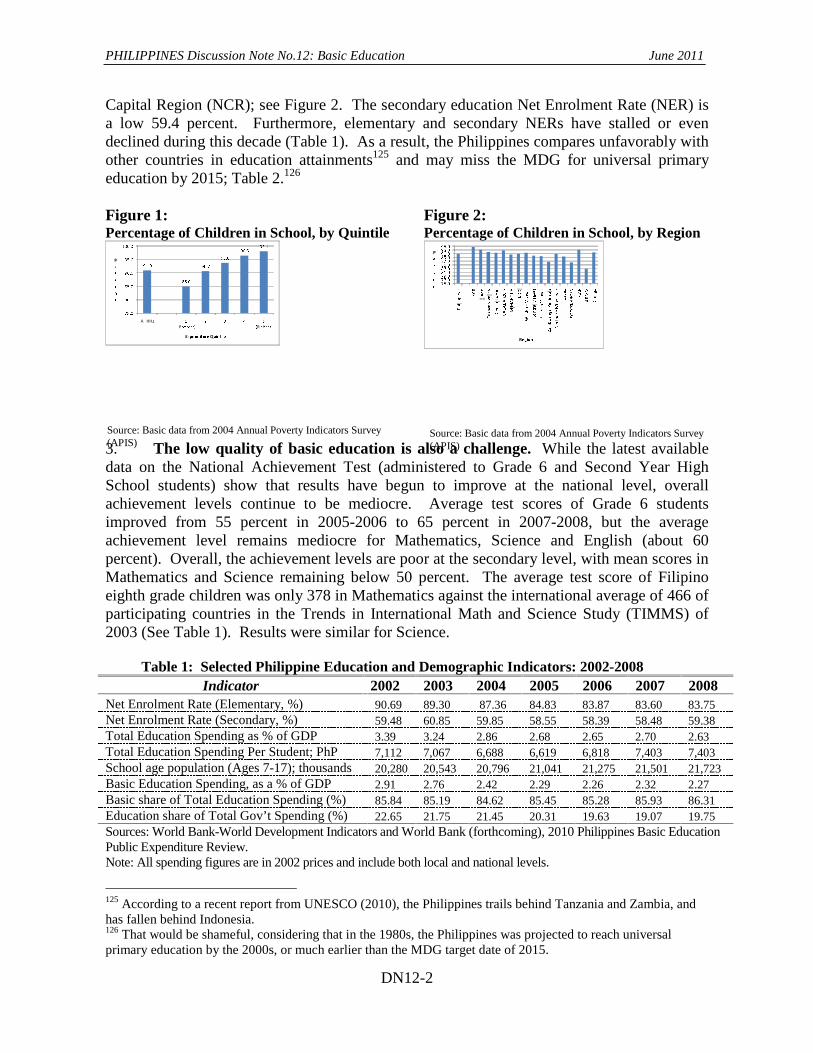
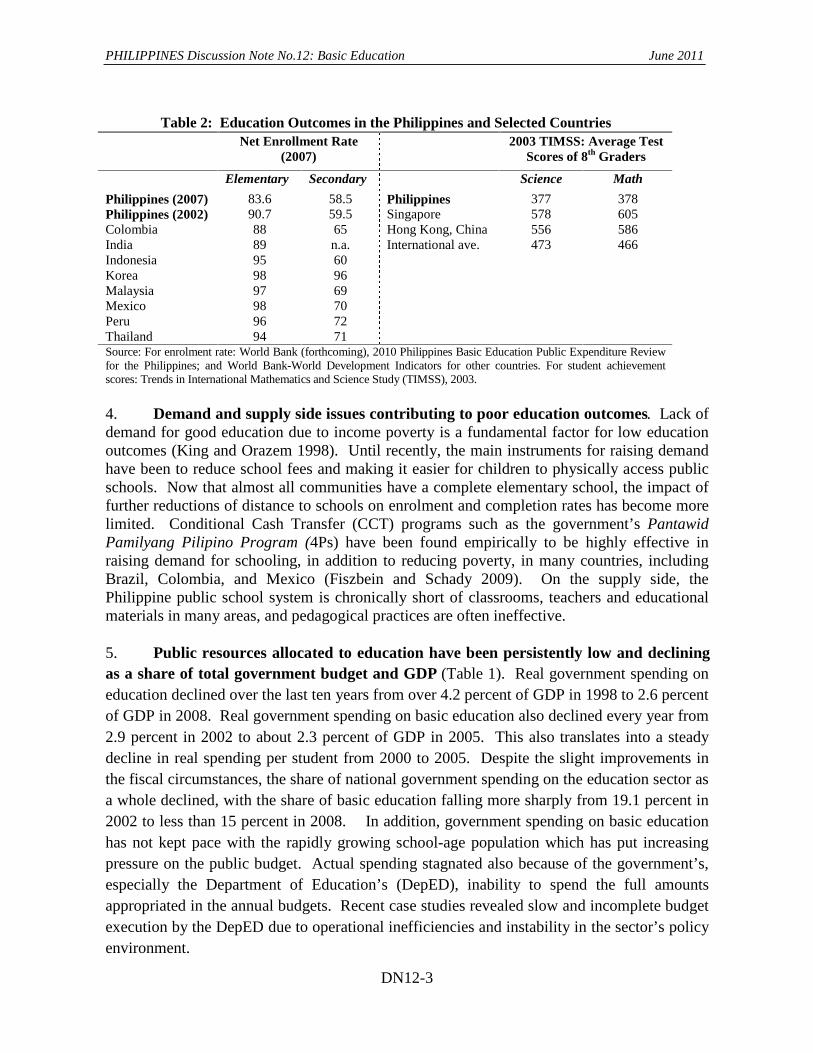
20. Improving health outcomes. The ratio of health spending to GDP in the Philippines is one of the lowest in the region. Maternal and reproductive health indicators are among the worst in the region, and without concerted action, achievement of this MDG is at risk. The Philippines also has large income-related inequalities in health outcomes; for example, the infant mortality rate among the poorest quintiles is more than double that among the richest. Poor households rely most heavily on public health facilities, where the quality of care needs improvement and access in rural areas remains difficult. The problems in the health sector largely stem from excessive fragmentation in health financing and delivery, and a lack of clarity in stewardship responsibilities. Quick actions are needed to (i) scale up priority health interventions and capital investments in LGU facilities through performance-based approaches, (ii) rapidly expand the sponsored program for indigent households with national government financing using well-defined targeting mechanisms particularly the National Household Targeting System for Poverty Reduction-proxy means test, (iii) expand Philippines Health Insurance Corporation coverage for all informal sector workers and implement an expanded benefits package for all members, (iv) develop and implement a needs-based facilities and health personnel master plan, including using the plan to guide future investments in the health sector by expanding capacity in underserved areas of the country, (v) support the implementation of integrated health information systems for improved monitoring and evaluation and regulation, and (vi) integrate the prevention and control of non-communicable diseases in public health and primary care programs. 21. Delivering better education. For the poor, education is the single most important means of escaping poverty. The quality of education in the Philippines now trails behind a number of countries with substantially lower per capita income levels, and its poor net enrolment indicators jeopardize its chances of attaining the MDG in education by 2015. Increasing access to education for poor and marginalized groups will require better targeted programs and a greater reliance on partnerships with the private sector, while improving the quality of basic education will depend on a concerted implementation of critical reforms. In both cases, additional resources for basic education will be needed. In 2005, the government introduced a sector-wide program in basic education that seeks to improve the quality of
PHILIPPINES Discussion Notes: Overview June 2011
viii
schools in a decentralized environment. This program has yielded promising results and can be further strengthened. The most strategically urgent actions in this context are to (i) allocate the necessary budget to achieve universal primary education by 2015 and to expand secondary education enrolment, particularly for children from poor families, (ii) provide complementary support for the CCT program, (iii) expand private education, (iv) build public schools in areas with no nearby private schools, (v) improve the curriculum, and (vi) revise the system of performance incentives for teachers/principals. 22. Expanding early childhood interventions. Young children who participate in early childhood development programs that prepare them for school and address their health needs have lower school dropout rates and higher achievements from primary grades to adulthood. Currently, only 20 percent of eligible children are enrolled in pre-schools, which are severely constrained by a lack of facilities. Moreover, the inadequate financial protection against illness of most Filipinos also affects pre-school children. Measures need to be taken quickly to (i) facilitate public-private partnerships in pre-school education, (ii) expand national government-local government cost-sharing arrangements, (iii) provide universal health insurance coverage for children by mandating enrolment/coverage of all children under the age of six and ensuring zero or minimal co-payments for inpatient and outpatient care of these children, and (iv) enlarge the expanded program of immunization by providing government-subsidized vaccines, including the new vaccines of HiB and MMR, for all children.
Expanding basic service delivery
23. Expanding drinking water supply and sanitation. Although the Philippines remains on track to meet the MDG for access to improved water sources (94 percent) and improved sanitation (79 percent) in 2015, significant challenges remain in broadening access to continuous piped water supply while meeting national quality norms. After the successful privatization of Metro Manila water and sanitation services in 1997, progress has been slow in implementing a second round of reforms. These need to focus on the financing of water service providers and on streamlining institutional and financial arrangements to allow investments for improvements in services and expansion by local governments, water districts, and the private sector. Short-term actions to further these goals include (i) addressing the institutional fragmentation through consolidation of sectoral responsibilities at the central and local levels (ii) improving cost recovery for the water and sanitation services, and (iii) strengthening the regulatory capacity to ensure that the service providers are providing efficient and quality services. 24. Improving urban services. The Philippines is among the fastest urbanizing countries in East Asia. By 2009, urban centers accounted for 75 percent of economic output and 67 percent of households reside in urban areas. In Metro Manila and other large cities, the proliferation of slums, congestion, and exposure to man-made and natural risks reinforces a low level equilibrium that will prevent sustained economic growth. At the same time, the economies of agglomeration offer important opportunities to increase incomes, improve access to services and uplift the poor. Better urban development is needed, however, before these opportunities can be exploited. Four sets of actions that could advance the urban agenda in that direction are (i) establishing a forward-looking and ambitious national urban policy framework, (ii) developing and implementing a national slum upgrading program, (iii)
PHILIPPINES Discussion Notes: Overview June 2011
ix
revamping national and local systems and tools for urban development planning, and (iv) improving the human resource management frameworks for cities and metropolitan areas.
25. Addressing bottlenecks in local service delivery. Community-driven development (CDD) approaches are being successfully applied in the Philippines as part of efforts to enhance decentralized service delivery and improve local-level governance and performance, especially in poorer areas. The objective now is to expand the program coverage nationally, but there are challenges such as the possible duplication of approaches, the need to harmonize institutional arrangements, as well as ensuring adequate financing. The key action areas are the development of a roadmap based on an assessment of experience to scale up the CDD program nationwide, and the consolidation and rationalization of the “CDD platform” to achieve synergy and convergence for maximum impact.
IV. Reducing Vulnerabilities 26. A large proportion of the population in the Philippines is vulnerable to falling into poverty even as efforts continue to reduce the number of poor. In addition to the economic shocks that can affect income and employment, vulnerabilities are worsened by the risks stemming from climate-induced natural disasters and related impacts which disproportionately affect the poor. The sustainable management of environment and natural resources to safeguard livelihoods is critically important.
Expanding and rationalizing the social safety net
27. An estimated 33 percent of the population lives under the poverty line, up from 30 percent in 2003, and nearly half remain highly vulnerable to falling into poverty or deeper into poverty. To address these mounting challenges, programs and resources must be better aligned, targeted, and coordinated. The Philippines has begun to improve its previously fragmented and poorly targeted social protection programs. To sustain these efforts, speedy actions are required to (i) accelerate and enhance social welfare reform to develop an operational social protection strategy, (ii) improve targeting of social protection programs by adopting the National Household Targeting System for Poverty Reduction as the single national targeting system, (iii) further strengthen the operations of the CCT program, particularly through institutional strengthening of program administration, and broaden its coverage of poor households, (iv) eliminate ineffective programs and redirect resources to core programs to create fiscal space and to strengthen the social protection system, and (v) implement a secure unique identification system to facilitate better targeting of social programs. This can be achieved by reallocating funds to efficient programs from less efficient programs such as the NFA rice price subsidy program and the Food-for-School Program.
Engage in pro-active disaster risk reduction and management actions
28. For countries as vulnerable as the Philippines, natural disasters perpetuate many of their development challenges, including the proliferation of slums and heavy congestion in urban areas, inadequate infrastructure, and environmental degradation. The government has introduced a policy framework for dealing with natural disasters that emphasizes prevention and mitigation measures, but it needs a strategy that will expand the cost-sharing role of the
PHILIPPINES Discussion Notes: Overview June 2011
x
private sector, particularly the insurance industry. Priority actions include the (i) fast-track completion of risk assessments to determine which areas are most at risk from natural disasters so that future interventions can be well targeted, (ii) review of the capacity and upgrading of the weather forecasting and early warning systems for highly exposed localities, (iii) use of urban areas (such as Metro Manila and other economic centers) as geographic starting points to package risk reduction investments, (iv) adoption of a catastrophe risk finance strategy that will reduce fiscal exposure, and (v) empowerment and encouragement of LGUs to undertake priority disaster risk reduction investments by providing them with affordable and accessible financing options.
Mainstreaming climate change adaptation measures and expanding mitigation programs
29. Adaptation to climate change is particularly critical for the Philippines, given the country’s high vulnerability to impacts including sea-level rise and extreme weather events such as intense typhoons and changes in rainfall patterns that exacerbate floods and droughts. The Philippines has adopted active legislative and institutional responses to climate change issues, but is still building up its organizational structure and capacity in this area and lacks an operational strategy to respond to climate change. With the Climate Change Act of 2009 as the legal basis, the new administration is in a good position to strengthen the Philippines response to climate change by (i) implementing the new Climate Change Act and strengthening institutions and coordination, (ii) mainstreaming adaptation and disaster preparedness activities in policies, plans, and programs at the national, sub-national and sectoral levels, (iii) developing financing facilities for adaptation and disaster response, and (iv) selectively implementing mitigation programs in key sectors (energy, transport, waste management) where emissions are on the rise.
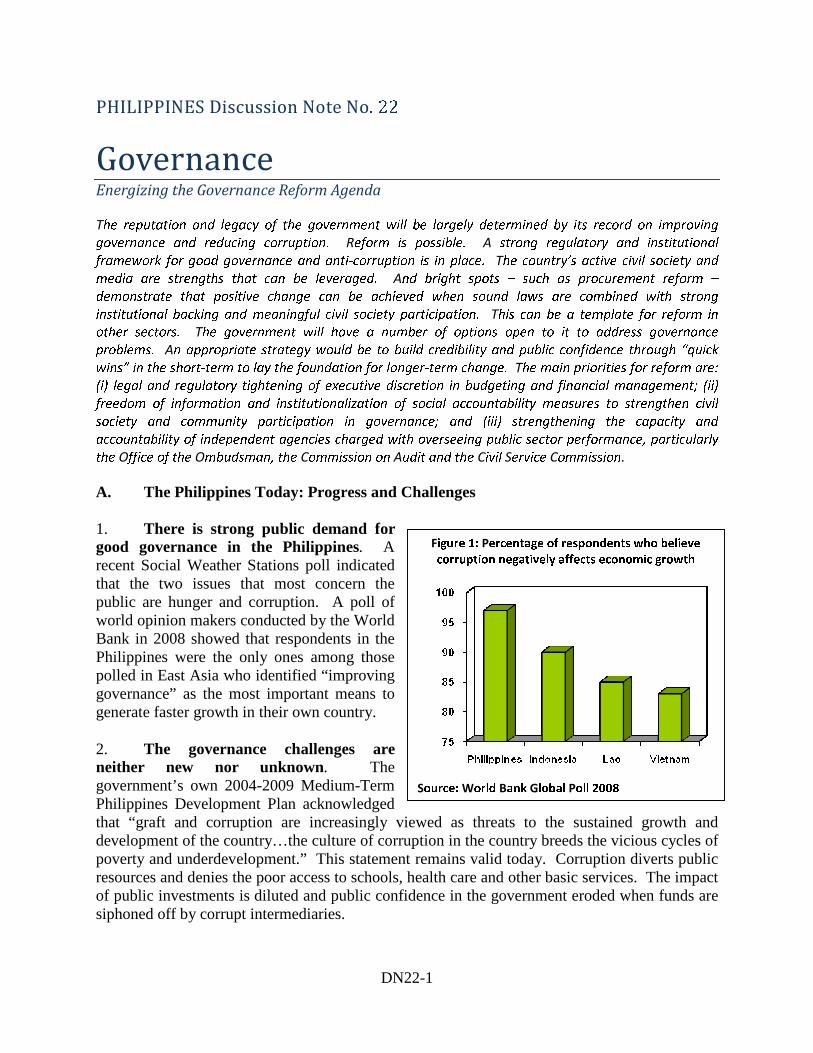
V. Good Governance 30. The new government’s reputation and legacy will be largely determined by its record in improving governance and reducing corruption. For the most part, strong regulatory and institutional frameworks for good governance and anti-corruption are already in place. The country’s active civil society and media are strengths that can be leveraged. And bright spots such as procurement reform show that positive change can be achieved when sound laws are combined with strong institutional backing and meaningful civil society participation. For the new government, an appropriate strategy would be to build credibility and public confidence through “quick wins” in order to lay the foundation for longer-term change. Short-term actions that could achieve this objective are the (i) resolution of high-profile graft cases, (ii) putting forward a Freedom of Information Act for legislative approval, (iii) voluntary disclosure of financial information by high level policymakers, and (iv) the launch of a comprehensive reform plan in a strategically selected agency that is widely perceived to be corrupt. These short-term measures would build political capital for the government to tackle more fundamental longer-term reforms.
PHILIPPINES Discussion Notes: Overview June 2011
xi
Strengthening core governance systems in public financial management
31. Improving public financial management (PFM) is critical for making progress towards the Philippines’ development goals and is also a core element of the governance reform agenda. For both these reasons, a fundamental reform of PFM should be a high priority for the government. Although the PFM system in the Philippines is reasonably capable of maintaining overall fiscal balance, it is not a good tool for efficient execution of priority policy programs and is particularly weak in transparently accounting for how taxpayers’ money has been spent for public purposes. By launching a comprehensive PFM reform program to enhance transparency, accountability, and efficiency in budget and financial management, the government could immediately signal its commitment to strengthen governance as a decisive step away from “business as usual.” Two important steps that can be taken immediately in this direction are to (i) announce a comprehensive PFM reform program as a centerpiece of the government’s governance reform agenda, and (ii) launch a coordinated project to build a government financial management information system. If sustained over time, the reform would build institutional capacities to implement priority programs efficiently and accelerate development.
Improving decentralization
32. The pace of progress on decentralization—in particular, strengthening local governance—needs to be hastened to address the enormous challenge of poverty reduction in the country. All LGUs, regardless of level or size, need to be able to provide minimum basic services to their citizens, while major cities and metropolitan areas need to assume more ambitious roles as engines of economic growth and development. Local government performance is held back by several binding constraints, among them weak systems for LGU accountability, a high level of fragmentation among LGUs, and inequities in the LGUs’ resource base. Several intermediate policy options could help make decentralization work better in the Philippines: (i) strengthening LGU accountability by clarifying service delivery responsibilities and by improving budget transparency and performance reporting, (ii) mitigating the excessive fragmentation by optimizing the role of provinces in inter-LGU coordination and by integrating barangays into the local councils, and (iii) improving LGUs’ resource base by considering options for utilizing additional fiscal transfers allocated based on objective criteria, such as LGU performance and equalization factors. CONCLUSION 33. Making growth work for the poor in the Philippines is a significant development challenge, but one that is worth pursuing vigorously. The new administration not only has the mandate but the historic opportunity to deliver on this goal as well as other election platforms on which it was voted to power. These include “the organized and widely-shared rapid expansion of the economy through a government dedicated to honing and mobilizing the people’s skills and energies as well as the responsible harnessing of natural resources; moving to well-considered programs that build capacity and create opportunity among the poor and the marginalized in the country; policies that create conditions conducive to the growth and
PHILIPPINES Discussion Notes: Overview June 2011
xii
competitiveness of private businesses, big, medium and small; and making education the central strategy for investing in people, reducing poverty and building national competitiveness.” In addition, the new administration is committed to fight corruption. These goals are fully echoed in the strategy and policy actions identified above and elaborated in the accompanying Discussion Notes.
DN1-1
���������������������������������������������Restoring Faster Growth after the Crisis
T AA
PT
T P
T P
R
R
MT
WTO HI
1. The global financial and economic crisis that erupted in 2008 paralyzed the world’s financial markets, triggered a dramatic deceleration of international trade and resulted in the greatest contraction in world GDP since the 1930s. Although the crisis had its epicenter in the developed economies, its tremors reverberated deeply across the developing world. The Philippines was not spared. Its exports dropped by almost 20 percent in 2009 and real GDP growth fell from 7 percent in 2007 to an estimated 1.0 percent in 2009; that is, growth became negative once again in per capita terms. 2. The world economy has begun to recover and Asia appears poised to emerge from the recession both faster and stronger than other regions. Reestablishing the status quo ante, however, would provide little consolation for the Philippines. Even before the onset of the crisis, its per capita GDP had only been growing at a modest pace compared to the rapid expansion observed in neighboring countries, indicating the existence of important barriers to growth. 3. There is also a risk that the post-crisis external environment facing the developing countries may be less hospitable than before. One major difference is that the general revaluation of financial risks triggered by the crisis will result in a reduction in the total amount of cross-border lending and costlier terms, even after financial markets have
PHILIPPINES Discussion Note No.1: Economic Growth June 2011
DN1-2
fully stabilized. The crisis also laid bare important imbalances in the world economy –epitomized by the huge trade deficits incurred by the United States, financed by equally huge trade surpluses in China and Germany – that no longer appear sustainable. Eliminating these imbalances will slow down the growth of world trade, as consumers in the United States begin to save more and governments everywhere phase out their countercyclical stimulus packages to prevent inflationary pressures from building.1 Although the shape of the recovery from the global crisis (be it U, V, W or L) is still being debated, a consensus is emerging that the post-crisis world GDP will evolve along a more moderate trend line than before. 4. The new post-crisis external environment poses a particular challenge for the Philippines, where the low economic growth has been a long-standing problem. The rate at which economies grow largely depends on their capacity to structurally transform themselves away from engaging in traditional, less productive activities toward modern, more productive activities, which largely involve tradable products. As discussed below, the Philippines already had been having difficulties in achieving this transformation long before the onset of the global crisis. The challenge facing Philippine policymakers now is to accelerate this transformation at a time when the world economy may be less capable or willing to absorb the increase in tradable products that would result from this transformation. The outward-oriented development model that has characterized the fastest-growing developing economies since the 1960s still offers the best prospects for faster development in the Philippines, even though the rewards from applying that approach may not be as high as before. Why is growth so important? 5. In 1960, the Philippines was one of the most developed economies in Asia, with a per capita GDP that was roughly twice the per capita GDP of Thailand at the time.2
Today this relation is reversed, with Philippine per capita GDP only one-half that of Thailand’s. Similar reversals also emerge in comparisons with other middle-income economies in East Asia, such as Indonesia, Malaysia and most notably, China. This pattern is explained, of course, by the differences in the speed of economic growth, which permitted per-capita GDP to increase since 1960 by a factor of 19 times in China, 8 times in Thailand, and 6 times in Malaysia and Indonesia, but only by 2 times in the Philippines. While the other East Asian economies were growing at annual rates between 3.6 and 6 percent in per capita terms over 1960-2008, the Philippines only managed to grow at an average rate of 1.4 percent over this period. This meant that living standards in the other large East Asian economies have been rapidly catching up with the living standards in the industrialized OECD economies (whose per capita GDP growth averaged 2 percent), while the Philippines was progressively falling further behind. 6. This is also the main reason why the progress made in poverty reduction has been so slow in the Philippines. Using the $1.25-a-day income threshold measure of
1 Another widely feared consequence of the crisis had been the possible decline in foreign remittances, which are particularly important for the Philippine economy. Though remittance inflows have not declined in 2008 and 2009, their growth has decelerated significantly and is projected to remain at more moderate rates than before. 2 All GDP figures are measured in constant (2000) US Dollars as reported in the World Bank’s Development Data Platform.
PHILIPPINES Discussion Note No.1: Economic Growth June 2011
DN1-3
poverty, the Philippines succeeded in reducing poverty from around 30 percent in the early 1980s to just over 22 percent at the end of the 1990s. Though not negligible, this is modest compared to achievements elsewhere, with the result that the poverty rate for the East Asia and Pacific region as a whole is now below the Philippine rate, even though it was nearly twice as high just two decades ago.3
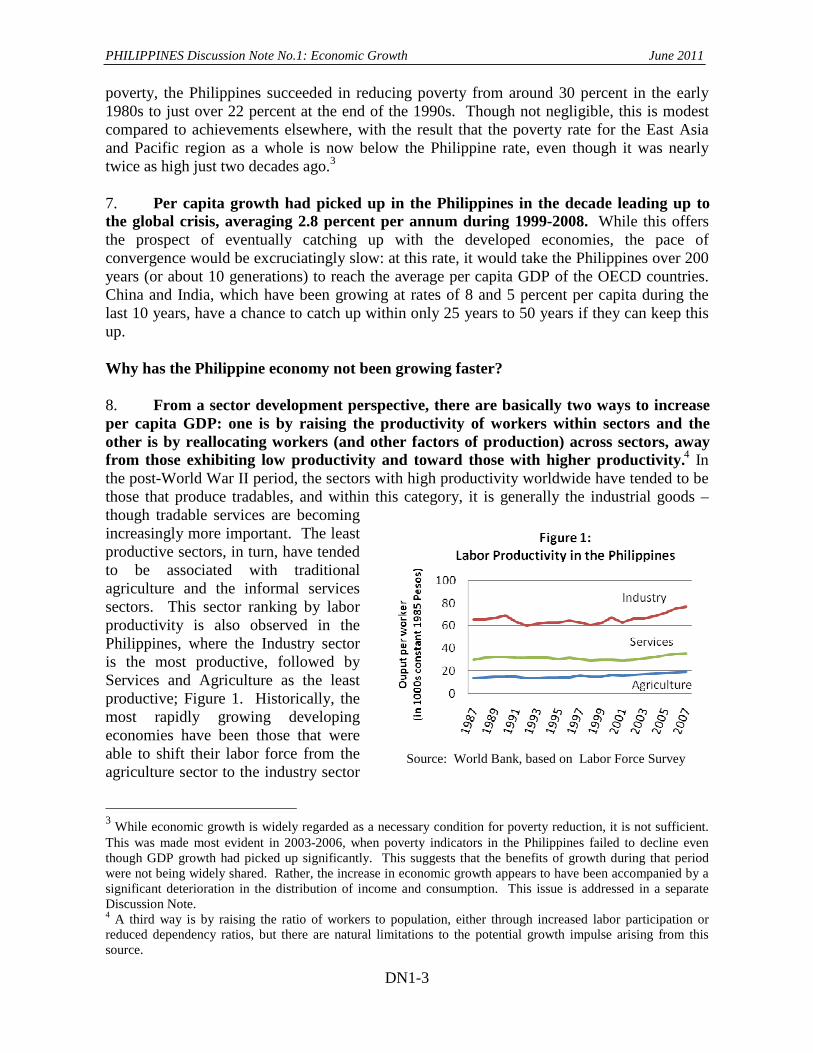
7. Per capita growth had picked up in the Philippines in the decade leading up to the global crisis, averaging 2.8 percent per annum during 1999-2008. While this offers the prospect of eventually catching up with the developed economies, the pace of convergence would be excruciatingly slow: at this rate, it would take the Philippines over 200 years (or about 10 generations) to reach the average per capita GDP of the OECD countries. China and India, which have been growing at rates of 8 and 5 percent per capita during the last 10 years, have a chance to catch up within only 25 years to 50 years if they can keep this up. Why has the Philippine economy not been growing faster? 8. From a sector development perspective, there are basically two ways to increase per capita GDP: one is by raising the productivity of workers within sectors and the other is by reallocating workers (and other factors of production) across sectors, away from those exhibiting low productivity and toward those with higher productivity.4 In the post-World War II period, the sectors with high productivity worldwide have tended to be those that produce tradables, and within this category, it is generally the industrial goods –though tradable services are becoming increasingly more important. The least productive sectors, in turn, have tended to be associated with traditional agriculture and the informal services sectors. This sector ranking by labor productivity is also observed in the Philippines, where the Industry sector is the most productive, followed by Services and Agriculture as the least productive; Figure 1. Historically, the most rapidly growing developing economies have been those that were able to shift their labor force from the agriculture sector to the industry sector
3 While economic growth is widely regarded as a necessary condition for poverty reduction, it is not sufficient. This was made most evident in 2003-2006, when poverty indicators in the Philippines failed to decline even though GDP growth had picked up significantly. This suggests that the benefits of growth during that period were not being widely shared. Rather, the increase in economic growth appears to have been accompanied by a significant deterioration in the distribution of income and consumption. This issue is addressed in a separate Discussion Note. 4 A third way is by raising the ratio of workers to population, either through increased labor participation or reduced dependency ratios, but there are natural limitations to the potential growth impulse arising from this source.
Source: World Bank, based on Labor Force Survey
PHILIPPINES Discussion Note No.1: Economic Growth June 2011
DN1-4
without sacrificing the latter’s labor productivity levels.5
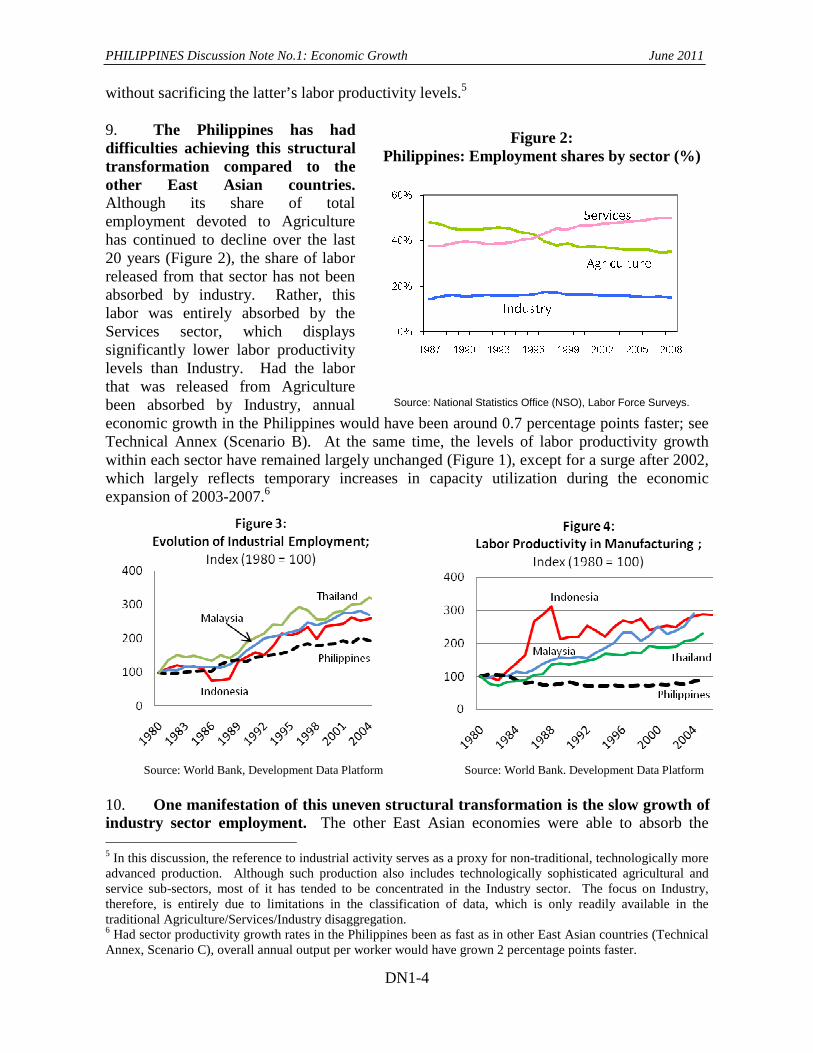
9. The Philippines has had difficulties achieving this structural transformation compared to the other East Asian countries. Although its share of total employment devoted to Agriculture has continued to decline over the last 20 years (Figure 2), the share of labor released from that sector has not been absorbed by industry. Rather, this labor was entirely absorbed by the Services sector, which displays significantly lower labor productivity levels than Industry. Had the labor that was released from Agriculture been absorbed by Industry, annual economic growth in the Philippines would have been around 0.7 percentage points faster; see Technical Annex (Scenario B). At the same time, the levels of labor productivity growth within each sector have remained largely unchanged (Figure 1), except for a surge after 2002, which largely reflects temporary increases in capacity utilization during the economic expansion of 2003-2007.6
Source: World Bank, Development Data Platform Source: World Bank. Development Data Platform
10. One manifestation of this uneven structural transformation is the slow growth of industry sector employment. The other East Asian economies were able to absorb the
5 In this discussion, the reference to industrial activity serves as a proxy for non-traditional, technologically more advanced production. Although such production also includes technologically sophisticated agricultural and service sub-sectors, most of it has tended to be concentrated in the Industry sector. The focus on Industry, therefore, is entirely due to limitations in the classification of data, which is only readily available in the traditional Agriculture/Services/Industry disaggregation. 6 Had sector productivity growth rates in the Philippines been as fast as in other East Asian countries (Technical Annex, Scenario C), overall annual output per worker would have grown 2 percentage points faster.
Figure 2: Philippines: Employment shares by sector (%)
Source: National Statistics Office (NSO), Labor Force Surveys.
PHILIPPINES Discussion Note No.1: Economic Growth June 2011
DN1-5
workers released from their primary sectors at a much faster pace than the Philippines; Figure 3. Between 1980 and 2005, the Philippines managed to double the size of its industrial labor force, but the other middle-income economies in the region almost tripled theirs. At the same time, the other economies were also able to increase labor productivity within manufacturing at a much faster pace than the Philippines; Figure 4. That is, they succeeded, both, in transferring more workers into the industry sector and in continually raising the level of productivity within the sector. In doing so, they have been able to achieve significantly higher rates of economic growth. 11. What makes tradables or industrial production, in particular, so special for growth? Empirically, the expansion of such activities is closely associated with faster economic growth; see, e.g., Rodrik (2009). There are at least two schools of thought on why tradables are important for growth: one focuses on the act of trading and the other focuses on the act of producing tradable goods and services. The first viewpoint holds that there are learning or other spill-over effects from exporting because of technological or marketing externalities that are created when exporters have to compete abroad. This makes tradables special, of course, since non-tradables cannot be exported. The second viewpoint holds that the production of tradables is special, independent of whether the products are exported or displace imports. The starting premise here is that a number of different activities with different marginal productivities coexist within developing economies at any given time. In this context, as more workers shift from low-productivity to high-productivity activities, GDP increases independent of whether the goods produced are sold domestically or abroad.7 Even in the absence of technological externalities from export activities, however, it is difficult to envisage a significant expansion of tradables production in the absence of export markets, given the limited size of the Philippine domestic market for achieving economies of scale.
7 A recent empirical study (Rodrik, 2009) finds that while economic growth is positively correlated both with the GDP-share of industry and the share of exports, the former relationship is stronger and more robust that the latter. Insofar as the post-crisis external environment is less accommodating of trade surpluses, this is good news for the growth prospects of newly industrializing economies. It does not, however, provide support for pursuing an inward-oriented industrialization strategy.
PHILIPPINES Discussion Note No.1: Economic Growth June 2011
DN1-6
TS G E A
C
OO
P FW C E P
P
IMTA PHL
D PHL S B B S C T E G A U W D C T B I N P
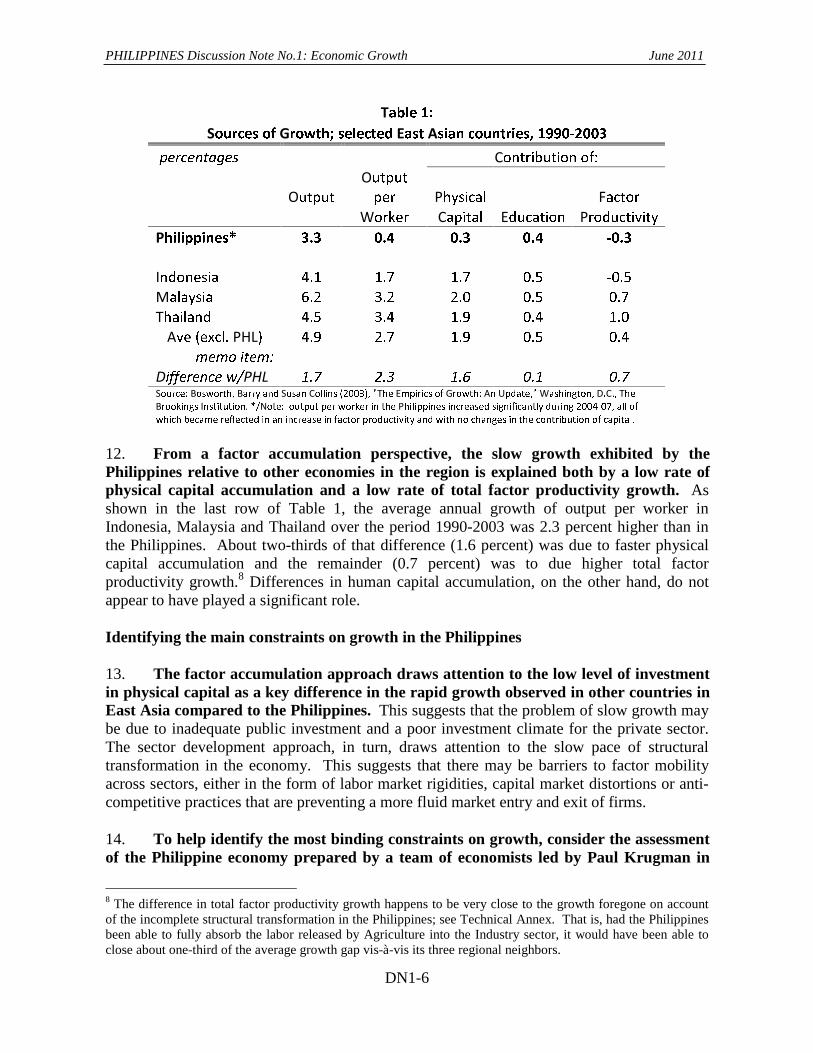
12. From a factor accumulation perspective, the slow growth exhibited by the Philippines relative to other economies in the region is explained both by a low rate of physical capital accumulation and a low rate of total factor productivity growth. As shown in the last row of Table 1, the average annual growth of output per worker in Indonesia, Malaysia and Thailand over the period 1990-2003 was 2.3 percent higher than in the Philippines. About two-thirds of that difference (1.6 percent) was due to faster physical capital accumulation and the remainder (0.7 percent) was to due higher total factor productivity growth.8 Differences in human capital accumulation, on the other hand, do not appear to have played a significant role. Identifying the main constraints on growth in the Philippines 13. The factor accumulation approach draws attention to the low level of investment in physical capital as a key difference in the rapid growth observed in other countries in East Asia compared to the Philippines. This suggests that the problem of slow growth may be due to inadequate public investment and a poor investment climate for the private sector. The sector development approach, in turn, draws attention to the slow pace of structural transformation in the economy. This suggests that there may be barriers to factor mobility across sectors, either in the form of labor market rigidities, capital market distortions or anti-competitive practices that are preventing a more fluid market entry and exit of firms. 14. To help identify the most binding constraints on growth, consider the assessment of the Philippine economy prepared by a team of economists led by Paul Krugman in
8 The difference in total factor productivity growth happens to be very close to the growth foregone on account of the incomplete structural transformation in the Philippines; see Technical Annex. That is, had the Philippines been able to fully absorb the labor released by Agriculture into the Industry sector, it would have been able to close about one-third of the average growth gap vis-à-vis its three regional neighbors.
PHILIPPINES Discussion Note No.1: Economic Growth June 2011
DN1-7
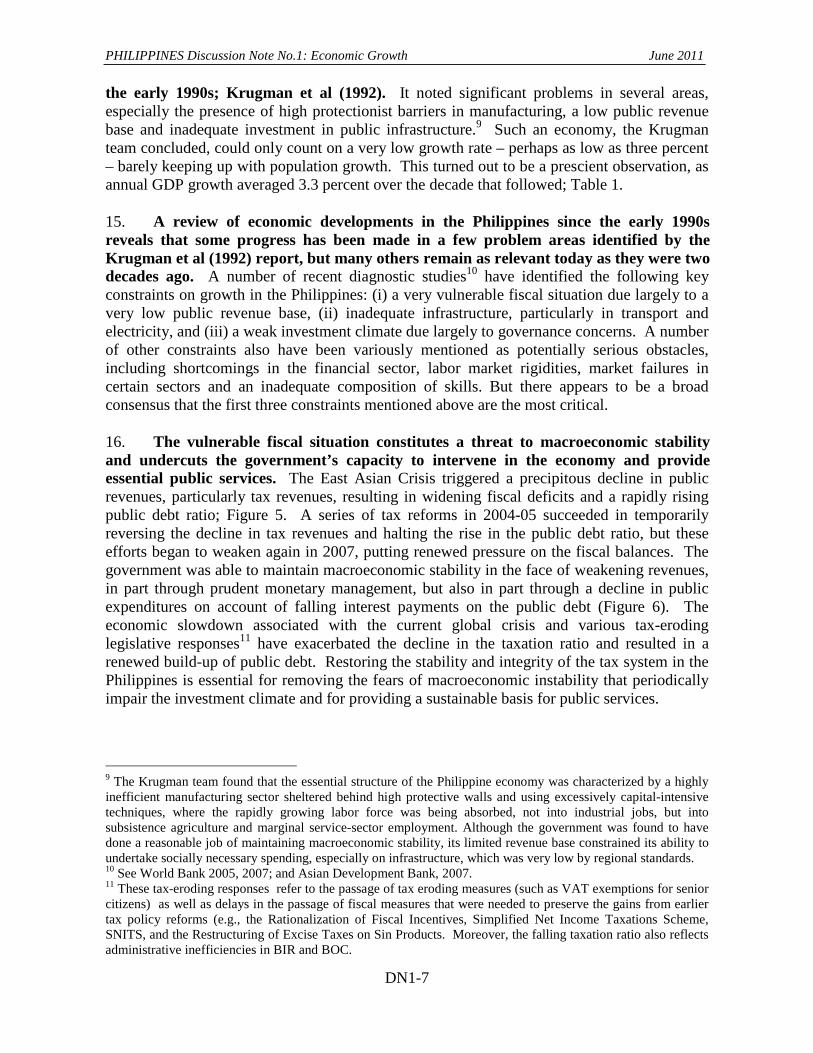
the early 1990s; Krugman et al (1992). It noted significant problems in several areas, especially the presence of high protectionist barriers in manufacturing, a low public revenue base and inadequate investment in public infrastructure.9 Such an economy, the Krugman team concluded, could only count on a very low growth rate – perhaps as low as three percent – barely keeping up with population growth. This turned out to be a prescient observation, as annual GDP growth averaged 3.3 percent over the decade that followed; Table 1. 15. A review of economic developments in the Philippines since the early 1990s reveals that some progress has been made in a few problem areas identified by the Krugman et al (1992) report, but many others remain as relevant today as they were two decades ago. A number of recent diagnostic studies10 have identified the following key constraints on growth in the Philippines: (i) a very vulnerable fiscal situation due largely to a very low public revenue base, (ii) inadequate infrastructure, particularly in transport and electricity, and (iii) a weak investment climate due largely to governance concerns. A number of other constraints also have been variously mentioned as potentially serious obstacles, including shortcomings in the financial sector, labor market rigidities, market failures in certain sectors and an inadequate composition of skills. But there appears to be a broad consensus that the first three constraints mentioned above are the most critical. 16. The vulnerable fiscal situation constitutes a threat to macroeconomic stability and undercuts the government’s capacity to intervene in the economy and provide essential public services. The East Asian Crisis triggered a precipitous decline in public revenues, particularly tax revenues, resulting in widening fiscal deficits and a rapidly rising public debt ratio; Figure 5. A series of tax reforms in 2004-05 succeeded in temporarily reversing the decline in tax revenues and halting the rise in the public debt ratio, but these efforts began to weaken again in 2007, putting renewed pressure on the fiscal balances. The government was able to maintain macroeconomic stability in the face of weakening revenues, in part through prudent monetary management, but also in part through a decline in public expenditures on account of falling interest payments on the public debt (Figure 6). The economic slowdown associated with the current global crisis and various tax-eroding legislative responses11 have exacerbated the decline in the taxation ratio and resulted in a renewed build-up of public debt. Restoring the stability and integrity of the tax system in the Philippines is essential for removing the fears of macroeconomic instability that periodically impair the investment climate and for providing a sustainable basis for public services.
9 The Krugman team found that the essential structure of the Philippine economy was characterized by a highly inefficient manufacturing sector sheltered behind high protective walls and using excessively capital-intensive techniques, where the rapidly growing labor force was being absorbed, not into industrial jobs, but into subsistence agriculture and marginal service-sector employment. Although the government was found to have done a reasonable job of maintaining macroeconomic stability, its limited revenue base constrained its ability to undertake socially necessary spending, especially on infrastructure, which was very low by regional standards. 10 See World Bank 2005, 2007; and Asian Development Bank, 2007. 11 These tax-eroding responses refer to the passage of tax eroding measures (such as VAT exemptions for senior citizens) as well as delays in the passage of fiscal measures that were needed to preserve the gains from earlier tax policy reforms (e.g., the Rationalization of Fiscal Incentives, Simplified Net Income Taxations Scheme, SNITS, and the Restructuring of Excise Taxes on Sin Products. Moreover, the falling taxation ratio also reflects administrative inefficiencies in BIR and BOC.
PHILIPPINES Discussion Note No.1: Economic Growth June 2011
DN1-8
Figure 5: Public Revenues (% of GDP) Figure 6: Public Expenditures (% of GDP)
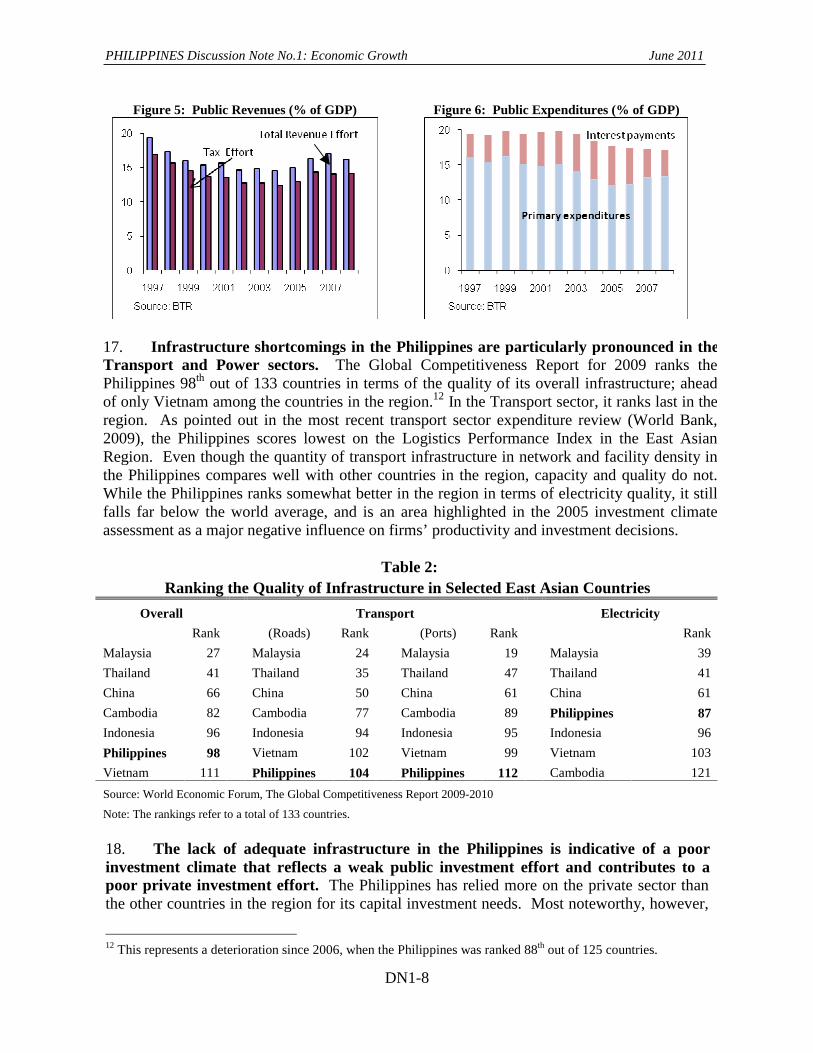
17. Infrastructure shortcomings in the Philippines are particularly pronounced in the Transport and Power sectors. The Global Competitiveness Report for 2009 ranks the Philippines 98th out of 133 countries in terms of the quality of its overall infrastructure; ahead of only Vietnam among the countries in the region.12 In the Transport sector, it ranks last in the region. As pointed out in the most recent transport sector expenditure review (World Bank, 2009), the Philippines scores lowest on the Logistics Performance Index in the East Asian Region. Even though the quantity of transport infrastructure in network and facility density in the Philippines compares well with other countries in the region, capacity and quality do not. While the Philippines ranks somewhat better in the region in terms of electricity quality, it still falls far below the world average, and is an area highlighted in the 2005 investment climate assessment as a major negative influence on firms’ productivity and investment decisions.
Table 2: Ranking the Quality of Infrastructure in Selected East Asian Countries
Source: World Economic Forum, The Global Competitiveness Report 2009-2010
Note: The rankings refer to a total of 133 countries.
18. The lack of adequate infrastructure in the Philippines is indicative of a poor investment climate that reflects a weak public investment effort and contributes to a poor private investment effort. The Philippines has relied more on the private sector than the other countries in the region for its capital investment needs. Most noteworthy, however,
12 This represents a deterioration since 2006, when the Philippines was ranked 88th out of 125 countries.
PHILIPPINES Discussion Note No.1: Economic Growth June 2011
DN1-9
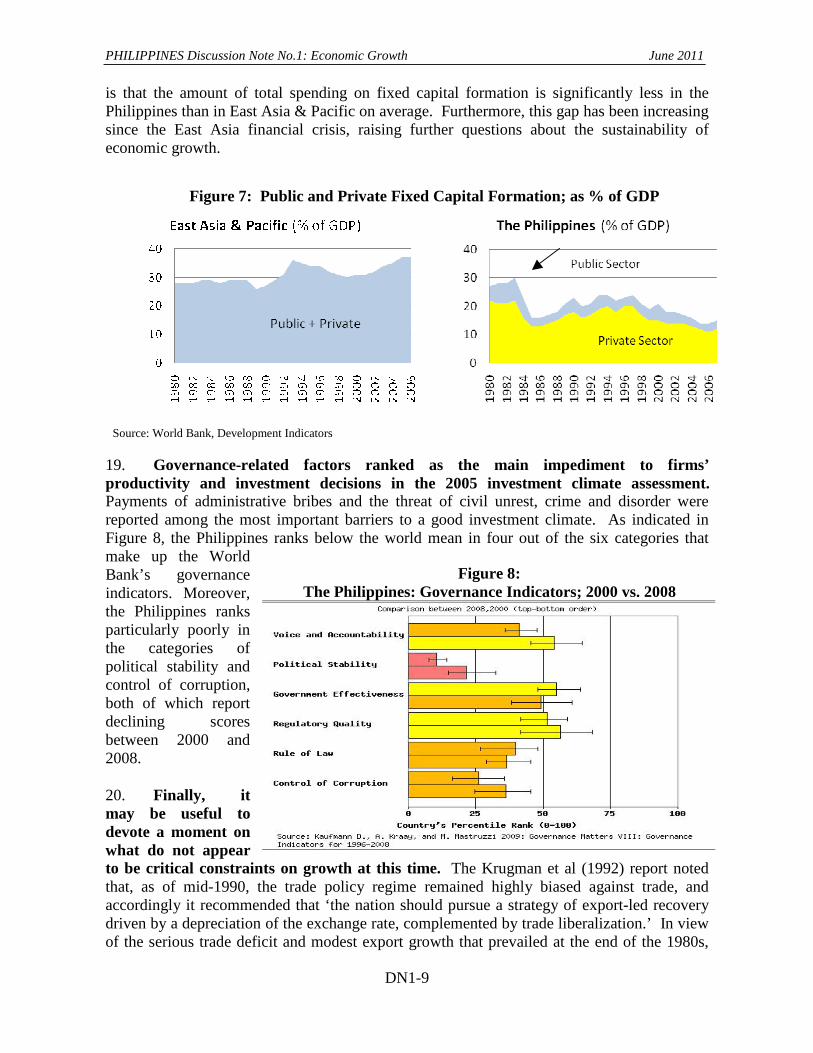
is that the amount of total spending on fixed capital formation is significantly less in the Philippines than in East Asia & Pacific on average. Furthermore, this gap has been increasing since the East Asia financial crisis, raising further questions about the sustainability of economic growth.
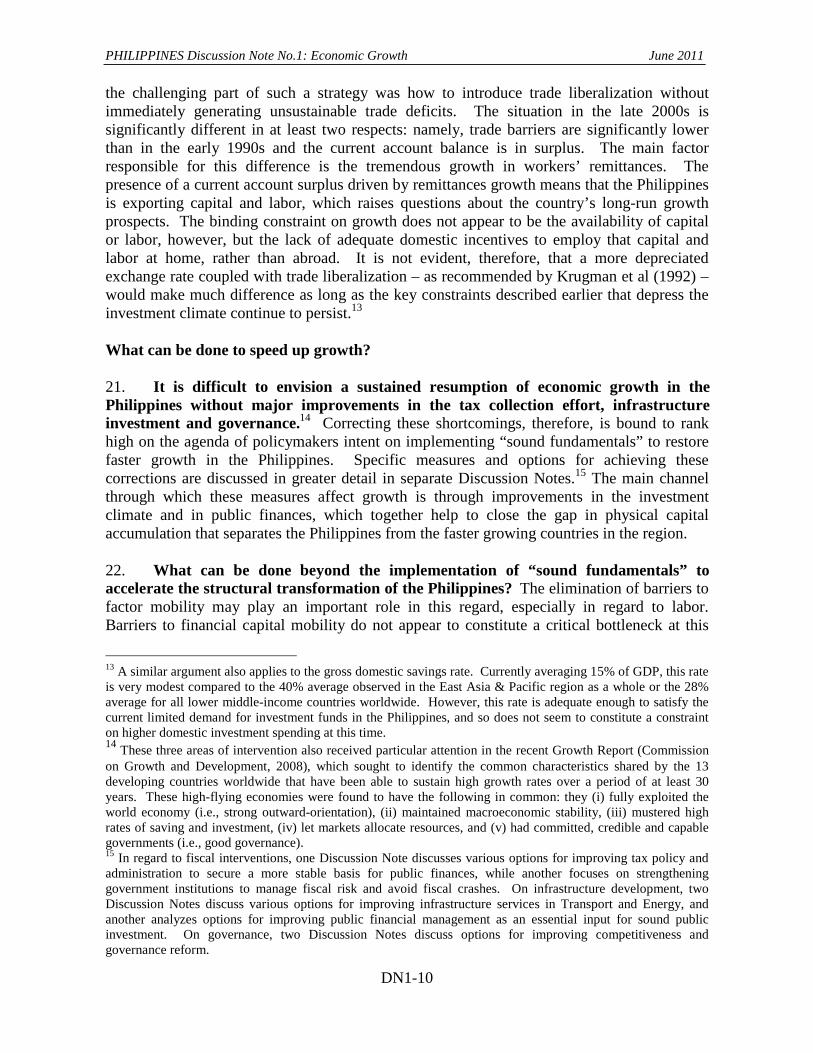
19. Governance-related factors ranked as the main impediment to firms’ productivity and investment decisions in the 2005 investment climate assessment. Payments of administrative bribes and the threat of civil unrest, crime and disorder were reported among the most important barriers to a good investment climate. As indicated in Figure 8, the Philippines ranks below the world mean in four out of the six categories that make up the World Bank’s governance indicators. Moreover, the Philippines ranks particularly poorly in the categories of political stability and control of corruption, both of which report declining scores between 2000 and 2008. 20. Finally, it may be useful to devote a moment on what do not appear to be critical constraints on growth at this time. The Krugman et al (1992) report noted that, as of mid-1990, the trade policy regime remained highly biased against trade, and accordingly it recommended that ‘the nation should pursue a strategy of export-led recovery driven by a depreciation of the exchange rate, complemented by trade liberalization.’ In view of the serious trade deficit and modest export growth that prevailed at the end of the 1980s,
Figure 7: Public and Private Fixed Capital Formation; as % of GDP
Source: World Bank, Development Indicators
Figure 8: The Philippines: Governance Indicators; 2000 vs. 2008
PHILIPPINES Discussion Note No.1: Economic Growth June 2011
DN1-10
the challenging part of such a strategy was how to introduce trade liberalization without immediately generating unsustainable trade deficits. The situation in the late 2000s is significantly different in at least two respects: namely, trade barriers are significantly lower than in the early 1990s and the current account balance is in surplus. The main factor responsible for this difference is the tremendous growth in workers’ remittances. The presence of a current account surplus driven by remittances growth means that the Philippines is exporting capital and labor, which raises questions about the country’s long-run growth prospects. The binding constraint on growth does not appear to be the availability of capital or labor, however, but the lack of adequate domestic incentives to employ that capital and labor at home, rather than abroad. It is not evident, therefore, that a more depreciated exchange rate coupled with trade liberalization – as recommended by Krugman et al (1992) – would make much difference as long as the key constraints described earlier that depress the investment climate continue to persist.13
What can be done to speed up growth?
21. It is difficult to envision a sustained resumption of economic growth in the Philippines without major improvements in the tax collection effort, infrastructure investment and governance.14 Correcting these shortcomings, therefore, is bound to rank high on the agenda of policymakers intent on implementing “sound fundamentals” to restore faster growth in the Philippines. Specific measures and options for achieving these corrections are discussed in greater detail in separate Discussion Notes.15 The main channel through which these measures affect growth is through improvements in the investment climate and in public finances, which together help to close the gap in physical capital accumulation that separates the Philippines from the faster growing countries in the region. 22. What can be done beyond the implementation of “sound fundamentals” to accelerate the structural transformation of the Philippines? The elimination of barriers to factor mobility may play an important role in this regard, especially in regard to labor. Barriers to financial capital mobility do not appear to constitute a critical bottleneck at this
13 A similar argument also applies to the gross domestic savings rate. Currently averaging 15% of GDP, this rate is very modest compared to the 40% average observed in the East Asia & Pacific region as a whole or the 28% average for all lower middle-income countries worldwide. However, this rate is adequate enough to satisfy the current limited demand for investment funds in the Philippines, and so does not seem to constitute a constraint on higher domestic investment spending at this time. 14 These three areas of intervention also received particular attention in the recent Growth Report (Commission on Growth and Development, 2008), which sought to identify the common characteristics shared by the 13 developing countries worldwide that have been able to sustain high growth rates over a period of at least 30 years. These high-flying economies were found to have the following in common: they (i) fully exploited the world economy (i.e., strong outward-orientation), (ii) maintained macroeconomic stability, (iii) mustered high rates of saving and investment, (iv) let markets allocate resources, and (v) had committed, credible and capable governments (i.e., good governance). 15 In regard to fiscal interventions, one Discussion Note discusses various options for improving tax policy and administration to secure a more stable basis for public finances, while another focuses on strengthening government institutions to manage fiscal risk and avoid fiscal crashes. On infrastructure development, two Discussion Notes discuss various options for improving infrastructure services in Transport and Energy, and another analyzes options for improving public financial management as an essential input for sound public investment. On governance, two Discussion Notes discuss options for improving competitiveness and governance reform.
PHILIPPINES Discussion Note No.1: Economic Growth June 2011
DN1-11
time, except for small and medium enterprises. Although the amount of domestic credit to the private sector, as a share of GDP, has continued to decline gradually since the late 1990s, the share of liquid reserves in the total assets of the banking system has been rising since 2005, and real interest rates have been reasonably low. This suggests that the decline in credit is mainly due to limited demand by borrowers, rather than supply constraints. On the other hand, various elements of the Philippine labor market legislation appear extremely rigid by regional and world standards.16 Questions remain about the extent to which these elements are binding, but policy reforms in this area deserve further study and may need to be complemented with additional reforms in social safety net legislation to compensate for any declines in social protection that could ensue from the relaxation of certain labor market restrictions. 23. Another area that deserves further attention is the barriers to competition in Philippine manufacturing, or modern technology sectors more generally. While the level of protection provided through trade policies has gone down since the time that Krugman et al (1992) prepared their report, there are still signs of significant market distortions (e.g., the non-convergence of marginal labor productivity across manufacturing sub-sectors) that contribute, among other, to the adoption of overly capital-intensive production techniques. As judged by the latest MFN Tariff Trade Restrictiveness Index for overall trade, the Philippines remains a relatively open economy and compares well to the average East Asian & Pacific and lower-middle-income countries. However, the Philippines continues to exhibit significant domestic constraints that protect existing businesses: it ranks 141st out of 181 countries in the Ease of Doing Business index for 2009, reflecting a cumbersome business environment.17 These “behind the border constraints” to doing business are most effective in protecting businesses engaged in non-tradables production, since competing tradables are produced abroad and not subject to those constraints.18 The removal of domestic barriers to competition, be it by introducing a more modern legal framework or application of a more effective competition policy and strengthened regulatory framework, deserves careful consideration. 24. More controversially, some economists also advocate the adoption of “activist” policies to promote faster industrialization. As discussed in Rodrik (2009), these policies basically aim to enhance the profitability of modern industrial activities and thereby induce a
16 Particularly noteworthy in this regard are the very high minimum wage levels legislated in the Philippines. This may be preventing a more fluid transition of labor from agriculture to other higher-value activities, and contributing to the segmentation of the labor market into a formal and an informal sector. By raising labor costs in the formal sector, such segmentation would be encouraging more capital intensive production processes in that sector. 17 One domestic barrier to competition that appears particularly onerous when coupled with a weak judiciary is the limitation on foreign ownership of Philippine assets to a maximum share of 40%. This minority ownership provision effectively bars many multinationals and banks from entering the Philippine market and competing. Another important barrier to competition is regulatory capture, which appears to prevail in various regulated activities. Though potentially open to all bidders, domestically-owned firms tend to be more adept at exploiting this option, being more familiar with the domestic political environment and legal terrain, and less constrained by sanctions on corrupt practices introduced by many governments in developed countries in the last decade. 18 The shift in relative importance of these barriers to competition, away from import barriers toward domestic production barriers, may explain why many large domestically-owned companies have recently begun restructuring their businesses away from tradable, export-oriented activities into non-tradables; see World Bank Philippines Quarterly Update, October 2009, paragraph 16.
PHILIPPINES Discussion Note No.1: Economic Growth June 2011
DN1-12
faster movement of resources toward these activities. Options to achieve this objective range from the maintenance of an undervalued exchange rate, to the introduction of explicit ‘industrial policies’, which may include raising import barriers, export promotion measures and production subsidies. Among these options, the introduction of industrial production subsidies or an exchange rate undervaluation appear most promising, in principle. That is because raising import barriers entails pursuit on an inward-oriented industrialization strategy for which the domestic market is simply too small to achieve the economies of scale required to develop robust industries, while export incentives run afoul of World Trade Organization (WTO) agreements. 25. The maintenance of an undervalued exchange rate offers the possibility of raising the relative price of tradables versus non-tradables, but also has the consequence of generating trade surpluses. In a post-crisis world trade environment that is less hospitable to export-led growth strategies than in earlier decades, application of this strategy also may run into opposition from trading partners, even if it does not contravene WTO agreements. The application of targeted production subsidies, on the other hand, may pose less of a problem in this regard.19 As argued in Rodrik (2009), the application of production subsidies, coupled with a compensating appreciation of the exchange rate could raise the relative price of tradables facing domestic producers, motivating an increase in the production of tradables without resulting in a larger trade surplus and, therefore, without creating the same political anti-bodies associated with exchange rate undervaluation or export promotion policies. However, such a strategy is much more fiscally expensive than the other alternatives and requires considerably better public sector management. Therefore, if attempted, such a policy would need to be preceded by measures to strengthen the tax effort and improve governance. Far from constituting an alternative, resorting to such a policy reinforces the need for reforms described earlier in the context of establishing ‘sound fundamentals.’ Policy actions for consideration 26. A number of policy actions deserve consideration in view of the constraints on economic growth discussed above. These are outlined below and discussed in greater depth in other accompanying Discussion Notes:
• Strengthen the government’s revenue collection efforts, both on the tax policy side and on the tax administration side, aiming to reestablish the tax ratio prevailing before the East Asian financial crisis (17 percent). Specific measures in this area are discussed in the Philippines Discussion Notes No. 3 (Tax Policy and Administration) and No. 4 (Public Spending).
• Significantly raise the public investment effort in the economy; for further detail, see the Philippines Discussion Note No. 4 (Public Spending). At the same time, set up a
19 Unlike export subsidies, industry-specific production subsidies are not prohibited under the WTO Agreement on Subsidies and Countervailing Measures (SCM). However, they are “actionable”; i.e., subject to challenge, either through a multilateral dispute settlement or through countervailing actions, in the event that they cause adverse effects to the interests of another member trading partner. For such a challenge to succeed, the complaining member must demonstrate the adverse trade effects arising from the subsidization, which involves a fact-intensive analysis and may be difficult to verify, especially, when the subsidies are also accompanied by an appreciated exchange rate.
PHILIPPINES Discussion Note No.1: Economic Growth June 2011
DN1-13
high level commission to review the effectiveness of existing PPP arrangements and consider ways of strengthening them; for further detail see the Philippines Discussion Note No. 5 (Fiscal Risk).
• Improve the investment climate by reducing the ‘behind the border constraints’ that inhibit business development. For further details, see the Philippines Discussion Note No. 6 (Competitiveness).
• Strengthen public expenditure and financial management systems, both at the national and sub-national levels, with the aim of developing a well-planned public investment pipeline that complements private sector activities along lines of revealed comparative advantage and of improving budget execution performance. These measures could build on ongoing efforts discussed in the Philippines Discussion Note No. 23 (Public Financial Management).
• Improve the transparency of the public sector budget and in public financial management, to improve governance and the public’s perceptions of governance. For further detail see the Philippines Discussion Notes No. 22 (Governance), No. 23 (Public Financial Management), No. 24 (Decentralization) and No. 25 (Statistics).
• Study potential constraints on labor mobility, including the level of minimum wages.
PHILIPPINES Discussion Note No.1: Economic Growth June 2011
DN1-14
Technical Annex The Impact of Sector Structure and Productivity Growth on Overall Growth in the Philippines Table A1 describes the actual evolution of labor productivity and labor shares from the late 1980s to the early 2000s. It shows that labor productivity increased very little over this period (and was most pronounced in Agriculture), and that the decline in the labor share engaged in Agriculture was entirely absorbed by the Services sector. The first row in the lower half of Table A1 shows the change in average output per worker, calculated as a weighted average over all sectors, which has resulted from the actual evolution of labor productivity and labor shares in the Philippines. It indicates an absolute change of 10.5 percent, which works out to agrowth rate of under 0.7 percent per annum over this period. The second row in the lower half of Table A1 (Scenario B) shows the change in overall output per worker that would have occurred if the entire decline in the labor share of agriculture had been absorbed into the more productive industry sector instead of the Services sector, while labor productivity in each sector continued to evolve as in the Actual case. The third row (Scenario C) shows the change in overall output per worker if labor productivity in each sector had increased across both periods at the average rate observed in Indonesia, Malaysia and Thailand, while sector labor shares evolved as in the Actual case. (The basic parameter assumptions for Scenarios A and B are presented in the last two columns of Table A1.) Finally, the last row of the table presents the joint impact of the two alternative scenarios. The main finding from this decomposition is that output per worker in the Philippines could have grown by almost 3 percent per annum between 1987 and 2004, instead of just 0.7 percent, if it had succeeded in achieving a faster transformation from agriculture to industry and if labor productivity in each sector had grown as fast as in the other middle-income East Asian economies. These two factors would have brought the overall economic growth rate in the Philippines close to the average growth rate experienced in these other economies.
T AT G I S T S P C
A S B S CL
P L S L L PP P
ASI
A OC
AS BS C
PHILIPPINES Discussion Note No.1: Economic Growth June 2011
DN1-15
SB CS O W B D I N S B
AS C
AI M T
References Asian Development Bank (2007). “Philippines: Critical Development Constraints,” Country
Diagnostic Study. Asian Development Bank and the World Bank (2005), “Improving the Investment Climate in
the Philippines, ADB and WB, Manila. Commission on Growth and Development (2008), The Growth Report: Strategies for
Sustained Growth and Inclusive Development, (Washington, D.C.: World Bank). Krugman, Paul R., James Alm, Susan M. Collins and Eli M. Remolona (1992), Transforming
the Philippine Economy. (New York: United Nations Development Fund, January). Rodrik, Dani (2009), “Growth After the Crisis,” Paper prepared for the Commission on
Growth and Development, May 12, manuscript. World Bank (2005), “Philippines: From Short-Term Growth to Sustained Development,”
Report No. 32055-PH, April 15. __________ (2007), “Philippines: Invigorating Growth, Enhancing Its Impact,” (Report No.
39226-PH, May 18. __________ (2009), “Philippines: Transport for Growth,” Report No. 47281-PH, PREM,
February 24. World Economic Forum (2009), “Global Competitiveness Report 2009-2010”,
www.weforum.org/ documents/GCR09/index.html
Note prepared by: Ulrich Lächler (EASPR) The World Bank
DN2-1
������������������������������
��������Achieving Sustained Poverty Reduction L P
E A ST
R
VC GDP
I
F
T HO
1. The Philippines had been making progress in the fight against poverty during the 1980s and 1990s, but relatively slowly. Using the $1.25-a-day income threshold measure of poverty, it succeeded in reducing poverty from around 30 percent in the early 1980s to just over 22 percent at the end of the 1990s. Though significant, the decline of poverty in the Philippines over this period was quite weak compared to the performance of other countries in the region. As a result, the poverty rate for the East Asia and Pacific region as a whole is now below the Philippine rate, even though it was nearly twice as high just two decades ago. This notable difference in the pace of poverty reduction was mainly due to an equally notable difference in the pace of per capita
Figure 1: Evolution of Poverty in the Philippines and Other
East Asian Countries
Source: World Bank, Development Data Platform. Note: the evolution of poverty in East Asia is strongly influenced by China, which weighs heavily in the regional average.
PHILIPPINES Discussion Note No. 2: Poverty June 2011
DN2-2
economic growth, which averaged 0.1 percent in the Philippines over this period, compared to 6.5 percent in the rest of the region.20
2. Progress in poverty reduction was interrupted by the East Asia financial crisis in 1997-98. Although the Philippine economy recovered after the crisis, with GDP growth reaching a high of 7.1 percent in 2007, its poverty indicators remained unchanged or even worsened. The poverty headcount ratio, or proportion of the population with incomes below the national poverty line, remained about the same between 2000 and 2003, and then increased between 2003 and 2006.21 The increase in poverty indicators over this period has been confirmed by different sources, utilizing different methodologies. This apparent combination of economic expansion and rising poverty flies in the face of the strong empirical regularity that has been observed worldwide between falling poverty and positive economic growth.22
Why has poverty not declined after 2000? 3. The absence of more dynamic economic growth, coupled with high degrees of income inequality, partly explains why poverty failed to decline since 2000. As noted at the beginning, low economic growth has a long-standing history in the Philippines and the growth episode since 2000 has been modest by regional standards. Furthermore, once the data biases discussed below are accounted for, economic growth in the Philippines is likely to have been even more modest than is indicated by the National Accounts. At the same time, the relatively high degree of income inequality exhibited by the Philippines reduces the income elasticity of poverty,23 posing a further barrier to faster poverty reduction. Finally, it
20 These marked differences in growth are discussed in the Discussion Note on “Restoring Faster Growth after the Crisis.. 21 The poverty gap, which measures how far households lie below the poverty line, also increased from 2000 to 2006; as did poverty severity, which takes into account the poverty gap, but places a higher weight on households that are further away from the poverty line. 22 The global food price crisis in 2007 and, particularly, the global financial crisis that followed in 2008 are likely to have raised poverty levels further. World Bank simulations using a micro-macro general equilibrium model indicate that the poverty rate will be 0.9 and 1.5 percentage points higher in 2009 and 2010 as a result of the global crisis than it would have been in the absence of the crisis. 23 A lower elasticity means that, compared to other countries, faster growth is needed to reduce poverty by the same amount. To appreciate this difference, note that it would take 20 years to cut the Philippine poverty rate in half with an annual per capita income growth rate of 2.5 percent and the growth elasticity of -1.3 estimated for the Philippines. The time to achieve this target would be reduced to 10 years with an annual growth rate of 5%,
Table 1: Philippines: Alternative Poverty Estimates; 2003-2006
Poverty Headcount Ratios Difference
2000 2003 2006 2003-06 Income-based measures
Official 1 33.0 30.0 32.9 2.9
World Bank 2 31.0 31.1 32.9 1.8 Consumption-based measures
World Bank ($1.25 per day)3 22.5 22.0 22.6 0.6
Balisacan 4 27.5 26.0 28.1 2.1 Sources: 1/ Philippines National Statistics Office; 2/ World Bank (2009), "Philippines: Inclusive Growth Report", based on FIES 2000-2003-2006; 3/ World Bank, Development Data Base; 4/ Balisacan, A. (2008).
PHILIPPINES Discussion Note No. 2: Poverty June 2011
DN2-3
is also important to mention the increase in the relative prices of food during 2003-06, as food price inflation grew faster than the Consumer Price Index, having an adverse impact on the real consumption of poor households. 4. The Philippines exhibits a very unequal, and possibly worsening, distribution of income and consumption. The World Bank’s Development Indicators currently identifies the Philippines as having the most unequally distributed income (or consumption) among the East Asian middle-income countries, whether measured by the Gini coefficient or the relative shares earned by the richest and lowest quintiles of the population. The evidence on the evolution of income distribution is less clear. The attached table indicates no change in the Gini coefficient for the Philippines since the early 1990s and a modest increase in the relative quintile share, while the rest of the region exhibits declines in both. Meanwhile, the Family Income and Expenditure Surveys (FIES) data indicates that overall income inequality has been declining since 2000. However, as mentioned below, the national income accounts and associated circumstantial evidence suggest that the distribution of aggregate income has worsened over the last decade once the richest households, which are usually under-represented in household surveys, are accounted for.
leaving everything else the same, or to 12 years if the growth elasticity were equal to the East Asian average of -2.3.
Table 2: Inequality in Selected East Asian Countries
Gini coefficients Hi-Lo quintile
shares*/ 1990-95 2002-08 1990-95 2002-08
averages, % ratios; latest year Philippines 44 44 8.3 9.0 China na 42 na 8.4 Indonesia na 39 na 6.7 Malaysia 49 38 12.2 6.9 Thailand 45 42 9.4 8.0 Vietnam 36 39 5.6 6.4 Sample Averages 44 41 8.9 7.6
Source: World Bank Development Indicators; based on household income (or, in some cases, consumption expenditure). Note: na = not available. */ The Hi-Lo quintile shares refer to share of total income (or consumption) received by the richest quintile divided by the share of the poorest quintile.
PHILIPPINES Discussion Note No. 2: Poverty June 2011
DN2-4
5. Even though the National Accounts point to a significant improvement in GDP growth over 2000-06, the Philippines household surveys indicate that average real household income and consumption have been steadily declining during this period. The FIES household survey data, from which the poverty indicators are drawn, indicate that average per capita consumption declined annually by 1.5 percent. This eliminates the mystery from the observed increase in poverty, confirming the commonly observed negative relationship between poverty and growth. What remains puzzling instead is that the National Accounts-based data indicate a rise in annual per capita growth to well over 2 percent in 2000-06, while the FIES surveys show the onset of negative growth. 6. The divergence between survey-based and National Accounts-based growth data is not unique to the Philippines. As noted by Angus Deaton (2006) in a comprehensive cross-country review,24 National Accounts-based estimates of GDP are typically, though not always, larger than survey-based estimates, and there is a tendency for the National Accounts-based estimates of GDP to grow more rapidly than the survey-based estimates. He also notes that the household survey data generally underestimates real consumption and income growth, mainly because the more affluent households are generally under-represented in the survey samples, while the National Accounts tend to over-estimate growth, primarily on account of measurement conventions in the compilation of GDP.25
24 Deaton, Angus (2005), “Measuring Poverty in a Growing World (or Measuring Growth in a Poor World)” Review of Economics and Statistics, Vol. LXXXVIII, No. 1, February, page 6. 25 There may also be shortcomings in the quality of the Philippines National Accounts that have exacerbated the overestimation of GDP growth. See, e.g., Medalla, F. and K. Jandoc (2008), “Philippine GDP Growth after the Asian Financial Crisis: Resilient Economy or Weak Statistical System?”, University of the Philippines, School of Economics Discussion Paper No. 0802, May, together with the response by the National Statistical Coordination Board in http://www.nscb.gov.ph/announce/ForTheRecord/16Dec2009_PhilippineGDPEstimates.asp
Table 3: Per Capita Income and Expenditures in the Philippines
(in Constant Pesos)
(Average annual growth rates, %)
1985-1997 2000-03 2003-06 2000-06
Household Survey-based growth rates
Expenditures per capita 2.7 -0.9 -0.5 -0.7
Income per capita n.a. -1.7 -1.2 -1.5
National Accounts-based growth rates
Consumption per capita 1.7 2.3 3.5 2.9
GDP per capita 1.4 1.7 3.6 2.7 Source: The household survey-based figures refer to the Family Income and Expenditure Survey; the figures up to 1997 are from the World Bank (2001), Philippines Poverty Assessment, and the figures as of 2000 are from the Philippines National Statistics Office. The National Accounts-based growth rates are from the World Bank Development Database.
PHILIPPINES Discussion Note No. 2: Poverty June 2011
DN2-5
7. Even though the National Accounts tend to over-estimate growth, circumstantial evidence (e.g., export growth, corporate profits) indicates that, on balance, economic growth has been positive during 2000-06. Also, the Social Weather Station reports corroborate the increase in poverty since the early 2000s, as observed from the household survey data. This suggests that the growth that did take place during that period must also have been associated with an overall deterioration in the distribution of income, contrary to what is indicated by the household surveys. That is, increases in poverty must either be due to declines in average real income (or consumption), a worsening distribution of income or a shift of the poverty line. Since the poverty line is not being shifted and total per capita GDP growth is positive, the increase in poverty observed between 2003 and 2006 would have to be due to a worsening of the distribution of income. This is clearly a matter of concern, as the Philippines already exhibits among the highest degrees of income inequality in the region. The sources of low poverty responsiveness to growth 8. Several factors have contributed to the apparent deterioration in the distribution of income and consumption. These include (i) an unequal sector distribution of growth, (ii) an unequal pattern of regional development, and (iii) intense demographic pressures. Before addressing each of these in turn, however, it may be useful to briefly review some of the key characteristics of the poor. Poor Filipinos differ from the rest of the population along various dimensions. In particular, they tend to live in rural areas and work in agriculture, though urban poverty is becoming increasingly important. They also tend to have less access to basic services, lower levels of education, and larger families. Like the non-poor, they derive most of their income from wages, but unlike the non-poor, rely mostly on domestic remittances with little access to foreign remittances.
PHILIPPINES Discussion Note No. 2: Poverty June 2011
DN2-6
Agriculture
Fisheries
Mining
Manufacturing
Utilities
Construction
Trade
Transportation
FinanceReal Estate
Other Services
01
02
03
0
Co
ntri
butio
nto
Job
Cre
atio
n,2
001-
200
7(%
)
0 5 10 15 20
Contribution to Growth, 2001-2007 (%)
Contribution to Growth and Employment Generation
9. Sector dimensions of growth. Since the poor are largely engaged in agricultural activities and least endowed with skills, their fortunes are closely linked to agriculture sector performance and the evolution of real wages for unskilled labor. The sector pattern of growth observed since 2000 has not been favorable to agriculture and largely benefited other sectors that tended to be less intensive in the use of labor. Manufacturing, in particular, was among the largest contributors to growth during 2001-07, but among those that least contributed to job creation; see Figure 2. Agriculture, on the other hand, made a large contribution to job creation, simply by virtue of being a very labor intensive sector, but its contribution to GDP growth was limited. Furthermore, the limited employment growth that has taken place overall during this period mainly has favored the more educated workers, contributing even less to poverty reduction. As a result, the economy has not created enough jobs to keep up with the country’s rapid population growth. Whereas the working-age population grew by 17.6 percent between 2001 and 2007, employment only grew by 13 percent. 10. Demographic dimensions of growth. The Philippine labor market faces difficult demographic challenges. Population growth is among the highest in the region and, given that the Philippines is still in the early stages of demographic transition, dependency ratios are high.26 These factors strain the economy’s capacity to maintain full employment and generate adequate real wage growth. Moreover, labor supply pressures have only been partly mitigated by a surge of international migration and decline in labor force participation. So, in spite of more rapid economic growth since 2000, real wages have been falling and unemployment levels have been inching upwards. 11. Regional dimensions of growth. There are significant differences in income and poverty levels across regions in the Philippines, with some regions exhibiting increased per capita income growth since 2000, while others have reported declines. In that context, it is conceivable that the overall poverty rate stopped declining during 2000-06 due to an uneven
26 The dependency ratio, defined as the ratio of children under 15 and adults over 65 divided by the total working-age population, was calculated as 65 percent for the Philippines in 2005. The Philippine ratio exceeds the dependency ratios of Thailand (by 50%), Indonesia (by 27%) and Malaysia (by 16%).
Figure 2: Sector Contribution to Growth and Employment
Source: World Bank calculations based on data from the Philippines Statistical Yearbook.
PHILIPPINES Discussion Note No. 2: Poverty June 2011
DN2-7
regional pattern of growth. When aggregate GDP growth is positive, this can only happen if the overall income distribution across regions worsens; see Technical Annex. That is, the pattern of growth would have to be such that the rich regions are becoming richer on average, while the poor regions are becoming poorer. Such a pattern has indeed been observed, as regions with a higher per capita GDP in 2000 tended to exhibit faster GDP growth during 2000-06; Figure 3.
Figure 3: Poverty and Economic Performance in the Philippines; by region
Note: The data points refer to the 16 administrative regions in the Philippines. Source: FIES 2000, 2003, 2006.
12. Barriers to labor mobility. As argued in the 2009 World Development Report, spatial disparities in income and production are inevitable, being driven largely by economies of scale and agglomeration effects. The same can be said of disparities in sector growth. Such disparities across sectors and regions need not result in higher poverty rates, however, provided that there is adequate labor mobility across sectors and regions. Unfortunately, various signs point toward the presence of barriers to factor mobility in the Philippines, resulting in market segmentation. To begin, the marginal product of labor varies widely across manufacturing sub-sectors without a tendency to converge over time. The manufacturing sector also appears to be extremely capital-intensive, which further impairs the already limited labor absorption capacity of that sector. Finally, there are significant differences in real wages across different geographic areas, suggesting a regional segmentation of the labor market.27 Another sign of possible labor market segmentation is given by the increase in the unemployment rate of skilled labor over 2003-07. This suggests that there is an excess supply of skilled labor in the market, especially for younger cohorts, which would be expected to depress their real wages. Instead, skill premiums have been increasing, possibly pointing toward the presence of job rationing.28
13. Significant disparities in the marginal products of labor across sub-sectors in manufacturing would normally not be allowed to persist in the presence of vigorous competition. The persistence of such disparities, therefore, provides prima facie evidence of
27 For example, the daily average wage in NCR is one-third higher than the national average and these differences are significant, even after accounting for differences in education attainment and labor market experience. 28 Alternatively, the rising premiums could also be indicating the existence of skill mismatches (i.e., the skills supplied do not match those demanded by employers) or it could reflect an increase in the reservation wages of younger skilled workers.
PHILIPPINES Discussion Note No. 2: Poverty June 2011
DN2-8
an absence of competition. This absence of competition appears to be mostly due to domestic anti-competitive practices (or “behind the border constraints”) in many sectors.29 According to the latest MFN Tariff Trade Restrictiveness Index, the Philippines remains a relatively open economy (except in some agricultural commodities), comparing well to the average East Asian & Pacific and lower middle-income countries. However, the Philippines exhibits significant domestic constraints that protect existing businesses: it ranks 141st out of 181 countries in the Ease of Doing Business index for 2009, reflecting a cumbersome business environment. Particularly burdensome are restrictions on foreign ownership of Philippine assets, coupled with a weak judiciary system and the prevalence of regulatory capture.30 These constraints reduce the contestability of markets, limiting the incentive to innovate and raise productivity. 14. The maintenance of protectionist policies in key agricultural sectors also exacerbated the low productivity growth in agriculture, limiting further the sector’s capacity to employ labor. Another factor contributing to the low productivity in agriculture is the growing scarcity of land and reduction in the amount of land per worker. This has been aggravated by agrarian reform policies that interfere with the effective functioning of land markets. These factors have tended to accelerate the decline in agriculture’s employment share, pushing workers into the unproductive informal sectors, given the absence of sufficient labor demand from the manufacturing and high productivity service sectors.31
15. On paper at least, the Philippine labor market regulations are among the most rigid in the region. These regulations were designed to protect workers, but end up
29 In a diagnostic of the Philippine economy carried out in the early 1990s, Paul Krugman et al (1992) had found that the Philippines was characterized by a highly inefficient manufacturing sector sheltered behind high protective walls and using excessively capital-intensive techniques. Though import barriers have come down since then, they are still significant for certain sectors, particularly in agriculture. 30 The problem of regulatory capture appears to be associated mainly with shortcomings on the enforcement side, rather than in the regulatory framework itself. 31 This pattern is reflected in the evolution real sector wages between 2000 and 2003: real daily wages over this period actually increased by 14% in agriculture over this 3-year period, albeit from a very low relative level, while only increased by 3% in manufacturing and declined by 5% in the services sector. The economy-wide average real wage declined by 1% over this period.
Table 4: Minimum Wage Levels in East Asia
Level of the minimum wage (2007 or latest)
Country PPP (US$) As % of
GDP per capita As % of
average wage Philippines 424 150.6% 90.8% Nepal 133 132.4% Cambodia 156 103.8% Bangladesh 69 63.6% Vietnam 120 55.7% 58.5% India 113 50.9% 22.8% China 204 46.3% 37.5% Thailand 304 46.2% 56.0% Indonesia 142 45.8% 64.0% Korea 815 39.4% 28.9% Lao 65 38.0% Taiwan 955 38.0% 36.7% Sri Lanka 122 36.0%
Source: ILO-Global Wage Report 2008/09, “Minimum wages and collective bargaining: towards policy coherence.”
PHILIPPINES Discussion Note No. 2: Poverty June 2011
DN2-9
interfering with the labor market clearing process and artificially raising the cost of labor. The extremely high minimum wage levels are particularly worrisome in this regard.32 Though it is not fully clear to what extent these labor market regulations are binding, some empirical evidence (reported in World Bank, 2005) indicates that labor market regulations are a significant determinant of employment growth in the Philippines, and a significant number of firms (25 percent) cite labor regulations as a severe constraint on their operations. The recent debate in OECD countries about the optimal configuration of flexible labor legislation and secure social protection provides useful insights for potentially new approaches to tackling the problems of the Philippine labor market. The international evidence suggests that efficiency gains might be achieved by strengthening social protection – e.g., unemployment insurance or safety nets – in a way that is inclusive and mobility-friendly. Rendering growth more pro-poor 16. To reduce poverty and build a broader base for future economic prosperity, fostering more inclusive growth is a priority. The first step in this direction is to accelerate overall growth, which will not be easy in the short run, while the global financial and economic crisis continues to play out. This requires eliminating the main constraints on growth in the Philippines, which have been identified in previous diagnostic studies as (i) a very vulnerable fiscal situation, (ii) inadequate public infrastructure, especially in transport and electricity, and (iii) a weak investment climate due largely to governance concerns.33 Eliminating these constraints is essential for restoring growth, but may not be enough for accelerating poverty reduction. As pointed out in the preceding discussion, policymakers also need to be concerned about the distributional consequences of growth and ensuring that it is sufficiently broad-based. 17. Because the poor predominantly work in sectors and regions that are growing less rapidly, generating better income-earning opportunities for the poor is critical for poverty reduction. As described earlier, the poor work mainly in the low-growth, low-productivity agricultural sector, while the capital-intensive and skills-intensive nature of more dynamic sectors makes it difficult for them to gain entry. Meanwhile, demographic pressures are pushing real wages down in the absence of more dynamic growth in labor absorbing activities. This leaves policymakers with two broad alternatives for generating better income-earning opportunities for the poor. The traditional approach has been to seek for ways to promote faster growth in the poorer regions and low skill-intensive sectors in the hope of catching up to the other, faster growing regions and sectors of the economy. An alternative approach is to allow the marketplace to take the lead in determining the most dynamic sectors with the greatest growth potential, while focusing government efforts on providing a growth-friendly macro-environment, eliminating barriers and distortions that prevent a faster labor absorption into the most dynamic sectors, facilitating greater labor mobility across regions and sectors, and promoting human capital development. 18. The key to generating better income-earning opportunities is the integration of lagging with leading regions and sectors of the economy. The 2009 World Development
32 The Philippines also stands out in terms of having among the most restrictive fixed-term contract regulations, as reported by ILO-LABORSTAT. 33 These constraints and their elimination are addressed in Discussion Note No. 1.
PHILIPPINES Discussion Note No. 2: Poverty June 2011
DN2-10
Report argued that spatial disparities in income and production are inevitable, as they are driven by economies of scale and agglomeration effects, and that government efforts to spread out economic activity equally across the board have generally proven to be futile. The same can be said about government efforts to “pick winners” among different economic sectors. The more promising approach, therefore, is to seek the integration of lagging and leading regions and sectors of the economy. This approach begins with the application of ‘spatially blind’ policies (such as the definition and enforcement of property rights and the removal of distortions that interfere with the functioning of markets), investment in social services and maintenance of sound macroeconomic policies. Where there is limited labor or population mobility, the spatially blind policies need to be complemented with spatially connective infrastructure and social investments, to enable people and workers in the lagging regions and sectors to integrate more easily with the leading regions.
19. A common question facing policymakers in countries with very disparate levels of development across regions and sectors is whether to invest the limited public resources in places (physical infrastructure) to promote faster growth or in people (human capital) to promote faster poverty reduction. The general answer is that countries should invest in activities that produce the highest economic and social returns nationally. This means emphasizing durable infrastructure investments that increase national economic growth in the leading places with a revealed capacity to grow, and emphasizing human capital investments in lagging places; that is, providing portable investments that stimulate mobility and accelerate poverty reduction.34
20. In agriculture, the application of this approach points toward a need to review and revise the existing sector policy framework in the Philippines, with particular attention to the strategy to achieve self-sufficiency in the production of rice and other basic commodities, and with respect to the agrarian reform. The rice subsidy, in particular, is keeping significant amount of resources tied up in a low value-added activity, instead of allowing them to shift to higher value-added activities. Reforms in this sector should mainly look toward (i) reducing the high tariff and non-tariff barriers to trade that continue to be applied for certain commodities, (ii) revising the agrarian reform to permit better functioning land markets, while (iii) considering agriculture-specific public infrastructure investments on a very selective basis in areas with revealed growth potential. Even with such reforms, however, agriculture will not become the main pathway out of poverty in the Philippines except possibly in certain rural provinces with strong geo-physical endowments.35 Moreover, the sector’s growth outlook is clouded by the detrimental implications of prospective climate change.
21. In manufacturing, this approach argues for the need to enhance competition, remove key investment constraints, and eliminate distortions in factor markets as key priorities for improving productivity and employment generation. While manufacturing has been a relatively dynamic sector of the economy, it is not living up to its full potential in
34 Investments in human capital development in effect seek to transform low-skill labor into the higher-skill labor that was already revealed to be most in demand in the leading industrial and services sectors. 35 The policies recommended here are not designed to reverse the natural decline in agricultural employment observed in all countries as they develop. Rather, their intent is to eliminate sector distortions that accelerate the decline in agriculture employment, pushing workers prematurely into the low productivity informal sectors.
PHILIPPINES Discussion Note No. 2: Poverty June 2011
DN2-11
terms of its contribution to overall growth and job creation. Generating a better sector performance will require (i) removing domestic barriers to competition (“behind the border constraints”), while establishing a ‘competition authority’ and facilitating better access to financing by small and medium-sized enterprises, (ii) addressing the most important shortcomings in the investment climate (namely, poor governance and the low quality of public infrastructure), and (iii) modernizing the country’s labor market regulations.36 It is also necessary to review the import tariff and tax structure, as well as the investment code, with a view to eliminating any exemptions or fiscal incentives that are keeping the cost of capital artificially low. 22. In services, this approach argues in favor of building on some of the revealed comparative advantages exhibited by the Philippines. Certain leading sectors, notably the Business Process Outsourcing industry, have grown rapidly in recent years, taking advantage of the country’s English language skills and improved informational connectivity from earlier telecom reforms. The main challenge for policymakers is to facilitate further growth in these sectors through appropriate investments in public infrastructure and expansion of complementary education services. In these cases, the private market already has ‘picked the winners’, while the public sector would be playing a facilitating role. Another sector with apparent comparative advantages that have not yet been revealed is tourism. It also has the potential to become a major source of employment for low-skill labor and directly contribute to poverty reduction. To realize that potential, however, it will be necessary the address various key constraints discussed earlier, including inadequate transport and energy infrastructure, which currently render the sector uncompetitive vis-à-vis other providers in the region.37
23. The other critical element of this approach is the facilitation of greater labor mobility across sectors and regions, accompanied by measures to provide adequate social protection and improved social services. To facilitate greater labor mobility, policymakers could consider a substantial relaxation of the most notable labor market rigidities, particularly those related to high minimum wages and strict limitations on temporary contractual arrangements, all of which limit the creation of jobs. In parallel, it is necessary to introduce better, well-targeted social protection mechanisms that address the concerns that gave rise to the existing legislation, but generate fewer distortions in the labor market. The expansion of well-targeted social safety net mechanisms, such as the government’s conditional cash transfer program (Pantawid Pamilyang Pilipino Program, 4Ps), would provide a modest redistributive impact that could help reduce the degree of income and consumption inequality prevailing in the Philippines, and which was shown earlier to contribute to the persistence of poverty.38 More importantly, however, it would help poor households to avoid having to engage in coping strategies that perpetuate poverty (such as pulling children out of school during economic downturns) and would encourage greater labor
36 Measures to improve governance, including the elimination of regulatory capture, are treated in a separate Discussion Note. 37 Here, too, the prospects of climate change present important challenges for the tourism industry, in particular, considering the rising frequency of typhoons and its implications for coastal development. 38 The government has already begun to expand the 4Ps program, from the pilot phase of 20,000 households in 2007 to one million households in December 2009.
PHILIPPINES Discussion Note No. 2: Poverty June 2011
DN2-12
mobility by reducing risk aversion, permitting workers to seek out more productive income-earning opportunities. 24. Finally, from a longer term perspective, it is also critical to improve the quality and access to health and education services. In the final analysis, workers must be healthy and well-educated to take full advantage of new income-earning opportunities that open up in different regions and sectors with the recovery of economic growth.39
Policy actions for consideration 25. The preceding discussion points toward a number of policy actions that could help to accelerate poverty reduction. These actions are outlined below and summarized in greater depth in the other accompanying Discussion Notes:
• Implement policy actions to accelerate economic growth (as outlined in the Philippines Discussion Note No.1 (Growth), with a focus on removing the main constraints on growth. These actions focus on strengthening the tax policy and administration effort, raising the public investment effort over the next five years, and improving governance to create a better investment climate for the private sector.
• Take actions to improve the quality of statistics to permit further analysis of growth-poverty linkages; as discussed in the Philippines Discussion Note No. 25 (Statistics).
• Set up a working group to review potential bottlenecks in the financial system that inhibit access to financing by small and medium enterprises; for further detail see the Philippines Discussion Note No. 6 (Competitiveness).
• Set up a working group to review labor market legislation and institutions with the aim of removing barriers to labor mobility.
• Take measures to improve productivity in the agriculture sector, which remains an important source of low-skill employment, and review the competition framework in manufacturing with the aim of enhancing job creation. For further details see the Philippines Discussion Note No. 10 (Agribusiness) and No. 6 (Competitiveness).
• Take steps to consolidate and expand the coverage of social protection system, giving special attention to the government’s conditional cash transfer (4Ps) program, while phasing out other, less effective social transfers. Specific measures in this area are discussed in the Philippines Discussion Note No. 17 (Social Protection).
• Take measures to improve the coverage and quality of basic education; for further details see the Philippines Discussion Note No. 12 (Basic Education).
39 Various options for strengthening the social protection system in the Philippines, as well as the options for improving service delivery in health and education, are discussed in greater detail in separate Discussion Notes.
PHILIPPINES Discussion Note No. 2: Poverty June 2011
DN2-13
Technical Annex The Link between the Regional Composition of Growth and the Evolution of Poverty
Consider a country with two regions; one rich and the other poor. The poverty headcount ratio in each region is denoted Hi for i = R (rich) or P (poor), and GDP (or Income) per capita is denoted Gi for i = R, P. The total GDP (G) and poverty headcount ratio (H) of that country can then be calculated as weighted averages of the regional per capita GDPs and poverty ratios:
H = RHR + PHP, and
G = RGR + PGP,
where R and P represent the shares of total population in regions R and P, such that R + P
= 1.
Assume that the poverty headcount ratio in each region is negatively related to per capita GDP in that region, with decreasing marginal impact. That is, for Hi(Gi) > 0, Hi ’< 0 and Hi’’ > 0, for i = R and P. These second order assumptions simply say that the impact of an increase in per capita GDP on poverty reduction tends to diminish as the region becomes richer. With this simple model, the evolution of a country’s GDP and overall poverty headcount ratio are determined by the evolution of the regional per capita GDP levels, as follows:
dH = RHR’ dGR + PHP’dGP
dG = R dGR + PdGP
or, expressed in vector notation: (dH, dG)’ = [A] (dGR , dGP)’. The matrix A in this
expression is signed , and its determinant is given by = R* P (HR’ - HP’) > 0, since HR’ > HP’ as long as GR > GP.
By inverting the previous expression, it is possible to determine what the regional growth patterns would have to look like in order for both the overall poverty headcount ratio and the overall per capita GDP level to be increasing. That is, (dGR , dGP )’ = [A]-1 (dH, dG)’, where the inverse matrix, [A]-1, is now signed . From this expression, the only way that H and G can both increase (i.e., dH > 0 and dG > 0) is if the rich region becomes richer and the poor region poorer (i.e., dGR > 0 and dGP < 0). As discussed in the main text, such a pattern seems to have characterized regional growth in the Philippines during 2000-2006.
PHILIPPINES Discussion Note No. 2: Poverty June 2011
DN2-14
References Balisacan, Arsenio M. (2008), “The Philippines: What Has Really Happened to Poverty in
Recent Years of Growth?” Partial draft, March 3. Deaton, Angus (2005), “Measuring Poverty in a Growing World (or Measuring Growth in a
Poor World)” Review of Economics and Statistics, Vol. LXXXVIII, No. 1, February, page 6.
Medalla, F. and K. Jandoc (2008), “Philippine GDP Growth after the Asian Financial Crisis:
Resilient Economy or Weak Statistical System?”, University of the Philippines, School of Economics Discussion Paper No. 0802, May.
National Statistical Coordination Board (2009), http://www.nscb.gov.ph/announce/ForTheRecord/16Dec2009_PhilippineGDPEstimates.asp
Social Weather Stations. http://www.sws.org.ph/
World Bank (2009), World Development Report 2009: Reshaping Economic Geography,Washington, DC; 383 pages.
________ (2010), “Philippines: Fostering More Inclusive Growth,” January 28. ________ (2010), Philippines Discussion Note No. 2: “Restoring Faster Growth after the
Crisis.”
Note prepared by: Ulrich Lächler (EASPR) The World Bank February 19, 2010
I. STABLE MACRO ECONOMY
DN3-1
������������������������������������������������������������The urgent need to reverse the erosion of tax revenues
AA
PK P T P
E
T PR
VAT B
TP I
T
1. Collecting enough taxes to finance essential public expenditures has been a perennial challenge for the Philippines. After peaking at 17 percent of GDP in 1997, total tax revenues declined steadily in the aftermath of the East Asian Financial Crisis, falling below 13 percent in 2002 and 2003. At that point, the Philippines faced a fiscal crisis, with an overall fiscal deficit of 5.6 percent of GDP and a debt-to-GDP ratio that reached 100 percent. The Philippine authorities managed to avert a crisis through a set of fiscal measures in 2005 that broadened the base of the value added tax (VAT), increased the VAT rate from 10 to 12 percent, and increased the corporate income tax (CIT) rate from 32 to 35 percent. These reforms succeeded in partially reversing the erosion of tax collections since 1997, but their impact was short-lived as the total tax intake began to decline again after 2006. By 2009, the GDP-share of total tax revenues was projected to be back to where it had been in 2003 (Table 1). 2. Several factors contributed to the decline in tax effort since 1997. By far the most important is the decline of excise tax revenues. These fell by 1.8 percent of GDP between 1997 and 2008, mainly on account of inflation erosion, accounting for almost two-thirds of the overall 2.9 percent of GDP decline of total revenues over this period. Tax policy reversals after 2005 also share some of the blame. In particular, the 2005 tax reform contained the seeds of its own destruction by including a sunset clause whereby the corporate income tax rate would be cut to 30 percent on January 1, 2009.40 Also, Congress passed various tax-
40 The original reform plan was to accompany the tax rate reduction by an elimination of fiscal incentives to maintain revenues constant. The elimination of fiscal incentives did not take place, however, so revenues fell.
PHILIPPINES Discussion Note No.3: Tax Policy and Administration June 2011
DN3-2
eroding measures since the 2005 tax reforms, and there have been indications of periodic weakening in tax administration.41
Table 1. Philippines: Revenue Trends by Tax Type; 1997-2009
Source: Bureau of Treasury, Department of Finance, Bureau of Customs; and World Bank staff projections.
3. The weak tax collection performance poses a major problem for the Philippines’ development prospects and its poverty reduction efforts. To begin, the low public revenue base leaves public finances very vulnerable to destabilizing shocks. The resulting increase in fiscal risk raises public sector borrowing costs and renders the country less attractive for private investors. To limit the risk of fiscal crisis, the government is forced to cut back public expenditures (weakening the provision of social and public infrastructure services), contributing to a further deterioration of the investment climate – holding back growth and poverty reduction. Moreover, as discussed below, the decline in tax revenues over the last decade has rendered the entire tax system more regressive, further hampering poverty reduction efforts. 4. Based on these considerations, the Philippines urgently needs to raise its tax revenue intake. This requires the establishment of a sound tax policy framework, complemented by an efficient and well-governed tax administration system. Together, they form the only route to revenue sufficiency and the sustainable financing of essential public goods. Both are also essential components of a sound investment climate that fosters domestic and foreign investment and hence economic growth. Equitable tax laws and the impartial application of those laws are necessary to achieve the objectives of horizontal and
41 The slowdown in economic activity and international trade flows on account of the global financial crisis of 2008-09 also contributed to the decline in tax revenues, but only to a minor extent, considering that projected CIT and PIT revenues only declined by roughly 0.3 percent of GDP between 2007 and 2009, while customs revenues remained more or less constant as a share of GDP.
PHILIPPINES Discussion Note No.3: Tax Policy and Administration June 2011
DN3-3
vertical equity (paragraph 13). A tax system that does not satisfy both criteria can lead to enormous inequities among taxpayers and to an uneven playing field, undermining fair competition and the efficiency of the market system, while eroding the citizenry’s trust in government and in the political system as a whole. A. Key Features of the Philippine Tax System 5. The value-added tax (VAT), corporate income tax (CIT) and personal income tax (PIT) account for over two-thirds of the entire tax intake in the Philippines.42 The statutory rates applied on each of these tax categories tend to be somewhat higher than those applied on average elsewhere in the region or in countries with similar levels of development (Table 2). However, the revenues generated by these taxes as a share of GDP are not proportionately higher. That is, the Philippines exhibits a comparatively low tax efficiency relative to its neighbors or other countries with similar levels of development. This may be signaling the presence of significant tax loopholes and weak tax administration. In 2008, World Bank staff estimated that if tax administration were strengthened and leakages in tax collection were plugged, the Bureau of Internal Revenue (BIR) would collect 60 percent more in income taxes and VAT – which would have amounted to 4 percent of GDP on average in 2000-2006.43 Important features of the tax system that contribute to tax leakage and evasion in the Philippines are summarized next.
Table 2: Efficiency of Taxation in the Philippines and Selected Countries* Philippines
Value Added Tax (VAT) Tax Rate Revenue as Share of GDP Tax Efficiency**
12.0 2.20 18.0
12.0 4.10 34.0
10.0 3.62 36.0
7.0 3.80 54.0
10.7 5.21 47.0
15.6 7.40 48.0
15.8 6.37 41.0
Corporate Income Tax (CIT) Tax Rate Revenue as Share of GDP Tax Efficiency**
35.0 3.60 10.0
30.0 0.85 3.0
30.0 5.20 17.0
27.6 5.53 18.0
25.5 3.25 13.0
26.4 3.45 13.0
Personal Income Tax (PIT) Tax Rate (Maximum) Revenue as Share of GDP Tax Efficiency**
32.0 2.10 6.6
35.0 3.51 10.0
31.0 2.10 6.0
29.4 4.20 16.0
26.8 2.71 12.0
29.7 3.72 14.0
Source: USAID, Fiscal Reform and Economic Governance database 2008-09, www.collectingtaxes.net, and Table 1. Note: * Figures for Indonesia, Philippines and Thailand refer to 2007, while the regional averages are based on figures for 2008 or the most recent year available. ** Tax Efficiency is calculated as the ratio of Tax Revenue as a share of GDP divided by the Tax Rate.
42 The remaining tax revenue is mainly made up of customs revenues and excise taxes. 43 A similar result obtains if we assume that the Philippines is able to increase tax efficiency in the three tax categories shown in Table 2 to the East Asia & Pacific averages, while keeping rates unchanged. This would raise total revenues generated by these taxes by 77 percent (from 9.8 percent of GDP to 17.4 percent). However, to achieve the average level of tax efficiency attained in the other East Asian countries, it may be necessary to reduce some of the rates (to encourage better compliance), in which case the appropriate comparator would be the average tax intake in East Asia from these three taxes, which amounts to 14.9 percent of GDP. This would represent a 52 percent increase over the current tax intake in the Philippines.
PHILIPPINES Discussion Note No.3: Tax Policy and Administration June 2011
DN3-4
6. Value-Added Tax. The VAT is a well designed tax, though its efficiency and yield could be improved. Introduced in 1988, it has a relatively broad base, a single and low (positive) tax rate, and a reasonable exemption threshold. These features facilitate both the administration and compliance with the tax. It is estimated that the VAT is neutral to broadly progressive since it contains standard VAT exemptions for products that are heavily consumed by the poor (e.g., basic consumption staples). The VAT base was broadened in 1994 with the inclusion of services and again in 2005 with the inclusion of petroleum products and electricity. Each round of VAT base broadening noticeably increased the efficiency of the VAT (Figure 1). However, these efficiency gains did not prove sustainable over time. For example, 70 percent of the efficiency gains achieved from the 2005 VAT reforms were lost by 2009. This efficiency erosion is due to a mix of weak tax and customs administration and tax policy measures that reversed the initial broadening of the VAT base (such as the replacement of the VAT on electricity transmission in 2009 by a lower yielding and less efficient franchise tax).
Figure 1
Philippines: Evolution of VAT Efficiency; 1997-2009
Figure 2 Philippines: Progressivity of the PIT;
2000 vs. 2006
0
0.5
1
1.5
2
2.5
3
3.5
4
4.5
5
0-1 1-10 10-25 25-50 50-75 75-90 90-99 100
Income Tax Payments as a Share of Total Household Expenditure Percent
Quantiles of Total Household Expenditure (i.e., expenditure distribution)
Source: BIR, BOC, and World Bank staff calculations. 1/ Ratio of VAT revenues to GDP divided by the statutory VAT rate. 2/ Ratio of VAT revenues to consumption divided by the statutory VAT rate.
Source: FIES 2000 and 2006 and World Bank staff calculations
7. Corporate Income Tax. The CIT is overly complex and characterized by an extensive regime of tax exemptions or “incentives”. Widespread tax incentives—mostly in the form of tax holidays—significantly distort economic activity by discriminating between different types of businesses, reduce the tax base, and impose high effective tax rates (by regional standards) on companies that are not eligible to receive them. High effective rates, in turn, generate profound inequity among taxpayers, both horizontally (as companies with the same reported profit pay vastly different taxes)44 and vertically (as taxpayers with high profitability could be paying less tax than those with much lower profits). Large inequities of this sort, alongside a complex and non-transparent system, promote the perception of ‘unfairness’, and are known to noticeably reduce voluntary tax compliance and increase corruption opportunities. Tax incentives also tend to generate tax redundancies (i.e., subsidizing firms that would have invested anyway).
44 The difference in effective CIT tax rates between companies with and without incentives is the largest in the region. (Botman et al., 2008)
PHILIPPINES Discussion Note No.3: Tax Policy and Administration June 2011
DN3-5
8. Personal Income Tax. Compliance with the PIT is very low so that actual progressivity is minimal and falling over time. Much of this problem is due to poor tax administration, as the top marginal tax rate is fairly high by regional standards. The bulk of the problem arises with self employed professionals (SEPs): a weak capacity in detecting and enforcing tax liabilities, particularly of SEPs, has had the result that income tax payments accounted for only 4.7 percent of the total spending of the 1 percent richest households of the country in 2000 (and far less as a ratio of their income). This compares to an average tax rate of over 20 percent (using the maximum standard deductions). By 2006, the same top 1 percent of households was devoting an even smaller share (3.1 percent) of its total spending on income tax payments. Figure 2 shows the drop in effective income tax progressivity between 2000 and 2006. 9. Excise Taxes. The revenue yield from excises has declined drastically since 1997 due to the erosion of the real value of excise rates. From 1997 to 2009, excise collection as a share of GDP fell by 70 percent, or by 1.8 percentage points of GDP (Table 1). The annual losses in excise collection since 1997 add up to a staggering 18.2 percentage points of GDP once interest costs are included.45 Maintaining the 1997 excise effort level would have resulted in a much lower public debt (at present exceeding 60 percent of GDP), freeing up fiscal resources that are currently needed to service the debt for much needed public spending in priority areas. 10. Most of the decline in excise tax revenues is accounted for by petroleum excises. Considering that petroleum excises are broadly as progressive as personal income taxes in the Philippines and more progressive than the VAT (Figure 3), the decline of this tax has noticeably eroded the overall progressivity of the tax system. In contrast to petroleum excises, tobacco and alcohol excises are regressive. The tobacco excise tax rates and burden in the Philippines are among the lowest in South East Asia.46 A major downside of this policy stance is that the country has become the largest consumer of cigarettes among ASEAN countries (and 15th worldwide), where almost one fifth of Filipinos begin smoking before the age of 10 and prevalence is increasing. 11. Tax Administration. The preceding discussion noted that tax efficiency has tended to be somewhat lower in the Philippines than in other countries in the region. Table 3 presents some operational statistics on the internal revenues agency in the Philippines compared to
45 Since the fiscal balance has been in deficit, the foregone revenue was financed through debt issuance. 46 Due to concerns with undervaluation of excisable products, a 1996 tax reform led to a shift in excise taxation from an ad-valorem to specific (or unit) tax rates, but did not allow for automatic inflation adjustment of the rates.
Figure 3 Philippines: Petroleum Taxation and the Poor
Source: FIES 2006 and World Bank staff calculations
PHILIPPINES Discussion Note No.3: Tax Policy and Administration June 2011
DN3-6
agencies elsewhere. The Philippines’ BIR stands out in this comparison by having a very low ratio of BIR staff to the overall population; only about 0.13 staff members for every 1000 inhabitants, while the regional average is almost four times greater. Also, the last row in Table 3 shows the Philippines with the highest ratio of individual taxpayers to administrative personnel among all the comparators (609 versus the East Asian average of 579). From this it would appear that the BIR is operating very efficiently. When taking into account the relatively poor tax efficiency performance indicated earlier in Table 2, however, these figures suggest that the BIR is simply not making a strong enough tax effort. This could account in part for the comparatively low cost of administration as percent of the revenues collected (first row in Table 3). Another indication of low tax effort is the low percentage of taxpayers in the Philippines: there are only 79 taxpayers registered in BIR for every 1000 inhabitants, while the East Asian and Pacific average is 284 taxpayers per 1000 inhabitants.47 That is, the BIR’s capacity or willingness to draw in potential taxpayers appears to be limited.
Table 3: Key Indicators of Tax Administration in Selected Countries; 2008or most recent year Philippines
(BIR)*
IND THA
East Asia & Pacific
Low-Mid
Income
World
Admin. Cost /Total Tax Revenues (%)
0.63 0.38 0.60 1.19 1.52 1.08
Tax Admin. Staff/(Population/1000)
0.13 0.25 0.31 0.49 0.51 0.82
Taxpayers/Tax Admin. Staff 609 471 406 579 249 437 Source: USAID, Fiscal Reform and Economic Governance database 2008-09, www.collectingtaxes.net.Note: * the indicators for the Philippines only refer to the Bureau of Internal Revenue (BIR).
12. Tax evasion in the Philippines is estimated to be high and weaknesses in tax administration are systemic, including shortcomings in overall management and integrity. Despite this, previous tax administration reform efforts in the BIR have been partial rather than systemic, and ongoing efforts have been focusing on the pursuit of short-term revenue targets and the technical strengthening of specific functions or units, rather than on overall institutional reform. The short-term focus on revenue targets reflects the Executive’s need to compensate for an increasingly weak and distorted tax system, largely due to a series of tax-eroding measures passed by Congress.48 However, this does not appear to be the most promising way to increase tax collections. Only a more systemic institutional reform can deliver on this objective. The main shortcomings in tax administration that need to be addressed in this regard encompass the registration, audit, enforcement and collection processes, and can be summarized as follows:
• Registration. The taxpayer registration system is outdated, containing many old and invalid entries, and excluding a large number of eligible taxpayers.
• Large taxpayers’ service (LTS). The LTS roster is not up-to-date and the process of selection/de-selection into the unit is not automatic, but depends on the Commissioner.
47 These figures are obtained by multiplying the second and third rows in Table 3. 48 The consequence has been a declining tax-to-GDP ratio, an inequitably distributed tax burden, and lack of popular trust. Despite continued support from a large number of development partners, the only reforms to have been implemented relatively successfully so far are those relating to improved Information Technology (IT) systems.
PHILIPPINES Discussion Note No.3: Tax Policy and Administration June 2011
DN3-7
• Audit. The audit system is weak and the frequency of audits is low. Contributing to this weakness are (i) the absence of an audit plan, (ii) understaffing of the audit unit of the BIR and, especially, of the LTS, and (iii) weak supervision of audits as the national office receives limited feedback on audit outcomes from the regional offices. As a result, many taxpayers perceive the audit system as non-transparent, biased and abusive.
• Enforcement. Tax enforcement is limited as identified tax evaders are rarely prosecuted. Instead, they are often granted amnesties or able to secure an abatement and case dismissals.
• Collection. Collection is poor because the BIR has little information on the actual amounts of receivables and tax arrears, and no explicit collection strategy.
B. Policy Options for Improving Tax Policy 13. An improved tax effort calls for improvements along both the efficiency and equity dimensions of the tax system. Tax efficiency generally requires a broad tax base and low tax rates to minimize economic distortions, encourage compliance and limit corruption. Tax equity involves two important aspects: (1) vertical equity, which dictates that lower earning taxpayers should face lower effective tax rates, and (2) horizontal equity, which means that taxpayers with similar income or profits should face similar effective tax rates –where the stress on “effectiveness” refers to both the design of the tax system, as well as to compliance in its implementation. Using these fundamental principles as a guide to reforms, and taking into account political economy and administrative considerations, the following set of short- and medium-term actions offer opportunities for raising the tax intake, while improving the efficiency and equity of the tax system. Among these policy options, the first two sets of reforms (in paragraphs 14 and 15) could be implemented in the short term to achieve an immediate impact on revenues, while the next set of reforms (in paragraphs 16 and 17) are best implemented in a more gradual manner over the medium term.
Table 4: Philippines: Policy Actions Policy Area 1: Reforming the System of Excise Taxes
Action 1.1: Index to inflation Action 1.2: Raise excises on petroleum products Action 1.3: Strengthen the anti-smuggling capacity of BOC and BIR Action 1.4: Rationalize and increase excise taxes on tobacco and alcohol
Policy Area 2: Improving the Yield from VAT Action 1.1: Protect the simple broad-based nature of the VAT Action 1.2: Consider broadening the VAT base further Action 1.3: Eventually, consider increasing the tax rate
Policy Area 3: Improving the Effectiveness of Income Tax
Action 1.1: Undertake a structural reform of the Corporate Income Tax Action 1.2: Simplify the Personal Income Tax system, or, Consider introducing a “flat” tax
Policy Area 4: Improving Tax Administration Action 1.1: Appoint BIR Commissioner for a minimum of three years Action 1.2: Adopt a set of agency-level performance indicators
PHILIPPINES Discussion Note No.3: Tax Policy and Administration June 2011
DN3-8
Action 1.3: Require public disclosure of all assets, liabilities, and net worth of BIR personnel Action 1.4: Approve BIR’s rationalization plan Action 1.5: Strengthen technical capacity of the BIR over the medium-term
o Improve the registration process o Strengthen the LTS o Improve the audit function o Strengthen tax enforcement o Improve tax collections
14. The following actions are recommended for reforming the system of Excise Taxes:
• Automatic indexation to inflation: all specific excise rates should be automatically adjusted to inflation, preferably semi-annually but at least annually, so as to maintain their real value.
• Raise excises on petroleum products (both gasoline and diesel but not kerosene) as a priority measure.49 An excise on petroleum is efficient (since petroleum consumption has a low demand elasticity), progressive (in itself—as shown in Figure 3, but also in comparison to most other taxes), and addresses negative externalities associated with petroleum consumption (e.g., traffic congestion, accidents, pollution). Moreover, this tax is easy to administer, and both gasoline and diesel taxation in the Philippines are low by international standards, especially for diesel (Figure 4).
• Introduce a temporary automatic and asymmetric adjustment mechanism if the desired increase in specific excise taxes is deemed too large for one adjustment.
• Strengthen the anti-smuggling capacity, particularly for petroleum products, in the Bureau of Customs (BOC) and the BIR.
• Rationalize and increase excise taxes on tobacco and alcohol: the multi-tiered rate structure needs to be harmonized; the lowest specific rates should be adjusted upwards towards the higher rates (at a minimum to return to the real 1996 value).50
49 A review of market structure to assess the extent of competition in the sector may also be warranted. 50 To reduce the regressiveness associated with increased excises on tobacco and alcohol—contrary to petroleum consumption, alcohol and tobacco consumption is higher, as a share of total spending, the poorer households are—a strengthening of (non price) efforts to reduce consumption of these products by the poor is warranted (e.g., education campaigns and increasing assistance to the poor to enable them to undergo cessation therapy.)
PHILIPPINES Discussion Note No.3: Tax Policy and Administration June 2011
DN3-9
PHL
Figure 4: Gasoline and Diesel Tax Estimates around the World, 2008 1/
Source: OECD, International Energy Agency, “Energy Prices and Taxes”. 1/ Excluding oil exporting countries. Data as of November 2008.
15. The following actions are recommended for improving the yield from the Value Added Tax (VAT), or at least avoid further erosion in tax collection:
y Protect the simple and broad-based nature of the VAT, by resisting periodic calls for new exemptions.
y Consider broadening the VAT base further (beginning with a reversal of the base-eroding measures that were recently introduced, especially in electricity transmission).
y Eventually, the authorities might also consider increasing the tax ratebeyond 12 percent, as this is relatively low by international standards.
16. The following measure is recommended for improving the effectiveness of the Corporate Income Tax (CIT):
y Undertake a structural reform aimed at broadening the tax base, lowering the tax rate, and simplifying the tax code. It is particularly important to combine the rationalization of fiscal incentives with a review of the statutory tax rate to ensure that, at a minimum, the CIT reform is revenue neutral. Such a reform would improve tax efficiency (less waste of public and private resources in complying with the tax), eliminate tax redundancies, sharply improve horizontal equity among firms, remove distortions in capital and labor allocations, and, greatly facilitate better tax administration and governance. Increases in taxes collected from some foreign corporations due to the rationalization of tax incentives need not increase the tax burden on these companies, but simply shift the ultimate beneficiary of the tax
PHILIPPINES Discussion Note No.3: Tax Policy and Administration June 2011
DN3-10
incentives granted by the Republic of the Philippines from the foreign company’s home Treasury to the Filipino Treasury (Fletcher, 2005).51
17. The following actions would improve the performance of the Personal Income Tax (PIT):
y Significant simplification of the PIT system. This involves keeping only a limited amount of deductions and credits, and simplifying the rates (potentially to a single positive rate), while keeping a high personal exemption threshold to ensure adequate progressivity and easier administration.
y Alternatively, consider introducing a simple “flat” tax designed to be, at a minimum, revenue neutral. However, considering the urgent revenue needs, very low effective tax rates and limited progressivity of the tax system as it currently operates, a revenue-increasing reform would be warranted.
C. Policy Options for Improving Tax Administration 18. Sustainable reform of tax administration will require a firm commitment at the highest political level, complemented by sound strategic management at the bureaucratic level. It will also require facing corruption head-on. Given the depth of the governance problems currently affecting BIR and BOC, an effective institutional reform needs to be accompanied by a broader anti-corruption campaign; one that goes beyond BIR to encompass other public sector institutions, including the justice system. Congressional support may also be necessary. A continued focus by civil society, the private sector and the media on good governance in tax administration is also likely to be critical for sustaining the reform process. Furthermore, the commitment to reform needs to be complemented by sustained leadership in implementation. A major problem that has bedeviled previous reform efforts has been the frequent turnover of BIR Commissioners. This needs to be avoided. 19. In addition to being properly focused, prioritized and sequenced, the reform program needs to be complemented by a detailed implementation plan and monitored through a set of agency-level key performance indicators. The BIR is currently working on such a set of agency-level indicators. These indicators should be stable through time and serve as a management tool within the agency. Also, individual performance indicators and BIR programs should be closely aligned with these key performance indicators. To maximize the likelihood of successful implementation, the key performance indicators could be made public and monitored by Congress, the private sector, civil society and the media. 20. As in the case of tax policy reform, there are some immediate actions that the government can take to improve tax administration. Focusing on improved performance and integrity, these actions would send a strong signal of its commitment to reform. They include:
51 This is because some foreign companies that are currently benefiting from tax incentives may be able to claim a foreign tax credit in their home country for any increase in their Philippine tax burden that results from the rationalization of incentives.
PHILIPPINES Discussion Note No.3: Tax Policy and Administration June 2011
DN3-11
• Appointing a BIR Commissioner for a minimum (renewable) period of time(e.g., three years), with performance evaluations based on the agency’s key performance indicators,
• Adopting a set of agency-level key performance indicators, to be agreed between BIR and DOF, and present them to Congress to amend the Attrition Law,
• Requiring public disclosure of all assets, liabilities and net worth of BIR personnel; commencing lifestyle checks of all BIR managers and disciplining corrupt officials, and
• Approving the BIR’s rationalization plan, so that additional personnel can be hired. 21. The preceding institutional reforms provide a necessary foundation for introducing measures to strengthen the technical capacity of the BIR over the medium term. Among these measures, priority should be given to the development of a taxpayer compliance strategy focused on large taxpayers and the improvement of taxpayer services. In the medium term, the following set of measures is considered essential:
• To improve the registration process, o improve access to third-party information, which may require a law mandating all
government agencies and selected private sector organizations to provide timely and accurate information to BIR free of charge, and
o finalize the computerization of LGUs, which would greatly facilitate BIR’s registration and third party information cross checking.
• To strengthen the large taxpayers service (LTS),
o introduce a system of automatic listing, de-listing, and notification of firmsmeeting LTS eligibility criteria based on a threshold according to which around 1,000 firms would qualify,
o increase the number of staff at the LTS to comparable international levels, particularly in the audit function,
o ensure proper functioning of the e-filing system and remove the requirement for dual accounting (manual and electronic), and
o diagnose the poorly-functioning VAT refund system and prepare an action plan to improve its efficiency;
• To improve the audit function,
o introduce a risk management approach linked to a national risk-based audit plan, o increase the staff and strengthen the capacity of the internal audit unit and improve
overall audit supervision, ando enforce existing rules (e.g., EO 38 series of 1998) that allow the Commission on
Audit to audit BIR’s assessment function and adherence to its own audit regulations.
• To strengthen tax enforcement, o implement a comprehensive compliance strategy, including strengthened capacity
in the audit, investigations and VAT compliance functions and better preparation of cases sent to the DOJ, and
PHILIPPINES Discussion Note No.3: Tax Policy and Administration June 2011
DN3-12
o set clear targetsfor number of cases filed, processing time and other relevant indicators of effectiveness (such as conviction rates).
• To improve tax collections,
o develop a strategy to improve taxpayer servicesso as to enhance voluntary compliance,
o develop an improved arrears management system, including an agreed definition of arrears and reporting all presently unreported arrears, and
o introduce a risk-based collection strategy, accompanied by a collections manual to guide implementation.
D. Is the Philippines Ready for Reform? 22. Policymakers often believe measures such as an increase in petroleum taxation are widely unpopular. However, recent regional experiences suggest that this is not the case. For example, Indonesia sharply increased the retail price of gasoline and diesel by reducing tax subsidies on two occasions (twice in 2005 and then in June 2008, raising the price by 100 percent in 2005). The Indonesian government announced that a substantial share of the savings from this measure would be allocated to a cash transfer program targeted at the poor. Contrary to initial expectations, the popularity of President Yudhoyono’s government did not suffer, and he was re-elected in 2009. The Philippines could take a similar approach by using part of the revenue generated from higher petroleum excises to improve pro-poor spending (e.g., through a scale up of the conditional cash transfer program), while reducing the fiscal deficit. Similar considerations would also apply to the other proposed structural tax reforms. Since these reforms aim to raise both tax efficiency and equity, they should be politically popular if properly designed and packaged. Some of these reforms may require a further incidence analysis to identify the taxpayers most affected by the reforms and possible compensatory measures. 23. Tax administration reform is an equally complex process, both politically and technically. Nevertheless, the Philippines is well-placed to deliver on such a challenge. Unlike in some other countries, BIR staff is technically competent and the agency has reform champions and units within which reforms are ongoing. Also, it can count on democratic institutions, a dynamic civil society and a vocal media to support such reforms. A resolute approach to systemic reform could build on these strengths and achievements. Here too the international experience shows that reform is possible with sufficient political will, as attested to by recent examples of successful tax administration reform, including in Bolivia and Indonesia (Box 1). 24. The payoff of such reforms can be enormous, in terms of improved governance, fiscal sustainability, public and private investment, economic growth, and popular support for the implementing government. As noted earlier, the Philippines exhibits a huge gap vis-à-vis its faster-growing East Asian neighbors in public infrastructure and social sector spending, and the improvements in tax policy and administration envisaged here are critical for closing that gap.
PHILIPPINES Discussion Note No.3: Tax Policy and Administration June 2011
DN3-13
References Botman, D., A. Klemm, and R. Baqir, 2008, Investment Incentives and Effective Tax Rates in
the Philippines: A Comparison with Neighboring Countries. IMF WP/08/207. Brondolo, J., C. Silvani, E. Le Borgne, and F. Bosch, Tax Administration and Fiscal
Adjustment: The Case of Indonesia (2001-07). IMF WP/08/129 Fletcher, K., 2005, Increasing Public Sector Revenue in the Philippines: Equity and
Efficiency Considerations. IMF WP/05/22 Kidd, M. and W. Crandall, “Revenue Authorities: Issues and Problems in Evaluating their
Success,” WP 06/240. IMF. Moore, M., “How Does Taxation Affect the Quality of Governance?” IDS Working Paper
280, 2007. World Bank, 2008, “Policy Note on Tobacco Excise Taxes”, Manila USAID, Fiscal Reform and Economic Governance database 2008-09,
www.collectingtaxes.net
Note prepared by:Eric Le Borgne, Rosa Alonso I Terme, Karl Chua and Ulrich Lächler (EASPR) The World Bank February 10, 2010
PHILIPPINES Discussion Note No.3: Tax Policy and Administration June 2011
DN3-14
Box 1: International Experiences in Tax Administration Reform The two cases of tax administration reform summarized below have some critical elements in common: strong, high-level government leadership, thorough institutional reform of tax administration agencies and a supporting comprehensive anti-corruption strategy. They both yielded significant revenue gains and an improved governance and investment climate. The Case of Bolivia In 1997, the Government of Hugo Banzer launched a comprehensive governance reform program – the National Integrity Plan – that was presented by the President himself and that focused on three key areas: judicial reform, public administration reform, and anti-corruption reform. The National Tax Service (NTS) was chosen as one of the pilot agencies for the reform. A new law was passed in 2000 and an institutional reform agreement was finalized in 2002. The major objectives of that reform were to improve the efficiency of tax administration, raise the quality of taxpayer services, modernize and streamline regulations and render them more consistent, improve the transparency of tax administration functions and improve overall tax compliance. To achieve these objectives, a thorough institutional reform of the NTS was carried out that focused on:
• Human resources management (with pay increases, meritocracy and greater accountability) • Improving the legal and regulatory framework, and re-engineered business processes
(underpinned by a new tax code) • Improving inspections, control processes and fiscal intelligence (computerized systems for
inspections and audits and improved third-party information systems), and • Putting in place a new IT system to support the institutional reform and re-engineered
business processes once they were well under way. The reforms resulted in an estimated revenue increase of 2 percentage points of GDP. The Case of Indonesia A program of tax policy and tax administration reform was initiated in the aftermath of the Asian financial crisis and was aimed at enhancing fiscal sustainability and improving the business climate. It was also implemented as part of an overall governance reform strategy. The plan included a short-term strategy focused on achieving some quick wins mainly through improved tax enforcement to provide impetus to and confidence in the medium-term strategy. The medium-term strategy was structured along the following 10 initiatives:
• Expanding the number of taxpayers covered by the Large Taxpayers Office • Establishing model tax offices for medium and small taxpayers and replicating their reforms • Developing and implementing a revenue generation initiative • Simplifying each major tax, beginning with the VAT • Revising the legal framework for tax administration • Enhancing the capacity of the audit function • Developing a balanced set of performance measures for the core tax administration processes • Introducing new human resource management policies • Designing and implementing a comprehensive information technology master plan • Creating an internal investigation unit to investigate misconduct by tax officers
The reforms resulted in a revenue increase of 1.1 percentage points of GDP. Sources: Zuleta, Leyton and Fanta, “Combating Corruption in Revenue Administration. The Case of VAT Refunds In Bolivia” in Pradhan and Campos, The Many Faces of Corruption. World Bank, 2008; and Brondolo, Silvani, Le Borgne and Bosch, Tax Administration Reform and Fiscal Adjustment: The Case of Indonesia (2001-07). IMF WP/08/129.
DN4-1
������������������������������
����������������Stepping up public spending for faster growth and poverty reduction
O P E AT
W P
P T
GDP SGDP
1. The Philippines exhibits important gaps in development outcomes vis-à-vis other countries in East Asia. Its economic performance improved markedly during 2000-08 relative to previous decades and in comparison to average world growth, but even so economic growth remained modest in comparison to the rates achieved elsewhere in the region (Table 1). Furthermore, while the rest of East Asia recorded strong progress in poverty reduction over the last decade, poverty indicators improved much more modestly in the Philippines. Meanwhile, income and consumption inequality continue to be among the highest in the region, and appear to be increasing.52
2. Regional comparisons on the evolution of social indicators show similar gaps, with the Philippines generally exhibiting positive, but more modest, advances than those recorded in neighboring countries. For example, the incidence of tuberculosis and the under-5 child mortality rate are both much higher in the Philippines than in the other large countries in the region with similar per capita income levels (Table 2). The key education indicators exhibit less variation than in health, but even here the Philippines tends to fall short compared to the sample mean.
52 See World Bank (2010), Philippines Discussion Note No. 2 on “Achieving Sustained Poverty Reduction.”
Table 1: Per Capita Real GDP Growth in East Asia &
Pacific (average percent per annum)
1980-89 1990-99 2000-08 Philippines -0.6 0.5 2.9 Indonesia 4.2 3.2 3.8 Malaysia 3.0 4.5 3.4 Thailand 5.5 4.3 3.8 Vietnam 2.2 5.4 6.2 China 8.3 8.9 9.2 East Asia & Pacific 6.0 7.0 7.9 World 1.4 1.2 1.9 Source: World Bank, World Development Indicators.
.
PHILIPPINES Discussion Note No.4: Public Spending June 2011
DN4-2
PHILIPPINES Discussion Note No.4: Public Spending June 2011
DN4-3
Table 2: Selected Health and Education Indicators in East Asia; 2007 Incidence
Mean 161 16 67 95 101 93 Source: World Bank, World Development Indicators and MDG database.
3. These performance gaps may be due, at least in part, to shortcomings in public spending. That is, the Philippines is either not spending enough or not spending efficiently enough in priority areas that are closely associated with growth and poverty reduction. Two generally recognized determinants of growth and poverty reduction during the developmental stage are the rates of physical and human capital accumulation. These rates typically depend on the amount of total spending on public infrastructure and on health and education services, as well as on the quality of such spending. Public spending has an important role to play in these three areas, which generally comprise the lion’s share of the total public sector primary budget. The Level of Public Spending in Priority Sectors 4. While large investment programs do not guarantee faster growth, inadequate investment is frequently identified as a bottleneck that prevents sustained economic growth. This appears to be a problem in the Philippines, which stands out vis-à-vis the other countries in East Asia, both in terms of exhibiting slower economic growth as well as a much lower level of total investment. While the comparator East Asian economies exhibited an average annual rate of capital formation of 26.2 percent of GDP during 2002-2008, the Philippines has only been investing around 16 percent of GDP (Table 3). Moreover, the total level of investment in the Philippines appears to have been declining since the end of the 1990s, raising questions about the sustainability of growth. 5. The large gap between total investment levels in the Philippines and the amounts invested in the rest of the region is attributable to differences in both public and private investment spending. Table 4 shows that the average GDP-share of general government
Table 3: Gross Fixed Capital Formation (as % of GDP per annum)
1996-2000 2002-08 Philippines 21.6 15.6
Indonesia 24.6 23.1 Malaysia 31.8 21.7 Thailand 28.0 26.7 Vietnam 26.8 33.3
Sample Mean 27.8 26.2 Memo: China 33.8 40.3 Source: World Bank, World Development Indicators
PHILIPPINES Discussion Note No.4: Public Spending June 2011
DN4-4
investment spending in the Philippines during 2002-08 (2.7 percent) was less than half the share in the other comparator East Asian economies (6.6 percent). A large gap has also developed on the side of private investment, which amounted to an average of only 12.5 percent of GDP in the Philippines during 2002-08, compared to 20 percent in the comparator East Asian economies. 6. The declining trend in total investment spending exhibited by the Philippines is mostly due to declines in private investment,53 though public investment also shows a decline (Table 3). Private investment also appears to have declined in the other comparator countries in East Asia, but to a lesser extent. This trend may be reflecting a less attractive investment climate in the aftermath of the East Asian financial crisis of 1997-98. In contrast to the Philippines, however, most of the other comparator countries have resisted declines in public investment spending. 7. The Philippines exhibits similar public spending gaps vis-à-vis its East Asian neighbors in key social sectors. It devoted an average of 2.5 percent of GDP on public spending in education during 2002-07, and another 1.3 percent on public health in 2006, for a total of 3.8 percent of GDP (Table 5). In contrast, the countries in East Asia on average have been spending around 6.1 percent of GDP on both sectors. That is, they spend between 2 and 3 percent of GDP more on health and education than the Philippines. 8. Another worrisome aspect of social spending in the Philippines is that it has been declining since the 1990s. In particular, between
53 Table 4 shows that private investment in the Philippines declined by roughly 5 percent of GDP between 1996-2000 and 2002-2008. This decline is even larger considering that the average investment over 1996-2000 was strongly influenced by the East Asian financial crisis of 1997-98, which led to a large drop of private investment. Before then, private investment had been on the order of 20 percent of GDP. Taking this as the point of reference, private investment has dropped by almost 8 percent of GDP.
Table 4: Central Government Capital Expenditures and Net
Lending (average annual percent of GDP)
1996-2000 2002-08 Philippines 3.6 2.7 Malaysia 6.0 7.3 Thailand 5.4 3.5 Vietnam 6.9 9.2 Sample Mean 6.1 6.6
Memo item: Private Investment PHL 17.4 12.5 Source: World Bank, LDB and World Development Indicators
Table 5: Government Spending on Education and Health
(Percent of GDP)
Education Health 1990-95 1/ 2002-07 1/ 2000 2006
Philippines 3.0 2.5 1.6 1.3
Indonesia na 3.5 1.7 1.9 Malaysia 2/ 4.4 4.6 1.9 2.3 Thailand 3.2 4.3 1.6 2.1 Vietnam 2.9 na 1.7 1.9 Sample Mean 3.5 4.1 1.7 2.0
Source: World Bank, World Development Indicators and UNESCO and WHO databases. Note: 1/ Latest year in the period.
PHILIPPINES Discussion Note No.4: Public Spending June 2011
DN4-5
1997 and 2008, total government spending (central plus local government, on an obligation basis) as a share of GDP declined by 50 percent in the health sector and by 36 percent in the education sector. This pattern is contrary to that observed elsewhere in the region and does not bode well for closing the gap in human capital accumulation that separates the Philippines from the other countries. 9. The relatively low level of public spending on public infrastructure, education and health in the Philippines does not just reflect an allocational choice that discriminates against these priority sectors. It mainly reflects the relatively small size of primary public spending compared to that found in the other countries in East Asia (Table 6).54 The share of the non-interest central government budget devoted to the priority sectors is only moderately lower in the Philippines, even though the absolute share of GDP devoted to those sectors is significantly lower.55
The Relative Efficiency of Public Spending in the Philippines 10. It is not readily apparent that the efficiency of public spending is significantly different in the Philippines from the rest of the region. This contrasts with the findings from the preceding section, which indicated that the Philippines devotes a significantly smaller share of GDP on public spending on infrastructure, education and health than other countries in the region. A traditional way of assessing the efficiency of total investment spending is by way of calculating Incremental Capital-Output Ratios (ICORs).56 Table 7 indicates that the ICORs observed in the Philippines over the last decade are not substantially different from the averages observed in the rest of the region or across lower middle-income
54 The differences in primary (or non-interest) central government spending are largely attributable to differences in interest payments on the public debt. While total interest payments averaged 1.9 percent of GDP in the four comparator East Asian countries during 2002-08, they averaged 5.1 percent in the Philippines. 55 Total government spending on public infrastructure, health and education over 2002-2007 averaged 6.5 percent of GDP in the Philippines versus 12.4 percent in the four comparator counties in East Asia. These spending amounts translate into 49 percent of total non-interest government spending in the Philippines versus 57 percent in the comparator countries. 56 The ICOR is calculated as the change in total capital stock (or net investment ratio) in year t, divided by the change in total GDP (or rate of real GDP growth) in year t+1. The idea behind this measure of efficiency is that a larger capital stock expands the production possibilities frontier, permitting faster growth. However, the change in the capital stock brought about through a given amount of investment spending may differ depending on the quality of the investment. Larger ICOR values, therefore, imply less efficient investment spending.
Table 6: Total Central Government Primary
Spending (average annual percent of GDP)
1996-2000 2002-
08 Philippines 15.6 13.3
Indonesia -- 16.1 Malaysia 19.8 23.4 Thailand -- 15.6 Vietnam 22.0 26.3 Source: World Bank, LDB and Unified Survey
Table 7: Incremental Capital-Output
Ratios Average (2000-2008)
Philippines 4.04 Indonesia 4.18 Malaysia 6.11 Thailand 5.94 Vietnam 4.33
Averages East Asia & Pacific 3.86 Low & middle income 4.42 Source: World Bank, World Development Indicators
PHILIPPINES Discussion Note No.4: Public Spending June 2011
DN4-6
countries worldwide. This measure does not permit us to isolate the efficiency of public versus private investment, but it does suggest that there are no major differences in the relation between capital spending and growth in the Philippines and in the rest of the region. That is, there is no apparent efficiency gap in investment spending. 11. The Philippines also does not seem to exhibit notable gaps vis-à-vis its regional neighbors in the efficiency of public spending on health and education. Annex 2 compares the average efficiency scores for public spending on education and health in countries in East Asia based on data from 1996-2002.57 With respect to the education performance indicators, the Philippines exhibits an average efficiency rating of 0.59 using the input-oriented measures and of 0.71 using the output-oriented measures. These ratings are comparable to the overall EAP ratings of 0.60 and 0.66. A similar picture emerges on the health side, where the Philippines exhibits average ratings of 0.75 and 0.88 compared to the EAP averages of 0.73 and 0.91. Although there are a number of important caveats to keep in mind when dealing with these figures,58 the main outcome of these comparisons is that on average they do not yield significant differences between the efficiency of public social spending in the Philippines and in the other countries in the region.59
Some Implications for Public Finance Policies 12. Insofar as the shortfall in the Philippines’ development outcomes vis-à-vis the outcomes observed in the rest of the East Asia region are due to gaps in the size and
57 This assessment of the efficiency of social expenditures in the Philippines is obtained from earlier research at the World Bank on the measurement of efficiency in public spending across countries. (Herrera, Santiago and Gaobo Pang (2005), “Efficiency of Public Spending in Developing Countries: An Efficiency Frontier Approach”, World Bank Working Paper, May.) This work involves the construction of empirically-derived world production possibilities frontiers, relating the amounts of public spending in particular sectors to various outcome indicators in each sector. In this context, efficiency is measured as the distance between a country’s actual combination of public spending and sector outcomes in each sector and an efficiency frontier. This distance to the frontier can be measured, alternatively, in terms of the amount of public spending made in generating a particular output, or in terms of the output generated for a particular level of public spending. In both cases, the index measuring efficiency is constructed in a way that countries on the frontier exhibit an index of 1.0 and less efficient countries exhibit an index that is between 0 and 1. 58 The efficiency scores presented here may be exhibiting a number of biases. In particular, though efforts have been made to ensure consistency in the definition of public spending, some countries depend more on local government spending than others for the provision of certain public services, and these local expenditures are not always fully captured in the data. As a result, a country with relatively high levels of local government spending may come across as more efficient than another country with similar outcome indicators, but relatively higher levels of central government spending. Furthermore, there are numerous omitted variables other than public spending which influence outcome indicators and, therefore, bias the efficiency calculations. For example, countries that rely more on private education and health systems are likely to exhibit higher efficiency scores than countries that rely mostly on public provision of social services, since the efficiency calculations do not take into account the private resources used. Also, a sparsely populated country covering a large area is likely to have much higher unit costs for educating a child or treating a patient than more densely populated, largely urbanized countries, independent of the quality of government spending. Finally, it is also important to keep in mind that this note only addresses a limited set of “education or health outcomes" that may not be the most relevant ones and it does not address the distribution of outcomes. 59 Another indicator that is sometimes used in cross-country comparisons to measure public sector efficiency refers to the size of public employment. Inefficient governments are often characterized by having a large public workforce as an employment generating measure. However, the Philippines does not stand out in terms of either the size of the public sector workforce (� 8% of total labor force) or the size of the national government wage bill (5% of GDP), both of which are similar to the ratios observed in the other comparator countries.
PHILIPPINES Discussion Note No.4: Public Spending June 2011
DN4-7
efficiency of public spending, policymakers could expect to remove the shortfall by closing these public spending gaps. The broad-brush comparisons carried out above could not identify significant efficiency gaps separating public spending in the Philippines from spending in the other countries. However, they did identify some very large gaps in the size of public spending. In particular, Table 4 points toward a public investment gap on the order of 3 to 4 percent of GDP, while Table 5 points to a gap in public spending on education and health of between 2 and 3 percent of GDP.60 This yields a total public spending gap in these three priority sectors of between 5 and 7 percent of GDP. Closing this public spending gap will not be enough, however, to place the Philippines on a comparable footing with the other countries in East Asia, as Tables 3 and 4 also show a gap in private investment spending of 7 to 8 percent of GDP between the Philippines and the other comparator countries in East Asia. Closing the total investment gap, therefore, will also depend on significant increases in private investment that will in turn require substantial improvements in the investment climate. 13. If policymakers hope to raise the development outcomes of the Philippines toward the levels attained elsewhere in East Asia, they will need to consider stepping up public spending by 5 to 7 percent of GDP, while introducing measures to improve the investment climate for the private sector.61 This is a very tall order for at least two reasons: first, because it would require an increase in public revenues by the same order of magnitude. The public sector debt in the Philippines is already quite high (over 60 percent of GDP at end-2009), which leaves little room for deficit financing, and especially not for deficits of these orders of magnitude. However, the government has been struggling hard just to prevent the total tax intake from falling below 14 percent of GDP, so raising the tax intake by the amounts being contemplated will not be an easy task.62 The good news is that there are several important opportunities for improving tax policies and strengthening tax administration to raise tax revenues significantly, while rendering the tax system more efficient and equitable (see Philippines Discussion Note No. 3 (Tax Policy and Administration). The other important constraint that needs to be overcome in order to raise total public spending by the indicated amount are the current shortcomings in public expenditure and financial management. This is particularly important in view of the public sector’s chronic under-execution of the budget and lack of budget transparency. Here too, there are several measures that the government can take to improve its public financial management in order to accommodate a significant increase in public spending; see Philippines Discussion Note No 23 (Public Financial Management).
60 The gap in public investment identified here is similar in magnitude to the shortfall in public infrastructure investment identified in the World Bank’s (2005) infrastructure report on the Philippines. That report had called for a gradual increase in infrastructure investments from 2.8 percent of GDP (in 2008) to at least 5 percent of GDP. Similarly, the gap of 1.6 percent of GDP in public education spending shown in Table 5 is close to the 2% of GDP shortfall in education spending identified in the forthcoming World Bank (2010) public expenditure review on basic education. The World Bank is currently also working on a health sector assessment that seeks to provide a detailed actuarial analysis of the benefits package that should be provided by the Government to achieve better outcomes as well as the costs of mitigating supply side constraints to achieve these goals. Unfortunately, the findings from that analysis are not yet available for comparative purposes. 61 The proposed increase in public investment already would constitute an important step toward improving the investment climate, considering that the last Investment Climate Assessment (carried out in 2005) identified the deficit in public infrastructure as one of the top 3 investment climate constraints. 62 In fact, the tax effort fell to 12.8 percent of GDP in 2009, or well below the targeted 14 percent, making the task of raising enough fiscal revenues to support the higher spending target even more difficult.
PHILIPPINES Discussion Note No.4: Public Spending June 2011
DN4-8
14. To the extent that the government can generate additional fiscal savings through, say, a reduction in non-priority public expenditures, it would reduce the adjustment burden placed on the tax system. Identifying such potential savings is best done through comprehensive program analyses and the application of monitoring and evaluation mechanisms that still remain to be developed for most government programs in the Philippines. However, there are a few large expenditure items that merit attention as potential candidates for generating fiscal savings. One of these is the rice subsidy provided by the government through the National Food Authority (NFA). Another source of potential fiscal savings is the budget transfers to the other Government Owned and Controlled Corporations (GOCCs), other than the NFA.63
15. The rice subsidies provided by the Philippine government through the NFA are fiscally expensive and very inefficient in reaching their intended beneficiaries (Annex 1). The total fiscal cost of these subsidies is projected to lie between 0.6 and 1.0 percent of GDP per annum in 2008-10, but only around 50 percent of these subsidies reach the poor. This means that the cost of the fiscal transfer reaching the poor is between 0.3 and 0.5 percent of GDP. Replacing the NFA by a well targeted, conditional cash transfer program that reaches the same sub-group of poor beneficiaries should therefore be able to generate fiscal savings of around 0.4 percent of GDP.
16. The GOCCs represent another burden on the government budget. The actual budget transfers to the country’s 767 GOCCs turn out to be consistently higher than the amounts budgeted, and they have significantly increased over the past 10 years, to reach almost 1.3 percent of GDP in 2008 (Figure 1). The welfare rationale for these budget transfers is not clear, so the government might consider phasing out these transfers to the GOCCs, which could potentially yield fiscal savings of another 0.3 to 0.7 percent of GDP, in addition to any one-time privatization revenues.64
17. Replacing NFA rice subsidies by a well-targeted social protection system and the elimination of budget transfers and other non-budget support to the GOCCs could yield potential savings of around 1 percent of GDP. That would reduce the additional fiscal revenue effort required to close the public spending gap in priority areas to about 4 to 6 percent of GDP.
63 The fiscal savings obtainable by eliminating these subsidies and transfers would not accrue to the central government, but to the non-financial public sector as a whole. 64 This estimate is calculated by netting out the cost of rice subsidization through NFA (estimated to be between 0.6 percent and 1 percent of GDP) from the total budget transfers to GOCCs in 2008. In addition, however, it is important to stress that budgetary transfers to the GOCCs only represent a small part of the public support they receive, which includes periodic recapitalizations and the financing of current deficits by issuing debts that are assumed by the national government. The GOCCs also generally operate in a much more favorable environment than private sector companies (e.g., most have tax exemptions and easy access to credit), which has a fiscal cost that usually does not appear in the government budget. See World Bank (2010), “Philippines Development Report 2009.”
PHILIPPINES Discussion Note No.4: Public Spending June 2011
DN4-9
Figure 1: Philippines: Government Budget Support to GOCCs
Source: Government of the Philippines, Department of Budget and Management 18. There is also room for reducing the required fiscal revenue effort even further through improvements in the efficiency of public spending, although the potential fiscal savings from this source are more difficult to quantify. While the earlier analysis concluded that the Philippines is not very different from other countries in the region in regard to the efficiency of public expenditures, there are opportunities for raising its spending efficiency beyond the regional comparators. That would help to close the development outcome gap vis-à-vis the other countries in East Asia by raising the development impact of public expenditures without having to raise their total amount. A good starting point for considering such efficiency-raising measures is by reviewing and correcting the shortcomings in public financial management identified in the recently concluded Public Expenditure and Financial Accountability (PEFA) assessment. One key area that warrants a close review in this context is the role of Special Purpose Funds, which have grown from under 20 percent of total budget in the late 1990s to 32 percent in 2009. These funds allow for significant discretion in public resource allocation and are not easily monitored, which seriously impairs the transparency of the fiscal budget. Policy Options for Consideration 19. The preceding benchmarking exercise found that the Philippines exhibits a significant gap in development outcomes vis-à-vis other countries in East Asia. It also identified a total public expenditure gap of 5 to 7 percent of GDP in priority areas (public infrastructure, education and health spending), which the Philippines may have to close if it hopes to have a chance of raising its development performance to regional standards. Closing this expenditure gap would require increasing the public revenue effort by the same order of magnitude, except for possible fiscal savings that might be achieved through the elimination of non-priority expenditures or improvements in the efficiency of public spending. Two potential sources of fiscal savings are the rice subsidies granted through the NFA and the budget transfers made to other GOCCs. Replacing the rice subsidy with better targeted transfers and eliminating the transfers to GOCCs could reduce the total revenue gap to between 4 and 6 percent of GDP. These fiscal expenditure and revenue measures are summarized in Table 8.
PHILIPPINES Discussion Note No.4: Public Spending June 2011
DN4-10
Table 8: Philippines: Summary Outcome of Fiscal Benchmarking Exercise Policy Area 1: Increasing Expenditures and Encouraging Investment in Priority Sectors
Action 1.1 Raise public infrastructure expenditures by 3 to 4 percent of GDP Action 1.2 Raise public spending on education and health by 2 to 3 percent of GDP65 Action 1.3 Introduce further measures to improve the investment climate for the private sector66
Policy Area 2: Generating Enough Fiscal Savings to Finance the Public Expenditure Increase
Action 1.1 Phase out NFA rice subsidy and transfer part of the fiscal savings to the CCT program (to generate estimated fiscal savings of around 0.4 percent of GDP) Action 1.2 Review budget transfers to the other GOCCs and consider phasing them out (which would generate estimated fiscal savings of between 0.3 and 0.7 percent of GDP) Action 1.3 Strengthen the public sector’s expenditure planning and financial management67 Action 1.4 Increase the tax revenue effort by at least 4 percent of GDP68
20. In closing, it is useful to keep in mind that every development experience has its unique aspects, so there would be no reason to expect the pattern of development in the Philippines to be the same as that of any other country in the region. For example, the development spurt experienced by Thailand and Malaysia during the 1980s and 1990s depended largely on the expansion of their export manufacturing sectors. The Philippines, in contrast, may exhibit more promising development prospects in the service sectors, building on its English-speaking population, rapid growth of Business Process Outsourcing activities and untapped tourism potential. If this turns out to be the preferred growth model for the Philippines, the most appropriate combination of public infrastructure and social spending is likely to vary from that observed in the other countries. It could, for example, warrant relatively more investment in education and telecommunications capacity, instead of public infrastructure investment in roads or energy generation. What stands out in the preceding benchmarking analysis, however, is that public spending in the Philippines has fallen short in all the priority areas. This suggests that there is an overall public spending gap to be mended, even as the precise composition of that spending gap remains a matter for further discussion.
65 For specific details on this measure, see World Bank (2010), Philippines Discussion Notes No. 11 (Health) and No. 12 (Basic Education). 66 For details, see World Bank (2010), Philippines Discussion Note No. 6 (Competitiveness). 67 For details, see World Bank (2010), Philippines Discussion Note No. 23 (Public Financial Management). 68 This amount is calculated as a residual. Specific policy options for raising tax revenues are discussed in World Bank (2010), Philippines Discussion Note No 3 (Tax Policy and Administration).
PHILIPPINES Discussion Note No.4: Public Spending June 2011
DN4-11
References
Herrera, Santiago and Gaobo Pang (2005), “Efficiency of Public Spending in Developing Countries: An Efficiency Frontier Approach”, World Bank Working Paper, May.
World Bank (2005). “Philippines: Meeting Infrastructure Challenges” (Washington, DC) _________ (2009). “Philippines: Transport for Growth,” (Report No. 47281-PH), February
24. __________ (2009). “Public Expenditure and Financial Accountability Assessment”, draft. __________ (2009). “Philippines Quarterly Update”, November __________ (2010). “Philippines Development Report 2009,” June. __________ (2010). Philippines Public Expenditure Review, “Strengthening Public Finances
for More Inclusive Growth,” forthcoming. __________ (2010). “Philippines: Basic Education Public Expenditure Review,”
forthcoming.
Note prepared by: Ulrich Lächler and Rosa Alonso I Terme, with inputs from Eric Le Borgne, Yasuhiko Matsuda and Sheryll Namingit EASPR The World Bank
PHILIPPINES Discussion Note No.4: Public Spending June 2011
DN4-12
Annex 1 The Philippine Rice Subsidy—An Expensive Transfer to the Non-Poor
For the past few decades, the rice subsidy administered by the National Food Authority (NFA) has been a key pillar of the government’s social protection system. When the 2008 food and fuel crisis pushed an estimated 3 million Filipinos into poverty, the National Food Authority’s (NFA) rice subsidy program turned out to be the only available social protection system with enough scale to reach a large number of poor. As a subsidy program for the poor, however, the NFA rice subsidy suffers from major deficiencies: • Limited impact. The poor only get 16 percent of their rice consumption from the NFA. Based on a
subsidy per kilo of rice of 25.4 peso in 2008 (the difference between the shadow market price and the NFA subsidized selling price), this is equivalent to a cash transfer of P1,599 per year per household or to 36.6 kilos of rice bought at the (shadow) market price of P43.7/kg).
• High leakage rates. About half of NFA rice is consumed by the 66 percent of the population that is not poor.
• High cost due to limited operational efficiency of the NFA. In 2008, the NFA delivered between P8.4 and P25.1 billion worth of consumer subsidy to the poor and a total rice subsidy of between P17.6 and P52.8 billion. However, the total public sector cost, on an accrual basis, of the NFA for 2008 reached P72 billion (1 percent of GDP). Hence, assuming that NFA did distribute all the rice it reportedly distributed—which is three times higher than what recipients reported receiving—the fiscal cost of the NFA would still exceed the cost of subsidizing rice by P21.8 billion. These P21.8 billion (US$470 million) in annual cost can be taken as the administrative cost of the NFA to operate the subsidy program. This means that for every peso given to the poor through the rice subsidy program, Philippine taxpayers spend between 3 to 8.6 pesos. In contrast, the public cost of transferring 1 peso through the Government’s conditional cash transfer program (called Pantawid Pamilyang Pilipino Program, or 4Ps) was estimated at 0.5 pesos in 2008. Moreover, this cost is expected to decrease sharply over time, considering that the 2008 administrative cost includes a large one-off program start up cost and that the administrative running costs include a fixed cost element that will be spread out over more beneficiaries as the CCT is scaled up to cover more households.
In the aftermath of the food crisis the government decided to target the NFA rice subsidies to the poor in a more efficient manner. In early 2009, NFA started limiting the sale of subsidized non-commercial rice grain to holders of Family Access Cards (FACs) issued by the Department of Social Welfare and Development (DSWD) in Metro Manila, and/or to those listed in Rice Allocation Ledgers (RALs) in the field offices of the NFA. The impact of this revised targeting measure is not yet evident, however, as NFA reported an increase in rice sales of 54 percent in the first five months of 2009 against the same period of 2008. While the international purchase price of rice by the NFA has decreased noticeably, it remains much higher than in 2006 (prior to the food price shock). As a result, the 2009 budget points to a limited decrease in the fiscal cost of NFA in both 2009 (P63.1 billion) and 2010 (P51 billion), compared to 2008 (P74.6 billion). The actual and projected subsidy costs in 2008-10 represent between 0.6 and 1.0 percent of GDP. Considering that only about half of these subsidies reach the poor, phasing out the NFA rice subsidy and replacing it by the better targeted conditional cash transfer program could generate overall fiscal savings of between 0.3 and 0.5 percent of GDP, without sacrificing the benefits received by the poor.
Source: World Bank (2009), Philippines Quarterly Update, November.
PHILIPPINES Discussion Note No.4: Public Spending June 2011
DN4-13
Annex 2
P I M T A EAP WEDUCATION INDICATORSINPUT O M
P E GP E NS E GS E NA Y SF L CS L CY L R
A
OUTPUT O MP E GP E NS E GS E NA Y SF L CS L CY L R
AHEALTH INDICATORSINPUT O M
L E BI DPTI MD A L E
A
OUTPUT O ML E BI DPTI MD A L E
AS W BN T D E A
E S P S EDUCATION HEALTH E A PS E A C R A
DN5-1
�����������������������������������������Building institutions for better fiscal risk management
A
MI C
S H
UF
PF
TT
A. Why Does Fiscal Risk Pose a Danger?
1. Fiscal risks—i.e., the threat of significant variations of fiscal outcomes from budgetary plans or forecasts—are widespread and constitute an intrinsic part of fiscal policymaking and budget planning. Cross-country experience reveals that fiscal risks are mostly related to macroeconomic shocks and the realization of contingent liabilities. The former include mostly shocks to GDP growth, exchange rates, interest rates, and oil prices. These can directly affect revenues, expenditures or the financing of the budget and public debt, as well as the operations and balance sheets of other parts of the public sector such as government-owned or controlled corporations and local government units. The latter includes both explicit and implicit contingent liabilities such as debt guarantees being called and bailouts of the banking sector.
2. Notwithstanding their importance and prevalence, fiscal risks are often not comprehensively assessed, disclosed and actively managed. These shortcomings often result in larger fiscal costs and, sometimes, fiscal crises (IMF, 2008). When fiscal risks materialize, be it in the form of unexpected spending pressures or revenue losses, these often require ad-hoc and disruptive adjustments during the fiscal year. The global financial crisis and the widespread and costly bank bailouts is a recent reminder of the magnitude of fiscal risks outstanding and the disruptive impact it can have on public finances (e.g., Iceland). As a result, even in countries where debts and deficits are considered prudent, policymakers’ attention is turning toward risks—especially from contingent liabilities and off-balance sheet items. To address the challenges posed by fiscal risks, several countries have recently increased their disclosure of such risks, so as to foster fiscal sustainability and to reduce borrowing costs and the likelihood of crises.
PHILIPPINES Discussion Note No.5: Fiscal Risk June 2011
DN5-2
B. Main Sources of Fiscal Risk in the Philippines
3. A comprehensive assessment of fiscal risks in the Philippines was undertaken for the 2009 Philippines Development Report (World Bank, 200969). The assessment includes an overview of fiscal policy objectives and their relation to fiscal risks, and an analysis of the three main types of risks to public finances: (i) internal budget risks related to macro-economic risks and budget sensitivities; (ii) the public debt, in particular its structure and management; and (iii) contingent liabilities. The latter include risks stemming from Government-Owned and Controlled Corporations (GOCCs), Public-Private Partnerships (PPPs), the financial sector, Local Government Units (LGUs), tax credit certificates, and natural disasters. The key findings are:
4. Large fiscal risks have materialized in the Philippines. These include two large banking bailout episodes (early 1980s and 1997/98—with an estimated fiscal cost exceeding 10 percent of GDP), the recapitalization of the former central bank in 1993 (cost of 22 percent of GDP), of the Development Bank of the Philippines in 1986 (cost of 10 percent of GDP), the repeated recapitalization of the Philippine National Bank before its complete privatization in 2007, and the government assumption of part of the National Power Corporation debt in 2002 (5 percent of GDP). The sheer size of these risks had previously reduced the available fiscal space and significantly increased the sovereign debt.
5. Some previously large fiscal risks have decreased since the onset of the fiscal consolidation program in 2004. The fiscal consolidation program centered on revenue and expenditure measures but also on the privatization of GOCCs. Coupled with structural reforms and privatizations, this improved the primary fiscal balance, which contributed significantly to lowering public debt; GOCCs proved to be a large source of realized fiscal risk. Other key drivers of the debt-to-GDP ratio include the exchange rate, economic growth, and contingent liabilities.
6. Fiscal risks remain sizeable, and their likelihood of realization has increased with the ongoing global financial crisis and recession. Notwithstanding the recent fiscal consolidation efforts, public debt remains high and sensitive to a growth slowdown and exchange rate shocks; rollover risks are also important given the large and rising gross financing requirements of the non-financial public sector; and contingent liabilities are large. All these risks have a higher likelihood of occurrence since the onset of the global financial crisis (e.g., through tightening of credit supply and increased risk premia) and the ensuing global recession.
7. The largest fiscal risk exposure of the central government’s budget arises from its sensitivity to a few macroeconomic variables, namely economic growth, inflation, the interest rate, and the exchange rate.70 Analysis reveals no systematic bias in budget
69 World Bank, 2009, “Fiscal Risks: Assessment and Recommendations” chapter 2 of the 2009 Philippines Development Report. The assessment is based entirely on publicly available information though the World Bank can update the assessment based on existing non-public information. 70 In particular, (i) a 1 percentage point reduction of GDP growth increases the overall fiscal deficit by P14.7 billion; (ii) a 1 percentage point increase in the inflation rate reduces the overall fiscal deficit by P4.5 billion; (iii)
PHILIPPINES Discussion Note No.5: Fiscal Risk June 2011
DN5-3
forecasts of the overall fiscal balance although biases do exist among its revenue and expenditure components.71 Macroeconomic forecasts used for the budget have been reasonably accurate. Given the specific type of fiscal risk exposure, policymakers would benefit from scenarios based on alternative macroeconomic assumptions—that would ask questions such as, “what if the global economic outlook is worse than assumed in the budget?”. To answer “what if” questions, some countries include alternative (yet plausible) scenarios in their budget documents.
8. Fiscal risks related to the public debt are high and linked to a weak legal framework, a relatively high debt level, and a debt structure that can rapidly transmit shocks. The legal framework underpinning public debt management is fragmented and complex. Legal responsibility for public debt issuance, collection of information on public debt and guarantees, and debt management is devolved to several authorities and government entities.72 No formal debt management strategy exists in the Philippines so that public debt is managed with extensive executive discretion. While substantial progress was made in reducing public debt risks, these remain high.73 The average time to maturity is relatively short, requiring the government to raise large and rising amounts of debt each year; this exposes the budget to interest rate and rollover risks. The share of foreign-currency denominated public sector debt remains high (60 percent). As a result, public debt is broadly sustainable, but with significant upside risk. As the fan chart below reveals, while debt is projected to trend slightly downward over the medium-term under the assumption that the revenue effort improves (Figure 1, 50th percentile), large uncertainty surrounds the most likely outcome (darkest area) and debt has a much higher likelihood of increasing than decreasing.
9. Fiscal risks stemming from contingent liabilities have been and remain large, mainly on account of GOCCs, PPPs, the financial sector, and natural disasters. The realization of contingent liabilities accounts for a large share of fiscal risks in the Philippines. GOCCs have been and remain a large source of fiscal risk, with contingent liabilities of 10 percent of GDP, mostly in (unhedged) foreign currencies. GOCCs have systematically required fiscal transfers far higher than budgeted. PPPs generate large—12 percent of GDP in contingent liabilities in 2005—and complex fiscal risks, yet no institutional setup exists to comprehensively monitor and manage these risks.74 Government guarantees on fixed
a 100 basis points increase in the 91 T-bill rate increases the overall fiscal deficit by P9.6 billion; and a 1 peso depreciation of the peso/US dollar exchange rate increases the overall fiscal deficit by P1 billion. 71 Over the past five years, tax revenues were systematically (and significantly) over-estimated compared to the budget. In contrast, non-tax revenues were regularly under-estimated. On the expenditure side, up until 2008, actual spending has been systematically below budgeted amounts. The under-spending mostly arose on personnel services, maintenance and operations expenditures, and (very significantly) interest payments. 72 These include the President, the Bangko Sentral ng Pilipinas (BSP; the central bank), the Department of Finance (DOF) (at least six agencies), the National Economic Development Authority (NEDA), the Commission on Audit (CoA), and less directly, the Department of Budget Management (DBM). 73 The resiliency of public debt increased since 2003 through: a sharp decrease in the debt level and an increase in the share of public debt denominated in domestic currency. Nonetheless, the debt-to-GDP ratio of the public sector remains high and, since 2008, started increasing again. 74 No government unit is responsible for undertaking comprehensive, exhaustive and timely assessments of PPP projects. Large PPPs are currently in power, water and transport. Fiscal risks include risks related to right-of-way, political/regulatory risk, changes in laws, currency convertibility, and events of termination. A typical Independent Power Producer (IPP) contract, however, would also pass fuel supply and market risks to government. Exchange rate risk also arises when contractual payments are denominated in foreign currency.
PHILIPPINES Discussion Note No.5: Fiscal Risk June 2011
DN5-4
contractual payments have a high likelihood of occurrence, as are risks from political/regulatory actions.75 The financial sector has generated the costliest source of fiscal risk but these have abated overall thanks to improved regulatory and supervisory controls and strengthened bank balance sheets. Natural disasters present a large and recurrent source of fiscal risk since the Philippines is one of the most disaster-prone countries in the world. For the past two decades, the average direct annual cost to the economy associated with disasters is estimated at about 0.5 percent of GDP (indirect costs are significantly higher). While the public sector has set up various contingency funds to address these fiscal needs, in practice, most of the fiscal cost has remained with the National Government and systematically exceeded the budgeted resources (only 0.03 percent of GDP was budgeted in the Calamity Fund in 2009).
Figure 1. Philippines: National Government Debt Sustainability Analysis 1/
2030405060708090
100110120130140150
2004
2005
2006
2007
2008
2009
2010
2011
2012
2013
2014
inpe
rcen
tofG
DP
DSA based on 2009 data
90-95th
80-90th
70-80th
60-70th
50-60th
40-50th
30-40th
20-30th
10-20th
5-10th
P
Source: Philippines Quarterly Update (February 2010 issue), World Bank (2010a). 1/ The fan chart is constructed by taking a central forecast of NG debt (blackest line in the center) and calculating how this forecast would change if key variables such as inflation, the exchange rate and GDP growth differed from those assumed in the central scenario. The shocks introduced are those that have hit the Philippines in the past 10 years. The fan chart, therefore, provides a useful assessment of risks surrounding NG debt projections as it based on past Philippines shocks (magnitude and correlations). See Chapter 2 of World Bank (2009) for further details on the fan chart.
C. Key Institutional Weaknesses Contributing to Fiscal Risk
10. Transparency and accountability of public finances are weak in the Philippines as information is not widely disseminated or aggregated. This complicates the assessment of fiscal risks (World Bank, 2010b). Basic assessments regarding the predictability of the budget are difficult to undertake due to (i) the difference in reporting budget plans and outturns; and (ii) extensive within-year reallocation of the approved budget between line agencies and special purpose funds. More generally, the budget document does not include a clear statement on off-budget operations that create a risk of becoming on-budget (e.g., contingent liabilities and quasi-fiscal operations). The reporting of GOCC operations and their fiscal impact could also be improved.
75 These include the non-adjustment of tariffs despite contractual, formula-based, obligations to automatically do so; they have triggered financial penalties and legal recourse against the state.
PHILIPPINES Discussion Note No.5: Fiscal Risk June 2011
DN5-5
11. The Philippines would benefit from disclosing fiscal risks in terms of improved transparency and accountability, risk management, economic efficiency, and reduced borrowing costs. Having to publicly disclose the extent to which ongoing projects or policies subject the budget to fiscal risks would greatly improve the overall transparency and accountability of public spending, and is likely to better internalize their potential future costs (be it at the executive decision-making, Congress approval, execution, or even at a later election stage). Transparency should thus lead to better risk management and/or to the modification of policies that entail too large a risk for the budget; it could also strengthen accountability for risk management. Consistent with these benefits, studies show that fiscal transparency is associated with better sovereign bond ratings and greater access to international capital markets in the long run. Box 1 presents emerging international best practices in fiscal risk disclosure. D. Options for Strengthening Fiscal Risk Management Table 1: Philippines: Policy Areas and Actions
Policy Area 1: Overall Fiscal Risk Management Action 1.1 Establish a dedicated Fiscal Risk Unit Action 1.2 Regularly update and publish fiscal risk statement
Policy Area 2: Managing Public Debt Action 2.1 Establish a Debt Management Office Action 2.2 Introduce and publish a debt management strategy
Policy Area 3: Government-Owned and Controlled Corporations (GOCCs) Action 3.1 Strengthen DoF’s Corporate Affairs Group (CAG) Action 3.2 Re-institute a performance evaluation system
Policy Area 4: Public-Private Partnerships Action 4.1 Consider establishing a dedicated PPP unit within government
12. In the short-term, publishing a fiscal risk statement is a quick win as the assessment behind the statement can be undertaken rapidly (given the preliminary work undertaken in World Bank, 2009). The statement should provide a comprehensive view of major risks that would impact public finances. This statement would send a strong signal of a government committed to (i) undertaking sustainable fiscal reforms;76 and (ii) improving fiscal transparency and accountability, risk management, economic efficiency, and reduced borrowing costs. Having to publicly disclose the extent to which ongoing projects or policies subject the budget to fiscal risks would greatly improve the overall transparency and accountability of public spending, and is likely to better internalize their potential future costs. Transparency should thus lead to better risk management and/or to the modification of policies that entail too large a risk for the budget; it could also strengthen accountability for risk management.
76 Indeed, a fiscal risk statement provides a very clear view of whether true fiscal consolidation is taking place or whether consolidation is taking place at the expense of, say, an accumulation of contingent liabilities or an undue accumulation of risk in the public debt structure so as to reduce (in the short-term) the cost of servicing debt.
PHILIPPINES Discussion Note No.5: Fiscal Risk June 2011
DN5-6
13. Over the medium-term, for the Philippines to improve its assessment and management of fiscal risks, the following set of key legal and institutional reforms are recommended (these specifically address weaknesses in assessing, approving, managing, and disclosing fiscal risks):
Policy Area 1: Overall fiscal risk managementAction 1.1: Establish a dedicated Fiscal Risk Unit
A dedicated Fiscal Risk Unit, presumably within the Department of Finance (DoF), could be tasked with centralizing all information pertaining to fiscal risk (e.g., from the budget, public debt, GOCCs, PPPs, LGUs). The recent successful reforms undertaken in Indonesia’s Ministry of Finance both for the Debt Management Office and the Fiscal Risk Unit are particularly relevant to the Philippines.
Action 1.2: Regularly update and publish a fiscal risk statement
Box 1 provides an overview of emerging international best practices in this area. The update should be automatic. Countries have often submitted it along with the annual budget to Congress.
Policy Area 2: Managing Public DebtAction 2.1: Establish a Debt Management Office
While a Debt and Risk Management Office is part of the new structure of the DoF under its rationalization plan, the plan has yet to be implemented.
Action 2.2: Introduce and publish a debt management strategy
Countries have found that establishing and publishing a debt management strategy, setting out the goals and objectives within which debt managers have to perform and are accountable to, helps to improve the overall risk structure of the portfolio and better understanding of the various trade-offs in structuring the debt portfolio. A strategy establishing key objectives and priorities for debt management is a founding stone for building capacity in public debt management. The strategy then enables a coherent approach to: (i) designing prudent risk management strategy and policy; (ii) allowing for the strengthening of middle office analytical capability; (iii) defining a framework for risk management; (iv) ensuring consistency with other macroeconomic policies and objectives; (v) establishing an organizational structure that ensures clear accountability and transparency of responsibilities; (vi) establishing a sound legal framework; and (vii) recruiting trained staff, and selecting and implementing effective management information systems. 77
77 A typical debt management strategy seeks to ensure that the government’s payments and financing needs are met at the lowest feasible cost subject to an acceptable level of risk. The adoption of such formal strategies is becoming common practice in the region recently (e.g., Indonesia and Thailand in 2005). Thailand’s debt structure is an extreme example as it is almost all domestically issued, with fixed rates. Indonesia also consolidated its external loans and domestic securities directorates into one Directorate General for Public Debt in 2006. This DG Debt is expected to: (i) favor domestic over foreign currency borrowing so as to lower foreign exchange risk (and foster the development of the domestic bond market); (ii) increase the share of fixed rate debt
PHILIPPINES Discussion Note No.5: Fiscal Risk June 2011
DN5-7
Policy Area 3: Government-Owned and Controlled Corporations (GOCCs)Action 3.1: Strengthen the DoF’s Corporate Affairs Group (CAG) monitoring capacity
Despite CAG’s mandate to evaluate GOCC performance in line with fiscal risk management, given its limited manpower resources, monitoring of many GOCCs occurs only when these require government guarantees, and not on a continuous basis.
Action 3.2: Re-institute a performance evaluation system, subject GOCCs to performance targets, and regularly publish these evaluations As CAG aims to reintroduce a GOCC performance evaluation system, proper monitoring will require a stronger Group, as well as strong support from top policymakers so that it is able to obtain comprehensive and timely data from GOCCs. A strong understanding of the financial and economic standing of GOCCs will better enable the Department of Finance to assess fiscal risks from these companies.
Policy Area 4: Public-Private PartnershipsAction 4.1: Consider establishing a dedicated PPP Unit within government.78
The PPP unit could be tasked with (i) the legal and financial role of assessing, negotiating, and writing all PPP projects and contracts of the Republic;79 and (ii) monitoring, managing (in coordination with the Fiscal Risk Unit) fiscal risks stemming from PPP projects and being responsible for the overall policy direction and implementation of the government’s PPP program. Currently, no government unit is responsible for undertaking comprehensive, exhaustive and timely information on PPP projects.
to reduce interest rate risk, (iii) lengthen maturities to reduce refinancing risk; and (iv) rely mostly on concessional external financing (to the extent possible) to reduce external borrowing costs. 78 Though it should be noted that central PPP units by themselves are not sufficient to improve fiscal risks (evidence does not seem to suggest that countries that have central PPP units have fared better than those that do not; indeed some of the successful countries in tendering PPPs in Latin America do not have central units). 79 A strong legal and institutional framework for project selection, approvals and contract negotiations is needed to comprehend fiscal risks involved in PPPs. The implementing agencies responsible for identifying and selecting BOT projects for ICC approval have limited technical, legal and financial capabilities to negotiate and write BOT (Build-Operate-Transfer) contracts that minimize fiscal cost and risks.
PHILIPPINES Discussion Note No.5: Fiscal Risk June 2011
DN5-8
Box 1. Emerging International Best Practices in Fiscal Risks Disclosure
A large number of countries have selectively disclosed, elaborated, and/or quantified fiscal risks.Among the most widely disclosed risks are those associated with (i) macroeconomic shocks; the impact of key macroeconomic variables on the budget are analyzed through a variety of methods, such as sensitivity analysis, macroeconomic scenarios, and/or stress tests; and (ii) contingent liabilities, especially explicit ones such as loan guarantees. Disclosure is less consistent across countries for other key sources of fiscal risks, namely state-owned enterprises, sub-national governments, quasi-fiscal activities, and off-budget entities. More recent types of risks are less commonly disclosed though the number of countries disclosing them is growing fast (e.g., public-private partnerships) as are risks that are difficult to quantify (e.g., legal claims), and “policy risks” such as potential changes in government or regulatory policies. An emerging international best practice—including in the region—is for countries to disclose a comprehensive assessment of their fiscal risks. Starting with Australia and New Zealand’s pioneering fiscal risks statements, a few countries have introduced such self-contained statements, often as part of the annual budget document submitted to congress (see Table below). The context for these statements vary extensively, ranging from a legal requirement—as part of a broader approach to fiscal policy and disclosure found in Fiscal Responsibility Laws and/or public financial management legislations (e.g., New Zealand, Brazil)—or as the result of a discretionary decision of a Minister of Finance to foster the identification, disclosure, and management of fiscal risks (e.g., Indonesia in 2007). The practice of greater disclosure of fiscal risks is also driven by international accounting and statistical standards requiring the disclosure of certain material risks as well as recent transparency initiatives. Policymakers in the region are at the forefront of the push for better fiscal risk assessment, management and disclosure, as shown by the 2007 APEC Finance Ministers’ Meeting in which this topic was prominently discussed. Scope of Existing Fiscal Risks Statements around the World
Australia Brazil Chile Colombia Indonesia Pakistan
Source: World Bank (2009). 1/ Fiscal implications of two possible growth paths for the economy when key assumptions underlying the central forecast are altered. 2/ Sensitivity of revenues and expenditures to changes in real GDP growth, inflation, exchange rate, nominal interest rate, and minimum wage. Sensitivity of the federal public debt to changes in interest rate, exchange rate, and inflation. 3/ Sensitivity of revenues and expenditures to changes in economic growth, inflation rate, interest rate, exchange rate, crude oil price, and oil production. 4/ Sensitivity of the operating balance and sovereign-issued debt to changes in nominal GDP growth and interest rates.
PHILIPPINES Discussion Note No.5: Fiscal Risk June 2011
DN5-9
References
IMF, 2008, “Fiscal Risks—Sources, Disclosure and Management” Board Paper, May, Washington DC. World Bank, 2009, “Fiscal Risks: Assessment and Recommendations” chapter 2 of the 2009Philippines Development Report.World Bank, 2010a, “Philippines: Laying Out the Exit Strategies,” Philippines Quarterly Update, February issue, Manila. World Bank, 2010b, Philippines: Public Expenditure and Financial Accountability,forthcoming Washington DC.
Note prepared by: Eric Le Borgne (EASPR) The World Bank March 24, 2010
II. IMPROVED INVESTMENT CLIMATE
DN6-1
�����������������������������������������������Removing behind the border barriers to promote investment and growth T P
W
A PK
T
SME T
1. In the 1980s, Philippine policymakers embarked on a number of major reforms to liberalize trade, deregulate domestic markets and privatize public enterprises. These market liberalizing reforms were designed to generate faster output and productivity growth by promoting greater competition. More competition encourages existing firms to either become more efficient or be replaced by more productive firms. Furthermore, in the absence of economies of scale or externalities, greater competition leads to lower prices and improved product quality, benefitting consumers and other firms that use the products in question as inputs. Some evidence also suggests that greater competition raises the propensity to innovate and encourages faster technology diffusion.
2. While the Philippine economy is much more open today than it was three decades ago, the competitive momentum generated by these reforms has not been sustained. Following the introduction of reforms in the mid-1980s, both the trade ratios (exports + imports as a share of GDP) and the foreign investment ratio increased rapidly in the Philippines, comparable to the performance observed elsewhere in the region (Figure 1). Arguably, this helped prepare the ground for the subsequent economic take-off, with growth accelerating to 5 percent per annum during 2000-08, after plodding along at an average rate of 2.3 percent in the 1980s and 1990s. Even so, many observers had expected a greater economic pay-off, comparable to the 8 percent growth exhibited by the East Asian & Pacific region as a whole during this same period. Meanwhile, the initial competitive momentum provided by these reforms seems to have waned by the late 1990s as both the trade and foreign investment ratios declined again, contrary to the performance in the other East Asian comparator countries. Also, the industry structure continues to exhibit very high concentration ratios and price cost ratios in many sectors in the Philippines, which suggests the presence of monopoly rents.
PHILIPPINES Discussion Note No. 6: Competitiveness June 2011
DN 6-2
Figure 1: Evolution of Trade Ratios Foreign Direct Investment Inflows
Source: World Bank, World Development Indicators. Note: East Asia Average comprises Indonesia, Malaysia, Thailand and Vietnam.
3. These developments raise a series of questions about the remaining barriers to competition and growth in the Philippines.80 It is argued below that the Philippines has advanced significantly in removing barriers to trade, but that a significant number of ‘behind-the-border’ constraints remain that inhibit the entry of new businesses in different markets. Aldaba (2008) notes that the manufacturing sector in general has become more contestable due to the low level of tariff rates and removal of some constraints on foreign investment, but that competition remains constrained by the presence of structural and behavioral barriers, together with the absence of a dynamic core of medium-sized firms that could credibly challenge the large incumbent firms. The failure of these medium-sized firms to thrive conspires against a decline in industry concentration ratios, and tends to limit domestic competition and market contestability.
80 To address these questions it is useful to begin by considering that greater competition can be achieved, both, by facilitating the entry of products and services from abroad, and by facilitating the entry of new firms to produce goods and services domestically. The former entails the removal of barriers to trade, while the latter entails the removal of barriers to the entry and exit of firms. The reduction of import tariffs and elimination of non-tariff barriers that inhibit the flow of goods and services across borders often constitute the first line of attack in promoting greater competition. These measures generally work well in generating greater competition when the products in question are so-called ‘tradables’. However, when these products involve ‘non-tradables’ or their sale depends on non-tradable inputs (such as local distribution channels and other services), then the elimination of trade barriers may only have a limited impact in promoting greater competition. In this case, the best line of attack is to facilitate the entry of new firms into the market, especially through the attraction of foreign investment. This requires, in turn, the removal of barriers to market entry and improvements in the investment climate.
PHILIPPINES Discussion Note No. 6: Competitiveness June 2011
DN 6-3
A. The Philippines Today: Progress and Challenges 4. The Philippines has a fairly open international trade policy environment. The country has been moving toward more liberal trade and investment regimes through unilateral liberalization since 1985, and policy actions in the context of regional and multilateral commitments. In spite of partial reversals in 2003 and the absence of new initiatives since then, the latest Tariff Trade Restrictiveness Index (Tariff-TRI) values indicate that the Philippines remains a fairly open economy (Table 1). With a Tariff-TRI value for overall trade of 3.9 percent, the Philippines compares well to the averages for the East Asian & Pacific region (4.9 percent) or for the lower-middle-income countries (8.4 percent). The Philippines also faces relatively open markets for its exports. The Market Access Tariff Trade Restrictiveness Index (MA-TTRI) gives the Philippines a value of 2.5 percent, which is below the regional average of 3.8.81
5. The Philippines also compares favorably with other countries in terms of trade logistics. The World Bank’s Logistics Performance Index (LPI) measures the efficiency in carrying out an array of essential activities for trade, including transport, warehousing, cargo consolidation, border-clearance, distribution and payments systems. The Philippine LPI score of 3.14 in 2010 represents an improvement over the score achieved in 2007 and is comparable to the scores achieved by neighboring Thailand and Malaysia. It is also significantly higher than the average for the
81 The TTRI is a measure of the average height of import tariff barriers, weighted by import shares and import demand elasticities. Similarly, the MA-TTRI measures the average tariff barrier facing Philippine exports among its trading partners. The Tariff TRI measure does not take into account other non-tariff barriers to trade and trade preferences. More comprehensive measures of trade barriers that incorporate these non-tariff barriers portray the Philippines as a less open economy, more comparable to the average economy in the East Asia & Pacific region and among the lower-middle-income group. The available data on non-tariff barriers, however, only dates as far as 2001 and so questions arise in regard to its accuracy.
Table 1: Tariff and Market Access Trade Restrictiveness
Indices 2000-04 2005-08 2006-09
-------------Values------------- Rank Philippines Tariff TRI
MA-TTRI 4.31 3.39
2.77 3.84 2.46
21 56
Indonesia Tariff TRI MA-TTRI
5.23
4.24 4.62
4.63 4.23
56 80
Malaysia Tariff TRI MA-TTRI
5.26
3.93 2.59
4.06 2.30
24 55
Thailand Tariff TRI MA-TTRI
10.48
6.43 5.66
6.57 4.26
74 81
East Asia & Pacific ave.
Tariff TRI MA-TTRI
4.89 3.76
48 64
Source: World Bank, World Trade Indicators. Note: higher values for the Tariff TRI and MA-TTRI indicate a more restrictive environment. The rankings refer to a total sample of 125 countries.
Table 2: Logistics Performance Index Scores
(selected East Asian countries) 2007 2010
Score Rank (out of 150)
Score Rank (out of 155)
Philippines Indonesia Malaysia Thailand EAP ave.
2.69 3.01 3.48 3.31 --
65 43 27 31 --
3.14 2.76 3.44 3.29 2.65
44 75 29 35 98
Source: World Bank, World Trade Indicators 2009/10. Note: a higher score denotes better logistics performance.
PHILIPPINES Discussion Note No. 6: Competitiveness June 2011
DN 6-4
East Asian & Pacific region as a whole (Table 2). The Philippines’ relatively high rank in terms of the TTRI and the LPI indexes suggests that the barriers to trade do not appear to be important impediments to greater competition.
6. The Philippines has been less successful in eliminating so-called “behind-the-border” constraints that inhibit the entry of new firms and that weaken the investment climate. The most recent Doing Business82 report, which measures the cost and quality of business regulations, ranks the Philippines 144th out of the 183 economies measured on the overall ease of doing business, and 21st amongst 24 economies in the East Asia & Pacific region. This places the Philippines in the lowest quartile of the economies sampled, and significantly behind its other competitors in the region: Thailand (which ranks 12th), Malaysia (23rd), and Indonesia (122nd). Furthermore, Table 3 shows that the Philippines’s ranking has been progressively deteriorating since 2004, contrary to the evolution in the other countries.
The main behind-the-border constraints on firm entry in the Philippines 7. The Philippines exhibits significant barriers to market entry and exit of firms.The sub-categories that make up the overall Ease of Doing Business indicators reveal that the Philippines falls into the last quintile of the economies surveyed in terms of the ease of starting a business as well as in the ease of closing a business (Table 4). Another category where the Philippines ranks very poorly in comparison with its regional comparator economies is in the protection of investors. Meanwhile, as found earlier, trading across borders does not appear to be a major constraint, even though the Philippines ranks less well than several regional comparators. 8. Cumbersome regulations and procedures deter the entry of firms and business expansions. The number of procedures (15) required to start a business in the Philippines is substantially higher than in other countries in the region, resulting in higher cost and investments in time. Furthermore, the weak bankruptcy resolution regime makes it particularly difficult for inefficient or unprofitable firms to exit the market. The recovery rate from a failed business in the Philippines averages a very low 4 cents to the dollar, compared
82 The World Bank’s Doing Business indicators rank economies based on 10 indicators of business regulations that track the time and cost needed by domestic companies to meet business regulations such as starting and operating a business, trading across borders, paying taxes, or closing a business. It does not measure all aspects of the business environment that matter to firms and investors. For example, it does not measure security, macroeconomic stability, corruption, skill level, or the strength of financial systems.
Table 3: Evolution of the Ease of Doing Business Rankings; 2004-
10 2004 2005 2006 2007 2008 2009 2010Philippines 149 137 128 132 136 141 144Indonesia 174 152 131 134 125 129 122Malaysia 33 21 18 20 21 21 23Thailand 21 42 23 23 19 12 12Source: World Bank/IFC, Doing Business 2010. Note: Economies are ranked from ‘easiest’ to ‘most difficult’ for doing business. Given that the sample size varies across years, the rankings have been recalibrated in proportion to the 2010 sample size (183).
PHILIPPINES Discussion Note No. 6: Competitiveness June 2011
DN 6-5
to more than 30 cents in Malaysia or Thailand, causing potential entrants to think twice before committing to take advantage of seeming market opportunities.
Table 4: Ranking of the Ease of Doing Business Indicator 2010; by Sub-Category
Components Philippines (Quintile) Indonesia Malaysia Thailand Overall Ease of Doing Business Rank 2010 144 4 122 23 12
Source: World Bank/IFC, Doing Business 2010. Note: Rankings are based on a total sample of 183 economies.
9. Investor protection is weak in the Philippines, in part because secured creditors do not have priority in bankruptcy proceedings. The country scores four on a ten-point index for strength of legal rights in the Doing Business 2010 report. Shareholders’ rights, particularly those of minority shareholders, are not effectively protected and the enforcement of legal rights through judicial proceedings is problematic, as protracted court proceedings are a major deterrent to effective rehabilitation and insolvency proceedings. Trial court proceedings last up to four years; and up to 10 years if the judgment is appealed all the way to the Supreme Court.
10. The country’s collateral system is fragmented into different registries, which makes debtor searches difficult. The current system for registering land titles is inadequate: the data are not centrally filed and are not publicly available online. The absence of reliable cadastral surveys leaves large tracts of land without enforceable titles. Furthermore, in rural areas, uncertainties surrounding land ownership brought about by delays in the agrarian reform program and restrictions on the transfer of land discourage investments in agriculture, as this effectively strips farmers of their collateral, limiting their access to credit from formal financial intermediaries. At the same time, restrictions on the use of land have resulted in the premature conversion of agricultural lands, thus undercutting rural economic growth.83
11. The Foreign Investment Negative List is very narrow, which contributes to the high cost of doing business. This list comes with a 40 percent cap on foreign equity ownership in most sectors, and even lower caps on land ownership (foreigners are not allowed to own land) as well as in capital-intensive sectors, such as air transport. This ownership restriction also complicates asset restructuring.
83 Another important information gap pertains to the registration of moveable collateral (chattel); often the only type of collateral available to SMEs. Currently, the Registries of Deeds’ information is not centralized, registration of chattel is often extremely time-consuming and costly, and often financial institutions cannot verify if a particular chattel has already been registered.
PHILIPPINES Discussion Note No. 6: Competitiveness June 2011
DN 6-6
12. The entry of new firms or expansion of existing businesses in the Philippines is also affected by the overall investment climate. In addition to the direct costs of opening or closing a business discussed above, decisions to enter a market are also determined by broader considerations of competitiveness, or productive potential. A well-known indicator of the quality of national business environments, the World Economic Forum’s Global Competitiveness Index (GCI),84 consistently ranks the Philippines among the less competitive half of the countries surveyed. Moreover, its relative standing has been dropping since 2000, unlike the more favorable evolution of the regional comparator countries (Table 5).
Table 5: Global Competitiveness Rankings for selected East Asian Countries 2009 2005 2004 2000
Sample size 133 2005
sample 117 2004
sample 104 2000
sample 58 Philippines 87 82 77 73 76 52 46 Indonesia 54 49 74 70 69 49 47 Malaysia 24 24 24 23 31z 27 30 Thailand 36 34 36 34 34 28 40 Source: World Economic Forum, Global Competitiveness Report, various issues.
13. Looking behind the overall GCI rating, the Global Competitiveness Report points to two major shortcomings that undermine the competitiveness of the Philippine economy: weak governance and inadequate public infrastructure. These overall findings are broadly corroborated by the Enterprise Surveys associated with the Investment Climate Surveys carried out by the World Bank and Asian Development Bank, which had also identified the threat of macroeconomic instabilility as a major concern. Of these three shortcomings, the level of corruption is the topmost concern of managers in the Philippines (Figure 2). This finding applies regardless of business size and significantly raises the cost of doing business for private enterprises. Without delving into the details of each constraint,85 they are mentioned here to emphasize that any efforts to foster greater competition in the Philippines must also take into account these broader investment climate constraints if they are to succeed fully. 14. A more specific constraint on firm entry and expansion in the Philippines is the limited access to financing. While not among the top three concerns, this issue weighs heavily on micro, small and medium-sized enterprises (MSMEs), which comprise 99.6
84 The Global Competitiveness Report measures the quality of national business environments on the basis of 12 pillars that comprise the Global Competitiveness Index (GCI), while the World Economic Forum’s Executive Opinion Survey seeks to identify the most problematic factors for doing business. The 12 pillars refer to the quality of institutions, infrastructure, macroeconomic stability, health and primary education, higher education and training, goods market efficiency, labor market efficiency, financial market sophistication, technological readiness, market size, business sophistication, and innovation. 85 These constraints are addressed separately in several accompanying Discussion Notes. The issues of governance are addressed in the Philippines Discussion Notes Nos. 17 and 18, the shortcomings in transport and energy infrastructure are discussed in the Philippines Discussion Notes No. 9 and 10, and the fragility of public finances as the main threat to macro-stability is addressed in the Philippines Discussion Notes No. 3, 4 and 5.
PHILIPPINES Discussion Note No. 6: Competitiveness June 2011
DN 6-7
percent of businesses in the Philippines.86 More SMEs can be created, or once created can have better expansion opportunities, if investment finance is readily available. The main factors that limit their access to financing are (i) a lack of institutions willing to finance SMEs, (ii) bureaucracy and red tape in processing applications, and (iii) lack of collateral. While there have been cases where directed lending has worked, these are very rare. Instead of encouraging private sector development, the mandatory allocation for SME lending mostly results in the re-labeling or re-categorizing of loan files by the banks in order to meet the target without having to venture into new markets or attract new clients – this appears to be a common practice among banks in the Philippines. Also, enforcement of mandatory lending targets relies upon self-reporting (from banks to the regulator), and on the regulator's capacity to supervise, which is usually overstretched. Furthermore, lending to microfinance institutions (MFIs) also counts towards meeting the mandatory minimum SME target; a common loophole that results in no additional SME lending.
Figure 2 Most Problematic Factors for Doing Business in the Philippines
CI I
P A
T C
T G
R P
P I
IF
Source: World Economic Forum, Global Competitiveness Report, 2009-2010, 2009 Executive Opinion Survey.
15. Access to credit in the Philippines is hampered by relatively high creditor risk. The four-country comparison in Table 6 indicates that SME access to loans is inversely related to the average time it takes to complete bankruptcy proceedings and to bankruptcy costs, and positively related to the expected creditor recovery rate on bad loans. That the share of SMEs with bank loans (at 17 percent) should be so low in the Philippines is therefore not surprising when one considers that the bankruptcy process is extremely slow (it takes around six years to complete a bankruptcy case), bankruptcy administration costs are high (38 percent of estate), and expected creditor recoveries are low (4.4 cents on the dollar). The
86 A 2007 study by the International Finance Corporation (IFC) suggested that the annual unmet demand for SME loans was in the range from PHP67 billion to PHP180 billion. Bangko Sentral ng Pilipinas (Central Bank) figures show that between 2000 and 2006, in nominal terms, the total (official) lending volume to MSMEs rose only from PHP986 billion to PHP1, 228 billion, i.e., an average increase of only 3.7 percent per annum, significantly less than the rate of inflation. According to the UPS 2009 Asia Business Monitor, access to funding is the second most important factor limiting the competitiveness of the Philippines’ SMEs (67 percent of respondents, following “lack of government support”, with 74 percent).
PHILIPPINES Discussion Note No. 6: Competitiveness June 2011
DN 6-8
procedural and administrative bottlenecks in the bankruptcy process are so inefficient that creditors hardly ever use it.87 These factors make the financing of SMEs a very risky proposition in the Philippines.
Table 6: SME Access to Credit Is Inversely Related to Creditor Risk
Malaysia China Indonesia Philippines SMEs with loans (2007) 57% 52% 17% 17%
Years to complete bankruptcy case (2010)
2.3 1.7 5.5 5.7
Bankruptcy cost relative to estate (2010)
15% 22% 18% 38%
Expected creditor recovery on loans (2010)
38.6% 35.3% 13.7% 4.4%
Private bureau coverage of adult population (2010)
82% 0% 0% 6.1%
Public registry coverage of adult population (2010)
48.5% 62.1% 22% 0%
Source: Doing Business database. 16. The lack of accessible information on payment histories adds further to creditor risks. Table 6 also suggests that access to financing is positively associated with the operation of credit information bureaus. The ability of financial institutions to provide cost-effective services depends in large part on the availability of information necessary to assess the creditworthiness of their clients. The Doing Business 2010 report reveals that the scope, accessibility and quality of credit information through either public or private bureaus in the Philippines are very low. A strong credit information infrastructure would greatly contribute to increasing the Philippines’ rating in the Doing Business report and, even more importantly, facilitate a greater volume of financing. So far, there has not been much progress in finding ways to set up the public registry. This is all the more important in the context of the on-going global financial crisis, where trade is further hampered because of the lack of information on the creditworthiness of importers.
Weak competition framework 17. Though market concentration in many sectors of the Philippine economy has been high and increasing during the 1990s, greater openness to imports increased market contestability and limited the potential abuse of market power.88 Nevertheless, a
87 An up-to-date bankruptcy framework – the “Financial Rehabilitation and Insolvency Act” - which aims for a faster and more orderly rehabilitation or liquidation of financially distressed companies and individuals was passed before the end of the 14th session of the Congress. 88 Aldaba (2008), Table 14, found that the average four-firm concentration ratio of the Philippine manufacturing sector (at the five-digit PSIC level) increased from 71 percent in 1988 to 81 percent by 1998, where the most concentrated sub-sectors involve the production of intermediate and capital goods. She also found, however, that the level of industry concentration was positively correlated with import penetration, but not with domestic
PHILIPPINES Discussion Note No. 6: Competitiveness June 2011
DN 6-9
few sectors continue to face substantial import restrictions and there is evidence of market collusion in some markets, either due to structural barriers or behavioral constraints. In most cases, the previously mentioned barriers to entry for SMEs also play a role. Table 7 lists a number of industries where the degree of market competition appears to be limited, either on account of collusive behavior or structural constraints to the entry of new firms.89
Table 7: Selected Sectors with Barriers to Entry and Competition
Sector Source of Barrier to Entry Agriculture -- Rice -- Corn, Sugar
Import licenses or tariff quotas Cartel behavior by dominant producers
Agribusiness Restrictions on foreign land ownership; Restrictive land use policies Downstream Oil Cartel behavior by oligopolistic producers; Large capital requirement Pharmaceutical drugs Licensing/registration restrictions; Cartel behavior by dominant firms Cement Cartel behavior by oligopolistic producers; Large capital requirement Electricity Distribution Monopoly; Limited regulatory capacity Water Local monopoly; Multiple fragmented/overlapping administrations Drug Stores Economies of scale and scope Telecommunications Congressional Franchise; Limited regulatory capacity Ports Monopoly; Limited regulatory capacity Water Transport Cabotage law; Cartel behavior by local oligopolies Air Transport Cabotage law; Congressional franchise; Limited regulatory capacity
Source: Aldaba (2008).
18. The promotion of competition has been implicit in the major reforms implemented since the 1980s, even though the Philippines has no explicit competition framework. There are several pieces of sector or industry-specific competition laws, as well as regulatory arrangements in place to manage natural monopolies, but these are not adequate for dealing with the wide range of anti-competitive behaviors that have or could emerge in different sectors in a consistent manner. Also, the Philippines does not have a single central institution for enforcing competition legislation. The creation of such an institution could contribute to a more comprehensive and consistent competition policy, while the availability of a comprehensive competition framework would serve to prevent anti-competitive behavior, as well as to help guide policymakers in the definition and implementation of future measures designed to bring about a more competitive economy.
B. Where the Philippines Could Be: Policy Options 19. The promotion of greater competition has been an implicit intermediate objective of the Philippines development program since the 1980s. This effort appears to have lost some momentum in recent years and needs to be reinvigorated in the interests of achieving sustained growth that is broadly shared. To generate a more competitive environment,
price-cost margins. This suggests that the increased market concentration reflected a winnowing out of the less efficient firms in the face of greater competition, and was not associated with the exploitation of market power. 89 These structural barriers refer to the presence of very high up-front investment expenditures required to enter the market, or the existence of economies of scale conducive to natural monopolies.
PHILIPPINES Discussion Note No. 6: Competitiveness June 2011
DN 6-10
policymakers will need to go beyond the elimination of trade barriers and remove some of the remaining behind-the-border constraints to trade and firm entry. Two important categories of behind-the-border constraints identified earlier that need to be addressed in this context are the overly complex business requirements to open and close businesses, and the difficulties faced by small and medium-sized enterprises in accessing credit. Another important obstacle is the absence of a comprehensive competition framework to guide further reforms. Various concrete measures that would help to reduce these barriers are discussed next.
Table 8: Summary of Policy Actions to Foster Greater Competition & Competitiveness
Policy Area 1: Streamlining Business Regulations in a Rules-Based Environment Action 1.1 Simplify business regulations to reduce operational costs Action 1.2 Strengthen the legal framework and enforcement to protect property rights Action 1.3 Review the Foreign Investment Negative List and consider reducing restrictions
Policy Area 2: Facilitating Greater SME Access to Finance Action 2.1 Strengthen the legal framework for NPL resolution Action 2.2 Set up the public credit bureau Action 2.3 Replace mandated SME lending by a system of guarantees
Policy Area 3: Strengthening the Competition Framework Action 3.1 Develop an explicit competition framework and competition authority Action 3.2 Develop independent regulatory oversight agencies Action 3.3 Set up an independent advisory body to advance the economic reform agenda
Policy Area 1: Streamlining Business Regulations in a Rule-Based Environment
Action 1.1 Simplify business regulations to reduce operational costs
20. The Philippines’ business regulatory system currently requires 15 procedures to start a business and eight procedures for registering property. The authorities might consider paring down these two sets of procedures to nine and six, respectively, which would put the Philippines on a par with regional comparator countries and reduce the cost of starting a business. Once businesses are registered, cumbersome licensing and inspections requirements (e.g., in securing construction permits) strain their operations. It would be advisable to revamp these licensing systems as well, using an approach that goes beyond the traditional ‘item-by-item’ reform and, instead, applies a comprehensive top-down methodology whereby all licenses not actively justified by the regulators are eliminated by default.
21. Set up a Small Business Tax Regime to help address the sometimes complex administrative burden faced by entrepreneurs when complying with tax regulations. The administrative complexity of complying with tax obligations is among the top complaints voiced by SMEs, and a frequent excuse for remaining in the informal business sector. By reducing compliance burdens through a simplified and integrated regime specifically targeting small businesses, another benefit would be to potentially widen the tax base in the Philippines, and increase (modestly) the government’s tax collections. More importantly, it could also help in reducing corruption in the tax system.
PHILIPPINES Discussion Note No. 6: Competitiveness June 2011
DN 6-11
22. Facilitate a better understanding, especially among incipient firms, of the different registration, licensing and taxation processes through the presentation of flowcharts prominently displayed in public places. This can be done by creating a step-by-step guide with a list of required documents and flowcharts showing which offices to visit when and with what documents, and listing the addresses, working hours and contact number of each office. A first step in this direction was already taken with the Anti-Red Tape Act, which brought about the Citizen’s Charter flowcharts now displayed in various government offices. This can be further improved in terms of completeness, accuracy, and accessibility. Developing (or improving) an online system is another way to make information more widely accessible, saving time for both businesses and government officials. More importantly, by reducing the need for direct interactions with different officials, it removes the potential for under-the-table transactions. Action 1.2 Strengthen the legal framework and enforcement to protect property rights
23. Sign into law and implement the Financial Rehabilitation and Insolvency (FRI) bill that was passed by both the Senate and the House in February 2010. A sound and stable investment climate depends on more than the ease of business entry and streamlined licensing. Most small businesses fail within three years and their owners need to start over again. Insolvency allows for businesses to end smoothly, allowing an efficient reallocation of capital and for entrepreneurs to start over again. A good insolvency law helps to resolve the competing claims on a business in a predictable, efficient and transparent manner. If lenders have the assurance that the country has a functioning insolvency system, they will be able to estimate more accurately the risk of a loan and charge a lower interest rate. It makes it easier for buinesses to obtain bank financing at more favorable rates. 24. Once the FRI law is signed, it is necessary to approve implementing regulations. In developing these regulations, it would be desirable to give particular emphasis on the law’s application to SMEs and take into account international best practices as articulated, for example, in the World Bank Principles for Effective Insolvency and Creditor Rights Systems. Looking forward, there is a need to enhance the development and delivery of particular components of the revised insolvency system, e.g., developing informal workout systems (out-of-court insolvency procedures) to ease the burden on formal insolvency systems.
25. Strengthen the Philippine collateral system. The cadastral titling of all lands in the country needs to be completed and a central registry for land titles established. A modern registration system for secured transactions needs to be established, with unified and searchable registries for all collateral. Moreover, the collateral value of agrarian reform land needs to be restored to increase farmer-beneficiaries’ access to credit from formal financial markets.
Action 1.3 Review the Foreign Investment Negative List and consider reducing restrictions 26. To improve non-performing loan recovery and asset restructuring, as well as reduce the cost of doing business for foreign investors seeking to enter the Philippine market, review
PHILIPPINES Discussion Note No. 6: Competitiveness June 2011
DN 6-12
the Foreign Investment Negative List and consider relaxing foreign ownership restrictions on land and other assets in the Philippines. Policy Area 2: Facilitating Greater SME Access to Finance90
Action 2.1 Strengthen the legal framework for NPL resolution 27. The recently approved FRI bill provides a new basis and opportunity for strengthening the legal framework for resolving non-performing loans (NPL). At the same time, the independence and capacity of the financial sector regulators – Securities and Exchange Commission, Bangko Sentral ng Pilipinas, Insurance Commission – need to be strengthened to bring the Philippine markets more in line with international standards. In this context, particular emphasis should be placed on the monitoring of related-party lending, risk-based capital adequacy, and corporate governance. Action 2.2 Set up the public credit bureau
28. The Philippines already passed the Credit Information System Act, but the credit bureau called for under the Act has not yet been established. By collecting, distributing and sharing credit information on borrowers, credit registries help lenders assess risk and allocate credit more efficiently. They also free entrepreneurs from having to rely on personal connections or savings. The prospective credit bureau should be encouraged to expand the range of information available by including history from other sources and distributing positive/negative information. Action 2.3 Replace mandated SME lending by a system of guarantees 29. Introduce a system of credit guarantees for SMEs to replace the existing system of mandated lending. Mandatory allocations for SME lending initially may have played a role in encouraging growth in the volume of SME lending, but they no longer suffice to meet the financing needs of Philippine SMEs and have proven to be counter-productive. A system of guarantees that seeks to encourage financial institutions to lend to SMEs stands a better chance of succeeding than the current system that seeks to coerce the banking system into making loans that are perceived as unprofitable or overly risky. Policy Area 3: Strengthening the Competition Framework
Action 3.1 Develop an explicit competition framework and competition authority
30. An explicit competition framework is needed to help combat ongoing and potential anti-competitive practices that are not sanctioned under the existing legal framework. Once it
90 Lack of access to credit is not among the top three constraints on the investment climate (Figure 2), nor a constraint on large enterprises, which are mostly responsible for any anti-competitive behavior in the Philippines. However, it is a constraint for medium-sized enterprises, which provide the best hope for increased market contestability in some sectors.
PHILIPPINES Discussion Note No. 6: Competitiveness June 2011
DN 6-13
is in place, a competition (or anti-monopoly) authority needs to be created to enforce this framework. 31. To improve the quality of regulatory governance and improve the efficiency of regulations, there is a need to establish a vetting mechanism – typically called Regulatory Impact Assessment - which (a) ensures that new regulations meet regulatory quality criteria, and (b) impedes creeping re-regulation, thereby ensuring the sustainability of reform. A regulatory review unit should be established to vet new licenses/regulations and assess their impact on business activity while establishing a regulatory registry will provide positive legal security for businesses, i.e., only those regulations captured in the registry can be legally enforced. Action 3.2 Develop independent regulatory oversight agencies
32. To make network service industries and the sectors competitive, these markets should be governed by independent regulators with full operational separation and impartiality. To be effective, the regulators must be subject to transparent public procedures (e.g., in procurement) and equipped with adequate expertise and resources to execute their mandates. Action 3.3 Set up an independent advisory body to advance the economic reform agenda 33. Without an institutional structure in place to implement and coordinate the reform process effectively, there is the danger that the reform momentum will dissipate fairly quickly. There is a need for public education not only to generate ‘buy-in’ and create a constituency for reform but also a deeper appreciation of the importance of competition and the economic gains from contestable markets. It is important to have a structured dialogue with the private sector and other stakeholder groups on a multi-faceted action agenda on market competitiveness and contestability. An independent advisory body with an economy-wide view would ensure that full economic gains from competition would be realized. This body should have statutory independence, be adequately funded, and staffed with senior executives appointed for fixed terms.
PHILIPPINES Discussion Note No. 6: Competitiveness June 2011
DN 6-14
References Aldaba, Rafaelita M. (2008), “Assessing Competition in the Philippines,” Philippines Institute for
Development Studies, Discussion Paper Series No. 2008-23, September. Asian Development Bank/World Bank (2003), Investment Climate Survey. Manila. Medalla, Erlinda M. (2002), “Philippine Competition Policy in Perspective,” Philippines Institute for
Development Studies, Discussion Paper Series No. 2002-25, December. Vaillancourt, L. (n.d.), “IFC Study on SME Financing.” World Bank and Organization for Economic Co-operation and Development (1999), A Framework for
the Design and Implementation of Competition Law and Policy. Washington, DC. World Bank (2008), Worldwide Governance Indicators. Washington, D.C. __________ (2009), Enterprise Survey, Washington, D.C. World Bank and International Finance Corporation (2010), Doing Business, 2010.
World Economic Forum (2009), The Global Competitiveness Report 2009-2010.
Note prepared by: Gerlin May U. Catangui (IFC/CEAPH), Soonhwa Yiu (CFPIR) and Ulrich Lächler (EASPR)
DN 7-1
������������������������������������ Securing reliable and cost effective electricity services R
P T G P
M PV M L
E US WA
A. The Philippines Today: Progress and Challenges 1. The restructuring and liberalization of the market, sparked by passage of the Electric Power Industry Restructuring Act 2001 (EPIRA), has progressed well, but remains incomplete in several critical areas – and, critically, is not widely seen as having delivered sufficient benefits. Since the passage of EPIRA, the country has built up a new regulatory authority, implemented a competitive wholesale electricity market, and embarked on an impressive and mostly successful privatization effort. The Electricity Regulatory Commission (ERC) has developed in a promising manner, and its continued development as an independent and credible regulator should be continued. Private sector distribution companies and generation facilities are already operating with high efficiency. But private ownership and/or administration of the remaining state-owned power plants need to be further advanced; transmission investment could be usefully accelerated; reform is urgently needed in the electric cooperative sector; and overall operating costs and customer tariffs remain high. Meanwhile, legacy and transition liabilities have grown significantly and have translated into significant financing challenges for the sector and the Government. (See Annex for additional background information on the power sector.) 2. Much has been achieved to date, but there is a full agenda going forward. These include: managing the privatization of the remaining generation assets; creating conditions for effective competition; developing renewable energy; developing the natural gas market; restructuring debt held by government agencies; addressing the issue of non-bankable electric cooperatives; attracting timely generation investments; and efficient planning and execution of transmission expansion. And given the likely pace of demand growth, the Philippines could soon face supply shortages in all the major regions. The foundation is in place; action is now essential.
PHILIPPINES Discussion Note No. 7: Energy June 2011
DN 7-2
Key Challenges
3. Three critical issues loom large as the new government takes office. First, huge new investments must be attracted to build new power generation capacity and expand the transmission and distribution network. Second, millions of households remain to be electrified, and there are major questions about how this can be done in a financially sustainable manner. Third, there are significant parts of the power sector reform agenda still under implementation, and some of those could have important financial implications for the sector. 4. The Philippines faces some unique power sector challenges. The country’s many inhabited, often mountainous, islands mean that connection and operational costs in some areas will be quite high. It is rapidly urbanizing and there are big gaps in relative wealth among regions, especially between the metro Manila area (accounting for almost half of the country’s GDP) and the rural areas (some of which are quite isolated). In addition to urban-rural disparities, there are regional issues, with Luzon relatively prosperous and Visayas, Palawan, and Mindanao among the poorer regions. These differences are mirrored in the electricity sector – Luzon and Manila in particular are relatively well-served, access is high, and a sophisticated power market is operational. In the other regions, by contrast, networks are less developed and less integrated, power supply is less abundant and reliable, and access rates are lower. The reliable capacity available to meet demand in Visayas and Mindanao is much lower than the nameplate installed capacity, and there is barely enough reliable generation capacity to meet peak demand. It is likely that both areas will suffer from increased power shortages until new capacity comes on line. In Luzon there is surplus of capacity for now, but shortages are looming.
Three regions, three different power markets
Luzon (2007)� Installed capacity: 11,907 MW� Peak demand: 6,674 MW� Barangay electrification: 98%� Per capita GDP: P14,670� Poverty rate: 30.2%� Share of PH economy: 65.9%� Main source of power
generation: 43% natural gas
Visayas (2007)� Installed capacity: 1,832 MW� Peak demand: 1,176 MW� Barangay electrification: 98%� Per capita GDP: P11,281� Poverty rate: 41.8%� Share of PH economy: 16.5%� Main source of power
generation: 71% geothermal
Mindanao (2007)� Installed capacity: 1,933 MW� Peak demand: 1,204 MW� Barangay electrification: 93%� Per capita GDP: P10,383� Poverty rate: 49.9%� Share of PH economy: 17.6%� Main source of power
generation: 50% hydro
Distribution Utili tiesElectric Cooperatives 119Priva te Dist. Util ities 18LGUs 2Barangay Ele ctrifica tion, as of 6/03No. of Brgys. Energized 37,246 No. of Rem aining Brgys. 4,753
5. There is no single national grid, as Mindanao is not connected to the Luzon/Visayas network. Significant transmission constraints exist, exacerbated by the backlog in transmission investments that built up during the course of the Transco concessioning process. Luzon’s wholesale spot market cannot be extended soon to Visayas or Mindanao, and meeting the growing demand in Visayas will be difficult without well planned generation and transmission investments. The lack of adequate transmission capacity creates barriers to development of new power plants (including new renewable generation capacity
PHILIPPINES Discussion Note No. 7: Energy June 2011
DN 7-3
and medium-sized geothermal within Visayas). The lack of integration among the three grids means that the Visayas and Mindanao generation markets will be overseen by administrative regulation rather than driven by competition. 6. Despite good progress in electrification, the Department of Energy (DOE) estimates that nearly 5-million Filipino homes remain unconnected. Almost all districts – barangays – are electrified, and more than 70 percent of homes have an electricity connection. Access continues to be a national priority, and DOE’s planning target is to reach 90 percent household electrification by 2017. This will require 3.4-million households to be connected between 2009 and 2017, of which 1-million are assumed to be solar home systems, reflecting the high cost of extending distribution lines in some areas. 7. Tariffs in the Philippines are stubbornly high for several reasons. First, the archipelagic nature of the country makes services very costly in some areas (especially when generation has to be fueled by oil). Second, while the natural resource endowment is in some ways favorable, the development of geothermal, natural gas, and hydro resources has been expensive. Third, sector investments have been low and often not efficiently planned or implemented. Fourth, the response to the crisis was to contract a huge amount of new capacity with some procurement resulting in expensive projects. 8. Electric Cooperatives (ECs) are generally inefficient. Generation costs account for only 43.8 percent of power tariffs charged by the ECs reflecting the high costs of transmission and distribution in a mountainous island chain. Among the private distribution companies, which serve mainly an urban customer base, generation costs make-up a somewhat more typical 57-59 percent of total recoverable costs. Tariffs recover costs only up to the allowed regulated cap on losses. Actual distribution losses, particularly among the ECs, are sometimes higher than the regulated cap, but overall, losses have come down over the last 15 years. Transmission costs as a percentage of overall tariffs are also high by international standards. 9. The relatively high cost components at all levels of the system result in high prices. However, the Philippines is implementing a regulatory framework to collect legitimate costs from customers. The Government, for example, does not have to pay directly for operating deficits, though it is exposed to liabilities stemming from the Power Sector Asset and Liability Management (PSALM) finances. Cross subsidies have been eliminated.
Electricity Access in East Asia (in %)
PHILIPPINES Discussion Note No. 7: Energy June 2011
DN 7-4
Many customers have become adept at managing their demand to take advantage of changes in electricity prices over the course of the day. On the supply side, the majority of distribution entities in the country, especially in the coop sector, have dramatically lowered their losses. Collectively these are important achievements which have proved sustainable and can be built upon.
Unbundled residential power tariffs (P/kwh) 8.46 7.19 6.19 7.43 5.23
Luzon, Visayas and Mindanao average (June 2008); MERALCO (December 2007), CAPELCO (December 2007)
10. The Government has amassed sizeable liabilities, which projected forward will run into numerous billions of dollars over the decade or so. PSALM has been able to re-finance its debt, in part by availing itself only through sovereign guarantees, but as the country approaches its foreign borrowing limit, this cannot continue indefinitely as it is likely to affect the Government’s overall credit rating. Even without considering borrowing limits, financing outcomes have not been efficient, and financing costs have been rising. The challenge for the Government will be to maintain the amount of debt at a level consistent with the projected revenue available for debt service. EPIRA limits the direct assumption of past power sector debt by the Government, so other approaches may need to be considered. B. Where the Philippines Could Be: Policy Options 11. In this challenging context, the incoming Government needs to target policies that will help the power sector to expand access, meet demand, and operate efficiently. The following policy areas should be prioritized. Table 1: Policy Areas and Actions
Policy Area 1: Strengthening Sector Finances Action 1.1 Put in place long-term debt management solutions for PSALM Action 1.2 Address financial problems of NPC and the ECs
Policy Area 2: Strengthening Institutional Development and Service Delivery
PHILIPPINES Discussion Note No. 7: Energy June 2011
DN 7-5
Action 2.1 Develop options for expanding competition to the retail level Action 2.2 Reduce transmission constraints in Luzon to enable network integration
Policy Area 3: Ensuring Energy Security
Policy Area 1: Strengthening Sector Finances
Action 1.1 Put in place long-term debt management solutions for PSALM 12. The priority is to develop a series of options for managing PSALM’s debt overhang. The key is not necessarily to reduce these liabilities to zero in one fell swoop; but to put in place a long-term management solution that removes uncertainty from the market and is consistent with fiscal and debt management constraints of the treasury. In addition, there is a need to accelerate the privatization of remaining PSALM assets, so that the agency’s financial situation does not continue to impair the energy sector performance. Removing uncertainty should help in mobilizing investment by making borrowing requirements and tariff levels easier to project. Action 1.2 Address the financial problems of NPC and the ECs 13. There are serious financial problems at the operational levels of the National Power Company (NPC) and among the ECs. NPC is the generation supplier of last resort in 67 areas not connected to the transmission grid, and this activity is a serious source of losses for NPC (the operating unit is referred to as NPC-SPUG, or Small Power Utilities Group), because of the far flung nature of the operations, the dependence on expensive oil-fired generation, and the financial weakness of the ECs and their customers. At the coop level, meanwhile, the main historic financing agency, NEA (the National Electrification Administration) can only meet 13 percent of the estimated PHP 30-billion investment requirements. Currently, there are 119 ECs responsible for distributing electricity to 80 percent of the barangays in the Philippines. Based on NEA data in 2007, the financial and operational positions of the ECs vary widely. About 63 ECs had insufficient revenues to cover their operating and debt service costs, while 32 ECs were unable to cover even their operating costs. Policy Area 2: Strengthening Institutional Development and Service Delivery
14. The steps to strengthen sector finances will need to be complemented by policy actions to reform the EC sector and, critically, complete some of the EPIRA-initiated reforms. The Government needs to stress the importance for ERC and technical competence, procedural efficiency, and transparency. In parallel, policy actions are needed to advance the institutional development of ECs, NPC-SPUG, the transmission concessionaire, and the market operator. Action 2.1 Develop options for expanding competition to the retail level 15. The competitive market in Luzon – the Wholesale Electricity Spot Market, or WESM – has evolved more slowly than expected in EPIRA due to delays in privatization and lack of credit worthy off-takers. There is one dominant player (MERALCO, the biggest utility in the
PHILIPPINES Discussion Note No. 7: Energy June 2011
DN 7-6
Philippines and responsible for service in Manila). After two years of operation, only eight Distribution Utilities (DUs)/ECs registered as WESM participants as others could not provide the required credit cover or had not implemented the required communication systems to comply with requirements for market participation. This underscores the challenge of distribution-level reform in the Philippines. The vision under EPIRA is to expand competition to the retail level – meaning that businesses and eventually households could choose their supplier of generation – but transition to this full, “open access” regime has been delayed. The action for Government related to WESM is to realize the vision of EPIRA of an independent market operator. Options for achieving this need to be developed. Action 2.2 Reduce transmission constraints in Luzon to enable network integration 16. Policy guidelines from DOE need to empower ERC to issue a clear set of implementing rules and regulations consistent with development of a network that enables effective market competition, reliability for generators (including renewables), and cost-effectiveness for customers. The immediate priority needs to be on reducing transmission constraints in Luzon so that price differentials within WESM are reduced, and on fully integrating the Visayas with the Luzon system, enabling integration of the two power markets (which then sets the stage for the planned undersea cable linking Visayas and Mindanao). Policy Area 3: Ensuring Energy Security
17. If Government financial liabilities can be managed successfully, while in parallel the service providers improve their operational and financial performance, the foundation will be there for attracting investment and ensuring the timely commissioning of new power generation capacity. However, developing an optimal mix of generation resources requires additional policy steps to implement the Renewable Energy Act 2008, and to develop a strategy to increase access to natural gas, so that the Philippines lessens its dependence on coal-fired generation to meet incremental demand. Such a strategy will require the Government to take a medium-term, strategic view of evolving global energy markets. Opportunities to build better linkages, whether for financing, technology, or fuel (especially natural gas), could help the Philippines achieve new levels of efficiency that could insulate consumers from big price hikes in the future.
Note prepared by: Alan Townsend (EASIN) and Victor Dato (EASPS) The World Bank
PHILIPPINES Discussion Note No. 7: Energy June 2011
DN 7-7
Annex – Power Sector Overview This section provides some additional background information on the power sector. The Philippine power sector has installed capacity of about 16,000 megawatts. Coal, hydro, and oil-based power account for 69 percent of installed capacity. Gas-fired generation, accounting for 18 percent of installed capacity, accounts for 32 percent of gross generation. In terms of total primary energy supply, the Philippines is one of the few countries in the world where renewable energy (RE) accounts for the largest share (43 percent), with very significant contributions from geothermal and hydro. There is also small amount of installed wind power (33MW—the first wind farm in Southeast Asia) that currently provides 40 percent of the power requirements of Ilocos Norte. However, the use of coal is likely to increase quite significantly in the future, as it is the least-cost option at this time: in the base case scenario, about three-quarters of incremental capacity requirements would be met by coal-fired power plants. Installed capacity Installed capacity and gross power generation by
fuel source (in percent)
Grid Installed Capacity
(MW)
Dep. Capacity
(MW)
Peak Demand
(MW)
Luzon 11,907 9,838 6,674
Visayas 1,832 1,494 1,176
Mindanao 1,933 1,682 1,204
Total 15,672 13,014 *9,054
13%
21%
0%
27%
21%18%17%
14%
0%
28%
9%
32%
0%
5%
10%
15%
20%
25%
30%
35%
Geothermal Hydro Wind/Solar Coal Oil based Natural gas
Installed capacity Gross power generation
The market in the Philippines comprises one national transmission company (now operated by a concessionaire, the National Grid Company of the Philippines, or NGPC); 20 urban utilities, mostly investor-owned utilities, but with a handful of municipally owned utilities as well; 119 rural electric cooperatives (ECs); and numerous publicly and privately owned generation companies. Prior to the 1990s, generation was dominated by the National Power Corporation (NPC, or Napocor), which was also the owner/operator of the transmission system. During the 1980s and 1990s, the Philippines experienced a succession of severe power crises, and there were three main policy responses. First, NPC turned to independent power producers (IPPs) for new capacity, with NPC serving in the role of bulk supplier to the country’s distribution companies. The country’s largest urban distributor, Meralco (serving Manila) also was a significant contractor of IPPs. Second, an impetus for reform of key government agencies steadily grew, with a focus on NPC and on the National Electrification Administration (NEA) and the electric coop sector. Third, there was consideration of broad-ranging market and regulatory reform. The key result was the passage of the Electric Power Industry Reform Act (EPIRA) in 2001. This law established the Energy Regulatory Commission (ERC) to deal with economic regulation of the sector, defined new roles for NPC and NEA, established a wholesale power market in the Luzon grid (dubbed WESM, or the Wholesale Electricity Spot Market), created a holding company to hold key government assets and liabilities in the sector (PSALM, the
PHILIPPINES Discussion Note No. 7: Energy June 2011
DN 7-8
Power Sector Asset and Liability Management), and laid out a phased market restructuring and privatization program.91 Nearly a decade on from the passage of EPIRA, there has been some impressive results. ERC is up and running and is becoming a credible and capable regulatory authority in spite of occasional (and mostly unfounded) criticism of the speed with which it operates. ERC has promoted increasing efficiency and quality of service in distribution and transmission through performance-based ratemaking. A private concessionaire is responsible for expansion, maintenance, and operation of the national transmission system; upgrading of the network is underway but some of the projects that should have been funded before the concessionaire took over are still pending. In generation, local companies, backed by local financial institutions, have been enthusiastic purchasers of power plant assets (whether of physical plants, or, through IPP Administrator,92 or IPPA, contracts, the right to plant output) from the Government. WESM started commercial operation in Luzon in 2006. Distribution and generation efficiency has improved. Private sector owners and operators of generation plants, for example, have increased efficiency and reliability, compared with the pre-privatization case. Meanwhile, new opportunities will be forged by the Renewable Energy Act, passed in 2008, which will facilitate development of the market for renewable energy generation. A general principle of the EPIRA is to establish an environment and structure where market forces, freedom to choose and how and from whom to buy and sell, and effective competition set generation prices. Among electricity buyers, EPIRA also calls for improvements in Electric Cooperatives (EC) performance, including rehabilitation and restructuring. The figure below illustrates the remaining areas until EPIRA principles are fully implemented.
91 There are a couple of exceptions to the privatization list, notably a pumped storage facility in Luzon that is under the operational control of the system operator, and NPC-owned hydro in Mindanao; for the Mindanao plants, a careful look at the mode and timing of privatization will be necessary as there is no competition in the Mindanao market as well as other political economy concerns. 92 IPPA’s give the private contracting party the right to output of IPPs that are under contract to NPC. There are two factors that explain the use of this instrument. First, because most IPPs sell their output to NPC, WESM cannot function as a truly competitive market because too much capacity is controlled by NPC/PSALM. The fact that NPC and PSALM are owned by Government explains why it would appear that there has been little evidence of the abuse of market power in a way that would be directly harmful to customers. The other motivating factor is the desire on the part of PSALM to limit financial losses under these contracts (losses which are assured because of WESM and the surplus of generation in the current market).
PHILIPPINES Discussion Note No. 7: Energy June 2011
DN 7-9
H P
H
P
S
D NPC
C S E
O E G
EPIRA
P E T
U C
T S C
C NPC
P NPC
IPPA
T
D EC R
R
WESM
E
S 50%
99
999
9
9
Twelve generation packages have been successfully privatized. Two thermal facilities (Masinloc coal and Panay & Bohol diesel), totaling 2,172MW, were sold for US$2.4 billion or an average of US$1.1-million/MW. Nine hydro packages totaling 656MW captured US $989 million (average of US$1.5-million/MW). One 747 MW geothermal package (Tiwi+ MakBan) went for US$447 million. Non-NPC power plants with power purchase agreements (PPAs) obtained the highest prices; because the Philippines, unlike Indonesia, has honored all of its PPAs, buyers were able to assign good valuations in cases where there were existing contracts. Privatization of generation has increased the reliability and reserve margin in Luzon. New investors have rehabilitated and improved plant reliability and maximum capacity.
Prices paid by the market in sale of generation assets
0.39
0.96
0.27
1.031.18 1.15
1.47 1.55 1.61
2.03
1.31
0.0
0.5
1.0
1.5
2.0
2.5(In US$ million/MW)
DN8-1
��������������������������������������� Transport for growth and integration I
T P ,
S T
MT
A. The Philippines Today: Progress and Challenges 1. The lack of quality transport infrastructure and low level of service negatively affect the investment climate and economic growth in the Philippines. In Metro Manila, available transport capacity is unable to meet increasing demand and hampers the movement of people, goods and services. Some principal corridors already have high capacities but also exceedingly high traffic volumes. Different modes of public transport are characterized by low levels of service to commuters in terms of travel time, safety and convenience, and ease of transfers. The Light Rail Transport (LRT) network provides reliable mass transport service, but Mass Rail Transit (MRT) Line 3 and LRT Line 1 will need investments for the upkeep of rolling stock and additional capacity to match ridership. Airport and port-related passenger and cargo movements compete with typical urban traffic for limited road space. Restrictions on vehicle usage and trucks are in place, but their effectiveness will deteriorate as motorization rates continue to grow. Economic losses due to congestion in Metro Manila alone have been estimated to be around P100 billion a year in 1996 prices, or 4.6 percent of GDP. In other urban areas, congestion problems may be less severe compared to Metro Manila but rank among the most critical concerns of the residents. Population growth and motorization rates in these areas are now higher than in Metro Manila, and urban transport demand will continue to increase as the Philippines becomes one of the most urbanized countries in the region. 2. The quality of the national road network managed by the Department of Public Works and Highways (DPWH) has not significantly improved. The percentage of roads in good or fair condition was 53 percent in 2007, even as the coverage of paved roads reached 72 percent. Based on current inventory, it is estimated that only 20 percent of local roads (64 percent of provincial and 53 percent of city roads) are in good or fair condition. The technical and financial capacity of Local Government Units (LGUs) to manage local roads is generally inadequate. As a result, conversion of local roads to national roads by legislation has been commonly pursued as a way of obtaining access to DPWH’s annual budget for maintenance. Without a stable classification of roads on the basis of their functional role in the network,
PHILIPPINES Discussion Note No.8: Transport June 2011
DN8-2
there will be less predictability in the planning and budgeting process for national and local roads. Another area that deserves attention is transport safety. Table 1: Road Quality Percentage of national roads in good and fair condition Cumulative Annual Growth Rate
Sources: World Bank Infrastructure Database, and the Department of Public Works and Highways 2009. 3. The development of nautical highways demonstrates the potential of intermodal integration to improve inter-island connectivity. Roll-on-roll-off (RORO)-enabled ports and new RORO ferry routes augmented the capacity of the existing port infrastructure to carry traffic, and were aimed at providing an alternative to longer-distance inter-island shipping. According to the Philippine Ports Authority (PPA), 65 out of more than 100 government ports can already accommodate RORO vessels; these are complemented by 24 private RORO-enabled ports. 4. Total infrastructure investments declined in the Philippines between 1997 and 2006, following significant increases between 1985 and 1996. In real terms (2006 prices) the level of total public infrastructure expenditures rose from 59 billion pesos in 1985 to 363 billion pesos in 1998. In 2006, the level had fallen to approximately 186 billion pesos. Transportation infrastructure followed the general trend for infrastructure starting at 24.5 billion pesos in 1985 peaking at 97 Billion pesos in 1997 and falling to 66.4 billion pesos in 2006. (World Bank, Public Expenditure Review, 2009). Since 2007 the budgets for DPWH and the Department of Transport and Highways (DOTC) have increased remarkably. In 2010, DPWH and DOTC have a combined budget of P142 billion, which could have a significant impact if used effectively. 5. There is considerable potential for further improvements in the transport sector.The Philippines is ranked 94th out of 134 countries on overall quality of infrastructure surveyed in the Global Competitiveness Report 2008-09. The Philippines ranked 94h for roads, 85th for railroads, 100th for port infrastructure and 89th for airports. For all types of infrastructure, the Philippines consistently falls below the average score for all countries surveyed. Key Challenges 6. With an archipelagic setting, an increasingly urban population, an unstable pattern of investment levels, and a weak governance and accountability framework,
PHILIPPINES Discussion Note No.8: Transport June 2011
DN8-3
there are significant challenges for the transport sector. While the transport infrastructure has been developed and has been spread out across the country (more than 200,000 km of roads, 515 public and private ports , and 215 public and private airports), the level of service has not been good for lack of sustainable financing. With rapid urbanization (by 2030 77 percent of the population is expected to be living in urban areas), the urban transport infrastructure has been put under tremendous pressure and urban mobility has severely deteriorated. 7. Governance in the transport sector has been a persistent issue. At the agency level, the high-risk areas are commonly known: procurement, financial management, and implementation of quality control. Lack of technical capacity in planning, intermodal integration, project appraisal, and monitoring are also weak points. The transport projects included in the national budget need to be validated in terms of their contribution to the country’s development strategy. Moreover, when the identification of these projects is done in a politicized, non-transparent manner, the integrity of the procurement, design, and implementation processes suffers. 8. The role of the private sector in the competitive provision of transport services can be enhanced significantly. While the BOT (Build-Operate-Transfer) Law has been in place since 1990, only a handful of projects have been pursued under the open, competitive bidding process. The more common mode has been through unsolicited proposals or joint ventures by government corporations with mandates for infrastructure development. This has resulted largely from the failure to invest in adequate project preparation. This refers to the selection of priority projects, carrying out feasibility studies, and preparation of bidding documents as the key pre-requisites for an open, competitive bidding process. 9. Institutional coordination in the sector is weak. The DPWH and DOTC are the principal agencies responsible for the delivery of infrastructure, but there are many other players involved in the sector such as the Philippine Ports Authority (PPA), Civil Aviation Authority of the Philippines (CAAP), Toll Regulatory Board (TRB), and Light Rail Transit Authority (LRTA). Coordination among transport agencies is lacking, and more so with economic sector agencies. The linkage of transport infrastructure at the planning level with potential growth sectors such as manufacturing, tourism, agriculture, etc. is not subjected to an active consultative process. The linkage between DPWH/DOTC agency plans and regional development plans is also generally weak. Proposed reforms involving institutional arrangements on separating regulatory powers and operations in the ports, airports, rail, and airports sub-sectors have not progressed despite being recommended in past medium-term plans. B. Where the Philippines Could Be: Policy Options/Strategic Priorities Table 2: Philippines: Policy Areas and Actions Policy Area 1: Improving the Quality and Level of Services
Action 1.1 Use the proposed Strategic National Transport Network as focal point Action 1.2 Rebalance Manila-Batangas-Subic ports cargo traffic Action 1.3 Formulate strategy for international gateway development
PHILIPPINES Discussion Note No.8: Transport June 2011
DN8-4
Action 1.4 Adopt NESTS recommendations to reduce urban bottlenecks Policy Area 2: Improving Sector Resource Allocation
Action 2.1 Use the annual DPWH/DOTC budgets to implement policies Action 2.2 Prioritize a short list of key transport sector projects Action 2.3 Build LGU capacity to deal with urban transport development issues Action 2.4 Complete inventory of local roads and develop strategy
Policy Area 3: Strengthening Sector Governance and Accountability Action 3.1 Sustain reforms in procurement, financial management, and implementation quality Action 3.2 Create a separate policy making and regulatory body for ports
Policy Area 4: Increasing Private Sector Participation Action 4.1 Undertake a participatory and transparent process for PPP projects
Policy Area 1: Improving the Quality and Level of Services
10. Transport sector policies need to focus on improving infrastructure quality and service delivery. While the quantity of transport infrastructure in the Philippines in network and facility density compares well with other countries in the region, the quality of service often does not. Improving and sustaining the quality of roads, airports, and ports, is most effectively achieved jointly as an intermodal network.
Action 1.1 Use the proposed Strategic National Transport Network as focal point 11. As in most other countries, roads dominate all modes of transport in terms of shares in passenger and cargo traffic in the Philippines (Figure 1). For cargo traffic, water transport closely follows roads transport. Given that the road and water transport modes carry practically 100 percent of passengers and cargo, a focus on improving the quality and levels of these two transportation modes would have a very high impact. This is best done through an efficient modal and intermodal policy, planning and operations effort. For national roads, DPWH is the focal point in this effort. For local roads and urban transport, various institutions at the local (LGU) and national (DPWH/DOTC/DILG) levels are involved, so good coordination is important.
PHILIPPINES Discussion Note No.8: Transport June 2011
DN8-5
Figure 5: Transportation Modal Split in the Philippines �
Source: National Land Transport Policy Framework and Strategies, June 2008 (a working paper for the conduct of the AusAID-assisted Developing a Methodology and Framework for National Transport Policy and Planning) 12. The Draft National Transport Plan (DOTC-DPWH-NEDA-Ausaid-PEGR study) envisions a Strategic National Transport Network that supports major economic activities in the country. This Plan should serve to guide transport sector planning in an intermodal context. The main elements of the strategic network envisioned in this Plan are the following:
• National Road Network - This network consists of the north-south road backbone, east-west laterals, and other roads of strategic national importance, which interlink regional and provincial capitals, growth centers, and defined principal ports and airports of the country.
• National Port Network - This national port system comprises the base ports and terminal ports under the jurisdiction of PPA and CPA, and the ports directly managed by special economic zone authorities, notably Subic Port and the Mindanao International Container Port.
• National Airport Network - The national airport system consist of the international airports under the special airport authorities (Manila, Mactan-Cebu, Subic and Clark) and the national airports in the current airport classification, except the 40 community airports.
• National Railway Network - This railway links the existing operational and rehabilitated/improved lines using the Philippine National Railways right-of-way, including the Northrail system.
• Road RORO Terminal System - This intermodal transport network includes the identified Western, Central and Eastern Nautical Highways.
• Urban Transport Networks in Metropolitan Areas - These networks involve the road, mass transit systems and public transport terminals in Metro Manila, Metro Cebu and Metro Davao.
PHILIPPINES Discussion Note No.8: Transport June 2011
DN8-6
13. The Joint Chambers of Commerce reported that in 2009, around 60 percent of the international shipment volume that entered the Philippines was handled in Manila (i.e., South Harbor and Manila International Container Terminal), while Batangas and Subic ports handled a small volume and were underutilized. Two factors that need to be reviewed are the existence of long-term concession contracts between private port operators and the Philippine Ports Authority (PPA), and the possible financial threat posed to PPA if traffic is diverted away from the Manila ports. (Subic port is not under PPA, but under the Subic Bay Metropolitan Authority, SBMA.) . This also highlights the need to designate a focal transport agency to coordinate inter-agency and inter-regional decisions that are important for overall transport sector development. Action 1.3 Formulate a strategy for international gateway development 14. While the share of air transport in passenger and cargo movement nationwide is less than 1 percent, it has a significant role in the country’s international connectivity. Visitor arrivals grew at an average annual rate of 13 percent from 1.9 million in 2003 to 3 million in 2007, and the number of oversees workers (OFWs) grew at an average annual rate of 10 percent from 1.03 million in 2001 to 2 million in 2008. Serious capacity constraints at the Ninoy Aquino International Airport (NAIA) are foreseen and a combined strategy for an alternative gateway and NAIA should be formulated soon. Preparations are underway for the development of Diosdado Macapagal International Airport (DMIA) as international gateway and will need to be closely coordinated with plans for NAIA. It will be important as well to ensure that plans be made for a DMIA airport link to Manila, whether express rail or highway. As in the case of Manila-Subic-Batangas ports, this issue highlights the important role for a focal transport agency to coordinate inter-agency issues. Current efforts in meeting safety standards should be continued and supplemented. Action 1.4 Adopt NESTS recommendations to reduce urban transport bottlenecks 15. The rapid increase in urbanization in the Philippines requires a responsive urban transport strategy. If land use and urban transport issues are not managed properly, the quality of life in these urban areas will deteriorate. The National Environmentally Sustainable Transport Strategy (NESTS) provides recommendations for national agencies and LGUs on how to deal with urban transport bottlenecks, ranging from non-motorized transport to capacity improvements and transport demand management. Policy Area 2: Improving Sector Resource Allocation
16. The processes for allocating public resources need to be improved. Planning and budget processes and project preparation need to ensure that expenditures are focused on areas that offer the highest returns. The government has taken important initiatives to achieve this, but much remains to be done. The quality of multiyear planning and the quality of project preparation and selection in the annual budgetary process following stakeholder consultations can all be significantly improved—independent of whether projects are funded by the government, international financial institutions, or the private sector.
PHILIPPINES Discussion Note No.8: Transport June 2011
DN8-7
Action 2.1 Use the annual DPWH/DOTC budgets to implement policies 17. In the short term, the annual budget of DPWH and DOTC/PPA can serve as the principal instrument to influence policies, programs and projects in the transport sector. Greater involvement from oversight and economic sector agencies is necessary to ensure that the transport budget supports broader economic objectives as the investment plans are prepared by DPWH/DOTC and taken through the Congressional budgeting process. A more broad-based consultation on new major capital investments needs to be institutionalized, with the participation of transport professionals, the business sector, academe, etc. This can serve as a starting point for introducing greater transparency in the sector, extending through the cycle of planning, programming, budgeting, procurement and project implementation. Action 2.2 Prioritize a short list of key transport sector projects 18. The government has a long list of infrastructure projects, including many transport projects, under the Comprehensive and Integrated Infrastructure Program (CIIP), but this is not a prioritized list that can be readily translated into an investment program. A consultative prioritization process is needed to select a shorter list of projects that will be supportive of urban and other sector development agenda, and can be supported by the DPWH/DOTC budgets. Budget for project preparation has been limited in the past and ensuring that there will be enough budget is necessary for taking forward any major capital investments. The government needs studies to identify the high priority projects based on technical and socio-economic analyses. Action 2.3 Build LGU capacity to deal with urban transport development issues 19. Only a few comprehensive urban transport studies have been undertaken for cities, for example, transport studies for Metro Manila93, Metro Cebu94, and Davao City95. The Local Government Code of 1991 gives the LGUs primary responsibility over urban planning and management. However, urban transport planning has not been given due attention in the existing Housing and Land Use Regulatory Board guidelines and standards being used by the LGUs.96 Thus, capacity-building on urban transport development for local governments must start by including urban transport in planning guidelines and finding mechanisms for coordinating distinct urban plans. Financial assistance for transport infrastructure managed by LGUs that can be found in the budgets of DPWH and DOTC could be rationalized to support a more strategic program for urban transport and improving access in the rural areas. Active consultation between the Executive and Legislative will be important in this regard.
Action 2.4 Complete inventory of local roads and develop strategy
93 1999 Metro Manila Urban Transportation Integration Study (MMUTIS), among others. 94 1981 Metro Cebu Land Use and Transport Study 95 1983 Davao City Urban Transport Cum Land Use Study 96 Tiglao, N., June 2009, Urban Transport Development in the Philippines-Draft Final Report to the World Bank
PHILIPPINES Discussion Note No.8: Transport June 2011
DN8-8
20. A strategy for local/rural roads development is important with respect to improving the integration between leading and lagging regions/sectors, not only for providing access but also for connecting small farms and production units to the supply chains. A 2007 International Labour Organization (ILO) report roughly estimated that as much as half of the barangays (villages) in the country lack all-weather roads, and about half of the existing barangay rural roads are in such poor condition that they cannot be maintained any longer.97 It will be important to complete first the current inventory of local (barangay) roads, in order that a long-term strategy can be determined. Such a strategy may need to allow for national agencies to provide support to the development of local roads, especially barangay roads, given the evident lack of resources at the local level. Policy Area 3: Strengthening Sector Governance and Accountability
21. Higher public spending on transport infrastructure will require an effective governance and accountability framework for the sector. Such a framework should start in national budgeting and planning processes and extend through project preparation, procurement, and project implementation. . Action 3.1 Sustain reforms in procurement, financial management, and implementation quality 22. Reforms in procurement, financial management and implementation quality have been initiated and need to be sustained. Greater transparency through public disclosure of important documents such as agency budgets, expenditure and accomplishment reports will be important. Sector performance assessments by a third party, such as that initiated by RoadWatch in the roads sector, would be helpful. A specific area where serious governance questions have been raised is the Motor Vehicle User’s Charge (MVUC) introduced in 2001. It provides allotments for maintenance of national roads through the Special Road Support Fund, managed by the Roads Board. Total MVUC collections have increased from P3.2 billion in 2001 to P8.6 billion in 2008. However, there has been a tendency to allocate a significant portion (ranging from 25 to 35 percent) of funds for purposes other than preservation of national roads. To improve the effectiveness of the Road Fund for its intended purpose, the Roads Board has to adopt a more objective, needs-based and transparent set of criteria for allocating the Road Fund, based on planning tools/models of DPWH.
97 International Labour Organization, 2007, Rural Road Maintenance: Sustaining the Benefits of Improved Access
PHILIPPINES Discussion Note No.8: Transport June 2011
DN8-9
Box 1: Case for Bundling Contracts A closer look at the number and size of civil works contracts being administered by the DPWH would reveal that there is huge potential for increasing efficiencies in the use of the available budget. About 84 percent of over 12,800 civil works contracts awarded by DPWH in 2008 are small contracts amounting to 10 million pesos or less. A huge volume of small contracts poses serious challenge for quality control in project preparation, procurement and implementation. Consolidating contracts into bigger packages could result not only in greater efficiencies for DPWH operations, but could also help local contractors to increase their construction capacity and experience to allow them to compete in bigger contracts. Potentially, OPRCs for a longer section of roads, or even a small network, offer potential efficiencies in contract management and could increase accountability of a private contractor for a specified section of the network.
Figure 2: Civil Works Contracts Awarded by DPWH in 2008
84%
2%2%3%
10%
less than PHP 10 million
PHP 10 to less than 20 million
PHP 20 to less than 30 million
PHP 30 to less than 40 million
PHP 50 to 500 million or more
Source: Department of Public Works and Highways
23. Other forms of maintenance arrangements that could be explored by DPWH to increase accountability of private contractors and allow effective public monitoring for the roads network include output and performance-based road contracts (OPRCs) for rehabilitating and maintaining long sections of roads, rather than through conventional contracts that are input-based and designed for short sections. OPRCs could cover several years, contain more optimal risk-sharing between government and the private sector, and link the payments to how well the contractor manages to comply with minimum conditions of assets and levels of services that are specified in terms that the public could comprehend. Action 3.2 Create a separate policy making and regulatory body for ports 24. Governance issues in the ports and shipping sectors relate more to institutional arrangements and market structure, respectively. The need to have a separate policy-making and regulatory body independent of the ports operating entity has been recognized in previous medium-term plans. The PPA, by virtue of its charter, issues certificates of registration and permits to operate private ports, and it operates its own ports, some of which compete with private ports. It has been noted also that the quality and productivity at PPA-owned ports is low because the players do not have the right incentives; cargo handlers have monopoly rights and do not invest in equipment, while the PPA gets a share of cargo-handling revenues.
PHILIPPINES Discussion Note No.8: Transport June 2011
DN8-10
While port charges may be comparatively low, cargo handling costs are high—ranging from 29 percent to 46 percent of total sea transport cost for cargoes and from 10 percent to 43 percent for containerized cargoes.98 In domestic shipping, a 2004 study of the industry concluded that the industry is highly concentrated, in that the top five operators accounted for more than 90 percent of the passenger and freight volumes. Together with domestic inter-island shipping rates, the impact of port charges and cargo-handling costs on freight movement need to be analyzed because they contribute to the final cost of goods and services as they are transported throughout the archipelago. (AusAID-PEGR) Policy Area 4: Increasing Private Sector Participation
25. The private sector needs to be encouraged to continue its important role in transport infrastructure investment. Public resources alone will not be sufficient to meet the financing needs to raise the quality of infrastructure. Learning from the lessons of the past, better structured Public Private Partnership (PPP) projects need to be developed that will result in optimal risk allocation between the government and the private sector, and these projects should be brought to the market through a competitive process. Procedures need to be streamlined for the PPP approval process, while appropriate checks and balances for project review are retained. Contingent costs of public-private partnerships need careful analysis beforehand, which will require criteria for assessing public contributions. Action 4.1 Undertake a participatory and transparent process for PPP projects 26. Two critical factors in pursuing a PPP agenda are policy dialogue/resolution and project preparation. At the policy level, it is important for the government to have a forum for involving key stakeholders in resolving policy issues with implementing agencies and interested private sector investors. Typically, the issues involved in PPP projects cut across a number of government agencies—including oversight, regulating, and implementing agencies—and it will facilitate project development if such a forum is in place to allow discussion and resolution of various issues between the private sector and the government. Another important factor in developing a PPP program is the presence of quality feasibility studies for projects that can be used as the basis for a competitive solicitation process. The government needs to regularly include a budget for the preparation of such studies in the DPWH and DOTC programs.
Note prepared by: Victor Dato, Baher El-Hifnawi, Ben Gericke, Nora Moreno, and Adora Navarro (consultant) The World Bank
98 Kellogg Brown & Root Pty., Ltd. in association with Transport & Traffic Planners, Inc., December 2009, Draft National Transport Plan, for the Partnership for Economic Governance and Reforms (PEGR) Reform Agenda RA 008-02: Formulating a National Transport Plan
PHILIPPINES Discussion Note No.8: Transport June 2011
DN8-11
DN9-1
������������������������������������������������������������������������ ���ICT support for innovation investment and quality services
I C T ICTP GDP D ICT
CI
LGU WI
T ICT K
IT
A. The Philippines Today: Progress and Challenges 1. Information and Communications Technology (ICT) contributes substantially to the economy and society in the Philippines today. ICT goods exports account for about 30 percent of total exports (World Bank, 2007), while ICT service exports (7 percent of total service exports) exceed the average for the region. Total value-added from the telecommunications sector contributes over 4 percent of GDP. The IT-enabled services industry (particularly business process outsourcing) alone employs over 400,000 people directly, thousands more indirectly, and contributed about 4 percent to GDP in 2008. The dynamic mobile market has also created incentives for several telecommunications operators to develop value-added features such as mobile phone-enabled financial services. 2. Access to telecommunications is almost universal, with 99 percent of the Philippine population within range of mobile phone networks. The majority of Filipinos now have access to basic telephony, the result of substantial private investments in telecommunications infrastructure over the past decade. The Philippines has one of the East Asia & Pacific region’s highest mobile phone penetration rates and one of the highest rates of text messaging (SMS) usage worldwide. As of 2008, there were 68 million mobile phone subscribers, representing 76 percent of the population.99 All but 1 percent of the population lives within range of a mobile signal. There are about 3.6 million fixed lines in service (out of 7 million installed lines; the difference in utilization is in part due to the lower cost of mobile service and the relatively higher cost of fixed line maintenance).
99 Source: International Telecommunications Union (ITU), 2008. Some market intelligence reports quote 76 million mobile subscribers.
PHILIPPINES Discussion Note No.9: Information and Communications Technology June 2011
DN9-2
Figure 1: Internet users and broadband subscribers per 100 people (2008)
Source: International Telecommunication Union, 2008
3. Access to Internet is limited. Overall, there are about 6 million Internet users, 400 licensed Internet Service Providers (ISPs), and 40,000 registered Internet cafes.100 However, Internet penetration is generally low in comparison with regional neighbors (Figure 1). Broadband penetration outside Metro Manila and Metro Cebu remains low. The number of broadband subscribers, using various access technologies, but primarily mobile, is currently around 2.2 million, or about 2.4 percent of the population (Table 1). This is attributable to infrastructure limitations and the total cost of ownership. The same factors also limit the quality of Internet service; i.e., connection speeds and reliability of service. Table 1: Broadband Internet subscribers and operator market shares (2009)
Operator Mobile broadband subs (3G,
3.5 G, HSPA)
Fixed/Wireless
broadband
Fixed broadband
(DSL)
Total
Smart/ PLDT
~ 1 million ~600,000 ~200,000 1.8
million Sun Cell (Digitel)
~20,000 plus 20,000
Bayantel ~85,000 85,000
Globe 97,000 34,000 159,000 290,000
Total 1.1 million 634,000 444,000
~2.2 million
Source: Interviews with operators, May 2009
Broadband Internet market shares
PLDT S
G
D
B
Sources: Interviews with operators, Industry reports, May 2009
100 Internet user data provided by ITU (2008). Some market research indicates up to 24 million Internet users, including visitors to Internet cafes, public employees etc. The Internet subscriber data are usually considered more reliable since they are more readily measured.
PHILIPPINES Discussion Note No.9: Information and Communications Technology June 2011
DN9-3
4. The infrastructure required to expand Internet use includes both “backbone” (transmission) networks and local “access” networks to reach consumers.101 Fiber-optic backbone, offering the fastest transmission speeds, is largely available in all significantly-sized cities and municipalities along the developed transmission routes (Figure 2). However, 17 provinces have no fiber-optic backbone networks, and rely on either satellite or microwave (both lower capacity) transmission. In areas not served by fiber, mostly in central and southern regions of the country, the cost of access is relatively high, and the available bandwidth is much more limited. Fixed or mobile broadband access networks are available in at least 761 cities and municipalities nationwide (about half). However, the geographical reach of these networks is limited102. New wireless technologies provide capacity for more extensive coverage; obligations and incentives will be required for services providers to deploy these more widely.
Figure 2: Fiber-optic backbone; by province (2009)
Provinces with Fibre-Optic Transmission Infrastructure
None At least one operator
2 or more operators
17 63 38
21% 79% 48%
5. Other constraints to more widespread Internet use in the Philippines are limited electricity access and the relatively high total cost of ownership (computers, Internet subscription), especially for lower-income households. Even the lowest-cost “start-up” package (including basic laptop, plus pre- or post-paid Internet subscription) is around US$300 (as of end-2009), equivalent to 85 percent of average monthly household income103.A typical post-paid broadband Internet subscription (up to 2 Mbps) ranges from US$19-40 per
101 Delivering broadband Internet (or any telecom service) requires “backbone” or transmission, and access networks. The telecommunications industry is investing in both. For example, the Philippines is one of the few countries in the world with a competitive backbone or transmission network (PLDT and Bayantel have national fiber broadband networks, and Digitel has a fiber network in Luzon). But there is a need to encourage and incentivize fiber rollout to the uncovered provinces, and municipalities/LGUs. 102 See World Bank Policy Options for ICT Universal Service, 2010 103 Source: Family Income Survey, National Statistics Office, 2006
PHILIPPINES Discussion Note No.9: Information and Communications Technology June 2011
DN9-4
month, also as of end-2009. Pre-paid pricing may be lower or higher, depending on volume and/or time restrictions.104
6. The existing level of backbone/broadband infrastructure, though increasing, is insufficient to meet the fast-growing demand from commercial and institutional users, including government. One analysis of the trends in demand for bandwidth in the Philippines projects that demand will treble from 55,932 Mbps in 2008 to 156,669 Mbps in 2010 (Telegeography). The World Bank (2010) has recently attempted to quantify and project the volume of demand from the public sector, in particular from health and education institutions, concluding that these sectors alone could account for 16 percent of total bandwidth demand in the country (25,000 Mbps)105. Major potential sources of demand include projects/programs such as public expenditure management projects, Internet access for high schools (and prospectively other schools also), a variety of new E-Government services at the national and LGU level, applications such as ‘telehealth’, and agricultural information systems. 7. Limited access to broadband Internet has adversely impacted the country’s “e-readiness” rankings (Figure 3).106 The Philippines scored well in the early 2000s, due to effects of liberalization in the 1990’s, and the influx of new competitors which encouraged innovation – e.g., m-banking. However, scores steadily deteriorated between 2004 and 2008, largely due to low broadband and internet access figures which are increasingly important determinants of e-readiness. A side-effect is low computer penetration scores, as indicated above (7.5 percent). This shortcoming, in turn, is bound to influence the country’s competitiveness in attracting investors and as a production platform.
Figure 3
Source: Economist Intelligence Unit, 2008. Notes: a total of 70 countries are ranked. A lower rank indicates a higher degree of e-readiness. 8. ICT is becoming essential for the effective functioning of the Philippine government at all levels: for information management within and among individual
104 Internet access pricing is somewhat complex: available options include pre- or post-paid service; unlimited/limited downloads; typical residential speeds offered may be “up to” 2 Mbps and are theoretical, depending on the number of users, developments in the network etc. 105 World Bank Policy Options for ICT Universal Service, 2010 106 Components of e-readiness include countries’ ICT infrastructure access & environment, investment policy, and socio-economic factors related to Internet usage – critical factors for the information economy.
PHILIPPINES Discussion Note No.9: Information and Communications Technology June 2011
DN9-5
agencies, for communications between national and regional offices, and for service delivery to the public. Government departments and agencies in the Philippines are significant ICT users, not only of “connectivity” but also of computerized information systems. There has been a proliferation of IT projects and databases at different levels of governments to support improved information management and service delivery, including “e-Services or “E-Government”. These IT projects have been funded by a combination of budget appropriations, CICT (Commission on ICT) E -Government funds, Department of Science and Technology Funds, development partners and, in some cases, private sector or foundation contributions. 107 Such projects represent a substantial commitment of financial and human resources to start-up and to operating costs. The quality, effectiveness and sustainability of these projects vary considerably, however. 9. One reason for the uneven quality and effectiveness of ICT projects is that responsibilities for ICT planning, budgeting, monitoring and evaluation have been unclear and fragmented in practice.108 Responsibility for ICT policy has been assigned to high-level institutions, such as the National Computer Centre (NCC) and, more recently, to the CICT under the Office of the President (Annex I). However, even though ICT has long been identified as important for the country’s socio-economic development, these institutions are not fully prepared to carry out their policy development role and timely policy implementation. As noted in Table 2, ICT projects in the Philippine public sector are often characterized by a multiplicity of overlapping initiatives, lack of common policy framework, inadequate budgeting and insufficient attention to information security – contrary to best practice models.
Table 2: ICT in Government Approaches
Best Practice Actual Practice in the Philippines • Strategic planning and budgeting for
investments, maintenance, and scalability • Common approaches across government to
enterprise architecture, interoperability • Chief Information officer position in place,
and functioning • Information security accorded high priority
• Multiple initiatives, often in same department, in some cases driven by donors, vendors
• Lack of common policies, standards
• Complex and often inadequate budgets, esp. for Operations and &Maintenance
• Insufficient attention to information security, disaster recovery, etc.
10. The legal framework for E-Services or E-Government is partially developed, but other important legislation is still pending. The E-Commerce law enacted in 2000 provides the basis for electronic transactions. However, additional legislation that would contribute to
107 For a partial list of projects see National Computer Centre http://www.ncc.gov.ph/default.php?a1=16&a2=4.Further information on specific departmental projects is available on their websites. 108 One of the issues is the status of the CICT and its conversion into a Department, the DICT. As CICT had been established by an Executive Order (EO), its status is less secure, and could more easily be revoked, compared to the status of a Government department. The pending DICT bill (Senate Bill 920) may be enacted in 2010. However, the concept of a DICT has been around since 2001 and the establishment of the CICT in 2004 was seen as an interim step to a DICT. As a result there is still uncertainty and overlap between the roles and responsibilities of the following institutions, for example: CICT, DOST, DOTC, NTC, Telof and NCC.
PHILIPPINES Discussion Note No.9: Information and Communications Technology June 2011
DN9-6
a more robust environment is still pending: this includes the Convergence Bill, the revision of the public telecommunications policy Act, the E-Government Bill, the Privacy and Data Protection Act, the Cybercrime Bill, and the Freedom of Information Bill. 11. While several government departments are positioning themselves to provide “E-Government” services,109 a number of important Government ICT or E-Government programs have yet to be fully launched. Key programs that remain to be launched include the introduction of government-wide financial management information systems, integrated education information systems, integrated health information systems, and nation-wide social protection systems. Such programs require extensive institutional change management, technical support, communications management, and excellent coordination among various institutions. The main constraints to launching these programs include inadequate ICT infrastructure, insufficient availability of skills, insufficient attention to change management, and institutional resistance. Other risk factors include lack of attention to systems integration, inter-operability, and handling of sensitive data.
Box 1. Unified Multipurpose ID Card
One ‘flaghip’ project under development is the proposed unified multipurpose identification (UMID) card, intended to support delivery of social services. This requires coordination among several participating institutions (Social Security, Philhealth, government Service Insurance System) and the Commission on ICT. A representative technical working group has been established, and the program has been launched with the procurement of “smart” ID cards. However, a great deal of work will be needed to develop the necessary “back-end” information management processes, including how to handle data managed by different participating agencies, in addition to actual content development. Also, more work is needed to develop robust processes and procedures for information security and disaster recovery.
12. The growth of IT-enabled services (ITES) has been significant. What is commonly described as the “IT industry” may cover activities ranging from hardware (e.g., microchip) manufacturing, computer servicing to internet cafes, plus a host of new types of “IT-enabled services” that have grown up as a result of increased availability of IT infrastructure. The Philippines is a world leader in growth of IT-enabled services, in particular business process outsourcing (BPO). The sector includes call or contact centers (voice services), back office processing, software development, architecture & engineering, animation, transcription services, and games development. The industry association (BPAP) lists over 800 companies, 80 percent of which are in Metro Manila. The remaining 20 percent are located in other major cities such as Bacolod City and Cebu City. The industry generated US$6.1 billion in revenues in 2008 (4 percent of GDP), and expected to grow a further 10-20 percent in 2009. The industry plans to move higher up the service “value chain” and increase the proportion of more advanced services such as back-office (corporate) services, and IT outsourcing and engineering/design process delivery. The industry expects to add a further 100,000 jobs and expand into “new wave” cities, subject to general investment climate factors and, particularly, availability of tele-communications infrastructure and labor. While
109 “E-Government” may be defined as the use of ICT to improve the range and quality of public services available to businesses and citizens, and to make government more efficient, transparent and accountable.
PHILIPPINES Discussion Note No.9: Information and Communications Technology June 2011
DN9-7
growth in this sector has been vibrant, the main constraint to expanding toward more advanced and higher-value services is cited as the shortage of skilled labor. B. Where the Philippines Could Be: Policy Options
13. The Philippines is in a position to develop its ICT potential much further.Developing this potential would enhance the Philippines’ competitiveness, provide additional income-generating opportunities (particularly in rural areas), and improve public service delivery around the country. This requires more equitable and affordable access to high-speed, or broadband, Internet, especially at the LGU level. While investments are expected to come primarily from the private sector, the government can facilitate further development of broadband Internet into rural areas through a combination of regulatory incentives to increase competition in service provision (such as reforms in the spectrum and licensing regime, promotion of passive infrastructure-sharing and open access), a competitive capital subsidy mechanism for network development and public access facilities in commercially less viable areas. The government also can stimulate increased investment in more remote areas where there are few high-volume institutional users through its own use of ICT – e.g., through the schools Internet program, the LGU portals and assorted online services provided by various Departments. To achieve these outcomes, it will be critical in take actions designed to clarify leadership responsibilities for ICT development, improve access to broadband Internet and address the countries. These actions are discussed next.
Table 3: Philippines: Summary of Key Policy Actions Policy Area 1: Establishing Clear Responsibility for ICT Leadership
Action 1.1 Assign clear and accountable leadership for Government-ICT/E-Government Policy Area 2: Improving Access to Broadband Internet
Action 2.1 Promote more open and competitive markets for ICT Action 2.2 Consider partially financing ICT infrastructure through “smart subsidies” Action 2.3 Consider programs to provide low-cost PCs Action 2.4 Leverage the government’s role as a major user of broadband Internet
Policy Area 3: Addressing ICT Skills Shortages Action 3.1 Support fast-track skills development programs in partnership with the private sector.
Policy Area 1: Establishing Clear Responsibility for ICT Leadership
14. As a first step, developing a more effective governance and institutional framework for Government ICT to support the country’s objectives would entail the establishment of an adequately-resourced Department,110 backed by an inter-departmental steering committee or advisory council. Institutions with explicit responsibility and resources for ICT leadership have been established throughout the region, including in Malaysia, Singapore, Thailand, and Vietnam. Such an institution would need to have clear accountabilities in the following areas:
• E-Government/e-services strategy and policy,
110 Some countries have established ICT Departments; other have assigned ICT Governance to an existing central department such as ministry of finance or treasury or public administration. The key issue is that ICT is regarded as integral to the functions of modern Governments and managed accordingly.
PHILIPPINES Discussion Note No.9: Information and Communications Technology June 2011
DN9-8
• governance and coordination in regard to the development of standard information infrastructure, shared networks, common business processes, and one-stop service delivery centers,
• formulation of legislation and regulations, • prioritization and allocation of resources for e-services infrastructure and services, • provision of technical guidance to other departments, and • ICT investment monitoring and evaluation.
Action 1.1 Assign clear and accountable leadership for Government ICT/E-Government 15. In view of the complexity of Government ICT or E-Government, and the risky nature of ICT investments, including a high rate of project failure worldwide, clear and accountable leadership in this area is very important to deliver good results. Measures that the government could consider include the following: • Assigning explicit management responsibilities for Government ICT/E-Government to a
single (existing or new) Department, with a mandate, staffing and budget for strategy and policy, governance and coordination, and implementation facilitation. Several institutional models are available.111
• Developing standard government information infrastructure, including shared networks, data centers, common business processes, and one-step service delivery centers.
• Integrating IT planning into regular planning and budgeting processes, rather than as separate/one-time projects.
• Developing monitoring and evaluation frameworks to review the progress and impact of what are generally high-cost long-term investments.
Policy Area 2: Improving access to broadband Internet
16. First, more investment is needed, primarily from the private sector. The telecommunications industry is quite profitable (PLDT and Globe had earnings margins of around 60 percent in 2008), but has thus far focused on new service provision in relatively profitable urban areas. Extending service to rural and more remote areas is likely to require a combination of investment incentives and regulatory measures by the government. Action 2.1 Promote more open and competitive markets for ICT 17. On the regulatory side, the government can take a number of measures to promote a more open and competitive market for telecommunications, particularly for new broadband services providers. The market is currently quite concentrated. A more competitive market could support additional investments in un-served or under-served areas, and would stimulate more diversification of services and innovation. Policy measures that the
111 For an analysis of institutional and governance issues related to E-Government, see “National E-Government Institutions: Functions, Models and Trends” Ch 6. Extending Reach and Increasing Impact, ICT for Development, World Bank (2009).
PHILIPPINES Discussion Note No.9: Information and Communications Technology June 2011
DN9-9
regulator, the National Telecommunications Commission (NTC), could implement to stimulate new market entry include the following, in line with international best practices: • A more simplified licensing process that assigns responsibility for new licenses to the
telecommunications regulator only, and phases out the requirement for congressional approval.
• Adoption of a unified licensing system in which any telecommunications operator can provide any type of service, including bundling (such a licensing regime is anticipated in the proposed Convergence Bill). Regional licenses could also be considered.
• Review of existing allocations for radio spectrum, in particular, increasing allocations to the operators overall, assigning additional spectrum for wireless broadband 2.5 GHz (LTE, WiMAX). Further roll-out of mobile broadband (3G) would likely be stimulated by allowing the use of 3G in the lower frequency bands (850/900 MHz).
• Adoption of regulations requiring non-discriminatory access to existing fibre-optic infrastructure.
18. Additional regulatory measures include promoting sharing of passive infrastructure among telecommunications operators (e.g., mobile base stations, or towers), and co-location of telecommunications with other infrastructure (e.g., fiber-optic cables along roads, power lines, pipelines). The latter requires coordination among institutions responsible for public works, and the telecommunications industry. Telecommunications infrastructure-sharing among service providers may be encouraged or mandated, based on consultations; the objective is to reduce costs and encourage more widespread network deployment. Action 2.2 Consider partially financing ICT infrastructure through “smart subsidies” 19. The government can partially finance network infrastructure in commercially less attractive areas through “smart-subsidies”; for example, from a universal service fund, or an ICT development fund. Such funds have been established in several countries, typically financed by telecoms industry levy, and/or national budgets, sometimes with development partner contributions. The objective of such “smart subsidies”, subject to competitive tender for the lowest subsidy, is to enable operators to bring potentially loss-making or marginal investments into a normal commercial rate of return. While there are some risks associated with universal service funds (such as non-disbursement, overly complex procedures, non-transparent funds management), they have contributed to increased access to services in many countries. Clarifying the use of such funds is extremely important: for example identifying a pipeline of activities to be funded and an implementation schedule, and reviewing project costs and required contributions on a regular basis, in consultation with the telecommunications industry. Investments that could be supported through capital subsidies from a Philippines Universal Service fund could include, for example: • Fiber-optic connectivity to the 17 un-served provinces: costs, subsidy analysis, organizing
competitive tenders - and beyond, to the municipal/LGU level. • Broadband internet access for 4,700 un-served secondary schools, competitively tendered,
e.g., by region; this could be extended to primary schools later. • Public access facilities in areas unlikely to be served by traditional commercial Internet
cafes in the medium term. As noted, there are already tens of thousands of registered
PHILIPPINES Discussion Note No.9: Information and Communications Technology June 2011
DN9-10
Internet cafes in the Philippines, offering access at around P30-60 per hour in cities, but more in smaller towns. Internet cafes are commercially-driven and tend to be concentrated in larger population centers. Several government agencies (including e-LGU, DOTC, CICT, MCT, and DOST) are currently supporting “tele-centres”, known as “Community E-Centres”. Over one thousand have been set up, of which about 66 percent are currently operating. Some of these are in locations where Internet cafes are already operating. The challenge is to ensure that government-supported centers do not crowd out commercial internet cafes, and are financially and operationally sustainable.
Action 2.3 Consider programs to provide low-cost PCs 20. The government could consider a subsidized loan program for lower-income households to acquire low-cost PCs. Examples of such programs exist in Thailand, Malaysia, Egypt, and Tunisia. The Philippines has already experimented with such programs (i.e., PC ng Bayan, Laptop ng Bayan, Nettop Ng Bayan), but these have targeted government employees. While poor households may have other expenditure priorities, such a program could increase options for income-generation and skills development, particularly for youth. Action 2.4 Leverage the government’s role as a major user of broadband Internet 21. The government itself is a major potential user, or “anchor tenant” of broadband Internet. The proliferation of new information systems, including E-Government programs, can provide a strong incentive for the development of telecommunications infrastructure, provided that it is well coordinated. The education sector is a large potential source of aggregated demand. For example, the Department of Education’s has launched a program to connect all (over 6,500) public secondary schools to the Internet by end-2009 (one third have been connected so far). DepEd intends to provide each school with a P48,000 budget to purchase Internet access locally. However, the projected bandwidth requirement per school is up to 3.5 Mbps (in order to deliver substantial volumes of multimedia educational content) according to DepEd, suggesting that a more aggregated approach (e.g., competitive tenders for service provision to clusters of schools) could be more cost effective. The biggest institutional demand in the medium term could come from the 1,495 LGU offices. While there are existing laws for the LGUs to computerize specific functions by 2010, such as real property tax, business documents, and vital documents, only about a third have so far done so. 22. Public Cost of Improving Internet Access. Annex II presents a possible program of measures to address the key shortcomings that currently limit Internet access in the Philippines. It outlines the recommended sequence of actions and assesses the potential costs of recommendations against their expected impact on broadband expansion: measures that have a low cost but high impact are recommended for implementation first. Proposed measures are sequenced over a three-year period and would have an estimated budgetary cost for the government of approximately US$250-300 million, excluding any resources raised through a possible universal service fund. This represents approximately 0.16 percent of GDP, spread out over three years. The first priority is to improve telecommunications market efficiency through specific regulatory measures and improvements, as this has no high costs associated with it and could be implemented fairly fast. Second, measures that provide
PHILIPPINES Discussion Note No.9: Information and Communications Technology June 2011
DN9-11
incentives and stimulate demand can be put in place, and Government has an important role in this regard. Third, plans and policy measures need to be established for when the market moves closer to commercial maturity, and targeted financial and policy intervention is required to provide broadband services to beyond what the market can achieve. Policy Area 3: Addressing ICT Skills Shortages
23. The Philippines needs more skilled ICT human resources both in the public and private sector. The IT-enabled services industry regularly cites shortages of skilled labor as constraints to expansion. In the public sector, the limited availability of technical staff, particularly at the LGU level, is an oft-quoted impediment to effective use of information systems. While appropriate skills development for the labor market is a broader education policy issue, linked to factors such as teacher professional development, curriculum quality improvements and so on, the needs of this sector are immediate and growing. Action 3.1 Support fast-track skills development programs with private sector partners 24. In the short term, the IT sector skills deficit could be addressed through innovative government-industry partnerships. BPO firms have linked up with the country’s Technical Education and Skills Development Authority (TESDA) to train workers who are interested in working in outsourcing firms. Other options for the government to support faster development of skilled ICT human resources include: • Developing training incentive mechanisms, facilitate industry/university partnerships, and
develop a quality certification program for the multiple private institutions offering ICT learning opportunities.
• Facilitating the establishment of an industry-led group to facilitate eSkills information and co-operation, pool resources and establish closer collaboration between all stakeholders.
• Increasing investment in teacher professional development & teacher support mechanisms (DepEd, TESD).
• Considering a program of training incentives to ensure that skills are matched with industry demand. For example, the government could provide financial rebates to companies that provide staff training in selected sectors.
PHILIPPINES Discussion Note No.9: Information and Communications Technology June 2011
DN9-12
Selected References Annual Reports and Websites Philippine Long Distance Telephone Company (PLDT), Globe Telecom, Digitel, Bayantel. Family Income and Expenditure Survey (2006), National Statistics Office. World Bank (2009), Extending Reach and Increasing Impact. Information and Communications for Development.
World Bank (2010), Policy Options for ICT Universal Service. -Government World Ban
Note prepared by: Natasha Beschorner, CITPO The World Bank March 10, 2010
PHILIPPINES Discussion Note No.9: Information and Communications Technology June 2011
DN9-13
ANNEX I
ICT Leadership and Legislation: Chronology
Sources: Chronology developed from E-Government in the Philippines. Benchmarking against global best practices (Digital Philippines, 2002) www.digitalphilippines.org, and Commission on ICT website and interviews www.cict.gov.ph.
PHILIPPINES Discussion Note No.9: Information and Communications Technology June 2011
DN9-14
ANNEX II
Summary of Measures to Improve Broadband Internet Access Actions Type of
measure Assessment of Potential costs*
Impact on broadband expansion
PHASE 1– 2010/2011
Open access to fiber-backbone infrastructure Regulatory Low High Tower infrastructure sharing – incentives, then mandate
Regulatory Low High
Tax reductions or incentives Fiscal Low High Licence reform with more extensive coverage obligations
More systematic broadband data collection Regulatory Low Low
PHASE 2 – 2011/2012
Increase penetration of broadband Internet access devices among households and children
Stimulate demand
US$150 million (@US$150 for 1 million recipients), repaid by households if loan program
High
Government as model broadband user (including all secondary schools)
Stimulate demand
High High
E-Government service development is made policy priority
Stimulate demand
High High
PHASE 3 – 2012/2013
Universal Access and Service Fund (or variation thereof)
Targeted policy intervention
Medium High
Fiber-optic connectivity for provinces without fiber, based on feasibility analysis; through a competitive subsidy bid
Targeted policy intervention
~US$20-25 million (assuming 50% subsidy & excl. undersea cable)
High
Broadband connectivity for primary schools; through a competitive subsidy bid
Targeted policy intervention
High High
Public Internet access facilities (including connectivity) in areas which are not viable for commercial Internet cafes; through a competitive subsidy bid
Targeted policy intervention
US$75 million (assuming unit cost of US$15,000)
High
Source: World Bank Policy Options for ICT Universal Service, 2010
DN10-1
������������������������������������������� Towards a more dynamic and diversified rural economy�T P
T P
T
P
E
A
A. The Philippines Today: Progress and Challenges 1. The performance of Philippine agriculture over the past decade exhibits a mixed picture. On one hand, sector output growth accelerated after 2001, following a protracted period of stagnation: real agriculture value-added growth increased from an average of 1.6 percent per annum during 1980-2000 to 3.9 percent over 2000-07, above or on a par with sector growth rates in comparator countries in the region (Table 1). Much of that growth increase reflects higher sector productivity growth, which picked-up in the latter period, both in terms of land productivity and labor productivity.112 These developments point toward a sector with considerable potential, even though it has not been the key driver of overall growth.113 Two concerns about the agriculture sector’s performance are the continuing lack of product diversification, which renders it vulnerable to commodity price fluctuations, and declining sector competitiveness. These aspects raise doubts about the sector’s prospects for future growth.
112 The growth of labor productivity, however, remains constrained by increasing population pressures on cultivable land, which is a consequence, in turn, of rural demographic dynamics and the relatively low pace at which surplus labor is being reallocated from agriculture to other economic activities. 113 Real agriculture sector growth per annum averaged 3.8 percent over 2002-2008, or significantly below the average growth in industry (4.7 percent) and services (6.3 percent).
PHILIPPINES Discussion Note No. 10: Agribusiness June 2011
DN10-2
Table 1: Growth rates of key productivity indicators in agriculture
2. The Philippine agriculture sector has hardly evolved over the last three decades. Palay (rice) remains the dominant crop, accounting for around 24 percent of total agriculture gross value-added (Table 2). With the exception of important increases in the production of livestock and poultry, and marked declines in coconut and sugar production, the sector structure remains broadly the same as in 1970. Moreover, except for bananas and pineapples, traditional and nontraditional exports have found it difficult to penetrate world markets. These aspects of Philippine agriculture point toward a lack of dynamism.
Table 2: Distribution of Gross Value Added in Agriculture by Major Commodities (%)
CPCCSBO
LLP
S W B M E A P PN
3. The Philippine farm sector’s competitiveness is eroding.114 The share of agricultural gross value added that is exported declined from an average of 44 percent in the 1970s to 15 percent in 2008, while imports rose from 12 percent of agriculture value-added to 27 percent Indicators of revealed comparative advantage (RCA) have also been declining over the past three decades for agriculture as a whole and particularly for traditional exportables, such as coconut and sugar.115 Moreover, even though labor productivity increased in the last decade, several studies (e.g., Mundlak, Larson and Butzer (2002); Teruel & Kuroda, 2005) show that total factor productivity growth in the sector has been declining. This has been linked to declining investment in rural infrastructure, including roads, electrification and irrigation. In contrast, the share of agribusiness in the import markets of the European Union, Japan, and the United States has remained relatively stable between 2000 and 2008, contrary
114 “Competitiveness” refers to the ability to produce farm goods at average costs that are comparable to those of competitors in the world markets; see Philippines Discussion Note on Improving Competitiveness. 115 RCA indicators are a measure of relative export performance by country and industry, and are traditionally calculated as a country's share of world exports of a good divided by its share of total world exports.
PHILIPPINES Discussion Note No. 10: Agribusiness June 2011
DN10-3
to other sectors whose shares have typically declined by 50 percent. This suggests that the future of Philippine agriculture lies more with the agro-processing stages than with the initial raw commodity production stage. 4. The preceding overview suggests that while Philippine agriculture exhibits considerable potential for further expansion, it also faces important constraints that impede the realization of that potential. These constraints, which are discussed below, refer to (i) a public policy and expenditure framework that continues to emphasize the pursuit of food security with a particular bias in favor of a single crop, namely rice, (ii) the underdevelopment of land markets, which impedes the efficient allocation of land toward the most efficient uses and limits access to credit, and (iii) various barriers to competitiveness, including insufficient access to credit, poor transport infrastructure, inadequate food safety standards and an absence of closer public-private partnerships in both research and development (R&D) activities and in sector-relevant infrastructure development. 5. Eliminating these constraints to permit faster sector development is important for poverty reduction. Agriculture only accounts for about 15 percent of economic output, but for 40 percent of total employment; comprising mostly the less-skilled segments of the labor force. Furthermore, most of the poor (around 70 percent) reside in rural areas and are employed in agriculture. The pace of poverty reduction, therefore, is closely linked to the growth and evolution of the agriculture sector. By raising farm incomes, faster agriculture sector growth can contribute to poverty reduction, especially in the regions with favorable climatic and soil conditions. However, the main pathway out of rural poverty is not likely to go through higher farm incomes, but through the absorption of the rural labor force into more productive non-agricultural activities. Non-farm activities are already as important as farm activities in determining rural poverty rates in the Philippines, and becoming increasingly important. Even so, a more dynamic agriculture sector growth can contribute to a smoother transition from agriculture to non-agriculture employment.116
The pursuit of rice self sufficiency as constraint on sector diversification 6. Achieving greater food security through self sufficiency in rice has been a persistent, but elusive goal of successive Philippine governments. Since the 1960s, public policy in the sector has focused primarily on rice self sufficiency, leading to extensive support for lowland irrigation development and policies designed to protect the rice sub-sector. This emphasis has shifted the focus of public policies away from the development of a potentially vibrant agri-business sector and led to lost opportunities that resulted in declining competitiveness. An attempt was made to foster a less distorted sector development through the passage of the Agriculture and Fishery Modernization Act (AFMA) of 1997, which sought to create a competitive and diversified agricultural sector that is better able to withstand the
116 It is commonly assumed that the rate of labor migration from agricultural to non-agricultural activities is influenced by wage differentials, which are in turn determined by differences in marginal productivity. As labor productivity in agriculture increases, the pace of migration out of agriculture sector employment diminishes, as does the downward pressure on real wages in the least productive informal service sectors, which generally represent the first stepping stone out of agriculture sector employment.
PHILIPPINES Discussion Note No. 10: Agribusiness June 2011
DN10-4
pressures of globalization.117 The overriding concern with food self-sufficiency, however, meant that a disproportionate share of public expenditures continued to be directed toward rice. In addition to allocations for irrigation and production support (i.e., fertilizers and seeds), rice-related programs represent the dominant part of public expenditures for farm machinery, post-harvest equipment, R&D, and training programs (World Bank, 2007).118 In contrast, public expenditures for services that are key to exportable agricultural products have been modest, while spending on R&D, extension services and market development programs in support of the broader sector has been very low. These developments undermine the stated goals of greater diversification and improved competitiveness in agriculture. 7. The emphasis on rice self sufficiency has been fiscally very expensive and difficult to sustain. The National Food Authority (NFA) plays a key part in the government’s pursuit of food security. It has a near monopoly of rice imports and is mandated to stabilize domestic rice prices by procuring rice in world markets and reselling it domestically at a subsidized rate. Apart from high administrative costs, a strategy that seeks to maintain high enough prices for domestic producers and low prices for domestic consumers is bound to result in large deficits for NFA. During the 2008 food price crisis, NFA imported over 2 million metric tons (MT) of rice and achieved a cumulative operational loss of PhP 72 billion, equivalent to 1 percent of GDP.119
Inefficient land markets 8. Fragmented land ownership, tenure insecurity, and a weak regulation of access to public lands constrain agribusiness investment. Population pressure and twenty years of agrarian reform have led to a consistent decline in average farm size, which is now about 1.7 hectares. Given the significant encumbrances faced by agrarian reform beneficiaries, land distributed under the agrarian reform program is mainly traded only in the black market. A minimum of ten years must pass before land distributed under the agrarian reform can be rented and this period can become even longer depending on the repayment schedule of the agrarian debt. Almost one million hectares of privately owned lands are still waiting to be distributed under the recently extended agrarian reform program. Moreover, almost two million hectares of agrarian reform land have been distributed under collective titles. As a result of these restrictions, land rental markets underperform, farm consolidation is
117 Recognizing that sector liberalization would create losers as well as winners, an Agriculture Competitiveness Enhancement Fund (ACEF) was established to help the former face inevitable adjustments. The AFMA also mandated increased funding of strategic public services, such as market development, R&D, and regulatory functions. 118 During 2000-2005, about 60 percent of the AFMA budget was spent on rice programs (mainly investments in irrigation), even though rice accounts for only 16 percent of total agricultural value-added. Meanwhile, the structure of protection for rice and other importable crops has changed considerably since the late 1990s, with less emphasis placed on tariff protection and more on hidden subsidies. The average nominal rate of protection of rice declined steeply from an average of 53 percent in 1995-99 to 5 percent in 2005-08.118 The most important sources of hidden subsidies are now the subsidized access to land through the agrarian reform program in rice and corn areas, and underpriced irrigation services. This trend is likely to continue as pressure mounts on the Philippines to implement the Asian Free Trade Area agreements on rice, corn, and sugar. 119 See Annex 1 of the Philippines Discussion Note No. 4 (“Closing the Gap in Public Spending”), which discusses the cost of the rice subsidization policy administered by the NFA.
PHILIPPINES Discussion Note No. 10: Agribusiness June 2011
DN10-5
problematic in areas with a significant presence of agrarian reform beneficiaries, and incentives to invest in land are weak. Other barriers to competitiveness 9. Access to rural finance is a major obstacle to the development of the agribusiness sector. It is one of the key constraints keeping the majority of small farmers and hundreds of thousands of micro and small enterprises in the Philippines from growing and contributing to the country’s overall economic growth.120 A large number of these enterprises are involved in adding value to primary crops, but are constrained by low-productivity technologies that hardly meet the emerging standards for quality and food safety requested by the evolving domestic market and foreign importers. Only about one fourth of these enterprises have access to a reliable source of credit through rural banks, credit unions and non-profit microfinance institutions. Because they often lack acceptable forms of collateral and transparent accounting practices, small rural enterprises are considered risky and costly loan subjects by the regulated financial institutions. The situation is even worse for small-scale farmers, whose land cannot be used as collateral by formal lenders. Institutional weaknesses and past governance failures have undermined the use of warehouse receipts as a tool for improving access to credit, while provisions to direct resources towards the agricultural sector through the Agri-Agra Law have proven ineffective. 10. Logistics and supply chain efficiency are hampered by insufficient investments and lack of competition. The logistics and supply chains for the internal distribution of agricultural products within the Philippines are generally characterized by high transportation costs. An examination of the inter-island shipment of agricultural products from the farm gate in Mindanao to the production facilities and wholesale markets in the Visayas and Luzon shows that the small scale of post-harvest and storage activities and small consignment sizes were the main causes of high logistics costs (World Bank, 2003). These factors create diseconomies of scale upstream, as the small volume of produce requires trans-shipments of products and does not justify the development of large-scale ports equipped with high-productivity cranes. Two other problems contributing to high transportation costs are the low quality of farms-to-market roads, especially those connecting smallholders’ farms, and the absence of competition coupled with inadequate regulation in local shipping. The process by which operating licenses are awarded to shipping firms lacks transparency, and regulation of shipping rates is weak or non-existent, even when there is only one operator on a particular route. The Cabotage Law, which prohibits international liners from inter-island shipping in the Philippines, also contributes to high shipping costs. As a result, it is more expensive to transport goods from Mindanao to Manila than it is to export them from Mindanao to China. 11. Institutional fragmentation and a weak regulatory system impede progress in the development of food safety standards, which is critical for product diversification and export promotion. To be competitive on the international food market, the Philippines must be able to comply with food safety standards and have in place effective quality and safety
120 The Department of Trade and Industry estimates that 91 percent of the nearly one million registered firms are micro and small in size. Meanwhile the number of unregistered microenterprises is estimated to be around 4 to 5 million, mostly belonging to the poorer families in the Philippines.
PHILIPPINES Discussion Note No. 10: Agribusiness June 2011
DN10-6
controls throughout the agri-food processing chain.121 The system for ensure food safety in the Philippines is highly fragmented, however. Currently, the Agriculture Department’s regulatory functions are carried out by thirteen different agencies with widely varying implementation and enforcement capacities. This problem is compounded by limitations in laboratories and personnel, with the result that the food safety regulatory framework is incapable of supporting the expansion of food exports. This constraint is particularly binding for small and medium enterprises, which lack the internal capacity to comply with the procedures required for accessing high-valued international markets, and so discourages further investment in the development of export-oriented food products.122
12. Development of the agriculture sector in the Philippines has traditionally been led by the public sector, with little involvement of the private sector. As a consequence, the Philippine system of agricultural research, development and extension (RDE) is overwhelmingly in public hands, while formal partnerships with private firms in planning, funding, and implementation of RDE activities are limited. While private R&D is mainly targeted towards plantations and products of interest to large-scale commercial agriculture, the public sector maintains the lead in providing RDE services to small-scale farmers and has primarily focused on the rice sub-sector, thereby limiting opportunities for product diversification. Over the past decade, associations of producers and agribusiness have begun to coalesce with increases in the number of agro-processors (large and small) producing a range of agricultural, livestock, and fish products for both the domestic and export markets. This development provides an opportunity for shifting the leadership in product development to private sector associations and interests, while the public sector focuses increasingly on providing a supporting role through complementary public infrastructure spending and the enforcement of sector regulations and standards. B. Where the Philippines Could Be: Policy Options
Table 3: Philippines –Summary of Policy Areas and Actions Policy Area 1: Reforming Rice Policy
Action 1.1 Redirect public expenditures away from subsidies to support services Action 1.2 Institute governance reforms for R&D and irrigation services Action 1.3 Compensate farmers through targeted adjustment programs
Policy Area 2: Fostering More Efficient Land Markets Action 2.1 Ensure security of tenure and efficiency of land markets
121 International food safety standards are becoming increasingly stringent for both raw and agro-processed products. One manifestation is that between 2000 and 2008 detentions and rejections of Philippines’ food imports by the European Union have increased fourfold (World Bank, 2010b). 122 To maintain their competitive edge, Philippine producers also need to respond to structural changes in the domestic demand for agricultural products. The pace of urbanization in the country has been quite sustained (urban population is now 50 percent), which is influencing the pattern of demand for food products, as urban consumers eat more “street” food and display a marked preference for more meat products and processed foods. As quality, variety, and packaging of food products are increasingly valued by urban consumers, the food retail sector is adjusting and, with it, the procurement modalities for high value crops. With the declining importance of traditional markets and the emergence of quality and health standards as drivers of product selection, small producers face serious challenges in adapting their farms in order to maintain their competitiveness.
PHILIPPINES Discussion Note No. 10: Agribusiness June 2011
DN10-7
Action 2.2 Develop a decentralized and participatory approach to agrarian reform Policy Area 3: Enhancing Public- Private Partnerships to Support Agribusiness Investment
Action 3.1 Strengthen the role of the private sector in the sector’s governance Action 3.2 Building PPPs in the development of agribusiness clusters
Policy Area 1: Reforming Rice Policy
Action 1.1 Redirect public expenditures away from subsidies to support services 13. The government’s intervention in the rice sector needs to be reformed in order to create a less distorted incentive structure for agricultural production. This requires a readjustment of public expenditure in two ways: First, resources allocated to programs with negligible impacts (such as rice production support programs based on fertilizer and hybrid seed subsidies) need to be redirected toward the provision of services supporting agribusiness competitiveness, such as market access and information, regulatory and supervision functions, extension services and R&D. Second, expenditures that continue to be made in support of the rice sector need to be made more efficient by focusing on the improvement and scaling-up of extension services, R&D, and market access. Redesigning interventions in the rice sector and allowing farmers to profit from higher farm gate prices also will provide better incentives for production. As demonstrated during the first part of the 2008 crisis, higher farmgate prices led to a significant supply response. While self-sufficiency in rice is not a realistic target, a large share of the domestic consumption of rice can still be sourced domestically, as most of the areas under rice cultivation should continue to remain profitable thanks to projected price trends and increased productivity once these reforms take hold (IRRI, 2007). Action 1.2 Institute governance reforms for R&D and irrigation services 14. The reallocation of public spending needs to be accompanied by significant changes in the governance of public programs. Rice R&D management can be improved by investing in improved facilities, setting clear objectives and priorities, and by adopting an adaptive and participatory approach. At the same time, it needs to be linked through LGU-managed extension services that would inform R&D based on local agro-climatic and socio-economic conditions. To link the Department of Agriculture to the demands emerging from their farm and agribusiness constituencies, would require capacity strengthening in the LGUs. Sustainability of irrigation services will also require more decentralization with water user associations and public-private partnerships (PPP) replacing the role of the government in the construction, operation, maintenance and management of irrigation systems. A renewed role for civil society in the design, implementation, and monitoring of public programs in agriculture needs to accompany the process of decentralization of support services to LGUs. Action 1.3 Compensate farmers through targeted adjustment programs 15. Reforming the structure of support to the agricultural sector often involves an adjustment process that produces winners and losers. To prevent the prospective losers from blocking the reforms, it may be necessary to compensate them. Transfers that are de-linked
PHILIPPINES Discussion Note No. 10: Agribusiness June 2011
DN10-8
from the size of area under cultivation represent an attractive option for supporting the reform process. International experience (e.g., Mexico, Romania, Turkey) has shown that properly timed and targeted cash transfers allow small-scale farmers to finance investments in land and machinery that open up new opportunities, including nonfarm activities for farmers who lease land. For such adjustment programs to succeed, appropriate targeting mechanisms need to be developed to ensure that resources are directed towards vulnerable farmers. The creation of a registry of farms in which cadastral information and socio-economic characteristics of the operators are merged, is feasible in the Philippines and would be useful for improving the design of the compensation packages as well as for introducing new services aimed at raising the productivity of small farms. Policy Area 2: Fostering More Efficient Land Markets
Action 2.1 Ensure security of tenure and efficiency of land markets 16. Reforms are needed to ensure that the completion of the agrarian reform program does not continue to affect tenure security and make land markets less efficient. Recent changes to RA6657 go in the right direction of improving tenure security and access to credit among CARP beneficiaries by subdividing collective titles affecting almost 2 million hectares of land. Unfortunately, the reform of RA 6657 falls short of the objective of reactivating land markets. While the possibility of lease-back arrangements has been maintained, under the current framework it is still very difficult for an efficient small farmer to expand beyond the original land holdings by leasing land distributed under CARP, in turn limiting the potential for on-farm investments that would make the sector more competitive. An example in case is mechanization of rice harvesting and threshing, which would contribute to making Philippine rice more costly to produce than in Thailand (IRRI, 2007). Reducing the period during which awarded land cannot be transferred from ten to three years would represent a major step towards creating more efficient land markets (World Bank, 2009). In the shorter term, a reform of the modalities by which agrarian debt is repaid should be explored. One possibility would be to make LGUs the recipients of the amortizations that would be used for social development purposes, while the national government would absolve agrarian reform beneficiaries from any obligation. Action 2.2 Develop a decentralized and participatory approach to agrarian reform 17. The development of a decentralized, negotiated, and community-managed approach to agrarian reform needs to accompany the transition towards the end of the CARP. Such an approach will increase the likelihood of completing the program in the remaining extended period, reduce land-related conflicts, ensure a better selection of beneficiaries, and contribute to the reactivation of land markets. A more rigorous selection process of agrarian reform beneficiaries yields a double advantage: it ensures that the program targets poor farmers with good productive skills while at the same time reducing the risk that the transfer of land embodies speculative motivations. The latter further motivates the recommendation to substantially reduce the period during which awarded land cannot be sold. Finally, the proposed decentralized program could be allowed to graduate into a program aimed to support the formation of small and medium farms wherever productivity gains have the potential to
PHILIPPINES Discussion Note No. 10: Agribusiness June 2011
DN10-9
emerge - for instance in the rice, corn, and high value crop sectors – either through the purchase of unproductive lands or through consolidation of micro-farms.
Policy Area 3: Enhancing Public-Private Partnerships to Support Agribusiness Investment
Action 3.1 Strengthen the role of the private sector in sector governance 18. Recent progress in agribusiness development has occurred in spite of limited public sector support. Whereas the AFMA goal of sharpening the role of the public sector continues to be relevant, the private sector needs to broaden its role in the governance of agricultural value chains and clusters. A significant policy option for Government at this time is therefore to recognize and promote private sector leadership for the sector, with Government retaining the core regulatory and supervision functions in support of public interest. In this context, the limited consultative role that the private sector currently has in the sector’s governance would shift towards that of a substantial delegation in the provision of services currently under public responsibility. Specifically, reform in this area could pursue the following options:
• strengthening the legal framework for the establishment of privately-led forms of associations (commodity associations or councils, inter-professional associations, representing the various type of interests along specific value chains as the main forum for developing shared strategies and channeling policy recommendations and advocacy for the sector,
• strengthening the role of such private sector associations in the provision of key services to the agribusiness sector, such as market intelligence, quality assurance, export and consumption promotion, environmental management, food traceability, and food security, and
• promoting private/public joint grant-based research and development programs, especially for crops where strong market linkages between growers and processors exist.
Action 3.2: Building PPPs in the development of agribusiness clusters 19. Building a PPP framework for the development of agribusiness clusters needs to be at the core of the reform process. The regional agribusiness strategy pursued by NEDA based on the development of dynamic agribusiness clusters, which recognize the role of the natural resource base for local comparative advantage, moves in the right direction. Nevertheless, to reach its goals of creating employment and investment opportunities, greater emphasis needs to be placed on creating an environment conducive to a deeper involvement of the private sector. There are significant opportunities for developing PPPs in agribusiness clusters, which include:
• Developing an appropriate institutional framework, whereby private sector-led development boards would collaborate with national government and LGUs in planning, programming and implementing development plans for specific clusters. These plans would seek to link farm production with agri-business in their areas
PHILIPPINES Discussion Note No. 10: Agribusiness June 2011
DN10-10
through infrastructure and partnerships for selected farm-to-market roads, cool storage facilities, vans, produce packing facilities, etc.
• Contracting of extension services and technology support for farmers and agribusiness SMEs by local associations and cooperatives themselves, thereby imparting a more demand driven and accountable approach.
• Promoting private sector accreditation and management of facilities and laboratories with the government providing regulatory oversight, and
• Strengthening the capability of rural banks to better service the agri-business sector. Concluding remark on the importance of nonfarm rural activity 20. While growth in nonfarm activities will benefit from a thriving agricultural economy, improvements in the competitiveness of agriculture will in turn require an expanding nonfarm sector to offer new local opportunities to workers exiting farming. Such linkages normally involve small towns and secondary cities, where providers of services to the local agribusiness sector are also located. To strengthen their poverty reduction impact, future interventions need to take into account the complex set of linkages and spillovers that exist locally among sectors. To do so, rural development interventions should consider targeting SMEs for the introduction of new technologies (processing, marketing, and business management), farmers and agro-processors to develop market linkages, providers of business services to improve their capacity to assist local entrepreneurs, local financial institutions to improve the services offered to SME, and LGUs to improve the quality and accessibility of the services that cater to the local agribusiness sector. The recent experience with the Mindanao Rural Development Program suggests that important gains can be achieved by strengthening the capacity of rural towns in the delivery of key services to the farm sector.
PHILIPPINES Discussion Note No. 10: Agribusiness June 2011
DN10-11
References International Rice Research Institute (2007), “Why Does the Philippines Import Rice?
Meeting the Challenge of Trade Liberalization.” D. Dawe, P. Moya, and C. Casiwan (eds). Los Banos, Philippines.
Mundlak, Y, D. Larson, and R. Butzer (2002): Determinants of Agricultural Growth in
Indonesia, the Philippines, and Thailand. Policy Research Working Paper, World Bank, Washington D.C.
Teruel R. and Y. Kuroda (2005), “Public infrastructure and productivity growth in Philippine
agriculture, 1974-2000,” Journal of Asian Economics, Vol. 16 (3), pp. 555-76. World Bank (2003), “Trade and Logistics in East Asia: A Development Agenda.” World Bank (2007), “Philippines: Public Expenditure Review.” World Bank (2009), “Distortions in Agricultural Incentives in Asia.” World Bank (2009), “Land Reform, Rural Development, and Poverty Reduction in the
Philippines: Revisiting the Agenda.” World Bank (2010), “Philippines: Fostering More Inclusive Growth.”
Note prepared by: Fabrizio Bresciani (EASPS), with contributions from Carol Figueroa-Geron (EASPS), Baher El-Hifnawi (EASIN), Patrick Labaste (EASER), Iain Shuker (EASER), Felizardo Virtucio (EASPS) and Douglas Forno (Consultant) .
III. BETTER PUBLIC SERVICE DELIVERY
DN11-1
������������������������������������� Achieving Universal Access to Quality Health Services in the Philippines
The Philippines has undertaken several significant health sector reforms in the past decades, but a large unfinished policy agenda remains. Maternal and reproductive health indicators in the Philippines are some of the worst in the Region, and without concerted action, achievement of this MDG is at risk. The overall health spending ratio is one of the lowest in the Region with out-of-pocket spending, a measure of financial protection, at over half all of health spending, well above the average for global comparators. Moreover, out-of-pocket health spending has been increasing, while the public share is decreasing. According to data from the recent National Demographic and Health Survey (NDHS), progress in achieving universal health insurance has been slow and only 20 percent of the poorest quintile of the population have health insurance coverage. Some provinces (e.g., those in ARMM) have only 17 percent health insurance coverage, compared to the national average of 42 percent. Indigent households rely most heavily on public health facilities, where the quality of care needs improvement and access in rural areas remains difficult. The problems in the health sector largely stem from the excessive fragmentation in health financing and delivery and a lack of clarity in stewardship responsibilities of DOH, LGUs and the Philippines Health insurance Corporation (PHIC). Under the FOURMULA1 Program, the DOH has made progress in facilitating the improvement of LGU service delivery and public health interventions, such as immunizations and tuberculosis control, but the pace of these efforts needs to be accelerated. Numerous well-intentioned piecemeal reforms have not managed to deal with the major problems in the health sector. A program of change that addresses these problems in a sequential manner is proposed below.
A. The Philippines Today: Progress and Challenges
Progress in Sector Reforms 1. The Philippines health sector has been experiencing waves of reforms since the 1990s. These reforms have been implemented to improve health outcomes, increase the financial protection of the population, and improve the quality and equity of health services delivery. The reforms are also consistent with global trends in moving towards universal health insurance coverage, decentralization of service delivery and strengthening the stewardship capacity of the health ministries. Box 1 outlines the major reforms implemented to date. As a result of these reforms: (i) the provision of health services has been largely decentralized to local government units (LGUs), (ii) the legal and institutional framework for the implementation of universal health insurance has been created, and (iii) the Department of Health (DOH) has been given the mandate to focus on policy-making, priority setting and other stewardship functions, including public health.
PHILIPPINES Discussion Note No.11: Health June 2011
DN11-2
Box 1: A Snapshot of Health Reforms in the Philippines 1990-2009
1991: A landmark law transfers the management of public facilities in the Philippines to LGUs with the provinces typically responsible for managing provincial and sub-provincial hospitals and with cities and municipalities responsible for public health programs, city and municipal hospitals, and barangay health stations. However, the DOH eventually expanded its role beyond stewardship of the health system by assuming responsibility for the procurement of public health commodities such as vaccines and tuberculosis drugs and retaining a network of “DOH hospitals”.
1995: National Health Insurance Law is passed with the objective of scaling up the social insurance program (called Medicare and established in the 1960s) into a universal health insurance program. The Philippines Health Insurance Corporation or PhilHealth is established as the single purchaser in the health system and given the mandate to expand the formal health insurance program and implement mechanisms to enroll informal sector workers. A Government-financed indigent program (managed by PhilHealth) is established. It was mandated with achieving universal coverage by 2010.
1998: The Health Sector Reform Agenda (HSRA) is announced with the objective of focusing on full scale implementation of the decentralization and universal health insurance reforms. The HSRA aimed at: (a) an enhanced social insurance program and expanding coverage of informal sector workers and the indigent as well as strengthening Philhealth’s role as the health purchaser and addressing issues such as balanced billing by hospitals, (b) upgrading public health facilities to meet PhilHealth standards and introduce hospital autonomy, (c) more effective regulation of the private sector and stronger results orientation and coordination between DOH and LGUs in the delivery of health programs, and, (d) introducing necessary structures and processes among the various institutions such as DOH, LGU and private sector to strengthen local health sector planning.
2005. The Government launches “Fourmula 1 for Health.” FOURMULA 1 aims to achieve broad and comprehensive reform of the health system. It essentially builds upon the concepts outlined in the HSRA while providing a framework for accelerated action on the implementation of the reforms. It consists of the following areas:
• Health Financing: ensuring sustainable financing for the health sector, strengthening universal health insurance and building the capacity of PhilHealth to function as the main purchaser in the health system;
• Health Regulation: harmonizing and streamlining the licensing, accreditation and certification systems, ensuring the availability of quality and affordable medicines and the capacity building of regulatory agencies;
• Health Services Delivery: ensuring the availability of a basic and essential health services package, improving the quality of health services and intensifying current efforts to reduce public health threats;
• Good Governance: improving governance in local health systems, improving national capacities to manage and steward the health sector and developing a more rationalized and efficient national and local health system.
2. As a result of the reforms, health insurance coverage has increased slightly in the Philippines, including for poor households. When the Philippines Health Insurance Corporation (PHIC) was established in 1995, health insurance coverage in the Philippines was entirely restricted to the formal sector and was around 30 percent. According to PHIC data, health insurance coverage was 76 percent of the population in 2008. According to the 2008 National Demographic and Health Survey, however, PHIC coverage is much lower (only 38 percent) and overall health insurance coverage is only 42 percent. To further encourage local governments to enroll indigent households into its Sponsored Program (SP), PHIC expanded
PHILIPPINES Discussion Note No.11: Health June 2011
DN11-3
health insurance benefits to include primary care services exclusively for SP members, outpatient treatment of tuberculosis and malaria, and normal deliveries in non-hospital health facilities; and contracted with government health centers including rural health units (RHUs) to provide these services. 3. Overall public spending on health has also increased, but still remains on the low side due to limited PHIC and LGU expenditures on health. After declining in real terms for nearly a decade, the DOH budget has doubled and spending on health as a percentage of government expenditures increased from 6 percent in 2002 to 6.8 percent in 2007. In particular, spending for public health interventions such as vaccines, anti-tuberculosis drugs, and the upgrading of government health facilities to provide emergency obstetric care has increased in the past two years. However, the increase has largely been limited to central government expenditures, while LGU expenditures on health have declined in real terms. Also, PHIC’s share of health expenditures has hardly grown since it was established in 1995. In terms of overall trends, out-of-pocket spending in the Philippines has been increasing while public spending has been declining. This is contrary to the trends in other Asian countries. 4. Important progress has been made in laying the foundations for more systematic pharmaceutical policies and regulations. The prices of drugs in the Philippines have traditionally been high compared with other Asian countries (except Japan). Competition in the pharmaceutical industry has intensified in some segments of the market with local generics companies now accounting for nearly half of all the medicines sold. Central government financing has been used in some initiatives to increase the availability of cheaper medicines. Village pharmacies, or “Botika sa Barangays”, selling predominantly over-the-counter drugs are being rolled out all over the country. There are, however, concerns with sustainability and lack of pharmacy supervision. The Bureau of Food and Drugs (BFAD) was recently converted to the Food and Drug Administration (FDA) with increased regulatory powers and resources. 5. The DOH has initiated performance-based approaches with LGUs. DOH has developed a LGU scorecard that explicitly tracks and holds LGUs accountable for their performance on a set of health outcome, output, and governance indicators. It has guided LGUs to develop Provincial Investment Plans for Health (PIPH)123 and City Investment Plans for Health (CIPHs). It has launched performance agreements with 16 provinces and is expanding these performance agreements to the rest of the provinces and major cities. The implementation of mechanisms to reduce fragmentation in the health services delivery system is important since a primary care system with referrals need to be managed at the provincial (not LGU) level. Nevertheless, the data that is reported through the LGU scorecards are weak and there is no external verification process. Health Sector Performance 6. Health outcomes in the Philippines reveal a mixed picture. While the Philippines does well on indicators such as life expectancy and infant mortality in comparison to other countries of similar income levels, other countries have sustained greater improvements in
123 The World Bank is supporting the development of PIPHs through the NSSHRP.
PHILIPPINES Discussion Note No.11: Health June 2011
DN11-4
these indicators over time (Figures 1 and 2). There are also large income-related health outcome inequalities. For example, the infant mortality rate (IMR) among the poorest quintiles is more than double of those in the richest.
Figure 1: Infant Mortality Rate: Attainment relative to income
Indonesia
Thailand
MalaysiaSri Lanka
Vietnam
Lao PDR
PhilippinesChina
Below averagePerformance
Above averagePerformance
Be
low
aver
age
Pe
rfor
man
ceA
bove
ave
rage
Per
form
ance
IMR
rela
tive
toin
com
ep
erca
pita
IMR relative to total health spending per capita
Sources: WDI;WHONote: Both axes current US$
Global Comaprisons of Infant Mortality versus Income and Total Health Spending (2007)
Infant Mortality Rates in Selected Comparators (1960-2007)
7. The Maternal Mortality Rate (MMR) in the Philippines is on the high side in comparison to countries of similar or lower income levels. For example, while Vietnam’s GDP per capita is lower than the Philippines’, the MMR for Vietnam is much lower. It is unlikely that the Philippines will achieve the MDGs on maternal mortality by 2015. There is large variation in fertility rates with the total fertility rate (TFR) for women in the highest
PHILIPPINES Discussion Note No.11: Health June 2011
DN11-5
income quintile at 1.9 compared with the 5.2 for women in the lowest income quintile (NDHS, 2009)
Figure 3: Maternal Mortality Rates
China
Indonesia
MalaysiaLao PDR
Sri Lanka
Thailand
Vietnam
PhilippinesCambodia
Below averagePerformance
Above averagePerformance
Be
low
aver
age
Pe
rfor
man
ceA
bove
aver
age
Pe
rfor
man
ce
MM
Rre
lativ
eto
inco
me
per
capi
ta
MMR relative to total health spending per capita
Sources: WDI;WHONote: Both axis current US$
Global Comparisons of Maternal Mortality versus Income and Total Health Spending (2005)
8. The burden of disease (BOD) in the Philippines is changing with almost 58 percent of total burden attributable to non-communicable diseases (NCD), and the health system is not fully equipped to deal with this new challenge. By 2030, it is projected that NCDs will account for 87 percent of the disease burden in the Philippines. Currently, deaths from cardiovascular conditions are one of the top 10 causes of reported deaths. Moreover, injuries are also a major contributor and the number of road traffic accidents in the Philippines is increasing. Treating NCDs can be expensive and requires longer and continuous interaction with the health system. Moreover, the continuum of care becomes even more important, and the Philippines health system has to gear up for addressing the next generation of challenges in the health sector, while addressing existing ones. 9. The financial protection of the population against the costs of ill health is worse than among comparator countries and deteriorating. Out-of-pocket payments (OOP) account for almost half of all health spending in the Philippines and its share has been increasing (Figure 4). In 2006, the OOP share of non-food household consumption across all income classes was higher than in all previous years. Meanwhile, public spending on health in the Philippines is below the level of other comparator countries (Figure 5)
10. There are large income-related disparities in the utilization of health services. For example, skilled birth attendance among the highest income quintile in 94 percent as compared with 25 percent in the poorest quintile. Only 13 percent of all births in the lowest quintile occur at the facility level compared with 84 percent in the highest quintile. Similarly,
PHILIPPINES Discussion Note No.11: Health June 2011
DN11-6
immunization coverage is only 70 percent among the lowest quintile as compared to 94 percent in the highest quintile (NDHS, 2009).
Figure 4: Public and Private health spending in the Philippines, 1995-2008
Composition of Total Health Spending as Share of Total Health Expenditure (1995-2007)
Figure 5: Pubic Spending on Health as a percent of GDP in Selected Comparator (1995-2007)
MalaysiaIndonesiaPhilippines
Sri Lanka
Thailand
Korea
China
Vietnam
.75
1.25
1.75
2.25
2.75
3.25
3.75
Pub
liche
alth
spen
din
gp
erca
pita
shar
eof
GD
P(%
)
1993 1995 1997 1999 2001 2003 2005 2007Year
Source: WDI (updated as of October 8, 2009)Note: y-axis log scale
Public Health Spending Share of GDP (%) in Selected Comparators (1995-2007)
11. There are capacity constraints as health sector inputs have not kept up with population growth. The bed-to-population ratio is roughly 1 per 1000 inhabitants, lower than in other East Asian countries such as China (2.6 beds per 1000 inhabitants), Vietnam (1.2 beds) and Thailand (2.2). Moreover, many of these hospital beds are clustered in large city centers and better-off LGUs. This is particularly true for private hospital beds which account for approximately half of all hospital beds in the country. The availability of skilled health sector staff is also a problem, especially in the public sector. While the Philippines do not
PHILIPPINES Discussion Note No.11: Health June 2011
DN11-7
have a problem with the overall supply of doctors and nurses, there is large scale out-migration. The Philippines is one of the largest suppliers of trained nurses in the world. Key Challenges in Implementing a Strategy for Universal Access to Quality Health Services 12. A large percentage of poor urban and rural households are not enrolled in the PhilHealth Sponsored Program and enrollment does not guarantee service use.Enrolling poor households is one among many challenges. Local Government Units (LGUs) with limited fiscal capacity cannot afford the subsidized contribution requirements. Once poor families are enrolled, they face various barriers to accessing health services. These are related to: (i) lack of awareness of health insurance benefits and administrative procedures related to accessing benefits, (ii) lack of availability of PHIC accredited facilities, and ensuring that accredited facilities provide quality care (convenient opening hours, no stock-outs for drugs and other medical supplies, medical equipment in working condition), (iii) cumbersome claims and reimbursement mechanisms, which means that it is not easy for health facilities to get reimbursed, (iv) the limited regulation of fees, as well as (v) the still limited benefits package (for example outpatient drugs are not covered). PHIC has begun to address some of these barriers, but further action is needed. 13. Overall government spending on health still remains on the low side. Increases in public spending on health in the last few years have mainly taken place at the central government level, including through the expanded DOH public health program for LGU (procurement of vaccines). Local government spending has stagnated in real terms over the last decade, which has important equity implications for the poor. As a share of total LGU spending, the contribution for health declined from 12 percent in 2002 to 9.5 percent in 2007. Cities and towns are spending less, with only 7.5 percent and 7.7 percent, respectively, of their total 2006 expenditures going on health. Since the Internal Revenue Allocation (IRA) and intergovernmental fiscal systems do not fully reflect fiscal capacity and need, many LGUs in reality have very limited fiscal space to finance any expenditure, whether in health or other sectors.
14. Poor households largely rely on public hospitals, whose quality of care is problematic and client responsiveness is low. Consumer surveys conducted in 2005 and 2006 indicated that people chose private hospitals over public ones since they perceived the latter as providing better quality care. Due to financing barriers, however, poor people do not have access to private hospitals, creating inequity in access to care. Public hospitals (DOH and LGU) suffer from many problems, including inadequate financing, poor allocation of resources, lack of quality benchmarks and standards, and limited accountability. Access to good quality primary care is also uneven, and when available, people often bypass the primary level to seek care in hospitals, as there is no effective referral system and penalties are not applied for bypassing the less costly primary level. Global experience shows that high utilization of good quality primary health care services is equity-enhancing and cost-effective for the health system.
15. PHIC is not, as yet, exploiting its potential as a major change agent in the health sector. The global experience with social health insurance (SHI) shows that a strong
PHILIPPINES Discussion Note No.11: Health June 2011
DN11-8
purchaser can act as a key change agent in the health sector, encouraging improved performance and accountability on the part of providers and ensuring equity of access to health services. So far, due to its limited purchasing power in the sector and institutional capacity, PHIC is not able to fully exploit this potential. 16. The quality of care in private hospitals is mixed, with some very high quality hospitals. Although largely perceived by the public as providing good quality care, available information shows that the quality of care in private hospitals is mixed. The Philippines has private health care facilities that are accredited by international organizations such as Joint Commission International. At the same time, there exist many small private facilities, including some that serve the poor, where the quality of care is uneven and unregulated. B. Where the Philippines Could be: Policy Options
17. To meet the key challenges in the health sector, the Philippines needs to: (i) reform sector financing with the objective of identifying the most feasible and fiscally sustainable mechanisms to finance health, (ii) strengthen the health insurance function, (iii) reform the provider (hospitals and health centers) side to respond effectively to a reformed regime of incentives and accountability, and (iv) address emerging public health challenges (such as NCDs and injuries) while tackling old challenges (communicable diseases). In the following section, the Discussion Note outlines steps to work towards these goals. Table 1: Philippines: Policy Areas and Actions Policy Area 1 (Short-term): Scaled-up Priority Health Interventions to meet Public Health and Poverty Alleviation Goals
Action 1.1 Scale-up DOH priority health interventions and capital investments in LGU facilities through performance-based approaches Action 1.2 Rapidly expand the sponsored program (SP) for indigent households with national government financing using well-defined targeting mechanisms (proxy-means testing) and strictly enforce service utilization and quality targets for which PHIC is held accountable
Policy Area 2: Expanded Coverage and Improved Fiscal and Institutional Sustainability of Health Insurance
Action 2.1 Expand PHIC coverage for all indigent families and informal sector workers and implement an expanded benefits package for all members. Action 2.2 Implement comprehensive reform of the Philippines Health Insurance Corporation
Policy Area 3: Health Services Delivery System Reforms Action 3.1 Develop and Implement a needs-based facilities and health personnel master plan, including using the plan, to guide future investments in the health sector by expanding capacity in underserved areas of the country. Action 3.2 Implement health facility autonomy reforms
Policy Area 4: Strengthened Stewardship of the Health Sector and Focus on Emerging Public Health Challenges
Action 4.1 Support the implementation of health information systems for improved monitoring and evaluation and regulation
PHILIPPINES Discussion Note No.11: Health June 2011
DN11-9
Action 4.2 Integrate the prevention of non-communicable diseases in public health and primary health care programs
Policy Area 1: Scaled-up Priority Health Interventions to Achieve Public Health and Poverty Alleviation Goals
Action 1.1 Scale-up priority health interventions and capital investments from DOH to LGU using performance-based approaches 18. While the full expansion of the Sponsored Program and delivery side reforms will occur in the medium-term, the DOH can significantly improve health outcomes among the poor by scaling-up priority health interventions such as immunizations, management of tuberculosis, reproductive health and addressing maternal and new-born health (e.g., nutrition counseling to prevent low-birth weight babies, prevention of anemia and hypertension, training in identification of danger signs for pregnant women and managing newborns, upgrading health facilities to provide emergency and obstetric care or EMOC, ensuring better use of the Maternity Care Package under PHIC). The World Bank financed Women’s Health and Safe Motherhood Project (WHSMP) and the National Sector Support for Health Reform Project (NSSHRP) are supporting these interventions and project resources can be used immediately by the Government to scale-up these initiatives. This would be consistent with a health financing approach that: (i) recognizes that LGUs have limited fiscal space for financing health, (ii) focuses increased national government financing on public health and selected service delivery interventions. Action 1.2 Initiate Rapid Expansion of the Sponsored Program with National Government financing using updated targeting mechanisms (proxy means testing) and strictly enforce service utilization and quality targets for which PHIC is held accountable 19. In the absence of stricter measures to mandate LGUs to enroll poor families into the Sponsored Program, the best option is for the national government to cover the program costs. The NSSHRP is already supporting this activity with project financing of US$40 million. The move towards targeting based on the National Household Targeting System-Proxy Means Test (NHTS-PMT) is already happening. Rapid expansion of this program will mean that additional resources for the health sector are channeled towards poverty alleviation goals. However, this move must be complemented by a strictly enforced set of performance indicators for PHIC to ensure that enrolled persons have timely access to health services. Policy Area 2: Expanded Coverage and Improved Fiscal and Institutional Sustainability of Health Insurance
Action 2.1 Expand PHIC coverage to all indigent families and informal sector workers and expand the PHIC benefits package for all members 20. While in the short-term, the expansion of the SP will be initiated using revised targeting mechanism (NHTS-PMT), in the medium-term, it is expected that all eligible
PHILIPPINES Discussion Note No.11: Health June 2011
DN11-10
families will be enrolled under the Program. Cost per family under the existing benefits package is 1200 pesos (approximately US$26), and the Department of Social Welfare and Development (DSWD) estimates that there are 4.7 million households that are eligible under the NHTS-PMT. Therefore, the estimated costs of enrolling all families are 5.7 billion pesos (US$125 million) per year. Given that the DOH’s budget for national government counterpart financing for the SP, is 5 billion pesos (currently), the costs of scaling up the SP from national budget financing seems reasonable. Implement a cost-effective program for enrolling informal sector workers. 21. In parallel, the Government needs to implement benefits package expansions for all members to cover inpatient and outpatient services and outpatient drugs with a co-payment system, and exemptions for sponsored program enrollees. For inpatient care, provider payment reforms can be implemented to shift away from the current fee-for-service payment scheme and balanced billing to a primarily case payment scheme with clear co-payment requirements (for example, for additional non-medical services, such as private rooms and special meals). Primary health care under the outpatient benefits package will be implemented through capitation agreements with preferred providers, and bypassing primary health care will result in full out-of-pocket payments. The expansion of primary care benefits to the entire enrolled population under PHIC should be considered. The fiscal sustainability of a comprehensive benefits package will be ensured by undertaking measures such as: (i) capturing out-of-pocket payments by enrolling persons outside PHIC coverage, especially the non-poor working in the informal sector, (ii) improving the efficiency of current expenditures, (iii) channeling additional intergovernmental transfers conditional on need. Action 2.2 Implement Comprehensive Reform of the PHIC 22. The PHIC plays an extremely critical role in helping the country achieve improved health outcomes and financial protection. As the single-purchaser in the health system, it must exert itself fully to ensure that members have adequate coverage and are able to access quality services in a timely manner. Moreover, to increase its coverage, PHIC, in coordination with the Government, has to implement a comprehensive program for enrolling informal sector workers. In addition to enhancing resource mobilization and risk pooling, PHIC will have to devote time and attention to converting itself into an active purchaser of health services, using contracting as a tool to achieve better quality services at reasonable costs for its members. This major reform of PHIC will require among other, overhaul of the outdated information systems and processes. Full implementation of modernized systems and processes is expected to take at least 3 years and cost approximately US$6 million (276 million pesos). Other related actions include: the integration of evidence-based medicine into reimbursement decisions by PhilHealth; and, the determination of how the relatively large PHIC reserves (over 90 billion pesos) can be used for co-financing premiums for the uninsured (for example, in the informal sector) as well as for improving operational efficiency of PhilHealth. Retraining staff to focus on the PHIC modernized functions also needs to be part of the program.
PHILIPPINES Discussion Note No.11: Health June 2011
DN11-11
Policy Area 3: Health Services Delivery System Reform
Action 3.1 Develop and Implement a needs-based facilities and health personnel master plan 23. The DOH will provide leadership in the development and implementation of the needs-based facilities master plan and human resources for health (HRH) master plan to determine how the distribution of health sector inputs can be rationalized to ensure equity and efficiency. This master plan will also, in the future, be used to determine “certificate of needs” for expansion of private health facilities and identify, jointly with PHIC, mechanisms to encourage expansion of public or private sector inputs to improve access to health services. Action 3.2 Implement health facility autonomy 24. Most of the provider payment reforms planned under PHIC are likely to have little impact until health care institutions have fiscal and institutional autonomy over budgets, hiring and firing of staff, and in determining investments. Performance-based approaches at the facility level, as well as quality improvements, will also have limited impact without greater health facility autonomy. To take this reform agenda forward, the DOH needs to provide the leadership in the development of a “road map” for facility reform that can then be taken forward jointly with other stakeholders in the health sector, including LGUs and PHIC. Policy Area 4: Strengthened Stewardship of the Health Sector and Focus on Emerging Public Health Challenges Action 4.1 Support implementation of health information systems for improved monitoring and evaluation and regulation of the health sector 25. To effectively carry-out functions such as monitoring and evaluation, evidence-based policy-making and regulation, the DOH requires modernization of its information systems and staff capacity-building. In order to do this, DOH will need to (i) build a cadre of trained staff (ii) implement a higher level group within the DOH that is able to oversee efforts in this area, (iii) develop standards to facilitate the integration of existing systems and provide the foundation for building further applications, and (iv) develop new, orchestrated support mechanisms for hardware/software support and training. Action 4.2 Integrate the prevention of non-communicable diseases and road accidents into public health and primary health care services 26. DOH needs to identify how non-communicable diseases are affecting poor households and the factors for NCD burden among the poor. This needs to be followed by a strategy to address NCDs within the broader context of public health and primary health care services. Addressing trauma needs to be a part of this strategy.
PHILIPPINES Discussion Note No.11: Health June 2011
DN11-12
References
World Bank. 2010. The Philippines: Health Sector Assessment: power point presentation on preliminary findings and policy Options. The World Bank, Washington DC _________. 2009. Inclusion Growth in the Philippines. Chapter on Health, Nutrition and Population, In Draft, The World Bank, Washington DC National Statistics Office (NSO) [Philippines] and ICF Macro. 2009. National Demographic and Health Survey. 2008. Claverton, Maryland, National Statistics Office and ICF Macro. World Bank. 2007. On Streamlining the Core Business Processes of PHIC. Report by Dennis Streveler. The World Bank, Washington DC. _________. 2006. National Sector Support for Health Reform Project, Project Appraisal Document (PAD), Report # 35405-PH, International Bank for Reconstruction and Development, The World Bank. _________. 2005. Second Women’s Health and Safe Motherhood Project. Project Appraisal Document, Report # 31456-PH, International Bank for Reconstruction and Development, The World Bank.
Note prepared by: Sarbani Chakraborty and Eduardo Banzon with inputs from: Roberto Rosadia, George Schieber, Ajay Tandon, Loraine Hawkins, Dennis Streveler and Oscar Picazo The World Bank
DN12-1
�����������������������������������������������Accelerating Progress in Basic Education Attainment
S PT P
F
P M D G TP
T P
A. The Philippines Today: Progress and Challenges Key Challenges 1. To most Filipinos, good education is the pathway to a richer, healthier and more secure life. For the poor especially, it is the single most important means of escaping poverty. Good education enables children to develop lifelong learning skills and take advantage of opportunities for gainful employment and self-employment in a rapidly changing and increasingly globalized economic environment. For these reasons, access to good education must rank among the top priorities of any government administration. 2. Improving access to education, particularly for the poor, is a major challenge in the Philippines. Since the late 1990s, the Philippines has lost ground to its neighboring countries – as enrolment rates significantly increased for these countries, the Philippines experienced a reverse in trends. Both elementary and secondary enrollment rates have declined from the peaks of over 90 percent and 70 percent in the 1990s to 84 percent and 60 percent respectively in 2008.124 Of the children 16 years or younger who are in school, the proportion increases by expenditure quintile: from 85 percent in the poorest quintile to 98.1 percent in the richest (Figure 1). Gaps in access are also evident between poor and non-poor areas: for example, in the ARMM, only 82.9 percent of children 16 years or younger attended school compared to the national average of 91 percent, and 94.7 percent in the National
124 Based on estimates from the Basic Education Public Expenditure Review (World Bank, forthcoming). Official estimates from DepEd’s Basic Education Information System are higher by 1 percentage point. These observations point to the urgent need to develop more reliable and consistent enrolment data to have a more accurate view of enrolment trends in the Philippines.
PHILIPPINES Discussion Note No.12: Basic Education June 2011
DN12-2
Capital Region (NCR); see Figure 2. The secondary education Net Enrolment Rate (NER) is a low 59.4 percent. Furthermore, elementary and secondary NERs have stalled or even declined during this decade (Table 1). As a result, the Philippines compares unfavorably with other countries in education attainments125 and may miss the MDG for universal primary education by 2015; Table 2.126
Figure 1: Percentage of Children in School, by Quintile
Figure 2: Percentage of Children in School, by Region
A HH P
R
P
E Q
W
E�Z
/
�
�s
�
�>
��>���Z�KE
D/D�ZKW�
�
t
�s
�
�s
�
�s
�
�W
E
�D
�
K̂��<̂�Z'�E
��Z
�ZDD
�
P
R
3. The low quality of basic education is also a challenge. While the latest available data on the National Achievement Test (administered to Grade 6 and Second Year High School students) show that results have begun to improve at the national level, overall achievement levels continue to be mediocre. Average test scores of Grade 6 students improved from 55 percent in 2005-2006 to 65 percent in 2007-2008, but the average achievement level remains mediocre for Mathematics, Science and English (about 60 percent). Overall, the achievement levels are poor at the secondary level, with mean scores in Mathematics and Science remaining below 50 percent. The average test score of Filipino eighth grade children was only 378 in Mathematics against the international average of 466 of participating countries in the Trends in International Math and Science Study (TIMMS) of 2003 (See Table 1). Results were similar for Science.
Table 1: Selected Philippine Education and Demographic Indicators: 2002-2008
Indicator 2002 2003 2004 2005 2006 2007 2008 Net Enrolment Rate (Elementary, %) 90.69 89.30 87.36 84.83 83.87 83.60 83.75 Net Enrolment Rate (Secondary, %) 59.48 60.85 59.85 58.55 58.39 58.48 59.38 Total Education Spending as % of GDP 3.39 3.24 2.86 2.68 2.65 2.70 2.63 Total Education Spending Per Student; PhP 7,112 7,067 6,688 6,619 6,818 7,403 7,403 School age population (Ages 7-17); thousands 20,280 20,543 20,796 21,041 21,275 21,501 21,723 Basic Education Spending, as a % of GDP 2.91 2.76 2.42 2.29 2.26 2.32 2.27 Basic share of Total Education Spending (%) 85.84 85.19 84.62 85.45 85.28 85.93 86.31 Education share of Total Gov’t Spending (%) 22.65 21.75 21.45 20.31 19.63 19.07 19.75 Sources: World Bank-World Development Indicators and World Bank (forthcoming), 2010 Philippines Basic Education Public Expenditure Review. Note: All spending figures are in 2002 prices and include both local and national levels.
125 According to a recent report from UNESCO (2010), the Philippines trails behind Tanzania and Zambia, and has fallen behind Indonesia. 126 That would be shameful, considering that in the 1980s, the Philippines was projected to reach universal primary education by the 2000s, or much earlier than the MDG target date of 2015.
Source: Basic data from 2004 Annual Poverty Indicators Survey (APIS)
Source: Basic data from 2004 Annual Poverty Indicators Survey (APIS)
PHILIPPINES Discussion Note No.12: Basic Education June 2011
DN12-3
Table 2: Education Outcomes in the Philippines and Selected Countries Net Enrollment Rate
(2007) 2003 TIMSS: Average Test
Scores of 8th Graders
Elementary Secondary Science Math
Philippines (2007) 83.6 58.5 Philippines 377 378 Philippines (2002) 90.7 59.5 Singapore 578 605 Colombia 88 65 Hong Kong, China 556 586 India 89 n.a. International ave. 473 466 Indonesia 95 60 Korea 98 96 Malaysia 97 69 Mexico 98 70 Peru 96 72 Thailand 94 71 Source: For enrolment rate: World Bank (forthcoming), 2010 Philippines Basic Education Public Expenditure Review for the Philippines; and World Bank-World Development Indicators for other countries. For student achievement scores: Trends in International Mathematics and Science Study (TIMSS), 2003.
4. Demand and supply side issues contributing to poor education outcomes. Lack of demand for good education due to income poverty is a fundamental factor for low education outcomes (King and Orazem 1998). Until recently, the main instruments for raising demand have been to reduce school fees and making it easier for children to physically access public schools. Now that almost all communities have a complete elementary school, the impact of further reductions of distance to schools on enrolment and completion rates has become more limi ted. Conditional Cash Transfer (CCT) programs such as the government’s Pantawid Pamilyang Pilipino Program (4Ps) have been found empirically to be highly effective in raising demand for schooling, in addition to reducing poverty, in many countries, including Brazil, Colombia, and Mexico (Fiszbein and Schady 2009). On the supply side, the Philippine public school system is chronically short of classrooms, teachers and educational materials in many areas, and pedagogical practices are often ineffective. 5. Public resources allocated to education have been persistently low and declining as a share of total government budget and GDP (Table 1). Real government spending on education declined over the last ten years from over 4.2 percent of GDP in 1998 to 2.6 percent of GDP in 2008. Real government spending on basic education also declined every year from 2.9 percent in 2002 to about 2.3 percent of GDP in 2005. This also translates into a steady decline in real spending per student from 2000 to 2005. Despite the slight improvements in the fiscal circumstances, the share of national government spending on the education sector as a whole declined, with the share of basic education falling more sharply from 19.1 percent in 2002 to less than 15 percent in 2008. In addition, government spending on basic education has not kept pace with the rapidly growing school-age population which has put increasing pressure on the public budget. Actual spending stagnated also because of the government’s, especially the Department of Education’s (DepED), inability to spend the full amounts appropriated in the annual budgets. Recent case studies revealed slow and incomplete budget execution by the DepED due to operational inefficiencies and instability in the sector’s policy environment.
PHILIPPINES Discussion Note No.12: Basic Education June 2011
DN12-4
6. Low student learning achievement is likely to undermine economic growth and other benefits from additional years of schooling. They also erode the country’s early advantage in emerging industries. Evidence shows that contrary to previous observations, the availability of workers with competencies needed in emerging industries has been tightening, as reflected by the rise in the wage premium for those workers (Hanushek & Wobman, 2007; Di Gropello, 2009). Such tightening reflects the unresolved issues that affect not only basic education, but post-basic education as well. Recent Reforms 7. In response to the challenges in basic education, the government commissioned a variety of studies, pilots, and reform plans. It introduced policy actions to mitigate input shortages (such as textbooks and school buildings), and has revised the basic education curriculum, teacher training, and instructional policies. Yet, these policy actions have not produced sustained and system-wide improvements in outcomes. Reform measures were often fragmented and isolated, and failed to strengthen performance accountability and incentives, or to build a strong constituency for change. 8. In 2005, the government developed the Basic Education Sector Reform Agenda (BESRA), which is a sector-wide program that seeks to improve the quality of schools in a decentralized environment. The program is based on lessons from international research and draws from local experiences with successful pilots of school-based management (SBM), especially the Third Elementary Education Project (TEEP) and the Basic Education Assistance for Mindanao (BEAM) Project. B. Where the Philippines Could Be: Policy Options
Table 3: Summary of Key Policy Areas and Actions
Policy Area 1: Universal Primary Education and Increased Secondary Net Enrolment
Action 1.1 Intensify support for affirmative action for the poor and marginalized groups Action 1.2 Provide complementary support for the CCT program Action 1.3 Expand the provision of private education services Action 1.4 Build schools and classrooms in areas with no nearby private schools
Policy Area 2: Improved Quality of Education Action 2.1 Consolidate and advance critical basic education sector reforms Action 2.2 Independently review NAT Action 2.3 Improve the curriculum and length of schooling Action 2.4 Address efficiency and equity concerns Action 2.5 Revise the system of performance incentives for teachers/principals
Policy Area 3: Increased Basic Education Budget and Strengthened Institutions Action 3.1 Increase public spending on basic education
PHILIPPINES Discussion Note No.12: Basic Education June 2011
DN12-5
Action 3.2 Improve utilization of education resources 9. The Philippines has the potential to attain much better education outcomes. In particular, the objectives of (i) achieving universal primary education, (ii) significantly improving the quality of basic education, and (iii) reducing education inequality are not out of reach. This potential is evident from the faster rates of progress in education attainment achieved by developing countries that once lagged behind the Philippines. To achieve these higher outcomes, however, the government administration will need to be selective in focusing its basic education reform agenda on several strategically critical issues. Policy Area 1: Universal Primary Education and Increased Secondary Net Enrolment Action 1.1: Intensify support for affirmative action for the poor and marginalized groups 10. Programs that address the special education needs of these groups need to be fortified. Important actions to support these programs are the (i) implementation of a six-year basic education strategic plan that puts in place reforms, but relevant to the socio-cultural context of ARMM, (ii) adoption of alternative modes of education delivery to address the needs of congested schools, out-of-school youth, disaster and conflict-prone areas, and, (iii) innovations for improving adult literacy and entrepreneurial skills and opportunities. Action 1.2: Provide complementary support for the CCT program 11. Drawing on the lessons learned from international experience and evaluation of similar programs in different countries, the CCT/4Ps program has been designed to simultaneously improve the consumption, education, and health of extremely poor families. This program is being progressively expanded with the aim of covering all extremely poor families. In planning the deployment of teachers, construction of classrooms and provision of educational materials and other assistance, the DepED needs to prioritize the CCT/4Ps communities to ensure that the increased demand for education generated by the CCT/4Ps program is complemented by an adequate supply of education services. Action 1.3: Expand the provision of private education services 12. An important option for educating children that cannot be accommodated by the existing public schools is to private schooling in return for an agreed price per student (capitation) to be paid by the government. The Philippine experience shows the Education Service Contracting (ESC) Program improves school quality, relieves congestion in public high schools, maintains the financial viability of private secondary schools (more than one-third of private secondary school enrollments are supported by the program), keeps the overall costs of public secondary education in check, and encourages households to invest in education. (Patrinos et al, forthcoming). The experience in some countries, like Colombia (Angrist et al, 2002), shows that voucher schemes can also be highly cost-effective, provided they are appropriately designed and regulated. Expansion of the current Philippine voucher program, however, is not recommended due to design and governance issues.
PHILIPPINES Discussion Note No.12: Basic Education June 2011
DN12-6
Action 1.4: Focus public school construction in areas without nearby private schools 13. In areas where there are no private schools, schools can be built using community-driven and/or principal-led construction, as both schemes have produced good quality classrooms at reasonable cost, while promoting transparency, accountability and community participation. Policy Area 2: Improved Quality of Education Action 2.1: Consolidate and advance critical reforms in basic educatiton 14. The current reforms to improve teaching and learning practices addresses a wide range of issues through a package of interventions.127 Despite delays in its implementation, it is steadily, albeit slowly, making progress and gaining widespread acceptance among influential advocacy groups and stakeholders. Consolidating and advancing these critical and highly promising reforms is preferable to introducing completely new programs that do not take advantage of ongoing reform efforts. The history of repeated education reforms in the Philippines shows that they have had little cumulative transformational impact, because few have been given enough time to take root, scale-up and mature. Action 2.2: Subject NAT to an independent review 15. The National Achievement Test (NAT) system is an expensive exercise whose main objective is not clear. The NAT scores are not being used for promoting students to the next grade. Instead, it appears that their main purpose is to assess learning achievement outcomes. If this is the main purpose, however, it can be achieved at much lower cost through sample-based testing, and the resulting savings could be used to help fund training of teachers and school heads. It is important, therefore, to review the methodology and objectives of the NAT by an independent board or task-force. Action 2.3: Improve the curriculum and length of the basic education cycle
127Basic education reform initiatives that have shown initial successes include: (i) the implementation of school-based management ; (ii) reduction of rote learning and promotion of active learning by students; (ii) the application of the National Competency-Based Teacher Standards (NCBTS) in the hiring, firing, training, promotion and deployment of teachers (including rigorous impact evaluation of NCBTS applications); (iii) implementation of a Quality Assurance and Accountability Framework (QAAF) and the institution of minimum service standards for inputs, outputs, and outcomes; (iv) building up the capacity of school heads to lead and manage teachers in the transformation of schools into highly effective learning centers; and (v) material support for the implementation of the policy on the use of the mother tongue in the early grades and the improvement of the effectiveness of multi-grade teaching. Additionally, there is a need to determine empirically teacher competencies using objective procedures. At the moment, DepED has no valid and reliable data on teacher pedagogical and subject content competencies. The teacher self-assessment procedure is purely subjective. Given that more than 80 percent of funding goes to teacher salaries, it is important to know the outcomes.
PHILIPPINES Discussion Note No.12: Basic Education June 2011
DN12-7
16. The basic education curriculum needs to be reformed, but such a reform is best carried out as part of the broader discussion on the extension of the Philippine education cycle. Advocates of extension argue that the Philippine education cycle is too short compared to that of other countries, resulting in curriculum congestion and low student learning achievement. An examination of international practice reveals that the Philippines needs to add two more years of equivalent senior secondary education128 to align itself with the 6+3+3+4 international education cycle. Critics of such an extension point out that a longer education cycle does not automatically lead to greater student learning achievement, as shown by a statistical analysis of TIMSS data (Felipe and Porio 2010). For an extended education cycle to yield the desired benefit, it is necessary to ensure that the education system is effective and efficient in producing student learning. Given the current underfunding of education in the Philippines, however, there is a high risk that the introduction of an additional two years of education could come at the expense of deteriorating education opportunities for the poor, as scarce resources and attention may be shifted away from the implementation of the basic education reform. Adding two more years of high school to establish a 3-year senior secondary level of education into the country’s education cycle, therefore, only makes sense if it is accompanied by a commensurate increase in the education budget. 17. The current curriculum is overcrowded and spreads school time too thinly over too wide a variety of subjects and other activities. Proponents of education cycle extension argue that students need more time to learn basic subjects like mathematics, science, reading, and social studies in sufficient depth. An analysis of the current curriculum to identify gaps in basic subjects and assess the implications for additional inputs and outputs including teacher training, educational materials, infrastructure, laboratories and equipment needs should be undertaken. It is critically important to review the core curriculum with a view to identifying the main items of instruction that should be the focus of attention for the eventual two additional years of education. Another option that also deserves consideration is to explore alternatives to increase the actual time on task either by reducing the number of school holidays, or increasing the number of school days or reducing teachers’ absenteeism. Action 2.4: Address efficiency and equity concerns 18. A phased and flexible strategy based on public-private partnership may help the authorities address the efficiency and equity concerns arising from a desire to expand education opportunities in spite of tight budgetary constraints. One such strategy to consider is to finance upper secondary education with user (enrollment) fees, while providing an increasing number of scholarships and student loans for deserving poor students. Recipients of scholarships and student loan programs should be free to enroll in a private or a public school.129
128. Most countries today have a 6+3+3+4 education cycle; that is, six years of elementary, three years of junior secondary, three years of senior secondary, and four years of college education. As the first three years of high school in the Philippines can be regarded as equivalent to junior secondary (according to International Standard Classification of Education (ISCED), the country’s education cycle can be characterized as a 6+3+1+4 system with six years of elementary, three years of junior secondary, one year of senior secondary, and four years of college. 129 To avoid the inefficiency of one-size-fits-all, the number years of upper secondary education required for a college degree should be allowed to vary, depending on the needs of specific tertiary education study programs.
PHILIPPINES Discussion Note No.12: Basic Education June 2011
DN12-8
Action 2.5: Revise the system of performance incentives for teachers/principals 19. Recently, the DepED has tried linking student achievement scores to teachers’ pay and promotion. Though the incentive involved is quite small, it provides a good opening for developing a more powerful outcome-performance bonus scheme. The details of the design of such a scheme need to be carefully thought through, however, and its impact on outcomes on teaching practices and student learning needs to be rigorously tested and evaluated. The empirical evidence on the impact of teacher performance incentive schemes is very mixed. Badly designed schemes, for example, lead to unintended consequences such as greater cheating. Another example of unintended perverse consequences is the policy of financing end-of-the year bonuses through the “savings” achieved by individual work units. This practice has encouraged work units to delay and withhold funding of expenditures on priority education activities. The Administration should consider eliminating or modifying this practice. Policy Area 3: Increased Basic Education Budget and Strengthened Institutions Action 3.1: Increase public spending on basic education 20. Given the rapidly growing school-age population, persistently low public spending on education and magnitude of the education reform challenges, additional resources for the basic education sector are needed. Meeting the MDG and Education-for-All (EFA) goals in basic education would roughly require some PhP2,113 billion over the period 2011-2015. (See preliminary estimates in Table 3). The necessary budgetary increases to achieve this spending target must come from both the central and local governments. This requires, among others, motivating the LGUs to invest more of their own resources in local education improvements and supporting the empowerment of schools and communities. Examples of actions that can be taken to mobilize additional resources for the basic education sector include:
• Increasing the obligations-to-allocations ratio to 99 percent during the first two years of the new administration;
• Raising the national government appropriations for basic education as a percentage of GDP to between 4.0 to 5.0 percent of GDP by 2015. This would elevate national government funding to a level comparable to international practices for middle income countries;
• Require matching grants from LGUs for national government (NG) assistance to minimize “substitution,” while developing a performance-based formula for allocating a part of the education budget increase.
This should be determined jointly by the Higher Education Institutions and the Commission on Higher Education (CHED).
PHILIPPINES Discussion Note No.12: Basic Education June 2011
DN12-9
Table 4: Estimated Resource Requirements to Achieve MDG (Education) and EFA
Goals (in PhP millions at current prices; 2011-2015)
Action 3.2: Improve utilization of education resources 21. An improved utilization of education resources is critical for translating more inputs into greater outputs and outcomes. Several actions are needed here, beginning with the allocation of additional resources to high priority activities. These priority activities include:
• increasing the availability of classrooms, teachers and educational materials to meet supply gaps through the use of effective targeting system, principal-led construction and rehabilitation of schools/classrooms, and expanded capitation scheme for enrolling school-aged children that cannot be accommodated in public schools in private schools,
• full implementation of the SBM policy, including the provision of flexible school grants and performance bonuses for schools, teachers and local school boards,
• full implementation of the new equity-based School Maintenance and other Operating Expenses (MOOE) formula developed by Boncodin et al. (2009) to allow schools to adequately respond to the needs at their level and provide fiscal space to implement their school improvement plans,
• expanding the CCT and other cost-effective interventions to stimulate schooling demand among poor households, and
• instituting an independent and credible system for the regular monitoring, assessment and public dissemination of the performance of schools, teachers, and local school boards.130
22. Specifically, funding of these activities will strengthen the decision-making authority and capacity of School Governing Councils (SGCs), improve incentives for better teacher and school performance, and increase school accountability.131 It is equally important to ensure
130 The last activity could include the development and institutionalization of regular Public Expenditure Tracking Surveys (PETS). 131 School accountability can be increased by: (i) ensuring regular parent-teacher dialogue on student progress and building the capacity of parents to take full advantage of the opportunity; (ii) establishing regular school “performance accountability meetings” between School Governing Councils and the public; (iii) widening the awareness of parents and community stakeholders regarding SBM policy and improving their capacity to assess
TTY T � GDPTO S MOOEFC
Note: Preliminary estimates were arrived at using available data on input shortages, unit cost, and school-age going population projections as of March 2010 and cost projections of Manasan (2007). This will be further refined by the joint DepED-World Bank-DBM Team preparing the Basic Education Spending Plan.
PHILIPPINES Discussion Note No.12: Basic Education June 2011
DN12-10
that the allocated resources are spent for the intended purposes with minimum delay and leakages. The recent Basic Education Public Expenditure Review (World Bank, forthcoming) reveals that the budget utilization rate, measured in terms of obligations relative to total allotment releases, has fallen from 97 percent in 2004 to 92 percent in 2008. Some education budget items have utilization rates that are even lower. For example, the Maintenance and Other Operating Expenses (MOOE) utilization rate was only 72 percent in 2006-2008. These observations point to inadequate absorptive capacity. C. Quick Wins and Long-term Impact 23. The successful implementation of a reform agenda critically depends on good sequencing. Early victories in the implementation of the reform agenda create goodwill and excitement among education stakeholders. The resulting political capital creates momentum for the passage of more difficult reforms later. 24. There are several strategically important actions that can be taken immediately to launch the reform programs in the three policy areas addressed above. These actions are:
• Issuing an Executive Order mandating the achievement of universal primary enrolment and increased secondary net enrolment as official target, while assigning the budget needed to carry it out (as per Table 3), and taking measures to improve education budget execution,
• Providing block grants directly transferred to schools with clear and transparent guidelines for accountability as well as full implementation of the new equity-based school MOOE allocation formula,
• Reducing the number of school holidays and teachers’ classroom absences, • Strengthening the decision-making authority and capacity of the School Governing
Councils (SGCs) and promoting regular school “performance accountability meetings” with the public,
• Providing adequate budget for educational materials and training of teachers supporting the mother tongue language policy and those teaching in multi-grade classes, and
• Developing and pilot-testing more powerful performance bonus schemes for teachers and schools.
25. These actions are expected to have an immediate positive impact on basic enrollment and other education outcomes. Together with the other actions proposed earlier, they could usher in a more rapid and sustained pace of education progress. As the Philippine Human Development Report 2008/2009 (Human Development Network 2009: 72) points out, school performance rises significantly when ‘in addition to greater autonomy, schools are provided with local capacity building, have established rigorous external accountability through close relations between schools and communities, and have been
school performance; and (iv) instituting and disseminating regular report cards on the performance of the Local School Boards for the quality of their support to schools.
PHILIPPINES Discussion Note No.12: Basic Education June 2011
DN12-11
stimulated to innovate.’ The experience in the Philippines’ Third Elementary Education Project, in particular, strongly indicates that the impact of school-based management on student learning is positive and remains substantial even after completion of the project. This impact is expected to be further raised in the long run with the development of a stronger culture of accountability for performance and the establishment of incentives to encourage improved education. It is critical, however, that the basic education reforms be allowed to mature and take root. Successful reforms in other countries normally take years, if not decades, of sustained and cumulative implementation of incremental and, sometimes, more radical reforms. References Alvarez, Jesus, Vicente Garcia Moreno, and Harry Patrinos (2006). “Institutional Effects as
Determinants of Learning Outcomes: Exploring State Variations in Mexico.” Washington DC: The World Bank.
Angrist, Joshua, Eric Bettinger, Erik Bloom, Elizabeth King and Michael Kremer (2002). “Vouchers
for Private Schooling in Colombia: Evidence from a Randomized Natural Experiment.” American Economic Review 92, No. 5: 1535-1558.
Boncodin, Emilia and Honesto Nuqui (2008). “Study on the Equitable Allocation of the Department of
Education’s Maintenance and Other Operating Expenses (MOOE).” Manila: AusAID. Di Gropelo, Emanuela (2009). “Philippine Skills Study Report.” Washington DC: The World Bank. Felipe, Abraham and Carolina Porio (2010). “Length of School Cycle and the Quality of Education.”
Unpublished. Fiszbein, Ariel, and Norbert Schady with Fransciso H.G. Ferreira, Margaret Grosh, Nial Kelleher,
Pedro Olinto, and Emmanuel Skoufias (2009). “Conditional Cash Transfers: Reducing Present and Future Poverty.” Washington DC: The World Bank.
Hanushek, Eric and Ludger Wobmann (2007). “The Role of School Improvement in Economic
Development.” World Bank Research Working Paper 4122. Washington DC: The World Bank.
Human Development Network (2009). Philippines Human Development Report 2008/2009:
Institutions, politics, and human development. Jimenez, Emmanuel, Marlaine Lockheed, and Vicente Paqueo (1991). “The Relative Efficiency of
Private and Public Schools in Developing Countries.” World Bank Research Observer, Oxford University Press, Vol 6 (2).
Manasan, Rosario G. (2007). “Financing the Millennium Development Goals: The Philippines.” PIDS
Discussion Paper Series No. 2007-06. Makati: PIDS.
PHILIPPINES Discussion Note No.12: Basic Education June 2011
DN12-12
Orazem, Peter and Elizabeth King (2007). “Schooling in Developing Countries: The Roles of Supply, Demand and Government Policy,” Chapter 55, Handbook of Development Economics, Volume 4, T.P. Schultz and J. Strauss (eds.). Amsterdam: Elsevier B.V. Press.
Orbeta, Aniceto (2008). Background Paper on Higher Education. Manila. Unpublished. Patrinos, Harry Anthony, Lynnette Perez, Juliana Guaqueta, Emilio Porta, Honesto Nuqui, and
Michael Alba (forthcoming). “Philippines Education Service Contracting Study.” Draft. Manila.
UNESCO (2010). EFA Global Monitoring Report 2010: Reaching the marginalized. Paris:
UNESCO/Oxford University Press. World Bank (forthcoming). “Philippines Basic Education Public Expenditure Review.” Draft. Manila. Note prepared by: Lynnette Dela Cruz Perez,and Rozanno Rufino (EASHD) and Ken Vine (AusAID)
DN13-1
������������������������������ � � � � � � ���� ��������������������For Inclusive Growth Innovation and Competitiveness K
I A
, T
P T
. A. The Philippines Today: Progress and Challenges 1. Advanced skills are essential for improving long term innovation potential and competitiveness. As the Philippines moves up the value-added chain, the types of skills demanded will change towards a greater focus on more sophisticated technical and high-level generic skills. While the tertiary sector is not the only determinant, it is clearly the main source of academic and technical skills. Higher education in the Philippines today consists of 2,060 public and private higher education institutions, enrolling about 2.5 million students (in 2007) with about 380,000 graduates annually. The majority of these higher learning institutions (about two-thirds) are privately owned and managed without subsidies from the Government. 2. The Philippine system of higher education faces important obstacles that hamper its capacity to fulfill its mission of contributing to the country’s future economic and social development.132 These obstacles include barriers to equitable access, problems of quality, a lack of accountability and an inadequate financing framework. Access to Higher Education 3. Enrolment in higher education has been stagnant in recent years. In the 1960s and 1970s, the Philippines had one of the highest rates of tertiary education enrolment in East 132 The Medium-Term Philippine Development Plan for Higher Education (MTPDP) 2005-2010 and the Philippines Main Education Highway: Towards a Knowledge-based Economy 2008 provide the overall government direction for the tertiary education sector. The Government’s 1992 Manual of Regulations for Private Schools, which eased the procedures for the establishment of private schools and resulted in the growth of private higher education institutions, and the tri-focalization of basic education, higher education and technical education and vocational training in 1994 deeply influence sector governance and management. The Commission on Higher Education (CHED), created under the Higher Education Act of 1994 is responsible for formulating and implementing policies, plans and programs for the development and efficient operation of the system of higher education in the Philippines.
PHILIPPINES Discussion Note No.13: Higher Eucation June 2011
DN13-2
Asia and the Pacific. Since then, enrolment growth in the other countries has outpaced the Philippines, the regional average enrolment rate to catch up. At about 28 percent, tertiary enrolment rate to catch up. At about 28 percent, tertiary enrolment in the Philippines is still slightly higher than the world average and the East Asia & Pacific regional average (26 percent), but well below the average in Thailand (48 percent) and Malaysia (33 percent). Of greatest concern is that the tertiary gross enrolment rate (GER) has remained stagnant in the last 20 years, and even declined slightly (from 29 percent in 1990 to 28 percent in 2007. If this trend continues, the Philippines will soon fall below the regional average. 4. The demand for workers with higher education in the Philippines appears to be outpacing the supply of skilled workers. One sign of the high demand for skilled labor relative to their supply is that the rates of return to education since the 1990s have been highest for workers that completed a college degree or have a post-graduate education (Figure 2). Furthermore, the rate of return for college graduates has been rising over time, which suggests that the supply of workers with a college or post-graduate degree is not keeping up with demand.
Figure 2: Rates of Return by Economic Sector
Source : World Bank (2009, “Philippines Skills Report.”
Figure 1: Tertiary Gross Enrolment Rates
P
T
M
C
USA
E A P
W
Source: World Bank Development Indicators
05
1015
200
510
1520
1990 1995 2000 2005 1990 1995 2000 2005
All Sectors Agriculture
Industry Services
Primary High SchoolCollege Degree/Postgrad
Per
cent
year
Graphs by sector
PHILIPPINES Discussion Note No.13: Higher Eucation June 2011
DN13-3
5. In general, the poor have less access to higher education. There is also a significant gender dimension among the poorer deciles of the population, with poor males faring the worst (Figure 3). Since tertiary education is largely provided by private institutions that charge tuition fees, the average cost tends to be beyond the means of most Filipino families. Studies have found that only the richest 30 percent of families can afford higher education for their children when choosing public institutions and only 10 percent can afford private higher education. While the CHED administers the Private Education Student Financial Assistance (PESFA) scheme, even the maximum subsidy fails to cover the full cost of tuition, let alone living expenses. Moreover, coverage of this financial assistance scheme is limited: in 2005-2006 it covered less than 3 percent of the tertiary student population. Quality of Higher Education 6. Philippine universities do not rank high in world comparisons. The US News and World Report ranked two top Philippine universities – Ateneo de Manila University and the University of the Philippines – only as 234th and 202nd respectively. None of the Philippine universities or colleges was included in the 2010 World University Ranking produced by Shanghai Jiaotong University. (In contrast, Thailand has four universities rated among the top 200, and Indonesia has one.) 7. There is a general lack of international benchmarking on higher education institutions and graduates. Several proxy indicators of quality of higher education suggest that there is much room for quality improvement in higher education. In particular,
• Low quality secondary education. Results from the 2003 TIMSS assessment indicate that Filipino students have serious weakness in academic subjects of mathematics and science. In mathematics, its 8th graders (average score of 378) perform well below the international average of 467, and also below that of Indonesia (411) and Morocco (387). The same is true with science.
• Short cycle of secondary education. Secondary education in the Philippines has only 4 years. Thus, students entering the higher education system only have 10 years of basic education, compared to 12 years of basic education in most other countries. This means that the average student entering higher education in the Philippines is (16 years) and less educated students than the average student elsewhere in the world.
• Sixty percent of faculty in higher education only has a bachelor degree. Students in the Philippines enjoy a relatively comfortable student-teacher ratio of about 20 to 1. However, only 31 percent of the teaching faculty have a master’s degree and 9 percent have a PhD degree. The remaining 60 percent only have a bachelor’s degree. The prevalence of bachelor’s degrees among the faculty tends to be even higher in private institutions.
Figure 3: Tertiary Attendance by Gender
M
F
Source: Family Income and Expenditure Survey
PHILIPPINES Discussion Note No.13: Higher Eucation June 2011
DN13-4
• Passing rates for professional licensure exams are low. A high proportion of students in the Philippines are enrolled in professional fields that are intended to lead directly to employment.133 The average passing rate for the 2005 professional licensure examination is only 39 percent. Moreover, the overall trend indicates that the passing rate has been decreasing in the past few years.
Internal Efficiency 8. The indicators of internal efficiency for the Philippine higher education system are similar to those of Malaysia and the worldwide average. The proportion of students who reach the final years of tertiary education is about 66 percent, while the proportion of college entrants who graduate rose from 46 percent (mid-1990s) to 61 percent (2003/2004). Using UNESCO’s gross graduation rate134, 20 percent of the tertiary age range manage to graduate from higher education in the Philippines. Emerging Skills Gaps 9. Many of the skills required in today’s economy are in short supply. The Philippines Skills Report (2009) documents skill gaps that manifest themselves by the difficulty in finding the right skills to fill vacancies. Such gaps are evident in the service and manufacturing sectors, and particularly in the export sectors and in sub-sectors such as chemicals, trade and finance. Detailed surveys of firms and employee skills reveal skill gaps both in academic subjects as well as in generic life skills, including problem-solving, leadership and communication skills. The Report further concludes that though there are multiple causes for emerging skill gaps, including those related to overall skill supply (quantity-quality) and the labor market, the most prominent constraints are the quality and relevance of education and training.
Figure 4: Difficulty Finding Right Skills - Sector Figure 5: Time to Fill Professional Vacancies (weeks)
Difficulty Finding Right Skills - Sector
0.0 10.0 20.0 30.0 40.0 50.0 60.0
Directors/Managers
P rofessionals
Administrative
Sales workers
S killed Production
Unskilled workers
% Saying Ve ry and Rather Difficult
Manufacturing Servi ces
0
1
2
3
4
5
6
7
Cambodia China Indonesia Malaysia Mongolia Philippines Thailand Vietnam Korea,Republic
Source: World Bank (2009), “Philippines Skills Report.” Source: World Bank (2009), “Philippines Skills Report.”
133 The composition of university student enrolment is as follows: 23 percent are enrolled in business administration and related fields, 18 percent in medical and related fields, 15 percent in education science and teacher training, and 13 percent in engineering and technology. 134 Gross graduation rate is defined as the number of graduates regardless of age in a given level or program expressed as a percentage of the population at the theoretical graduation age for that level or program.
PHILIPPINES Discussion Note No.13: Higher Eucation June 2011
DN13-5
Capacity for Research and Development 10. A related challenge is the country’s ability to innovate and the need to improve the quality and quantity of scientific research and development. The Philippines spent about 0.11 percent of its GDP on research and development compared to an average of 1.61 percent for East Asia. (China currently spends about 1 percent of GDP on research and development.) The capacity for research in Philippine higher education institutes (HEI) is notably weak, with virtually no research activity taking place in the HEIs except for that associated with the pursuit of graduate degrees.135 Using a composite index taking into account basic requirements including infrastructure and human capital, efficiency enhancers, and innovation factors, the Global Competitiveness Report 2010 ranks Philippines the 87th out of 133 countries, well behind China (29), Indonesia (54), Malaysia (24), Thailand (36), and Vietnam (75). The Philippines also tends to lag behind the other comparator countries in two pertinent sub-indicators that make up the Global Competitiveness Index, namely the quality of Higher Education & Training and Technological Readiness. Higher Education Finance 11. The Philippines is one of the 10 countries worldwide with the lowest amount of public spending per tertiary student.136 Between 2005 and 2007, public expenditure for higher education per capita only amounted to 11 percent of GDP per capita, compared to almost 60 percent in Malaysia, 18 percent in Thailand, and 24 percent in East Asia on average. This low level of tertiary education financing largely reflects a low amount of public spending on education in general. In recent years, total public spending on education in the 135 Tan (2010) has noted: “a growing awareness on the part of the executive and legislative heads of the government and business and academic leaders that the country’s innovation system is very weak and seriously lags behind what all its high performing neighbors have created. They realize that this weakness partly explains the relatively poor performance of the economy especially its agriculture and manufacturing sectors.” 136 The others are Kazakhstan, Cambodia, Korea, Peru, Azerbaijan, Chili, Tajikistan, Russia, and Oman.
Table 1: Global Competitiveness Rankings, 2009/2010
Global Competitiven
ess Index
Higher Education
& Training
Technological
Readiness
Philippines China Indonesia Malaysia Thailand Vietnam
87 29 54 24 36 75
68 61 69 41 54 92
84 79 88 37 63 73
Source: World Economic Forum, Global Competitiveness Report 2009-10 Note: The rankings are based on a total sample of 133 countries
Figure 6: Share of GDP Spent on Education (%)
Source: UNESCO Institute of Statistics (2009)
PHILIPPINES Discussion Note No.13: Higher Eucation June 2011
DN13-6
Philippines has been only 2.6 percent of GDP, which is significantly lower than in other countries, both in the region and outside; the world average is 4 percent of GDP. (See Philippines Discussion Note No. 4 on Public Expenditures.) Table 2: Public Expenditure per Tertiary Student as a % of GDP Per Capita
S G E D UNESCO I S
12. Proliferation of low quality public higher education institutions. On average, 14 percent of the total government education budget goes to supporting public State Universities and Colleges (SUCs). While a moratorium on the establishment of SUCs was issued in October 1999 as part of the government’s policy to rationalize higher education financing, a number of proposals/bills for the creation and/or conversion to SUCs have been received by Congress during the current administration, with a few actually being created in the last several years. A number of Local Universities and Colleges (LUCs) have also increased by 191 percent i.e. from 28 in 1994-95 to 42 in 2002 to 70 by end December 2007. These LUCs were established and are financially supported by local governments through mere resolutions and ordinances and are not subject to CHED supervision. More importantly, many of these LUCs do not appear to be very effective in generating basic outcomes in quality, access, and equity. Poor Quality Assurance Framework 13. Accreditation remains voluntary and the extent of accreditation is low. A consortium of accrediting agencies is organized into the Federation of Accrediting Agencies of the Philippines (FAAP) for private institutions and the National Network of Quality Assurance Agencies. As of 2007, fewer than 20 percent of higher education institutions had at least one program accredited and more than 65 percent of the accredited programs were at most Level 2.137 In a country with a multiplicity of institutions, establishing a proper accountability framework is critical for ensuring quality. CHED could provide incentives for gaining accredited status by giving accredited schools priority in the provision of grants and financial assistance, as well as administrative autonomy and financial deregulation.
137 Accreditation criteria are defined as follows: Level 1: Granted initial accreditation for three years; Level 2: Re-accredited for 3 to 5 years; Level 3: Re-accredited and have met additional criteria involving standard of instruction and community extension and at least two of the following: research tradition, faculty development tradition, performance in licensure examinations, linkages with other schools and/or agencies, library and learning facilities.
EAP ECA LAC MNA SAS SSA WAMM
PHILIPPINES Discussion Note No.13: Higher Eucation June 2011
DN13-7
B. Where the Philippines Could Be: Policy Options 14. The Philippines is due to update its Medium Term Development Plan for Higher Education (2002-2010). In that context, the administration could consider the following set of policy actions.
Table 3: Summary of Key Policy Areas and Actions Policy Area 1: Improving the Effectiveness of Public Expenditure for Higher Education
Action 1.1 Increase public expenditures on education Action 1.2 Enforce the moratorium on the creation of and/or conversion to SUCs and stem the creation of low-quality LUCs Action 1.3 Link subsidies to performance Action 1.4 Encourage innovation and research
Policy Area 2: Improving the accountability framework for public and private institutions
Action 2.1 Systematize accreditation and promote use of information Action 2.2 Consolidate or close non-performing institutions
Policy Area 3: Improving Access and Equity
Action 3.1 Increase public funding for scholarships and student loan schemes Policy Area 4: Improving Quality and Relevance
Action 4.1 Improve funding and incentives for upgrading faculty qualifications Action 4.2 Improve pre-college preparation to improve tertiary outcomes Action 4.3 Review tertiary curriculum and pedagogy Action 4.4 Foster university-industry linkages Action 4.5 Develop a learning culture and undertake research to improve quality and relevance
Policy Area 1: Improving the Effectiveness of Public Expenditure for Higher Education Action 1.1 Increase public expenditures on education 15. The overall expenditure on education as a percentage of GDP is low compared to the world average of 4 percent and there is room to further increase allocations. As the overall education budget is increased, the authorities could consider increasing expenditures on higher education proportionately, without changing the intra-sectoral shares. Any increase in public resources devoted to higher education should target critical areas of quality and equity, and promote increased institutional accountability. Action 1.2 Stem the creation of low quality public higher education institutions The Commission on Higher Education needs the support of the Executive Branch to stave off the establishment of low quality SUCs and LUCs through the strict enforcement of the
PHILIPPINES Discussion Note No.13: Higher Eucation June 2011
DN13-8
moratorium on the creation of and/conversion to SUCs of tertiary education institutions and the issuance of policy to restrict the further creation of poor quality LUCs. The Executive Branch should also impress upon the LGUs and LUCs on the need to put the LUCs under the supervision of CHED just like any other public or private higher education institution. Action 1.3 Link subsidies to performance 16. In the medium and long term, CHED could consider phasing out the historically-based financing practices and link the amount of government subsidy to institutional performance through formula-based funding, unit cost-based funding, or performance-based agreements. To prepare for that, it is necessary that CHED update its information on unit costs in higher education institutions by programs. Action 1.3 Encourage innovation and research 17. The government could also consider directing a portion of the budget expenditures on higher education to competition-based financing of innovation and strategic projects. Many countries have introduced competitive funding mechanisms in the financing of higher education. A prominent example is Chile (Box 1). The competitive funds can be used both for boosting the quality of teaching and learning, and for research. Box 1: Financing of Higher Education in Chile Chile has made tremendous progress in tertiary education. The gross tertiary enrollment rate is now 38 percent compared to 25 percent in the early 1990s. In the past decade, the government consolidated various funding instruments into the following categories: funding based on historical practices and negotiations, student aid including scholarships and loans, academic innovation funds and performance based agreements, and research funds. To date, about 23 percent of total higher education financing is allocated through competitive and performance-based grants, including both public and private institutions. Policy Area 2: Improving the accountability framework for public and private institutions Action 2.1 Systematize accreditation and promote use of information 18. The institutionalization and systemization of the accreditation system would promote the quality assurance framework for institutions and programs, and help to link accreditation with financing instruments. Publication and dissemination of higher education institution performance indicators, including accreditation status, would help students and families make informed choices about universities and would contribute to overall improvement in quality over time.
PHILIPPINES Discussion Note No.13: Higher Eucation June 2011
DN13-9
Action 2.2 Consolidate or close non-performing institutions 19. CHED could close several failing and/or non-performing institutions. This, together with regular publication and dissemination of outcomes (e.g., board examination results) and accreditation results, would signal a commitment to improved quality. Such signals would guide and influence the behavior of tertiary education institutions. Weeding out non-performing programs and institutions is one of the more effective ways of improving the quality of tertiary education output. Recent closures of law departments of some higher education institutions for consistently not producing graduates able to pass the bar examination is encouraging and a good policy to build on. Policy Area 3: Improving Access and Equity Action 3.1 Increase public funding for scholarships and student loan schemes 20. Despite its long history, public scholarship programs have remained limited in scope. The virtual absence of student loan programs is also lamentable. Expanding the coverage of the scholarship program and configuring a student loan program should be a priority. The merits of student loan schemes have been well documented. They include having students bear a higher portion of the costs of higher education (thereby contributing to cost recovery), promoting greater inclusion of low-income youth, allowing greater financial independence from parents, and being more cost effective than keeping low tuition fees for all or simply awarding grants and scholarships. Ideally, the student assistance programs should be portable so that students could use them for attendance in public and private institutions. (Box 2 summarizes the experiences in Colombia and Mexico with student loan schemes).
Box 2: Student Loan Schemes in Mexico and Colombia
Mexico started a student loan scheme with support from the World Bank as part of the Higher Education Financing Project in 1999, the SOFES. Canton and Blom analyzed the impact of the loan scheme at project completion. Results from the Mexican household survey indicate that financial support has a strong positive effect on university enrollment. Given completion of upper secondary education, the probability of entering higher education rises 24 percent. The authors use two data sources to investigate the second channel, student performance. They analyze administrative data provided by SOFES using a regression-discontinuity design, and survey data enable them to perform a similar analysis using a different control group. Empirical results suggest that SOFES recipients show better academic performance than students without a credit from SOFES. However, the results cannot be interpreted as a causal impact of the student loan program, since the impacts also could reflect self-selection of students. Colombia started a similar student loan scheme. With the support of the ACDCESS Project, Colombia shifted its tertiary education policy, implementing comprehensive reforms to improve equity of tertiary education. The result of this shift has been impressive: enrollment in tertiary education increased by 30 percent in the last three years to over 1.3 million students, and the number of doctoral students tripled to reach over 1,000 in 2006. The effective targeting of the student loan component has resulted in more students from disadvantaged backgrounds being able to finance their studies, thus increasingly their ability to enroll and reducing the probability that they drop out for economic reasons. An impact evaluation found that dropout rates were 30 percent lower for beneficiaries than for non-beneficiaries with the same observable characteristics.
PHILIPPINES Discussion Note No.13: Higher Eucation June 2011
DN13-10
Policy Area 4: Improving Quality and Relevance Action 4.1 Improve funding and incentives for upgrading faculty qualifications 21. More resources need to be allocated in the budgets of HEIs to raise the proportion of faculty members with master’s degrees. HEIs could be given more incentives to improve faculty qualifications, such as increased possibility of national government funding, and, HEIs themselves could institute pay structures that reward post-graduate qualifications. Action 4.2 Improve pre-college preparation to improve tertiary outcomes 22. The Philippines should consider expanding the current 10-year basic education system to the more internationally-accepted 12-year system, as Mongolia has recently done. International evidence has shown that better prepared students perform significantly better at the tertiary level. More analysis and preparation is however needed before fully implementing this. Action 4.3 Review tertiary curriculum and pedagogy 23. A review of the curriculum and pedagogy needs to focus beyond strengthening traditional academic subjects, to the strengthening of generic life skills, including creativity and innovation skills, critical thinking and real-world problem-solving skills, ICT skills/literacy, communication and collaboration skills, ethical and socially responsible attitudes, and using new student centered, activity-based and competency-oriented teaching methods supported by newly-developed textbooks and materials. Action 4.4 Foster university-industry linkages 24. The governing boards and the technical panels are the current main venues where private sector inputs in higher education are being utilized. These mechanisms should be strengthened. Fostering stronger university-industry linkages can further be achieved by institutionalizing and accrediting On-the-Job Trainings (OJTs). OJTs, practica, or internships vary in quality and participation. CHED could work with national accreditation agencies to develop minimum standards for OJT experiences and foster better linkages with the nation’s industry. Lessons from these experiences could feed back into creating more relevant curricula, possibly putting more emphasis on work-related generic skills, such as decision-making/entrepreneurial skills and creative thinking. Such linkages could also be fostered by including industry feedback into curriculum design, promoting the use of university labs by industry, promoting joint R&D projects, and licensing of university-held patents. Such measures would help improve the relevance and quality of the system and may also have long-term benefits for the national innovation capacity of the country.
PHILIPPINES Discussion Note No.13: Higher Eucation June 2011
DN13-11
Action 4.5 Develop a learning culture and undertake research to improve quality and relevance 25. System and institutional level research centering on quality and relevance should be encouraged. This could include the use of graduate tracer studies. A thorough set of tracer studies to follow graduates to learn lessons about the relevance of their education are needed. Such studies could interview both graduates and employers on a regular basis, ascertain what are the most desirable skills for particular industries, as well as the fields of education that are in decreased demand, identify where HEIs can benefit from this information and incorporate this information in upgrading their curricula.
PHILIPPINES Discussion Note No.13: Higher Eucation June 2011
DN13-12
References
The Presidential Task Force for Education (2008). “Main Education Highway: Towards a Knowledge-based Economy”.
UNESCO Institute of Statistics (2009). “Global Education Digest 2009: Comparing Education Statistics Across the World”.
Orbeta, A. (2008). “Background Paper on Higher Education in the Philippines”, October.
World Bank (2009). “Philippines Skills Report: Trends in Skills Demand, Gaps and Supply in the Philippines”, July.
World Bank (1998). “Higher Education in the Philippines: Philippines Education for the 21st Century: the 1998 Philippines Education Sector Study”. Technical Background Paper No. 3.
Tan, E. (2010). “The State of the Philippines National Innovation System”. Note prepared by: Xiaoyan Liang and Lynnette Perez (EASHE)
DN14-1
������������������������������ � ���� �������������������� Expanding coverage and sustained access to potable water and sanitation T M D G MDG
H I
F
A T M M
L B S
I M
W T
A. The Philippines Today: Progress and Challenges 1. The Philippines remains on track to meet the Millennium Development Goals (MDG) for access to improved water sources (94 percent in 2015) and to improved sanitation (79 percent) in 2015.138 Access to improved water sources rose from 84 percent in 1990 to 91 percent in 2008. Such access in urban areas continued high at 93 percent and rose in rural areas from 76 percent in 1990 to 87 percent in 2008. The portion with piped water on the premises doubled from 24 percent in 1990 to 48 percent in 2008. Access to improved sanitation rose from 58 percent in 1990 to 76 percent in 2008. Access to improved sanitation services in urban areas rose from 70 percent in 1990 to 80 percent in 2008 and in rural areas from 46 percent in 1990 to 69 percent in 2008. Key Challenges Higher Quality of Water Service and Treatment of Human Waste 2. Nonetheless, progress towards the MDGs is being eroded with respect to the quality of water service and the treatment of human waste. Many cooperatives and water
138 “Status and Progress Towards the MDG Targets” 2010 Update from the Joint Monitoring Programme of the World Health Organization and the UNICEF
PHILIPPINES Discussion Note No.14: Water and Sanitation June 2011
DN14-2
associations operating outside Metro Manila operate only two to four hours daily and often at low pressure. In contrast, many local entrepreneurs buy bulk water from the Manila concessionaires and sell water to underserved housing subdivisions or provide water to unserved depressed communities. Where water quality is poor, the impact on health is significant and waterborne diseases remain among the top ten causes of morbidity and mortality outside of Metro Manila (the water in Metro Manila is served by the two concessionaires that are regulated by MWSS). The poor are affected the most because they lack the means to buy safe alternative service.
3. Fewer than 5 percent of households with septic tanks have proper on-site treatment and disposal. Demand for municipal sanitation services is low. Insufficient regulation of the collection and proper disposal of wastewater, and enforcement of construction standards on septic tanks, as well as insufficient capacity of wastewater and septage treatment have contributed to severe pollution of waterways and major water bodies, prompting the Supreme Court to issue a decision in 2008 requiring the related agencies to clean up the Manila Bay. The lack of proper sanitation has a significant impact on health, the environment and incomes. A recent study estimates the economic losses from inadequate sanitation in the Philippines to be close to P80 billion (US$1.75 billion) per year, equivalent to about 1.25 percent of GDP. Yet the country is devoting only about P1.5 billion per year to improve sanitation standards, an underinvestment with serious consequences. The country misses out on high-value tourism because of the environmental damage, and the surface water and groundwater resources deteriorate when untreated sewage is disposed indiscriminately. Solid waste collection is ineffective, and large quantities of solid waste block drainage canals, exacerbating public health problems. Fragmented Institutions 4. Fragmented institutions hamper implementation of policies. There are 30 institutions involved in the sector at the national level, plus an interagency Oversight Committee on Water Reforms, chaired by the Department of Finance. However, the Committee has operated without a clear timeframe for completing the implementation of the agreed reforms of the sector. Thus, coordination among the various national government agencies involved in the sector remains weak with unclear accountability. 5. Numerous small providers have neither economies of scale, nor the necessary autonomy from political interference to be efficient providers. Various local providers coexist, but operate under different regulatory and financing regimes, thus blurring accountability of individual providers for expanding both water supply and sanitation services. The vast majority of local government sponsored water associations and water districts operate at the barangay level (the lowest administrative level in the Philippines).139 As a result, coordination and cooperation among barangay water suppliers to develop bulk sources have often been difficult. 139 Small water districts comprise about 80 percent of the total number, mostly established for single municipalities with services extending to a few barangays rather than to the entire municipality
PHILIPPINES Discussion Note No.14: Water and Sanitation June 2011
DN14-3
Insufficient Investment Levels and Inadequate Cost Recovery Sector investments have been insufficient to preserve assets and expand quality of service. Over the past two decades, annual capital expenditures in the water and sanitation sector were about P3-4 billion (US$80 million), or about US$0.9 per inhabitant per year. Investment levels have been about half of the estimated investment requirements of about P6-7 billion a year to reach the MDG targets and improve the quality of service. The Clean Water Act of 2004 required the implementation of a National Sewerage and Septage Management Program but work on this has recently started and which calls for an additional investments of around P26 billion. 6. The institution for channeling the bulk of public investments is financially weak and cannot support the necessary investments. The Local Water Utilities Administration (LWUA), which lends to water districts, has long been in financial difficulty and unable to raise counterpart financing to mobilize loans. Water districts also have been unable to generate operational surpluses to co-finance loans and pay for debt service. Thus the investments in the non-Metro Manila area have been low and LGU spending has been about P400 million a year, most of which to pay for recurrent expenditures. In contrast, within Metro Manila, the two concessionaires have been able to raise financing for investments that better serve the population. Private investments accounted for about 50 percent of total sector investments over the period 1999-2003 but are predominantly in Metro Manila. Manila’s share of total sector investments is expected to increase further with the extension of the contracts of the two concessionaires (MWSI and Manila Water Company Inc. - MWCI, east zone concessionaire) for an additional 15 years until 2037. 7. The generally low level of cost recovery from tariffs undermines the development of the entire sector. For the majority of service providers, tariffs fail to recover recurrent costs. Maintenance suffers disproportionately, and the result is a vicious cycle with rapidly deteriorating assets that need to be prematurely rehabilitated or replaced, preempting the accumulation of reserves to fund new capital investments. 8. Household affordability concerns are the common political excuse for not raising water tariffs to recover costs but the effect on service quality is dire. The poverty impact is regressive and there is not adequate evidence that suggests that water utility tariffs pose an affordability problem to large parts of the population in the Philippines. When tariffs fail to cover operations and maintenance costs, let alone investment costs, wealthy households receive larger subsidies than poor households because their per capita consumption is much higher than that of poor households. The impact is particularly detrimental for sanitation because so little is invested and the large external benefits from sanitation are lost.
Weak Governance and Regulatory Frameworks 9. The National Water Regulatory Board (NWRB) is constrained from effectively performing its regulatory functions. NWRB has the legal mandate over all water service providers (except for Metro Manila which is governed by the Concession Agreements), but the lack of resources and skills has limited its ability to regulate the sector effectively. It is
PHILIPPINES Discussion Note No.14: Water and Sanitation June 2011
DN14-4
currently receiving significant technical assistance to strengthen its capacity. Recent sector reforms include the pending creation of a performance benchmarking system for all water providers. Different agencies continue to maintain their respective monitoring and evaluation systems without a common agreed framework. The capacity of the MWSS-Regulatory Office for Metro-Manila also needs to be strengthened, especially since the two concessionaires will be investing heavily due to the sanitation needs. 10. The regulatory structure does not create an incentive for the water service provider to operate efficiently. It is rare to find viable operators among the approximately 5,000 providers in the country. Most depend on subsidies and the operators do not have the incentives to run operations in a financially sustainable manner and be demand responsive. Given their small size, these utilities are unable to retain skilled staff and absorb the technical assistance. Water utilities under direct Local Government Unit (LGU) management are generally poorly operated because of the lack of technical, financial, and management capabilities, and the non-existent autonomy with regard to management decisions. Water districts tend to perform better than LGU-managed systems, having more competent management and higher cost recovery levels. Most water districts are not creditworthy because they are not able to generate sufficient surplus for investments. 11. While operating water services along commercial lines is official government policy, it is rarely practiced. The legal standing of water districts as commercial entities is unclear, and LGUs typically retain significant political influence in the corporate governance of water districts through the appointment of the water district supervisory board. B. Where the Philippines Could Be: Policy Options 12. Policy reform must address the three issues shown below in Table 1. The reforms aim to increase coverage of water and wastewater services; improve quality of services; and promote environmental and financial sustainability in the delivery of services.
Table 1: Philippines: Reform Areas and Policy Options Policy Area 1: Fixing the Institutional Fragmentation
Action 1.1 Consolidate sectoral responsibilities Action 1.2 Create incentives for mergers Action 1.3 Replace supply subsidies by targeted subsidies based on household income
Policy Area 2: Increasing Investments and Cost Recovery Action 2.1 Implement cost recovery tariffs for water Action 2.2 Institute tariffs for sanitation services Action 2.3 Expand private sector participation and output-based-aid approaches
Policy Area 3: Improving Sector Governance and Regulatory Capacity Action 3.1 Corporatize public utilities in the sector Action 3.2 Benchmark public utilities Action 3.3 Strengthen regulatory capacities
PHILIPPINES Discussion Note No.14: Water and Sanitation June 2011
DN14-5
Policy Area 1: Fixing the Institutional Fragmentation Action 1.1 Consolidate sectoral responsibilities 13. The government needs to pursue legislative action to consolidate the responsibilities of the sectoral agencies. This would include reform of LWUA to address new challenges and strengthening of NWRB which would include having adequate capacity to mediate in inter-LGU conflicts on trans-boundary issues on the allocation of water resources in developing water supply systems including bulk supply. This will help in promoting the merger of water utilities into economically viable operations. Action 1.2 Create incentives for mergers 14. There is a need to strengthen incentives for mergers of various public service providers to address fragmentation and attain scale economies and financial viability, and to plan and develop water supply and sanitation systems covering multiple municipalities. The most effective incentive for mergers would be to create financially strong utilities with positive cash flows. Such utilities could only come about through a determined push to demand rising levels of cost recovery through higher tariffs and effective commercialization programs that would concentrate on metering all consumption and then bill and collect on the basis of metered consumption. Higher level LGUs need to facilitate regionalized solutions to water supply and sanitation problems and provide strong incentives to achieve buy-in from lower-level LGUs. Action 1.3 Replace supply subsidies by targeted subsidies based on household income 15. The present subsidies in the sector are not clear and do not show the full cost of water, and the true cost of service. As a result, the supply of service is subsidized and the underpriced water and sanitation services subsidize those that are connected and consume the most water, i.e., the wealthier households. The present subsidies are regressive and should be replaced by targeted subsidies that are allocated on the basis of household income. The most effective mechanism for targeting subsidies would be based on metered consumption where only those households consuming below the life-line level and meeting an income-based test would be eligible to receive subsidies. The targeting mechanism developed by the Department of Social Welfare and Development in the context of the Pantawid Pamilyang Pilipino Program (a program of conditional cash transfers) could be an appropriate mechanism on which to base targeted subsidies. Policy Area 2: Increasing Investments and Cost Recovery Action 2.1 Implement cost recovery tariffs for water 16. MWSS, LWUA, LGUs and water districts need to promote the effective implementation of tariffs for water supply services at levels adequate to pay for recurrent costs and fund new capital investments for expansion of services and development of water supply sources. At present, water tariffs in Metro Manila do not include an extraction charge
PHILIPPINES Discussion Note No.14: Water and Sanitation June 2011
DN14-6
for drawing raw water. Unless corrected, new investments to develop new water sources will suffer when demand for water is expected to rise due to the growth of the city. Water districts and local governments often leave tariffs below cost recovery levels for political reasons. Tariffs must be set on the basis of objective criteria of cost recovery and be supported by effective commercialization systems that identify all users, meter their consumption, bill accordingly and collect effectively, using sanctions for those who fail to pay. For example, many community-driven water supply systems still charge flat rates of P10 to P30 per month. Action 2.2 Institute tariffs for sanitation services 17. National policies must be in place that will promote the importance of sanitation. There are two programs in place: the Department of Public Works and Highway’s sewerage and septage management program; and the Department of Health’s sustainable sanitation program. These two programs should create incentives for LGUs to develop the sanitation sector. Further, ways to support investments and charge consumers for sanitation services should be considered in detail. At present, water districts and LGUs do not collect sanitation fees. Sanitation tariffs should be charged on the basis of the household water consumption and be applied to all households. Action 2.3 Expand private sector participation and output-based aid approaches 18. Private sector participation is possible only for those public utilities that have implemented sound policies and for greenfield projects. For the majority of public utilities, corporatization, amalgamation, and the establishment of adequate tariffs need to be implemented before they can attract any private investment or borrow funds from commercial lenders. Involving the private sector can help improve service expansion and efficiency by selected water districts and LGU-run systems that have in place sound financial fundamentals. Lessons learned from the MWSS privatization and other private sector participation models at the local level should be carefully incorporated into the design and execution of future involvement of the private sector. 19. In order to provide greater access of the poor to quality services, government oversight agencies (NEDA, DOF) and sector agencies (NWRB, LWUA, MWSS, DILG) need to establish a mechanism to implement output-based aid approaches as an incentive for operators to expand connections to low income households. Output based aid approaches involve compensating water service providers for connecting pre-identified poor households subject to an independent audit on the delivery of agreed outputs or services. This will address the barrier posed by high connection costs to low income households to connect to formal water and sanitation services. Such a pilot scale project is working well under Manila Water. Policy Area 3: Improving Sector Governance and Regulatory Capacity Action 3.1 Corporatize public utilities in the sector 20. The formal corporatization and registration with the Securities and Exchange Commission (SEC) of public utilities could improve governance. As a first step, the water
PHILIPPINES Discussion Note No.14: Water and Sanitation June 2011
DN14-7
supply systems directly managed by LGUs could be corporatized and registered with SEC, together with the adoption of appropriate accounting standards. Their governance structure would require competent board structures and sufficient accountability and autonomy for management. This could generate immediate benefits in the form of better, more efficient management and services, and also pave the way for the utility to enter into various forms of partnership with the private sector. The possibility of applying the successful Spanish model of “empresa mixta”, a form of corporatized water utilities with joint ownership of the local governments and private specialized service providers, may also be considered. Action 3.2 Benchmark public utilities 21. Benchmarking public utilities, including submission of audited financial data and establishing performance targets, could also improve governance in the sector since it is a prerequisite for comparing the performance of different service providers and since accountability and sanctions are difficult without performance standards. NWRB needs to undertake this task as a priority, in collaboration with LWUA and DILG. Beyond benchmarking, performance targets for each utility need to be set and monitored. Such targets should include a limited set of indicators (e.g., service coverage, operational efficiency, financial viability) for which the utilities can be held accountable. Action 3.3 Strengthen regulatory capacities 22. As mentioned above, the capacity of NWRB needs to be enhanced so that it can function as an effective regulator for the water service providers outside Metro Manila. The benchmarking program is a start and through this exercise it would have better information on the service providers so that they can be better regulated from an economic perspective and also for the quality of service. The Manila water concessionaires have significantly expanded their services since 1997, and are due to undertake major investments in sanitation in the short to medium term. Thus, there is a need for the government to strengthen its regulatory capacity to deal with the concessionaires to ensure that regular monitoring of performance and the rate-rebasing negotiations every five years can proceed smoothly
PHILIPPINES Discussion Note No.14: Water and Sanitation June 2011
DN14-8
References: National Economic and Planning Agency (2009), “Philippine Water Supply Sector Roadmap.” World Bank (2003) “Philippine Environment Monitor,” www.worldbank.org.ph/pem World Bank (2005), “Philippine Infrastructure Study. ”http://siteresources.worldbank.org/EXTTRANSPORT/Resources/337115-1214499672078/5154009-1215830515903/5205342-1215832668382/infra-chall-philippines.pdf Note prepared by: Sudipto Sarkar (EASIN) and Christopher C. Ancheta (EASPS) The World Bank
DN15-1
������������������������������ � ���� ������������ Urbanization in the Philippines The Path to Inclusive Growth T P E A B
GDP A
B Y
K
F
A. The Philippines Today: Progress and Challenges The Philippines is among the fastest urbanizing countries in East Asia. It crossed the 50 percent urban population threshold around the same time that the world made this transition. By the mid 1990s, the service sector accounted for the majority of new jobs created and, despite the economic slowdown caused by the global financial crisis in 2009, it remains the fastest growing segment of the economy (sub-sectors such as business process outsourcing have continued to achieve double digit growth). As a result, by 2009, the contribution of cities is estimated to be 75 percent of GDP (with 50 percent of GDP being generated by the Metro Manila area alone).140
A focus on urban development is not an option but a necessity given the opportunities that the economies of agglomeration141 offer in terms of better incomes and improved access to services. Global experience confirms that efforts to stop or reverse urbanization have met with limited, if any, success. Experience also shows that delayed implementation of strategic investments in urban infrastructure and services is not only more costly but more complex to undertake – the cost of relocating informal settlements from vital transport routes is typically more than twice the original cost of providing housing and services.
Although urbanization is leading the economic transformation in the Philippines, decentralized and highly politicized decision making at the Local Government Unit (LGU) level has often resulted in inadequate planning and under-investment in key
140 Webster, Corpuz and Pablo, 2003 141 Economies of aggregation refer to the benefits that firms obtain when locating near each other and include economies of scale and network effects.
PHILIPPINES Discussion Note No.15: Urbanization June 2011
DN15-2
infrastructure. Urban infrastructure including urban transport and traffic management, water supply and sanitation, and housing have not been able to keep pace with the growth in demand. These trends have worsened over the past 15 years, but can be remedied in part by systematic urban planning and a clear focus on accountable performance by service providers. Getting ahead of the curve in cities that are fast growing requires significant investments that can often only be mobilized by national governments in close partnership with the private sector and civic organizations. These must be guided by strategic urban plans that lay out a vision for decentralized service provision consistent with the public interest.
Key Challenges 4. As in many developing countries, urbanization in the Philippines will be one of the most critical development challenges decision makers and planners will face142. While the urban poverty incidence (19.9 percent) in the Philippines is well below the rural poverty incidence (at 46.6 percent), the absolute number of urban poor is on the rise due to the rapid pace of urbanization. Stopping and reversing these trends is a critical challenge for today’s policy makers and planners and will require the support of both national and local governments. For example, in Metro Manila the slum population is estimated at approximately 2.5 million, and is located throughout the metro area. While slum communities are often viewed as eyesores because of the blighted living conditions, their residents perform important service functions that keep the city competitive. Upgrading or near site relocation is a complex challenge, and needs to be undertaken as a partnership between the local government and the concerned community. Box 1: Urbanization: Global and Regional Experience
Countries that have achieved advanced levels of development have done so by embracing the process of urbanization. Globally, urban economies account for more than 70 percent of GDP. The pace and pattern of urbanization often mirrors the quality of a country’s economic growth -- the extent to which urbanization is the cause or the effect in this equation depends on how effectively national policies and local institutions are able to plan and implement inclusive strategies for urban residents. Urbanization with mushrooming slums, traffic congestion, and water and air pollution is an indicator of failed polices and/or poor implementation: these result in higher numbers of poor households and more severe poverty. Countries that have achieved significant economic growth as well as reductions in poverty have had high profile national urban development policies and good implementation track records. In the best cases (e.g., Republic of Korea) this transformation occurred over one or two decades. The Republic of Korea, China, and Vietnam, have all undertaken systematic policies that have led to more inclusive urban development. For example, China’s city cluster development (CCD) emphasized the development of clusters of cities, many of which were in the rapidly industrializing eastern coast. This approach enabled it to achieve double-digit rates of economic growth over the past 30 years. While not without problems, the policy played a critical role in creating the conditions for promoting national economic growth and efficiency, improving equity and reducing poverty, preserving environmental quality, and maintaining national security. More importantly, the government has not
142 World Bank Urban Strategy, 2009
PHILIPPINES Discussion Note No.15: Urbanization June 2011
DN15-3
viewed the policy as a short lived initiative, but rather as a living, organic process. This has enabled it to continually revise and adjust programs, alongside related macro and sectoral policies, in order to correct for unintended spatial outcomes. 5. The fundamental question for the Philippines is not if, but how the process of urbanization can be managed so that it leads to inclusive growth. While there have been efforts to outline a framework for urban development, the Philippines has yet to articulate a clear policy that dedicates financial and human resources to support Mayors and Sangunnian Bayans in planning and implementing sustainable programs for urban development. Raising the profile of urbanization on the national agenda is not just an executive decision. Mobilizing support from the legislature and, more importantly, from civil society, is key as well in order to support long term urban development plans. A focus on urban development is not at odds with the national government’s emphasis on regional development, nor does it imply neglecting the rural hinterland. Experience shows that well managed urban development also promotes regional economic integration because of a better alignment of development priorities and capital investments within the urban space and its regional hinterland. Improving connectivity between cities or towns and their hinterlands can improve the efficiency of both rural and urban economies. Strategic investments in cities contribute to rural incomes once supply chains are established to meet the production and consumption needs of urban centers. In preparing a national urban development policy, the specific economic geography of various regions should be taken into account143. As the Philippines is an archipelago nation, other measures are also required to overcome the geographic distances that isolate populations in remote or lagging regions through alignment of macroeconomic and intergovernmental fiscal policy.
The quality of urbanization often depends on the human and financial capacity of cities and towns. Ensuring that adequate capacity is in place often depends on national policies that set out the roles, responsibilities and capabilities of urban managers within a framework of accountability of LGU officials to provide urban services to their constituents. “One size solutions” that do not differentiate the needs of cities of different sizes can become a severe handicap to large complex city systems. In the Philippines, traditional core urban areas have often stagnated, affecting the country’s global competitiveness as companies and households seek better conditions elsewhere. In more recently developed urban areas the combination of slow economic growth and rapid population increase has widened the gap in the provision of services. Larger, more complex urban clusters require the means to upgrade and modernize their systems and staff to meet the demands of their fast growing populations and to attract investment. These require the exercise of political choices on the basis of professional advice from competent urban planners.
Metro Manila and other large urban clusters require planning instruments with which to connect or consolidate fragmented administrative systems in a contiguous area in order to improve efficiency and competitiveness. Metro Manila, with an estimated 13 million people, is often cited as the 11th largest city in the world; however, it comprises 17 distinct local governments, each managed independently, the largest of which has 2.5 million people. The Metro Manila Development Authority (MMDA), a national agency created to
143 Reshaping Economic Geography, World Development Report 2009, World Bank
PHILIPPINES Discussion Note No.15: Urbanization June 2011
DN15-4
support the development of the metropolis, has had limited effectiveness as it has limited authority to implement the Metro-wide plans it prepares. As decisions made by individual LGUs are based on local considerations, mechanisms are required for facilitating metropolitan/inter-local cooperation in planning and implementation of metropolitan infrastructure.
A larger role for the national government in setting urban policy needs to reinforce and strengthen decentralization. In the Philippines, cities are expected to take the lead in shaping their development strategies. Many have prepared City Development Strategies (CDS) under a program managed by the League of Cities144. However, cities recognize that the success of their efforts depends on policies and programs which only the national government can create. Many of the binding constraints to effective urban development can only be removed by national governments (e.g., severe institutional fragmentation among local governments and limited access to financing for transformational infrastructure). Prepared in isolation of sound national policy, local development strategies end up serving narrow local interests at the expense of broader regional or national objectives. To be effective, cities need clear policy direction and, more fundamentally, the tools with which to manage increasingly complex and dynamic urban systems. These include: enabling legislation and regulations; modern and competitive institutions; innovative financing mechanisms; effective public private partnerships; and professionalized and effective urban planning/management and governance systems.
About 2.5 million impoverished people live in slums scattered throughout Metro Manila; many more live in precarious conditions in other urban areas. The settlement pattern of the Metro Manila urban poor is generally dispersed, located wherever there is space and opportunity. Thus slums develop on vacant private or public lands, often along rivers, near garbage dumps, along railroad tracks, under bridges, and beside industrial establishments. The lack of road access within and through slums is a key impediment to improving the quality of life of the poor. The unregulated land use and informal “housing” market is often under the control of syndicates. A very high proportion of households residing in slums pay high rent for rooms or small dwellings relative to the cost of affordable shelter solutions. Conditions in such informal settlements are generally insalubrious and they are often not covered by water, electrical, and sanitation services (or when provided, this is through illegal connections). The combination of crowding and haphazard construction makes the slums dangerous firetraps. On the positive side, slum communities in Metro Manila are usually organized into people’s organizations, which can be tapped to work with communities to improve living conditions. In addition, the willingness to pay for housing – manifested in the payment of rental charges can serve as an entry point contributing towards viable long term financing programs.
Filipino cities are highly exposed to natural hazards and are at risk due to climate change, with informal settlements particularly jeopardized. Many urban areas in the Philippines are exposed to multiple hazards, including typhoons, floods and earthquakes, and, with the growing threat of climate change, this risk is likely to rise further. The Philippines is one of the top 20 nations at risk of significant impact from climate change and 70 percent of
144 The City Development Strategy Program of the League of Cities has assisted over 40 cities to prepare City Development Strategies
PHILIPPINES Discussion Note No.15: Urbanization June 2011
DN15-5
its urban population is located along the country’s coastline. The recent experience of Tropical Storm Ondoy demonstrated the urgent need to relocate over 100,000 households. Yet the current trend in resettlement in Metro Manila, whereby people are resettled to less expensive land outside the metropolitan area, has a poor track record. Those resettled are not consulted and resist because the settlement locations are divorced from the areas where they earn their livelihoods. Even when considerable effort is put into providing sources of income and such critical services as water, health care, and education (as is the case in Calauan, Laguna), the costs of providing such services have raised serious questions about their sustainability and replicability.
B. Where the Philippines Could Be: Policy Options Table 1. Philippines: Policy Areas and Action Policy Area 1: Recognizing the Value of Urbanization
Action 1.1 Reorient the PDP towards urban development. Action 1.2 Establish a forward looking and ambitious national urban policy framework
Policy Area 2: Enabling City Governments to Shape and Drive the Urban Agenda Action 2.1 Revamp urban development planning systems at the national and local levels Action 2.2 Address the urban management and planning capacity constraints
Policy Area 3: Addressing the Needs of the Urban Poor Action 3.1 Develop and implement an ambitious national slum upgrading program Action 3.2 Encourage the private sector to invest in slum upgrading and resettlement
Policy Area 1: Recognizing the Value of Urbanization Action 1.1 Reorient the PDP towards urban development. Despite the national trend towards urbanization, neither the 1993-1998 nor the 1999-2003 MTPDP focused on sustainable urban development as a central pillar of national development. While the 2004-2010 MTPDP does not ignore urban issues, its focus is on “regions” as the centers of development, thus unintentionally obscuring the role of cities and towns in driving both national and regional growth. Rapid urbanization and the congestion of cities, especially Metro Manila, are viewed as a danger signal to be addressed by diffusing urban growth rather than maximizing agglomeration economies. The upcoming 2011-2016 PDP provides a significant opportunity to focus on urban issues.
Action 1.2 Establish a forward looking and ambitious national urban policy framework The Philippines should elaborate a national urban development policy that articulates specific measures by which national government support is made available to metropolitan centers and cities that promote sustainable and inclusive urban growth. Such a policy should specify the financing mechanisms, institutional support through which LGU officials will have the incentives to promote their urban areas as true engines of economic growth. The elaboration of such a policy will need to be carefully thought out as it will require strong backing from
PHILIPPINES Discussion Note No.15: Urbanization June 2011
DN15-6
both the executive and legislative arms of government, as well as civil society. It will also require a dedicated and empowered champion to enable complex decisions and ensure the provision of requisite financing. The basis for such a policy currently exists in the updated National Urban Development and Housing Framework 2009-2016. However, to be effective, it would need to become the pivotal national policy around which all converge. The implementation of such a policy would also need to be supported through the creation of a powerful coalition across local and national governments, and the necessary human and financial resources to ensure that it is implemented.
One option that has been extensively discussed is the creation of a single Government Agency to champion and spearhead national urban development. This proposal is outlined in the 2004-2010 MTPDP; however, so far, it has not received adequate attention or support. Without significant support from the various sector agencies, there is a risk that a weak and ineffective urban development agency will be established. An alternative would be to restructure the Housing and Urban Development Coordinating Council (HUDCC), which has historically been oriented towards housing, to focus its efforts on urban development and provide it the muscle to effectively carry out this role. For example, its current membership, which is largely comprised of housing agencies – would need to be expanded to include the Department of the Interior and Local Government (DILG) and the League of Cities and to allow for more effective representation from local governments and civil society. Its secretariat would also need to be expanded to provide it with sufficient clout to guide the Council and mobilize support from the expanded set of members.
The recently created Urban Consortium (a joint undertaking of HUDCC, the National Economic Development Authority, DILG, and the League of Cities) brings together key national agencies, development partners and civil society to discuss and develop an agenda for urban development. In the short term this forum can serve as a tool for increasing attention on urban development and providing the necessary impetus for both the preparation of a national urban development policy and for shaping an urban perspective for the 2011-2016 PDP. In the medium term it can also help to shape the urban development agenda and identify strategic investment priorities for consideration by the executive and legislature.
Policy Area 2: Enabling City Governments to Shape and Drive the Urban Agenda Action 2.1 Revamp urban development planning systems at the national and local levels 15. The current system is outdated, inadequate, and ignored by LGU decision makers. In many local governments the preparation of plans is often seen as a matter of compliance rather than as a tool for furthering development goals. There is urgency to develop enforceable regulations, incentives and support structures to ensure that comprehensive land use plans (CLUPs) are prepared and implemented in a participatory manner. Consensus needs to be reached on a time table to ensure that all LGUs have their CLUPs in place with sanctions for LGUs that do not comply. A starting point of the CLUPs needs to be risk sensitive land use planning ensuring the resiliency of urban areas to natural disasters. Beyond this minimum requirement – which is not achieved by most LGUs in the Philippines -- national government support is necessary to establish land use plans which promote equity
PHILIPPINES Discussion Note No.15: Urbanization June 2011
DN15-7
and competiveness in the overall context of sustainable urban growth. As a third step, minimum standards of accountability of LGU officials to their constituents could be established and benchmarked. In the Philippines the comprehensive land use plans will have a special role to play in crafting a second generation of City Development Strategies (CDS) which can bring physical and economic planning considerations under one framework. In this sense the new generation of CDS can benefit from the Eco2 cities initiative which fosters an integrated long term perspective to urban planning. Action 2.2 Address the urban management and planning capacity constraints 16. Capacity constraints limit the quality of planning and management in cities. International best practice suggests that the most important capacity building reform is developing an independent and verifiable system to certify competencies in key areas of urban management and planning. Publicly financed capacity building initiatives should be based on a framework whereby financing is based on achieved results (certified staff) rather than on inputs (staff who attend courses). An obvious capacity building entry point is the induction program for recently elected mayors and LGU officials. Organizational arrangements for promoting inter-city collaboration are also desirable programs. As important as capacity is the need to establish effective urban planning institutions. Inspired by the Institute of Research and Urban Planning of Curitiba (IPPUC) in Brazil, many such independent urban think tank and planning institutes have been established in Latin America. Policy Area 3: Addressing the Needs of the Urban Poor Action 3.1 Develop and implement an ambitious national slum upgrading program 17. While cities are expected to take the lead in ensuring the delivery of basic services, they are not always in a position to do so without central government support. A critical area of support which is required to address slum upgrading is access to a tertiary network of basic services that includes water, sanitation and road/public transport infrastructure. In order to meet these social objectives (including non devolved sectors such as education), LGU administrations can be encouraged to allocate more of their own resources through the provision of matching or challenge funds. Cities should also be encouraged to improve their own performance by updating existing regulations and introducing smart tax regimes to accelerate the development of critical services, such as housing, through the private sector (both individual and corporate). The current approach to housing delivery has led to urban sprawl, and has had limited success in ensuring that livelihood opportunities are not diminished. With the growing opportunities of securing global climate funds targeting carbon footprint reduction, planning for greater densification of cities, so that the carbon footprint in terms of energy and transport consumption is lowered could actually mobilize substantial concessional financing. The national government could create special incentives for local government to increase the level of financing for partnerships with real estate developers and communities to unlock and equitably share urban land values in manners that are consistent with well crafted zoning and building ordinances (e.g., higher floor area ratios) that reduce vulnerability to natural disasters.
PHILIPPINES Discussion Note No.15: Urbanization June 2011
DN15-8
Action 3.2 Encourage the private sector to invest in slum upgrading and resettlement 18. Urban renewal and slum upgrading will not be possible in the Philippines without close partnership with the NGO and private sectors. The most critical aspect is to develop techniques to unlock suboptimal land use while ensuring equitable access of housing solutions for the poor. In Metro Manila this will necessarily require a rationalized effort to densify areas with improved roads and public transport but also by transforming the housing solutions from primarily horizontal to primarily mid-rise housing solutions. These mid-rise housing solutions, in combination with the appropriate policy and regulatory framework, will create the necessary conditions to improve land use patterns in the urban space and enable private sector participation. Throughout developed economies, mixed housing development regulations have been used to oblige developers to produce and offer a certain number of units within each newly developed neighborhood at prices that are affordable to low-income households. In the developing world, the creation of “Transferable Development Rights” (TDRs) has brought developers into the low-income market in much the same way. In Mumbai, developers were offered an increase in the permitted floor-surface-index (FSI) if they agreed to produce a given number of low-income units. Results from these experiments have been mixed but important lessons have been learned. Even in cases where government was not involved, slum communities have come to similar arrangements with developers who owned land where slums were situated but faced long court battles to evict slum dwellers. In an arrangement called “land-sharing,” communities agree to voluntarily vacate part of the land for commercial development in return for receiving rights to occupy, and in some cases even receive housing and basic services, on the less commercially-viable part of the land. Examples include Thailand, Cambodia and India. Finally, CEMEX the leading Mexican cement producer, has gotten even more directly involved in housing construction by targeting its Patrimonio Hoy program to low and middle income families that are building their homes one room at a time. The credit provided for the purchase of cement, plus the technical assistance and storage, have allowed families to add an additional room in 60 percent less time and with 35 percent lower expense while maintaining higher technical quality. Note prepared by: Victor Vergara (EASIN) The World Bank
DN16-1
PHILIPPINES Discussion Note No. 16
Community-Driven Development Getting more and better public services to the poor CDD approaches are being successfully applied in the Philippines as part of efforts to enhance decentralized service delivery and improve local level governance and performance The objective now is to expand the program coverage nationally but there are challenges such as the possible duplication of approaches the need to harmonize institutional arrangements as well as ensuring adequate financing The key action areas are the development of a roadmap based on an assessment of experience to scale up the CDD program nationwide and the consolidation and rationalization of the CDD platform to achieve synergy and convergence for maximum impact A. The Philippines Today: Progress and Challenges 1. The development context in the Philippines has been shaped by the constitutional and legislative provisions of the Local Government Code (LGC) which devolved significant responsibility and funding to local government units (LGUs). Yet almost 20 years after the passing of the LGC into law, many poor municipalities still lag behind. Inequity and inefficiency in resource transfers from national to local governments, a lack of ability and/or commitment on the part of local governments to support participatory approaches to development, and real capacity constraints at the community level mean that many poorer communities continue to suffer from limited resources, poor access to basic public services, and a lack of opportunity for people to actively participate in local governance processes. 2. Community Driven Development (CDD) programs (see Annex 1) have therefore been adopted to address these bottlenecks in the decentralization process. Some programs use CDD to achieve specific sectoral objectives, such as the Mindanao Rural Development program which supports the devolution of Department of Agriculture functions to LGUs, and the Agrarian Reform Communities Development program, implemented by the Department of Agrarian Reform, which seeks to achieve national government objectives relating to land reform. Other programs, such as the Kapitbisig Laban Sa Kahirapan - Comprehensive and Integrated Delivery of Social Services program (KALAHI), implemented by the Department of Social Welfare and Development, have utilized multi-sectoral CDD approaches to achieve broader community empowerment objectives (see Box 1). In the ARMM region, the ARMM Social Fund program has been developed to meet the needs of conflict-affected communities. 3. Initial results from the KALAHI provide evidence of the success of the CDD approach in the Philippines. Since it started in 2002, the KALAHI has financed more than 5,000 community projects for basic services (e.g., water supply systems; community infrastructure, such as access roads and bridges; school buildings; health clinics; day care centers; community enterprise ventures). The program has provided support to the poorest 25 percent of municipalities in the 42 poorest provinces with small grants provided directly to
PHILIPPINES Discussion Note No.16: Community-Driven Development June 2011
DN16-2
communities. Preliminary results from a quantitative impact evaluation indicate that the social preparation phase conducted by KALAHI community facilitators has led to greater participation of the poor with their “voices” heard in the selection of development projects, and that the participatory processes applied have led to positive changes in social and institutional dynamics of the villages. In particular, frequency of interaction between villagers and local officials has increased, suggesting an increase in the level of trust in local authorities. An economic analysis of the KALAHI community investments estimated that the economic rate of return (ERR) of its sub-projects was 21 percent. The analysis also concluded that the unit cost of sub-projects was generally lower than those constructed by government agencies.
Key Challenges 4. Despite the generally positive experience with CDD, it is not a panacea for addressing all of the problems associated with weak governance and poor performance at the local level. And CDD programs themselves have faced a number of criticisms. 5. First, CDD programs can be prone to “elite capture” or the domination of decision making and resource allocation choices by the politically powerful. CDD programs often operate in difficult governance environments and are unlikely to be insulated from local political dynamics. The influence of vested interests limits the extent to which public institutions are accountable and transparent, which tends to bring the participatory
Box 1: Supporting decentralized structures and processes through CDD The KALAHI has worked closely with and through formal structures mandated by the Local Government Code, including barangay assemblies for planning, and barangay development councils for implementation. It supports innovative program-supported structures, such as the municipal inter-agency committee for horizontal integration among villages, their respective local governments and national government agencies, and the municipal inter-barangay forum for prioritization of village development plans. By supporting established governance systems the project is able to better support strategic alignment, technical partnership and cost-sharing between village-level structures and their local governments. Compared to the past, the KALAHI has made the formal structures of local government more active by introducing processes for citizens’ participation, bottom up accountability, and greater transparency in decision making and local funds utilization. This has enabled villagers to make their demands more audible and visible to local governments, and has linked them to higher-level planning and budgeting processes to achieve greater scale and sustainability. Women have played a particularly active role in the participatory processes, and many are actively involved in leadership roles as community volunteers. In addition, drawing on lessons from the early years of implementation, the project has introduced specific interventions designed to address the needs of indigenous people and conflict-affected communities, where the regular processes may not provide adequate opportunity for socially excluded groups to fully participate in project activities.
PHILIPPINES Discussion Note No.16: Community-Driven Development June 2011
DN16-3
processes adopted by CDD programs directly into conflict with ingrained systems of patronage at national and local levels, and makes the ultimate success of CDD programs depend significantly on the enabling institutional environment. It is important that CDD programs develop an awareness of national and local political dynamics that affect program implementation, and develop clear operational guidelines to apply in situations where program rules are not followed, including the sanction of program suspension. 6. Second, CDD programs run the risk of undermining decentralization policies by establishing parallel delivery mechanisms that undermine institutional arrangements for decentralization and diminish efforts to develop the capacity of local governments. Also CDD investments may not be well integrated with or may even contradict broader sector plans. And the presence of CDD programs may add to the fragmentation of anti-poverty programs at the local level. Multiple CDD approaches managed by different government agencies may also be confusing and potentially wasteful. CDD programs and their activities therefore need to be carefully designed with reference to the country’s overall decentralization framework and in close consultation with relevant national government agencies and local governments. 7. Third, while there is some evidence that CDD projects create effective community infrastructure and social services, the evidence to establish a causal relationship between program outcomes and the participatory elements of CDD remains weak. Qualitative evidence suggests that external agents strongly influence project success, but facilitators are often poorly trained and inexperienced, particularly when programs are rapidly scaled up. Several qualitative studies indicate that the sustainability of CDD initiatives depends crucially on having a supportive institutional environment, which requires upward commitment to tap sources of technical and financial assistance. Equally, studies indicate that community leaders need to be downwardly accountable to avoid demand-driven processes becoming supply-driven. B. Where the Philippines Could Be: How to Scale up CDD in the Philippines 8. The success of CDD programs can be enhanced by the incorporation of the key principles of participation, transparency and accountability into the planning and budgeting systems of local governments which, in turn, would support a longer-term agenda of reform. Some factors that shape the local governance and accountability space are within the influence of CDD operations, including: shoring up administrative skills of the local bureaucracy for participatory governance; animating governance arenas, such as barangay assemblies; building community capacity for voice, negotiation and oversight; and, providing the experience of civil society-local government synergies that could be used to generate increased trust. 9. Scaling up CDD programs in the Philippines can create an integrative and coordinative platform to support the convergence of different government policies and programs, including those tailored to address the needs of specific local development contexts. But scaling up should be done gradually based on careful analysis and assessment of program performance, and through detailed quantitative and qualitative impact evaluations. The elements of a CDD platform have already been established in the Philippines. This can
PHILIPPINES Discussion Note No.16: Community-Driven Development June 2011
DN16-4
provide an effective foundation for local implementation of a range of community-oriented development programs including better organized communities that: (a) are accustomed to calling village assembly meetings to discuss priorities and assign tasks and working together for a common purpose, (b) are supportive of transparent approaches, equipped with the necessary skills to keep financial and other records, and, (c) have leaders who can motivate change and are committed to ensuring the participation of marginalized and vulnerable groups. Despite this progress in establishing a CDD platform, the scale of CDD operations remains relatively modest. Table 1. Philippines: Areas for Action
Policy Area 1: Roadmap for Nationwide Scaling Up of CDD Action 1.1 Ensure policy coherence Action 1.2 Assess evidence to support program design Action 1.3 Secure stakeholder engagement and participation Action 1.4 Harmonize approaches Action 1.5 Coordinate institutional arrangements
Policy Area 2: Expanding the CDD Platform Action 2.1 Institutionalize CDD in planning and budgeting systems of LGUs Action 2.2 Customize CDD approaches to address context-specific needs Action 2.3 Promote synergy and convergence Action 2.4 Assess impact
Roadmap for Nationwide Scaling Up of CDD 10. A roadmap to systematically guide and inform the scaling up of CDD would present a conceptual framework for linking together the various related parts of the CDD landscape. It would enable policymakers and stakeholders to define a common frame of reference for addressing the major issues in relation to scaling up CDD. Action 1.1 Ensure policy coherence 11. The scaling up process for CDD needs to ensure appropriate coherence and consistency with other key development strategies. This would require close cooperation with key national government agencies responsible for setting sector policies relating to CDD programs (i.e., roads and bridges, water supply, community education and health, livelihoods), as well as the broader reform agendas relating to decentralization and social protection given their particular relevance to CDD. Action 1.2 Assess evidence to strengthen program design 12. The roadmap process provides an opportunity to synthesize the diverse evidence included in studies on the experience of local service delivery for the poor in the Philippines and elsewhere. Led by senior policy makers, and involving local academics and other stakeholders, the review process would identify, review, and present the main lessons learned to inform the design of the nationwide CDD program.
PHILIPPINES Discussion Note No.16: Community-Driven Development June 2011
DN16-5
Action 1.3 Secure stakeholder engagement and participation 13. Given the wide range of stakeholders engaged in CDD programs at all levels – which include, among others, community leaders, people’s organizations, NGOs, faith-based organizations, the private sector, national government oversight and line agencies, local governments at the provincial, municipal and barangay level, and, international development partners – it would be important to define a process to permit dialogue and debate and subsequently to reach agreement on the key design, institutional, and financial arrangements for a nationwide CDD program. Civil society groups, especially NGOs with broad membership networks, would play an important role, and an enhanced role for national and local universities would help promote a stronger sense of civic engagement through student and faculty outreach, while providing excellent opportunities for research. Action 1.4 Harmonize approaches 14. As in other countries, CDD programs in the Philippines have emerged in response to a variety of different needs and contexts. While each CDD program has its distinct rationale, successive programs do not always incorporate the lessons of previous programs, nor do earlier programs adjust to respond to lessons from subsequent programs. Over time this is likely to lead to redundancy, duplication, and complication in design and implementation arrangements. Therefore part of the review of evidence would include an assessment of the need to consolidate, harmonize, and rationalize various CDD programs to improve their overall impact. Action 1.5 Coordinate institutional arrangements 15. Scaling up is not a linear process. T D S W D �is well positioned to provide overall leadership for the roadmap process; however, given no single government agency has the capacity to support all aspects of a nationwide CDD program, overall institutional arrangements would need to transcend narrow sector-specific concerns. Using the roadmap process to secure stronger buy-in from government agencies would be essential to ensure strong coordination at the national level, which would include: key sector agencies; the Department of the Interior and Local Government and the various leagues of local governments; and national-level coordination through the National Anti-Poverty Commission and the National Economic and Development Authority. Sequencing and budgeting are also important issues (see Box 2).
PHILIPPINES Discussion Note No.16: Community-Driven Development June 2011
DN16-6
Box 2: How much would a nationwide CDD program cost in the Philippines? The actual cost to the national government of a nationwide CDD program is difficult to estimate as there are many design choices that would affect the overall cost. As a starting point, assuming average per capita KALAHI grants are in line with current allocations and similar across the country, total costs for a nationwide CDD program would be between US$250-500 million or around PhP10-20 billion per year. However, the actual amount could vary depending on a number of factors. First, cost-sharing arrangements with local governments could be adjusted depending on the poverty status of different provinces and cities, with better off areas expected to contribute more towards supporting CDD allocations; this would be similar to the arrangement to the Municipal Funds program of Mexico where resources are allocated to municipalities on the basis of a poverty index. Second, as municipalities become more successful at drawing in funds from other sources, and as they take on greater responsibility for program implementation, their co-financing share of CDD interventions is likely to increase. Third, over time it would be possible to move from an entitlement-based allocation (based on a municipality’s poverty incidence) to a more performance-based allocation (assessed according to a municipality’s performance in relation to achieving program benchmarks). Expanding the CDD Platform 16. Scaling up a CDD platform for community and local government engagement offers tremendous potential to consolidate and expand efforts to help all municipalities and cities improve public service delivery, enhance local governance, and improve economic and social opportunities, especially for poorer areas and marginalized and vulnerable groups that are often excluded from the development process. To capitalize on this potential a nationwide CDD program would need to focus on the following operational priorities. Action 2.1 Institutionalize CDD in planning and budgeting systems of LGUs 17. In the medium term, the extent to which service delivery and governance innovations supported by CDD programs are sustained will depend on how well participatory processes are institutionalized into the regular planning and budgeting cycle of LGUs. Establishing a period of transition in which LGUs assume greater responsibility for program implementation, with national government’s role increasingly focused on capacity development, while at the same time continuing to provide financial support directly to communities – so they retain “the power of the purse” over such resources – would help to test municipalities’ commitment to CDD approaches. For example, in the KALAHI a pilot program has already been tested with encouraging results that demonstrate many ways in which municipalities are institutionalizing CDD approaches, including: the passing of municipal ordinances to institutionalize a CDD approach for local development planning; expanding the representation of stakeholders on local development councils; and, assigning dedicated municipal staff as community development specialists.
PHILIPPINES Discussion Note No.16: Community-Driven Development June 2011
DN16-7
Action 2.2 Customize CDD approaches to address context-specific needs 18. Customized CDD approaches that adjust and augment standard CDD approaches can have greater impact in targeting marginalized and vulnerable groups or areas. For example, indigenous people (IPs) often find it difficult to participate in regular development programs due to cultural norms, low rates of literacy, or a lack of information about program activities. Special training modules and design adjustments would enable CDD programs to provide space for IPs to participate on their own terms, and ensure their needs are properly taken into consideration. In conflict-affected areas, mistrust between community members may make activities that require collective action difficult to implement, so specific activities are needed to help build peaceful coexistence as a prerequisite for implementing CDD programs. In high disaster-risk areas and areas subject to climate change, communities may lack sufficient knowledge and information to fully appreciate the seriousness of the risk they face. Action 2.3 Promote synergy and convergence 19. The area-based focus of most CDD programs provides a basis for integrating multi-sectoral approaches designed to achieve broad-based development impact. Greater convergence of sectoral approaches that address local development needs in a more holistic way would open up opportunities for achieving greater synergy between relevant sectoral interventions. This approach is consistent with on-going efforts to develop an integrated framework for social protection (see Box 3). Box 3: Exploring synergy in community- and household-based poverty reduction programs The KALAHI CDD program and the Pantawid Pamilya Pilipino Program (4Ps) conditional cash transfer (CCT) program are complementary poverty reduction programs implemented by the Department of Social Welfare and Development. While CDD and CCT programs have demonstrated the success of their respective approaches in many countries, neither is able to comprehensively address the local development needs of communities and poor households. While the KALAHI supports broadbased community priorities, it may not effectively reach the poorer segments of the community, whereas the proxy means test used by the 4Ps ensures benefits are targeted to poorer households. Conversely, the specific focus on the 4Ps on improving education and health outcomes may leave important gaps in addressing the broader development needs of communities. The simultaneous presence of the KALAHI and 4Ps in the same area is therefore likely to lead to positive synergy and greater overall impact. 20. Greater convergence among local development activities would also be possible by deepening the engagement between sector line agencies and the development of a nationwide CDD program to clearly define and agree upon options, on the one hand, for integrating stronger demand-driven approaches in sector planning processes at the community level, while on the other, engaging technical specialists from line agencies to enhance the quality and sustainability of CDD investments. Although many sector-based programs include community-focused activities, these are often viewed from a narrow sector perspective rather than as contributing to part of a broader local development agenda. At the same time, multi-sector CDD programs may miss out on opportunities to contribute to meeting sector-specific
PHILIPPINES Discussion Note No.16: Community-Driven Development June 2011
DN16-8
objectives (e.g., Millennium Development Goals), and without sufficient engagement with line agencies, CDD investments may lack sufficient technical quality to ensure their sustainability. Relevant sectoral programs that would benefit from and contribute to CDD approaches include: (a) the school-based management and school-building program of the Department of Education; (b) the Botika ng Barangay program of the Department of Health; (c) the rural power program of the Department of Energy that seeks to provide incentives to increase access to renewable energy; (d) expanding opportunities for the private and non-profit sectors to become more involved in CDD activities, e.g., through the use of output-based aid approaches to community-based water supply and sanitation, enhancing access to financial services for the poor through microfinance institutions and social enterprise organizations; (e) and, the incorporation of successful pilot initiatives supported by other development partners that have the potential for further scaling up, e.g., local resource-based approaches for infrastructure investment of the International Labor Organization, community-based disaster risk management initiatives supported by the European Commission. Action 2.4 Assess impact 21. Effective monitoring that engages stakeholders and rigorous evaluation are both essential given the multi-faceted design of CDD programs. Often at the cutting edge of applying innovative approaches to evaluation, many of the larger CDD programs have implemented long-term impact evaluations that help to establish causal relationships between program design and impact, and also randomized, experimental methods to test the effectiveness of different design features. Such evaluation studies are often complex to design and expensive to implement but are essential to measure and understand which parts of CDD programs are working well and those that need further improvement. International development partners can play an important role in supporting such initiatives and can help facilitate intellectual “north-south” partnership.
PHILIPPINES Discussion Note No.16: Community-Driven Development June 2011
DN16-9
Annex 1: Community-Driven Development: What It Is and Why It Matters By giving control over and responsibility for decisions and resources directly to communities, and promoting cooperation with local governments, community-driven development (CDD) has emerged as an important strategy for national governments to tackle diverse and often long-standing development challenges at the local level, which include: addressing service delivery bottlenecks in decentralization systems; supporting peace-building efforts in post-conflict situations; promoting better governance; and, enhancing the participation of marginalized and vulnerable groups in local development processes. CDD approaches build on many of the principles that have been used for a long time by non-governmental organizations (NGOs) as part of community organizing strategies to promote community empowerment. However, whereas NGO-implemented activities are generally limited in their scope of operations due to funding and capacity constraints, CDD programs overseen by national government agencies have demonstrated their potential for scaling up to cover entire regions and countries, thereby significantly enhancing their overall development impact. CDD approaches have been increasingly used to support bottom-up, demand-side initiatives that give voice and resources to poor communities and other vulnerable and marginalized groups as part of decentralized planning and implementation systems. At the same time CDD programs develop the capacity of elected local governments to respond to and support community-prioritized needs. By providing an alternative entry point in the development process, they have been established as flexible instruments to unlock the latent potential of communities to capitalize on the opportunities presented through devolution of authority and resources to the local level. CDD programs are delivering results. In East Asia, CDD programs have become ubiquitous across the region and are being implemented in both smaller, low-income countries (Cambodia, Lao PDR, Timor Leste) and to large, middle-income countries (China, Indonesia, Philippines). Based on evidence from reports and evaluations reviewed from 42 projects that utilize CDD approaches (in varying degrees), a 2007 World Bank report identified the following key findings that indicate the success of CDD programs across a range of objectives:
1. CDD programs successfully involve communities in decision making and implementation much more broadly – particularly benefiting disadvantaged groups and women – than traditional, top-down approaches.
2. CDD programs successfully target poor areas. Most CDD programs support public infrastructure that provide broader benefits all to members of the community. But additional support is needed to ensure that poor groups within communities benefit, especially where communities have a high level of inequality.
PHILIPPINES Discussion Note No.16: Community-Driven Development June 2011
DN16-10
3. CDD programs deliver smallscale infrastructure and services cost-effectively, and at good quality, mostly because local labor and materials are used, and because local contractors charge within agreed budgets.
4. Operations and maintenance of CDD operations are better integrated in local governance systems, but CDD operations often fall short of actual established standards without sufficient support from external agencies, i.e., functioning infrastructure, active maintenance groups, active maintenance plans.
5. CDD approaches raise the incomes of participant communities. Economic rates of
return on CDD investments are high, and an impact evaluation from Indonesia suggests that the longer communities participate in CDD programs, the higher the rate of return.
6. CDD approaches change the dynamics of how communities interact with local governments. Increased citizen participation changes local institutions by increasing the flow of information.
Community-Driven Development in Action: Brazil, and Indonesia
Large scale CDD programs in Brazil and Indonesia illustrate the range of approaches adopted to address different development challenges. CDD programs in Brazil and Indonesia have already been scaled up significantly. In Northeast Brazil, a rural development program that started in the 1970s was significantly re-designed to incorporate more devolved approaches working through participatory municipal councils. In Indonesia, the joint success of the Kecamatan Development Program (KDP) and Urban Poverty Program (UPP), led the Government to establish the National Program for Community Empowerment or Program Nasional Pemberdayaan Masyarakat (PNPM) as the policy and operational umbrella for all community empowerment programs in the country. Brazil. The Rural Poverty Reduction Program in North East Brazil or Programa de Combate à Pobreza Rural (PCPR) currently targets 20 million rural inhabitants. The program operates on a large scale reaching almost 90 percent of the 1,685 municipalities in the Northeast and 38,000 community associations. The program has invested US$1.4 billion, with the majority of funds financing small scale infrastructure. A program evaluation found that 60 percent of new water and electricity connections between 1992 and 2003 in targeted areas were provided through the PCPR and cost 30 to 40 percent less than most traditional supply-driven programs at equal or better levels of quality. The evaluation also showed statistically significant improvements in health and housing conditions. Access to water and electricity had positive effects on health and reduced the cost of obtaining water. In the case of health, in particular, the evaluation shows statistically significant declines in infant mortality and in the incidence of various common diseases. The project encourages the participation of vulnerable and marginalized groups (including women and indigenous communities) and has created strong social capital in targeted communities. This has had positive implications for strengthening public governance at the local and municipal level. Institutional arrangements and the transparency of the operational mechanisms of the program promote social control of the
PHILIPPINES Discussion Note No.16: Community-Driven Development June 2011
DN16-11
public sector and minimize political interference, corruption and elite capture. Satisfaction with the project is high (90 percent) and the infrastructure put in place is sustainable, with 80 percent of projects still running three to five years after completion. Indonesia. From 1998 to 2006, the KDP and the UPP reached more than 50,000 urban and rural villages and benefited more than 11 million families with significant achievements. An impact evaluation of the KDP showed that real per capita consumption gains were 11 percent higher among poor households and the number of households moving out of poverty in poor sub-districts was 9.2 percent higher in KDP areas compared with control areas. The evaluation showed that, as a result of KDP participation, vulnerable households near the poverty line were less at risk of falling into poverty and that the longer a sub-district received KDP funding the greater was the estimated impact on rural household expenditure. The KDP reduced unemployment by 1.5 percent in comparison with control areas. As of October 2009, the combined KDP/PNPM-Rural and UPP/PNPM-Urban Programs have built or rehabilitated over 62,000 kilometers of roads, 11,000 clean water supply units, 11,000 irrigation schemes, 6,500 kilometers of drainage, 17,500 village health posts, and 10,000 new schools. Also counted in addition to these projects are more than 30,000 other types of economically productive infrastructure activities. Some 90 million work-days have been created from KDP/PNPM-Rural and 20 million work-days from the UPP/PNPM-Urban. Note prepared by: Andrew N. Parker EASPS
PHILIPPINES Discussion Note No.16: Community-Driven Development June 2011
DN16-12
References: North East Rural Poverty Reduction Program, Brazil Coirolo, L. and J. Lammert (2008) Rural Poverty Reduction in Northeast Brazil – Achieving Results through Community Driven Development Moving Out of Poverty in Northeast Brazil. IBRD Results. (March 2010) Kecamatan Development Program, Indonesia Voss, J. (2008), Impact Evaluation of the Second Phase of the Kecamatan Development Program in Indonesia. Guggenheim, S., T. Wiranto, Y. Prasta and S. Wong (2004), Indonesia’s Kecamatan Development Program: A large scale use of community development to reduce poverty. Empowering Indonesian Communities through Direct Participation in Developing Infrastructure and Service. IBRD Results (March 2010) Results Profile: Indonesia’s Community-Driven Development http://go.worldbank.org/RYUSMQHOD0 KALAHI-CIDSS Program, Philippines World Bank. 2005. Empowering the Poor – The KALAHI-CIDSS Community-Development Project. Manila. Araral, E. and C. Holmemo. 2007. Measuring the Costs and Benefits of Community Driven Development: The KALAHI-CIDSS Project, Philippines. Social Development Paper No. 102. Labonne, J. and R. Chase. 2009. “Who is at the Wheel When Communities Drive Development? Evidence from the Philippines”. World Development Vol. 37, No. 1, pp. 219–231. CDD – General Binswanger, H (2009), Accountability, Flow of Funds and Financing of Community-Driven Development: the Global Experience in International Conference on Community Driven Development and Rural Poverty Alleviation , Proceedings World Bank. 2007. Enabling East Asian Communities to Drive Local Development: East Asia Regional CDD Flagship Report. Mimeo.
IV. REDUCED VULNERABILITIES
DN17-1
Figure 1: Estimated Poverty Incidence in the Philippines
Source: NSCB (2008)
������������������������������ � �������� ���� ����������������� Strengthening Social Protection in the Philippines T P
A C C T P P N H
T S P R T W
T
��
�� I N H T S P R NHTS PR
�� S P P
��P
��
The Philippines Today: Progress and Challenges 1. The Philippines is home to around 28 million poor people, equivalent to almost one-third of its total population. The poverty incidence in the Philippines is estimated at 32.9 percent in 2006, an increase from the 30 percent estimate in 2003. The level of poverty in 2006 puts the country back where it was six years earlier when poverty incidence among the population was 33 percent (Figure 1). The challenges in reducing poverty in the Philippines can be attributed to several factors: lack of a dynamic economic growth, high degree of income inequality and relatively large variations in access to infrastructure and social services across regions and island groups (World Bank, 2009a; Balisacan, 2007). In addition to the increasing poverty levels, the Philippines has also been slow in making progress towards achieving some key non-income MDG targets in the critical areas of education and health. In particular, universal primary education and targets for maternal and reproductive health are not likely to be achieved by 2015.145
145 Updates as of May 2009, NSCB MDG Watch: Statistics at a glance of the Philippines’ Progress based on the MDG indicators, http://www.nscb.gov.ph/stats/mdg/mdg_watch.asp
PHILIPPINES Discussion Note No.17: Social Protection June 2011
DN17-2
Table 1: Households’ Strategies to Cope with Economic Shocks (%)
Coping Strategies % distribution
Reduce amount of food consumption 28.0
Replace consumption of food items with cheaper alternative 23.2
Seek additional jobs or other sources of income 11.8
Reduce expenses on transportation, gas, light, and water 11.6
Borrow money from relative and friends 6.5
Reduce expenses on health and medical care 4.1 Borrow money from financial institutions 3.9
Sell or pawn assets 2.7
Withdraw children from school or postpone enrollment 2.6
Transfer children to another school with lower fees 2.2
Send non-working family member to work 1.9
Reduce or use up savings 1.4
All households that reported coping strategies 100.0
Source: World Bank (2009b)
2. While around one-third of the population is poor, nearly half is vulnerable to economic shocks. The government estimated that 45 percent of Filipino households face the risk of falling into poverty or deeper into poverty and the proportion of vulnerable households is higher among the poor (91.6 percent) than the non-poor (27 percent) (NAPC & NSCB, 2006).146 Shocks that commonly throw Filipino households into poverty are those related to health (e.g., loss of family member, especially the household head), unemployment, natural disasters, civil unrest, and food prices (World Bank, 2001). Estimates show that the food and fuel crisis in 2008 may have increased the poverty incidence by 3.9 percentage points while the reduction in wages caused by the global economic crisis in 2008-2009 may have increased poverty incidence by 2.4 percentage points.147 Natural disasters caused by typhoons, floods, landslides can also cause severe damage to property and productive assets on which humans rely for their welfare, as evidenced by the destruction caused by typhoons Ondoy and Pepeng that hit the Philippines in September 2010 (Department of Finance, 2009). 3. In the absence of adequate public or private means of protection from economic shocks, households tend to under-invest in human capital. Without dependable assistance when in need, households resort to sub-optimal coping strategies that are bound to have long-lasting consequences, leading them into a vicious spiral of increased destitution. A survey on impacts of the global economic crisis showed that most households find ways to cope and a majority chooses to reduce household expenditures particularly for food by reducing the amount of food consumption or by replacing food items with cheaper alternatives, often of lower nutritional quality (Table 1). This coping strategy is particularly evident for poor households as food accounts for as much as 90 percent of total household expenditures.148 Others cope by seeking additional jobs or finding other sources of income to meet their basic needs, usually resorting to jobs that do not offer labor protection, while others borrow money from informal lenders (friends and relatives) and formal institutions, selling assets, and reducing household expenditures on health and medical care as well as on children’s education.
146 NAPC & NSCB (2006) estimates are based on 1997 Family Income and Expenditure Survey. 147 World Bank staff estimates based on 2006 FIES (NSO, 2006). 148 World Bank staff estimates based on 2006 FIES (NSO, 2006).
PHILIPPINES Discussion Note No.17: Social Protection June 2011
DN17-3
4. Developing a comprehensive system of social protection is a policy priority. Analysts typically distinguish between four broad types of risks: (i) life cycle risks, which include hunger and malnutrition, illness, injury, disability, old age, and death; (ii) economic risks, which refer to the source of livelihood, low income, unemployment, underemployment, economic crisis or transition, and high prices of basic goods; (iii) social risks from exclusion or marginalization, lack of social investment, loss of family care, homelessness, and manmade disasters; and (iv) environmental risks which pertain to natural calamities (DAP, 2009).149 Addressing these different types of risks requires a range of instruments that include, among other, the pension system, unemployment insurance, disaster early warning systems and social assistance programs. While all are important, this discussion note focuses mainly on social assistance programs, as these are most directly identified with poverty reduction. Key Challenges 5. The Philippine social protection system is characterized by a series of fragmented and uncoordinated programs, with over 60 social protection programs identified as of July 2009. Social protection programs are integrated into various sectors and are being implemented by over 20 government agencies. These agencies undertake as few as one to as many as 15 social protection programs, solely or in partnership with other government agencies. The multiplicity of programs and the numerous government agencies involved often result in poor coordination of social protection programs, redundancy in providing service, or overlapping and double-counting of program beneficiaries (DAP, 2009). 6. The effectiveness of many social protection programs in the Philippines is compromised by poorly designed targeting systems resulting in high leakage rates, low program impact and wasted resources. A number of social protection programs, particularly those that comprise the largest portion of government spending, are characterized by high leakage rates (the proportion of program benefits that “leak” to the non-poor).
149 Based on the Review and Strengthening of the National Social Protection and Welfare Program, the government’s quick assessment of social protection programs in the Philippines, undertaken by the Development Academy of the Philippines in collaboration with the National Economic and Development Authority, Department of Social Welfare and Development, and the National Social Welfare Program.
Figure 2: Estimated Program Costs in 2009 (P billion)* and Leakage Rates**
* Program costs are estimates from various government agencies except for (a) – estimated by World Bank staff based on the budget for NFA operations and implicit cost incurred from setting a floor price of NFA rice given international and local rice prices. Program cost for (e) refers to 2008. ** Leakage rates for (a) and (c) are World Bank staff estimates, estimate for (b) is based on anecdotal evidence, (d) from Manasan and Cuenca (2007), and (e) from Manasan (2009).
PHILIPPINES Discussion Note No.17: Social Protection June 2011
DN17-4
• The universal consumer rice price subsidy administered by the National Food Authority (NFA), estimated to account for around 76 percent of government spending for social protection in 2008 (Manasan, 2009), by design, also benefits the non-poor. It is estimated that 41 percent of the total NFA rice goes to non-poor households (Figure 2).150 The NFA rice price subsidy could have had larger impact on poverty reduction during the food crisis if the rice had been targeted only to poor households. With the same program budget but with better targeting, the NFA rice price subsidy could have reduced poverty incidence by 4.7 percentage points, income gap by 3.1 percentage points, and poverty severity by 1.3 percentage points (Figure 3).
��The Philippine Health Insurance Corporation’s (PhilHealth) National Health Insurance Program (NHIP), also suffers from high leakage rate of around 50 percent.151 The ad hoc scheme of beneficiary identification employed by social welfare officers resulted in the NHIP Indigent Program enrolling larger number of households than the recorded poverty incidence.
��Cash transfer programs introduced during the food and fuel crisis in 2008 also suffered from inefficiencies of poor targeting. The Pantawid Kuryente, a one-time cash transfer for lifeline power consumers had an estimated leakage rate of 72 percent.152
��The Food-for-School Program (FSP), a conditional commodity-based transfer to mitigate
hunger among poor families and improve school attendance, has an estimated leakage rate of 62 percent. The targeting mechanism employed for the FSP indicate higher leakage rates than if FSP simply targeted the poorest municipalities (Manasan and Cuenca, 2007).
Recent reforms 7. Recognizing the need to improve the impact, efficiency, and efficacy of social protection programs, the government launched the conditional cash transfer program in January 2008, following the encouraging results from the pilot-test initiated in 2007. The Pantawid Pamilyang Pilipino Program (4Ps) provides cash transfer to eligible households provided they comply with certain conditions.153 As such, it aims to alleviate the immediate needs of the poor (short term poverty alleviation) and to break the intergenerational poverty
150 World Bank staff estimates based on 2006 Family Income and Expenditure Survey (NSO, 2006). 151 World Bank staff estimates based on 2006 Family Income and Expenditure Survey (NSO, 2006). 152 Not shown in Figure 3 is the total program cost of Tulong Para Kay Lolo at Lola, which was P663 million. 153 See DSWD (2009) for more information on the selection criteria and conditions of the 4Ps.
Figure 3: Simulated Impacts of NFA Rice Price Subsidy on Intended Beneficiaries (%)
Source: World Bank staff estimates based on 2006 FIES and implicit subsidy for NFA rice at the height of the rice crisis in 2008.
PHILIPPINES Discussion Note No.17: Social Protection June 2011
DN17-5
Figure 4: Simulated Impacts of 4Ps in Beneficiary Areas (%)
*as % of population in 4Ps areas; ** as % of poverty line Source: World Bank staff estimates.
cycle through investments in human capital. Moreover, 4Ps helps to fulfill the country’s commitment to meet the MDGs to eradicate extreme poverty and hunger, achieve universal primary education, promote gender equality, reduce child mortality, and improve maternal health (DSWD, 2009). From the initial coverage of 20,000 households and a budgetary support of P50 million, the government significantly expanded the program to cover 376,000 households and provided P1.3 billion to the program in response to the food and fuel crisis and the global economic crisis in 2008. In 2009, the government decided to scale up 4Ps further to support one million households covering around 20 percent of the country’s poor and increased the budget to P15 billion. 8. In addition to a systematic and objective targeting system, 4Ps has a built-in management information systems to monitor implementation, address complaints and grievances, and monitor beneficiary compliance with program conditionalities. The Grievance Redress System (GRS) features a publicly accessible grievance database to resolve and track complaints including targeting errors, payment irregularities, fraud, and corruption. A system to verify the compliance of the conditionalities of the program has also been put in place and linked to disbursements of cash transfers to beneficiaries. The 4Ps’ management information systems ensure that there is an accountability mechanism on the part of the government as well as the beneficiaries. 9. Early estimates show that the 4Ps can have a substantial impact on poverty. With the cash grants 4Ps is expected to increase the total income of the poor and eligible households by 23 percent on average and reduce poverty incidence in targeted areas by 6.1 percentage points (Figure 4).154 The impact of the 4Ps on the income gap of the poor and on the severity of poverty in target areas is also expected to be substantial. In particular, estimates show that the cash transfer could reduce the income gap by 7.6 percentage points and poverty severity by about 5 percentage points. Although preliminary and based on predicted income figures, these estimates are consistent with the results of impact evaluations of comparable CCT programs in other countries. In Mexico, poverty was reduced by 17 percent in Progresa communities, whereas in Colombia the Familias en Acción program reduced the poverty gap by more than 6 percentage points (Hoddinott & Skoufias, 2004; SEI, 2006). In addition, ex-ante evaluation of the 4Ps using a nationally representative household survey shows that the education grants alone, if targeted to children of all poor households nationwide, could reduce national poverty by as much as 8.3 percentage points (Son & Florentino, 2008). These economic as well as non-income benefits of 4Ps such as on key
154 World Bank staff estimates based on the total cash transfer (health plus education component) computed according to the actual demographic composition of potential beneficiary households and per capita income predicted using the Proxy-Means Testing (PMT).
PHILIPPINES Discussion Note No.17: Social Protection June 2011
DN17-6
health and education indicators will be evaluated applying multiple, carefully designed evaluation methods. 10. DSWD has recently developed the National Household Targeting System for Poverty Reduction (NHTS-PR) to provide a set of uniform, objective, and transparent criteria for identifying the poor . In the past, a variety of targeting instruments have been applied by central government agencies and local government units (LGUs), including self-targeting, geographical targeting, community-based monitoring systems, and unverified means tests. The proliferation of targeting systems can be attributed to the lack of coordination among central government agencies and a lack of clarity of responsibilities in this regard with decentralization. In contrast, the NHTS-PR, applies a standardized and objective proxy means test methodology to create a national database of poor households. Significant headway had been made in creating such a database by end-2009. The NHTS-PR is designed to be used to better target the poor in key social assistance and social protection programs, thus reducing the overall cost of targeting and improving coordination, efficiency, and effectiveness of social programs. The Pantawid Pamilyang Pilipino Program (4Ps) is the first social protection program in the Philippines to benefit from this newly established targeting methodology, and anecdotal evidence indicates a significantly lower inclusion error rates (i.e., inclusion of the non-poor). The PhilHealth Indigent program also expressed a commitment to using the NHTS-PR to improve its targeting. C. Where the Philippines Could Be: Policy Options
Table 2: Summary of Policy Areas and Actions Policy Area 1: Accelerating Social Protection Policy Reform
Action 1.1 Develop a more operational social protection strategy Action 1.2 Thoroughly assess and consolidate existing social protection programs Action 1.3 Identify the agencies in charge of advancing the social protection agenda
Policy Area 2: Improved Targeting of Social Protection Programs Action 2.1 Adopt the NHTS-PR as the single national poverty targeting system Action 2.2 Make the targeting database available to the local government units (LGUs). Action 2.3 Continue to ensure the accuracy of the NHTS-PR database.
Policy Area 3: Improved Operational Efficiency and Gradual Coverage Expansion of CCT/4Ps
Action 3.1 Further strengthen the operations of the CCT/4Ps. Action 3.2 Gradually expand the CCT/4Ps over the next six years
Policy Area 4: Providing Adequate Financing for Social Protection Services Action 4.1 Consolidate less efficient programs and transfer fiscal savings to the CCT/4Ps Action 4.2 Gradually expand the overall budget for social protection.
PHILIPPINES Discussion Note No.17: Social Protection June 2011
DN17-7
Policy Area 1: Accelerating Social Protection Policy Reform Action 1.1 Develop a more operational social protection strategy 11. The government has recently adopted a Social Protection Framework that inventories and classifies major programs. Further work is required to develop a social protection strategy that can be operationalized to address the main risks and vulnerabilities facing Filipinos. Action 1.2 Thoroughly assess and consolidate existing social protection programs 12. A first step in developing a social protection strategy is to carry out a comprehensive analysis of the risks and vulnerabilities faced by Filipinos and matching these risks against existing program coverage, considering the full range of programs. It is important to understand where there are gaps in coverage as well as where there may be overlaps when it comes to different risk groups (e.g., the poor, unemployed, disabled, elderly, orphans, etc.) A more thorough assessment of existing programs vis-à-vis the current risks and needs is likely to reveal the need for specific types of well-designed programs to complement the CCT program that focuses on a specific population (poor households with children). As part of a more comprehensive social protection strategy, the Philippines may need to explore options for better deploying social assistance programs (such as emergency public works programs or emergency cash transfer programs to address vulnerabilities arising from sudden shocks) or social insurance programs (such as unemployment insurance for job loss). It may also need to focus on specific vulnerable populations (such as the elderly) and build on synergies and convergence among existing sound programs. At the same time, it may be important to consolidate existing programs that are overlapping or cost-ineffective. Further analysis leading to an overall operational social protection strategy will thus be critical in taking this agenda forward. Action 1.3 Identify the agencies in charge of advancing the social protection agenda 13. An important positive step taken to move the social protection agenda forward was the establishment of the Social Protection Sub-Committee (SPSC) under the Social Development Committee (SDC) of the National Economic and Development Authority (NEDA) chaired by DSWD.155 It is now important to reinforce the mandate of the SPSC to oversee the mainstreaming of the social protection program and identify the agencies in charge of implementing specific social protection programs. Policy Area 2: Improved Targeting of Social Protection Programs Action 2.1 Utilize the NHTS-PR as the single national poverty targeting system 14. Consolidating and refining the National Household Targeting System for Poverty Reduction (NHTS-PR) and ensuring its use for targeting poor households nation-wide would significantly improve the effectiveness of spending in pro-poor programs. Toward this end, it 155 Based on SDC Resolution no 2, series of 2009
PHILIPPINES Discussion Note No.17: Social Protection June 2011
DN17-8
is important that all the key social protection programs, such as the PhilHealth Indigent Program, base their targeting mechanisms on the NHTS-PR. Action 2.2 Make the targeting database available to the local government units (LGUs) 15. It is important that this database gets used widely by different agencies in the national government, as well as by local governments to improve the targeting of their programs, particularly insofar as the latter may be expected to play an increasing role in poverty reduction efforts. To encourage the national agencies and LGUs to adopt this system, it will be necessary to develop appropriate database sharing protocols. Action 2.3 Continue to ensure the accuracy of the NHTS-PR database 16. As more agencies and LGUs base their targeting decisions on the NHTS-PR database, it will be critical that the database be of the utmost accuracy. This will require completing the national coverage of the poverty database and investing in its regular updating and maintenance. Policy Area 3: Improved Operational Efficiency and Gradual Coverage Expansion of 4Ps Action 3.1 Further strengthen the operations of the CCT/4Ps 17. The critical issue for the continued successful implementation of the CCT program is to strengthen implementation capacity of the program. The rapid roll-out of the program in the past couple of years has put a lot of strain on existing institutions and manpower, while delaying computerization of some systems. A top imperative for success of the program will thus be to continue to strengthen the program delivery institutions, including the DSWD central and regional teams as well as municipal level implementation structures. Action 3.2 Gradually expand the CCT/4Ps over the next six years 18. Insofar as the ongoing and prospective program performance impact evaluations (see paragraph 9) show that the CCT/4Ps program is living up to its expectations, the Authorities should consider a gradual expansion of 4Ps beyond the current coverage to reach all poor households nation-wide by 2015. Policy Area 4: Providing Adequate Financing for Social Protection Services Action 4.1: Consolidate less efficient programs and transfer fiscal savings to the CCT/4Ps 19. Directing additional social protection resources through the conditional cash transfer program can enhance social protection of the poor both because of the CCT’s improved targeting and low cost of delivery of benefits. International experience indicates that cash transfers are the most direct type of intervention designed to support the poor. Once the
PHILIPPINES Discussion Note No.17: Social Protection June 2011
DN17-9
Figure 5: Cost of Transferring PhP1 to Beneficiaries, 2008 (Pesos)
* Based on consumption of NFA rice reported by the poor in 2006 FIES. ** Based on data covering the first 376,000 batch of beneficiaries with a total budget of P5 billion (P3.2 billion for cash transfer and P1.8 billion for administrative costs). Source: World Bank (2009c)
Figure 6: Estimates of Government Spending on Social Protection (% of GDP)
Sources: Besley, et al, (2003) for all countries except Philippines, which is estimated from Manasan (2009).
administrative infrastructure is in place, the cost of operating cash transfer programs is relatively small and far less than the cost of providing assistance in kind (Grosh, et al, 2008). On the other hand, subsidized sales distort marketing and production incentives as it creates a parallel infrastructure that crowds out private trade or preempts its development. Moreover, the costs required to administer price stabilization programs are high as they involve large operations and their budgets are hard to control with the fluctuations in the international price (Grosh, et al, 2008). Estimates show that it costs NFA PhP3 to PhP8.6 for every peso-equivalent made available to the poor through the rice subsidy program in 2008, which is about 12 times the cost of transferring PhP1 through the 4Ps (World Bank, 2009c); Figure 5. The same estimates suggest that reallocating NFA’s fiscal support to 4Ps will allow the government to cover 100 percent of the 4.7 million poor households (while only reaching 25 percent with NFA Rice Price Subsidy), with each of these poor households annually receiving PhP10,630, seven times the monetary amount received via the NFA rice price subsidy equivalent to PhP1,599 per year per household. In addition, this reallocation of NFA’s fiscal support to 4Ps to cover 1 million poor households is expected to generate savings of PhP11.5 billion for the government. Furthermore, over and above the rice subsidy, the DSWD/DepED Food-for-School Program requires an additional cost of PhP20 per kilo for hauling and handling the NFA rice to the schools (Manasan, 2009). Action 4.2 Gradually expand the overall budget for social protection 20. While the first order of business is to improve targeting of social protection programs and channeling spending on less effective programs to more the effective programs, the government could also contemplate gradually increasing funding to social protection. Social protection programs in the Philippines are inadequately funded especially if compared to other developing countries. An estimate of government spending on social protection shows that it accounted for 0.4 percent of GDP in 2007, growing to
PHILIPPINES Discussion Note No.17: Social Protection June 2011
DN17-10
1.1 percent of GDP in 2008 to respond to the food and fuel crisis. However, the operational costs of the NFA rice price subsidy program alone is estimated to have absorbed 50 percent and 73 percent of this government spending on social protection in 2007 and 2008, respectively (Manasan, 2009). For a relatively stable year such as 2007 (non-crisis year), government spending on social protection at 0.4 percent of GDP is relatively low compared to other developing countries. Selected Southeast Asian countries are estimated to spend about 0.5 to 1.2 percent of GDP while Latin American Countries and South Asian countries are estimated to spend 2.9 percent and 1.5 percent of their GDP, respectively on social protection programs (Besley, et al, 2003); Figure 6.156 Another study shows that the mean spending for safety nets alone for 87 developing and transition countries is 1.9 percent of GDP (Weigand & Grosh, 2008). It would not be unreasonable to see a sustained increase in spending on social protection at a level close to 1.5 percent of GDP per annum in the Philippines over the next six years157. References Asian Development Bank (2007), “Philippines: Critical Development Constraints,” Country
Diagnostics Studies, ADB, Manila. Balisacan, A. (2007), “Why Does Poverty Persist in the Philippines? Facts, Fancies, and Policies”,
SEARCA Agriculture & Development Discussion Paper Series 2007-1 (March). Besley, T., Burgess, R. and Rasul, I. (2003), “Benchmarking Government Provision of Social Safety
Nets,” Social Safety Net Primer Series (May). Development Academy of the Philippines (2009), “Review and Strengthening of the National Social
Protection and Welfare Program,” draft report as of 21 August 2009. Department of Social Welfare and Development (2009), “Pantawid Pamilyang Pilipino Program”,
http://pantawid.dswd.gov.ph/index.php/home Department of Finance, Asian Development Bank, Australian Government Aid Program (AusAID),
European Union, United Nations, and World Bank, (2009), Typhoons Ondoy and Pepeng: Post Disaster Needs Assessment.
Grosh, M., del Ninno, C., Tesliuc, E. and Ouerghi, A. (2008), For Protection and Promotion: The
Design and Implementation of Effective Safety Nets, World Bank, Washington, DC. Hoddinott and Skoufias, (2004), “The impact of Progresa on Food Consumption”, Economic
Development and Cultural Change 53(1):37-61. 156 Social protection spending in Besley et al (2003) covers social security and welfare while Manasan (2009) covers the key non-contributory social protection programs, including active labor market programs and community-driven development projects. Besley et al (2003) does not include estimates of spending for social security and welfare for the Philippines. 157 World Bank staff estimates suggest that spending 1.5% of GDP on social protection will allow 4Ps to cover 2.3 million poor households. Covering all 4.7 million poor households will require approximately 1.9% of GDP spending on social protection.
PHILIPPINES Discussion Note No.17: Social Protection June 2011
DN17-11
Institute for Fiscal Studies, Econometrica and SEI, (2006) “Evaluación del Impacto del Programa
Familias en Acción – Subsidios Condicionado de la Rede de Apayo Social.” Bogota: Departamento Nacional de Planeación.
Manasan, R. and Cuenca, J. (2007), “Who Benefits from the Food-for-School Program and Tindahan
Natin Program: Lessons in Targeting”, PIDS Discussion Paper Series No. 2007-10. Manasan, R. (2009), “Assessment of Social Protection Programs in the Philippines”, World Bank
background paper. National Anti-Poverty Commission and National Statistical Coordination Board (2006), Assessment of
Vulnerability to Poverty in the Philippines, Quezon City. National Statistical Coordination Board (2008), “2006 Philippine Poverty Statistics”,
http://www.nscb.gov.ph/poverty/2006_05mar08/default.asp National Statistics Office (2006), Family Income and Expenditures Survey, public use file. Son, H. and J. Florentino (2008) “Ex-ante Impact Evaluation of Conditional Cash Transfer Program
on School Attendance and Poverty: The Case of the Philippines,” ADB Economics Working Paper No. 142.
Weigand, C. and Grosh, M. (2008), “Levels and Patterns of Safety Net Spending in Developing and
Transition Countries”, Social Protection Discussion Paper No. 0817. World Bank and National Disaster Coordinating Council (2004), “Natural Disaster Risk Management
in the Philippines: Enhancing Poverty Alleviation Through Disaster Reduction”, http://siteresources.worldbank.org/INTEAPREGTOPENVIRONMENT/Resources/PH_Disaster_Risk_Mgmt.pdf
World Bank (2001), Philippines Poverty Assessment. Washington, DC. World Bank (2009a), “Philippines: Fostering More Inclusive Growth”, forthcoming. World Bank (2009b), “Crisis Monitoring Survey”, datafile. World Bank (2009c), “Philippines Quarterly Economic Update – November 2009”, forthcoming. Note prepared by: Human Development Unit led by Jehan Arulpragasam The World Bank
DN18-1
������������������������������ � ���� ������������������������ Tremors Winds Fires and Floods How Well Can the Philippines Handle Natural Disasters
T O P
T P GDP A US T
I O P P G
T D R R M DRRM A T
P G • F
• R
• P M M
• A
• E LGU
D. The Philippines Today: Progress and Challenges
Unmanaged risks undermine development
1. The Philippines is considered one of the most disaster-prone countries in the world. Its location in the tropics and in the so called Pacific “ring of fire” makes it vulnerable to a variety of natural disasters, including typhoons and tropical storms, earthquakes, and volcanic eruptions and their associated risks of flooding, tsunami, storm surges, and landslides. With 268 recorded disaster events over the last three decades, the Philippines ranks 8th according to the World Bank’s Natural Disaster Hotspot list of countries most exposed to multiple hazards. Almost 30 percent of the disasters that occurred in Southeast Asia from 1990 to 2009 occurred in the Philippines. 2. At least 60 percent of the total land area in the Philippines is exposed to multiple hazards, rendering 74 percent of the population vulnerable. The impact on human lives are staggering, with an average of 1,000 lives lost every year due to natural disasters. They
PHILIPPINES Discussion Note No.18: Disaster Risk Management June 2011
DN18-2
also cause a huge loss to the economy by damaging agriculture, infrastructure, and private sector investments. It is estimated that, on average, the annual direct damages caused by disasters range between 0.7 percent (NDCC, 2009158) to 1 percent of the country’s Gross Domestic Product (GDP) (NDCC, ADB and UNDP, 2008). Table 1 below presents an overview of where the Philippines stands in relation to other countries (as of 2009) in terms of number of reported disaster events, number of people killed by disasters, number of people affected, and as a percentage of GDP.
Table 1: Human and Economic Impacts of Disasters, 2009 events
Human Impacts Economic Impacts
Number of Reported Disaster Events
Number of People Killed
Number of People
Affected
No. Affected/ 100,000
inhabitants
As percentage of GDP
Philippines India China Guatemala Samoa China Indonesia Philippines Namibia El Salvador
United States Philippines India Philippines Tonga India Taiwan Bangladesh Taiwan Lao PDR
Indonesia China Vietnam China Burkina Faso Brazil Australia Guatemala Zambia Fiji
Australia Peru Taiwan Vietnam Vietnam Mexico Vietnam Brazil Honduras Honduras
Bangladesh Italy Indonesia American Samoa
Philippines
Vietnam El Salvador Zambia Paraguay Nepal Source: Center for Research on the Epidemiology of Disasters
3. Weather-related events – tropical storms, tropical depressions, typhoons and super typhoons, flooding, La Niña, and El Niño - are the most dangerous hazards faced by the Philippines. Climate change is likely to exacerbate these conditions over the medium and long term by increasing both their frequency and intensity. In the last 15 years alone, the country has recorded the most extreme typhoon events and has been witnessing longer episodes of drought or El Niño, causing a drop in the volume of agricultural production and sharp declines in GNP. Substantial rise in sea levels is expected, making 70 percent of the 1,500 municipalities, located along the coastlines, vulnerable to this phenomenon. Dasgupta et al (2009) lists four Philippine cities (Roxas, San Jose, Manila and Cotabato) among the top 10 East Asian cities likely to be affected by storm surge and sea level rise due to climate change. The same report indicates that 52 percent of coastal GDP could be at risk. See Annex 1 for a map that portrays disaster risks and indicative losses in the Philippines. 4. While the magnitudes of natural hazards are exogenous, the scale and significance of disasters are largely caused by anthropogenic factors, such as unplanned urbanization, inadequate infrastructure, and environmental degradation. Rapid and unplanned urbanization in the country has resulted in the proliferation of informal settlements especially in hazard-prone areas. They have likewise undermined the capacity of the
158 Per internal NDCC estimates (unpublished)
PHILIPPINES Discussion Note No.18: Disaster Risk Management June 2011
DN18-3
government to provide basic urban services, which has led to inadequate infrastructures, such as solid waste facilities, flood control systems, and housing, and their chronic lack of maintenance. Efforts to address the problem, particularly of resettlement, have failed to deliver the intended outcomes. Resettlement programs, especially in Metro Manila, have poor track records, with their failure to consult communities and to link new settlement locations with the sources of livelihoods of affected communities. 5. Environmental degradation also contributes to increasing impacts of natural disasters. Poor land use and the massive depletion of natural resources have increased the probability of flash floods, landslides, and drought. The unregulated development of settlements and economic activities has encroached upon environmentally fragile areas, such as riverways and forests.
Efforts to build resilience are headed in the right direction
6. In the aftermath of Typhoons Ondoy and Pepeng, the Philippine legislature passed the Disaster Risk Reduction and Management (DRRM) Act, enacted by President Macapagal-Arroyo into law on 27 May 2010. The new DRRM Act or Republic Act No. 10121, supersedes Presidential Decree No. 1566, which in 1978 established the National Disaster Coordinating Council (NDCC) and the disaster risk management system in the country. The new law emphasizes the need for a coherent, comprehensive, integrated, and proactive approach to DRRM across levels and sectors of government, and among vulnerable communities in the Philippines.
7. The DRRM Act seeks to address many of the fundamental weaknesses in the current DRRM system in the country. Setting in place the DRRM Act offers an excellent opportunity to reduce risks and potential losses by implementing the key institutional and operational reforms. In addition, the implementing regulations ensuing from the DRRM Act could address several endemic issues facing the Philippines, such as clarifying the functions of different government agencies, strengthening the link between development planning and financing and disaster risk reduction, etc.
8. To complement the DRRM Act, the Philippine Government has also formalized its Strategic National Action Plan (SNAP) for Disaster Risk Reduction. The SNAP translates the country’s commitments to the Hyogo Framework for Action159, in line with global good practice. The SNAP provides a basis for expanding government resources and for mobilizing support from development partners for accelerating and scaling up the implementation of a strategic DRRM program.
159 The Hyogo Framework for Action (HFA) is a policy document adopted by 168 Member States of the United Nations in 2005. It provides the framework by which disaster reduction policy is approached globally. The HFA highlights five priority area of action: 1. Ensure that disaster risk reduction is a national and a local priority with a strong institutional basis for implementation. 2. Identify, assess and monitor disaster risks and enhance early warning. 3. Use knowledge, innovation and education to build a culture of safety and resilience at all levels. 4. Reduce the underlying risk factors. 5. Strengthen disaster preparedness for effective response at all levels.
PHILIPPINES Discussion Note No.18: Disaster Risk Management June 2011
DN18-4
E. Where the Philippines Could Be: Policy Options Table 2: Philippines: Summary of Policy Areas and Actions
Policy Area 1: Risk Identification and Assessment Action 1.1 Upgrade early warning systems to alert people at risk Action 1.2 Use urban areas as geographic starting points to package risk reduction investments
Policy Area 2: Risk Financing Mechanisms Action 2.1 Review and implement priority risk financing and transfer measures Action 2.2 Promote risk reduction and mitigation among LGUs
9. Gains on policy reforms will take time to materialize, as capacities and systems need to be established. However, immediate actions could be undertaken to reduce the vulnerability of the country to natural hazards. The Philippine Government should prioritize the following actions, as per the recommendations outlined in the PDNA. Policy Area 1: Risk Identification and Assessment 10. Successful disaster risk reduction measures require accurate and timely information that can be generated from a credible risk assessment exercise. The national government, with support from various donors, is undertaking a risk assessment for vulnerable provinces in the country. However, the process of producing the multi-hazard maps has been rather slow and protracted, consequently delaying actions and reforms. There is a need to fast-track the process; however, this would require additional financial and technical resources. Support from external and internal stakeholders could be mobilized to support these efforts, particularly to expand work on geographic information systems, satellite and aerial photography, and ground validation of assets and population at risk. Action 1.1 Upgrade early warning systems to alert people at risk 11. Improve capacities of the technical government agencies involved in forecasting and predicting hazards, such as Pagasa. Additional training for Pagasa’s technical staff is also required; partnerships with World Meteorological Organization (WMO) and other development partners could support this effort. In addition to forecasting capabilities, the issuance of credible early warnings to affected communities and last-mile communication capacity of the warnings and evacuation plans should be reviewed and updated. Action 1.2 Use urban areas as geographic starting points to package risk reduction investments 12. The concentration of population and assets in Metro Manila warrants special attention and could serve as a starting point for the government’s risk reduction efforts across the board. If a massive disaster were to occur in this area, such as a magnitude 7.2 earthquake, it could result in the paralysis of political, economic and social services across the entire country. In more concrete terms, the following actions should be taken:
PHILIPPINES Discussion Note No.18: Disaster Risk Management June 2011
DN18-5
• Update the flood masterplan for Metro Manila which has not been updated since 1990. Given its vulnerability to flooding, protecting Metro Manila requires institutional changes, comprehensive planning, and investments in both restoration and infrastructure for an effective flood management system. A risk assessment study for the entire basin is needed in the short term to update the existing master plan and to prepare a comprehensive development program.
• Review the actions detailed in the Metro Manila Earthquake Impact Reduction Study prepared by JICA in 2004, such as strengthening building codes, standards, audits and enforcement.
• Review existing LGU planning processes to see how disaster risks can be factored in upstream. For example, comprehensive land use plans (CLUPs) should be prepared in consideration of hazards faced on the ground. As a long-term planning tool, CLUPs should build LGU resilience to disasters through the adoption of appropriate settlement and infrastructure regulations. A timetable could be agreed between the national government and LGUs to have risk-sensitive CLUPs in place. The CLUPs could likewise be dovetailed with the second generation of City Development Strategy to better address natural hazard risks and climate change adaptation.
Policy Area 2: Risk Financing Mechanisms Action 2.1 Review and implement priority risk financing and transfer measures 13. Being one of the most disaster-prone countries in the world, the Philippines has developed an elaborate system of disaster risk financing institutions designed to provide sufficient post-disaster funding to different segments of the national economy affected by calamities. The key elements of the existing national disaster risk financing system include (i) the National Calamity Fund; (ii) Local Calamity Funds; and (iii) GSIS – a government-owned insurer providing catastrophe insurance coverage for government-owned assets. These mechanisms are further supplemented by private donations from charities and indemnity payments from private insurance companies.
14. The situation on the ground points to an acute shortage of post-disaster funding experienced by virtually every segment of the national economy, including homeowners, LGUs, government agencies in charge of disaster relief and reconstruction, as well as centrally and locally owned utilities. As funds for DRRM largely come from the national government, allocation from the national calamity fund reveals the gross inadequacy to meet the cost of damages incurred from disasters, let alone, provide funds for disaster preparedness and mitigation. Between 1994 and 2009, it was only in one year (1996) when the budgetary appropriation to the NCF was adequate to cover actual damages from calamities. The average coverage in this period amounted to only 26 percent of actual damages. 15. As shown below in Table 3, the overall allocations from the National Calamity Fund, the Contingency Fund, subsidies to the Philippine Crop Insurance Corporation (PCIC), LGUs Calamity Funds, and the private sector donations were Php3 billion, covering only 17 percent of annual average losses and 4.5 percent of economic damages from the most considerable catastrophic event over the last 40 years. However, if the LGUs Calamity Funds could become fungible, then the amount of overall available disaster risk financing could be
PHILIPPINES Discussion Note No.18: Disaster Risk Management June 2011
DN18-6
increased from about Php3 billion to Php13.54 billion. When combined with indemnities from the government and private insurers, this would in principle come close to the Php17 – 19 billion average annual economic loss sustained by the country from natural disasters.
Economic damages from the biggest cat event 1970-2009***
Year 2008
2.0 0.8 0.181 0.18 0.0078 3.2 17.67/19.67 206.13
Notes: *Since LGUs’ expenditures account for about 25 percent of those by the central government and the total government budget in 2009 was P1.144 billion160, we estimate the overall LGUs budgetary expenditures at P286 billion, which means that the maximum allocations to the Local Calamity Funds for all LGUs were around P14.3 billion. However, in reality since these resources are not fungible among provinces, the emergency risk funding available in case of a national disaster are well below this amount. Hence, for the purpose of this calculation we have computed the average amount of LCF per region by dividing the total amount of LGU CF by 79 – assuming that to be an amount available from the LGUs to finance one large catastrophic event. **the left estimate is from ADB and the right is from C. Benson (2009) ***the estimates are in Year 2009 pesos. 16. The Philippine Government is in the process of formulating a risk finance strategy to identify policy options and feasible instruments that can reduce its fiscal exposure. Examples of instruments under discussion include catastrophe bonds, contingency financing, homeowner insurance schemes, and the development of a local level catastrophe pool for high risk LGUs. This strategy is being informed by global experience among developing countries that face equal levels of vulnerability, such as Turkey, Mexico, Colombia, and Caribbean countries. A few options under consideration are presented in Annex 2.
Action 2.2 Promote risk reduction and mitigation among LGUs 17. A funding window that provides incentives to LGUs to invest in pre-disaster activities is an essential complement to the proposed local catastrophe pool. Investments related to DRRM are considered public goods. As such, there is a need to encourage LGUs to improve preparedness and invest in priority mitigation and prevention measures by providing access to additional and affordable financing. The Philippine Government has initiated the implementation of funding support to LGUs, as in the case of the Disaster Management Assistance Fund managed by MDFO, which offers concessional funding opportunities for local DRRM investments. There is a need to expand these resources, in light of improved mandates under the new DRRM Act and to cover as well investments related to climate change. At the same time, technical assistance to determine eligibility criteria, to design these investments, and to build implementation capacity will be needed to ensure the sustainability of local efforts.
160 See http://www.dbm.gov.ph/index.php?pid=8&xid=28&id=989
PHILIPPINES Discussion Note No.18: Disaster Risk Management June 2011
DN18-7
Annex 1
The map above highlights 23 provinces that are considered to be at high risk to disasters, based on a combined desk review of risk maps and economic costs of disasters. The determination of the provinces was done by adopting the CRED CRUNCH methodology, which allows for a comparison of different datasets simultaneously (and in parallel) on a per province basis, without mixing time scales, valuation methodologies and hazard analysis (World Bank/GFDRR study, 2009).
Annex 2
PHILIPPINES Discussion Note No.18: Disaster Risk Management June 2011
DN18-8
Catastrophe Risk Financing Options161
Below is a list of financing options the Philippine Government may wish to consider in order to limit its fiscal exposure to natural disasters in the future. Depending on the government’s preference, further investigation and/or cost-benefit analysis of selected options could be undertaken.
1. Consolidation of local disaster contingency funds. The current system of disaster
risk financing in the Philippines may benefit from consolidating the emergency budgets of almost 46,000 separate administrative entities into one disaster risk financing pool. An LGU-level catastrophe pool, which could be established by a domestic institution such as the League of Cities and Provinces, would allow for the fungibility of budgetary resources and would provide for a considerably more effective way of budgeting and paying for the impacts of natural disasters.
2. Fiscal incentives to LGUs for priority risk reduction investments. Investments related to DRRM are considered public goods. Hence, there is a need to create incentives to encourage LGUs to improve preparedness and invest in priority mitigation and prevention measures. The current system of disaster risk financing does not appear to provide strong fiscal incentives to LGUs to engage in proactive disaster risk management. Providing access to additional and/or affordable financing is one possible course of action to stimulate local investments on pre-disaster measures. For low income LGUs, matching grants or other incentive programs could be designed to encourage and assist with priority DRRM investments.
3. Catastrophe risk pooling. The level of catastrophe insurance coverage among households is virtually non-existent. This could be improved by the creation of a mandatory (or semi-mandatory) national catastrophe insurance pool with public-private participation.
4. Insurance of public sector assets. While GSIS provides insurance coverage for some government owned assets, most remain either uninsured or underinsured. Hence, increasing the insurance coverage of publically owned assets could be a priority. This could be achieved by providing for a line item in the budgets of respective government agencies that are responsible for the annual maintenance and management of infrastructure and government buildings.
5. Securing contingent funding for extreme catastrophic events. Budgetary appropriations to the National Calamity Fund vary considerably from one year to the next. In the case of funding shortages the government typically has been making additional appropriations to the NCF retroactively. To address this issue, the government could tap international financial institutions to finance the establishment of a catastrophe risk financing facility (e.g., a contingent line of credit) which would disburse in the event of a major catastrophe and provide immediate liquidity to fund relief efforts and other short term emergency response needs.
161 Information included in this annex is excerpted from the draft Catastrophe Risk Financing Strategy for the Philippines, currently under preparation by the World Bank with support from the Global Facility for Disaster Reduction and Recovery (GFDRR).
PHILIPPINES Discussion Note No.18: Disaster Risk Management June 2011
Dasgupta, Susmita, et al. (2007). The Impact of Sea-Level Rise in Developing Countries: A Comparative Analysis. World Bank Policy Research Working Paper No. 4136 (http://www-wds.worldbank.org/external/default/WDSContentServer/IW3P/IB/2007/02/09/000016406_20070209161430/Rendered/PDF/wps4136.pdf) Dilley, Maxx, et.al. (2005). Natural Disaster Hotspots: A Global Risk Analysis. A joint study undertaken by the Columbia University and World Bank Government of the Philippines. Typhoons Ondoy and Pepeng: Post-Disaster Needs Assessment. November 2009. http://www.pdf.ph/ Hyogo Framework for Action (2005): http://www.unisdr.org/eng/hfa/docs/Hyogo-framework-for-action-english.pdf National Disaster Coordinating Council), ADB and UNDP (2008). National Assessment on the State of Disaster Risk Management in the Philippines-Final Report. Manila, Philippines. National Statistical Coordination Board Online statistics (http://www.nscb.gov.ph) PricewaterhouseCoopers UK, Economic Outlook, November 2009. https://www.ukmediacentre.pwc.com/imagelibrary/downloadMedia.ashx?MediaDetailsID=1562 World Bank and GFDRR (2009). Assessing Local Government Capacity to Manage Natural Disaster Risks in the Philippines (A report produced under Track II of GFDRR support to the Philippines).
Note prepared by: Zoe Elena Trohanis (EASIN), Christopher Pablo, Catherine Vidar (EACPS) The World Bank
DN19-1
������������������������������ � ����� �������������� Managing Vulnerability and Capturing Cost effective Mitigation Opportunities C I T P
A P T P
D
W C C A G P
C C A
A. The Philippines Today: Progress and Challenges 1. The Philippines is considered highly vulnerable to climate change impacts. It is particularly vulnerable to typhoons and sea level rise, mainly because of its location and archipelagic geography. During the past decade, the country has experienced strong intensity typhoons with increased frequency, packing strong winds and with high levels of rainfall. These climate-related phenomena have caused unprecedented flooding and massive landslides resulting in the loss of property and thousands of lives, causing havoc to the country’s fragile economy. Box 1: Concepts and terminology
The concept of climate change (CC) is used here in line with that of the Intergovernmental Panel on Climate Change (IPCC) as referring to any change in climate over time, whether due to natural variability or as a result of human activity. This usage differs from that in the United Nations Framework Convention on Climate Change (UNFCCC), where climate change refers to a change of climate that is attributed directly or indirectly to human activity that alters the composition of the global atmosphere and that is in addition to natural climate variability observed over comparable time periods (IPCC, 2007b).
In the global atmosphere, greenhouse gases (GHGs, which include carbon dioxide (C02), methane (CH4), nitrous oxide (N2O), hydroflourocarbons (HFCs), perflourocarbons (PFCs), and sulfur hexafluoride (SF6)) increase the absorption of the outgoing radiation and trapping of heat in the atmosphere, producing an increase in the earth’s average temperature. Such human-induced change occurs in addition to natural climate variability observed over comparable time periods.
Two general courses of action are taken to address climate change and prepare for its impacts, i.e., mitigation and adaptation. Adaptation is defined by IPCC as “Initiatives and measures to reduce the vulnerability of natural and human systems against actual or expected climate change effects.” Adaptation can be anticipatory and reactive, private and public, and autonomous and planned. Examples are raising river or coastal dikes, introduction of climate-resilient crops, etc.
PHILIPPINES Discussion Note No.19: Climate Change June 2011
DN19-2
Mitigation is defined by IPCC as “technological change and substitution that reduce resource inputs and emissions per unit of output.” Mitigation means implementing policies to reduce GHG emissions and enhance sinks. (IPCC, 2007a).
2. The Philippines is highly exposed to extreme weather. It is expected that climate variability will lead to an increase in the number, severity and unpredictability of events. On average, around 20 typhoons hit the country annually, of which five are expected to cause major damage in terms of both lives and property. In the past 10 years, the Philippines has experienced the highest recorded rainfall, and the strongest typhoons. Only recently, tropical storms Ondoy, Pepeng, and Santi, all occurring in a span of less than a month, hit Metro Manila and neighboring provinces, and Northern Luzon, causing unprecedented flooding resulting in loss of lives and damage and losses to properties. A post-disaster needs assessment led by the World Bank in collaboration with other donors and the Government of the Philippines has estimated the total damage and losses from typhoons Ondoy and Pepeng at more than US$4 billion or almost 3 percent of GDP. The Philippines is ranked in the top 10 countries worldwide at risk for both climate change and disasters. 3. Significant changes in temperatures, rainfall levels, and the sea-level are envisaged. Temperatures will rise, though by how much is uncertain, but an average warming of at least 2 degrees seems inevitable toward the latter part of this century. It could be higher unless drastic measures are taken to slow down emissions of GHG. Rainfall will both increase and decrease depending on the location. Agriculture, one of the most vulnerable sectors to changes in rainfall patterns, represents over one fifth of the country’s GDP. About one third of the labor force is dependent on agriculture. For a doubling of CO2 in the atmosphere, The Philippines’ Initial National Communication on Climate Change (DENR, 1999) projects a 60-100 percent increase in annual rainfall in the Central Visayas and Southern Tagalog provinces, including Metro Manila. On the other hand, a decrease in annual rainfall is expected for other sections of the country, such as northern and eastern Mindanao and parts of western Luzon. As a potential indication of the things to come, Typhoon Ondoy’s six-hour continuous rain in Metro Manila and neighboring provinces was equivalent to a month’s average rainfall. Sea level rise and storm surges will become greater threats to coastal communities. Globally, IPCC estimates that sea levels will rise about 28-43 centimeters from the base level (1980-1999) until 2100, depending on the temperature scenario. The Philippines is particularly vulnerable as about 60 percent of the country’s 1,500 municipalities and 120 cities are situated along its coast line. Manila, some parts of which lie below sea level, is predicted to be adversely affected by the rise in sea level. 4. The contribution of the Philippines to global GHG emissions was about 0.40 percent in 2005 (excluding land use change), but GHG emissions are projected to increase drastically under business as usual. The expansion of coal-fired generation dominates the emissions. For the transport sector, future projections show a strong increase of GHG emissions under the business as usual scenario. Emissions from the waste sector are also expected to increase with the mandatory blending of diesel and gasoline with biodiesel and bioethanol, respectively. The production of biofuels under the business as usual process of treating wastewater through an open lagoon system could result in considerable increases in methane emissions.
PHILIPPINES Discussion Note No.19: Climate Change June 2011
DN19-3
Figure 1. Historical and business as usual CO2 equivalent emissions from power generation
N G
C
G T
D
O T
H B E P P GM M T C O
Source: Esquerra et al (forthcoming). 5. Climate change mitigation is identified as a priority in the Medium-Term Philippine Development Plan (MTPDP) for 2004-2010. The government has introduced a number of Executive Orders to address shortcomings. At the national level, several sector agencies, such as the Department of Energy, have elaborated plans for addressing climate change through improved energy efficiency and the promotion of renewable energy sources. At local level, several Local Government Units (LGUs) have also been active in the promotion of climate change risk management. The National Conference on Climate Change Adaptation convened in 2007 was followed up in 2009 by the provincial government of Albay, which prepared the Albay Declaration on Climate Change. Albay is pursuing follow-up activities in the development of the national strategic framework on climate change adaptation.
6. The Philippines has been active in undertaking legislative actions and in creating institutions to address climate change issues. However, until recently these responses have been considered to be both fragmented and uncoordinated. The Climate Change Act of 2009 is passed to address these issues. This new law, an act mainstreaming climate change into government policy formulations, establishing a framework strategy and program on climate change was signed into law on October 21, 2009. The law calls for the creation of a Climate Change Commission to address the current institutional set up and inadequate coordination as well as fragmentation of various actions. It also requires the formulation of a National Climate Change Strategy which will be used as a basis for developing a well-coordinated and fully-funded action plan. The implementing rules and regulations of the new law have already been promulgated, and the new Commission has recently been formed. Even without the new law, there is already extensive legislation with relevance to climate change. (See Box 2). The Philippines has also ratified key conventions on climate change. The UNFCCC was ratified in 1998, and the Kyoto Protocol in 2003, enabling the country to participate in the Clean Development Mechanism (CDM). Box 2: Other legislation addressing climate change
PHILIPPINES Discussion Note No.19: Climate Change June 2011
DN19-4
The Philippine constitution states that “it is the policy of the State to protect and advance the right of the Filipino people to a balanced and healthful ecology in accord with the rhythm and harmony of nature”. Apart from the 1009 Climate Change Act, there are six laws that explicitly address climate change:
• The Agriculture and Fisheries Modernization Act (1997), directs the Department of Agriculture (DA) and other appropriate agencies to take into account climate change
• The Philippine Clear Air Act (1999), instructs the Department of Environment and Natural Resources (DENR), and others concerned to prepare plans in accordance with the United Nations Framework Convention on Climate Change (UNFCCC)
• The Ecological Solid Waste Management Act (2000), promotes reduction, recovery and recycling of solid waste and bans burning and incineration
• The Philippine Clean Water Act (2004), promotes the best available clean technology in treating wastewater
• The Biofuels Act (2006), pursues energy self-sufficiency and use of indigenous renewable sources of energy
• The Renewable Energy Act (2008), which encourages the development and utilization of renewable energy sources
7. Despite the potential synergies between disaster risk mitigation and climate change adaptation, so far there is inadequate convergence in policy, planning, action implementation and coordination across national government agencies. As current disaster management legislation concentrates on emergency response, most resources have been focused on ensuring timely response to disasters. The government is finalizing its Strategic National Action Plan (SNAP) for Strengthening Disaster Risk Reduction in the Philippines for 2009-2019. The National Disaster Coordinating Council (NDCC) is also implementing parts of the Four Point Plan of Action for Preparedness. This aims to strengthen the capacity of LGUs in vulnerable areas. There is also a Bill on Disaster Risk Management, which is proposed to be certified as a priority Bill to speed up action by Congress because of the recent typhoons and their unprecedented effects. 8. Various climate change projects have been undertaken by the country, many of them in cooperation with international development agencies. Most of these initiatives are grant-funded and focus mainly on capacity building, knowledge generation and mitigation, mainly in the energy sector. As of October 2009, there were 40 projects registered with the CDM Executive Board. It is only recently that climate change adaptation interventions have begun to receive attention. (See Box 3). Box 3: Examples of climate change projects and programs in the Philippines
The Philippine Climate Change Adaptation Project is a US$5 million GEF-grant funded activity now under preparation to be implemented by the DENR and the DA. It aims to climate-proof the agriculture and NRM sectors and strengthen capacity and coordination functions of key agencies involved in the climate change agenda.
The Adaptation to Climate Change and Conservation of Biodiversity Project, a Euro 4.5 million, three-year project implemented by DENR, is financed by GTZ and the German Environment Ministry. It seeks to assist in the development of national adaptation and mitigation policies and strategies; conservation and sustainable management of biodiversity; and, the preparation for accessing funds from the international carbon trade.
PHILIPPINES Discussion Note No.19: Climate Change June 2011
DN19-5
Strengthening the Philippines’ Institutional Capacity to Adapt to Climate Change Project is a US$8 million project financed by the Spanish Government, with NEDA as the implementing agency. It aims to determine the vulnerability of critical sectors, strengthen the capacity of key stakeholders, and pilot adaptation demonstration projects.
The Japan International Cooperation Agency (JICA) is planning future support to climate change activities and has just completed its comprehensive review of climate change policies, institutions and activities. It has already indicated its interest to help the government formulate the implementing rules and regulation of the Climate Change Act, including strengthening of the new Climate Change Commission.
There are other initiatives at the local level such as the UN International Strategy for Disaster Reduction, together with CITYNET162, the World Bank, Cities Alliance, UN Habitat and Global Facility for Disaster Risk Reduction (GFDRR), which are developing programs of support for cities. Other initiatives on disaster risk management (DRM) include hazard mapping, provision of early warning systems, community-based DRM, and capacity building.
B. Climate Change in the Philippines: Policy Options 9. As many observers and experts have noted, ongoing initiatives seem to be fragmented and not well-coordinated mainly because of the unclear institutional set up and the absence of a clear and coherent framework. With support from development partners and international agencies, it is critical for the Government of the Philippines to seize the momentum and take actions in the following key areas. Table 1: Philippines: Policy Areas and Actions Policy Area 1: Implementation of the Climate Change Act and strengthening institutions and coordination
Action 1.1 Strengthen the Climate Change Commission and create the Climate Change Office with qualified staff and adequate funding support Action 1.2 Develop the guidelines of the law’s implementing rules and regulations (IRR) Action 1.3 Articulate a national climate change strategy and develop an action plan
Policy Area 2: Focus resources and attention on adaptation and preparedness Action 2.1 Mainstream adaptation and disaster risk management Action 2.2 Improve disaster preparedness and response Action 2.3 Protect key infrastructure and livelihoods against climate change impacts Action 2.4 Develop financing facilities for adaptation and disaster response
Policy Area 3: Climate change mitigation programs in key sectors Action 3.1 Undertake selected mitigation programs in the energy, transport and waste management sectors
Policy Area 1: Implementation of the Climate Change Act and strengthening institutions and coordination
162 CITYNET (The Regional Network of Local Authorities for the Management of Human Settlements) is a Network committed to helping local authorities improve the lives of its citizens and create urban sustainabilty across Asia-Pacific and beyond. See www.citynet-ap.org.
PHILIPPINES Discussion Note No.19: Climate Change June 2011
DN19-6
10. The passage of the Climate Change Act of 2009 provides the foundation and legal basis for pursuing the climate change agenda of the country. It is an excellent step towards addressing institutional issues and formulating a coherent strategy that can be used to develop and implement action plans that are well-coordinated, fully-funded and with measurable outcomes. The Climate Change Act has been signed and the Climate Change Commission has been created recently though it has yet to establish the Climate Change Office that will support the Commission. In addition, the implementing rules and regulation of the law have also been recently promulgated. Action 1.1 Strengthen the Climate Change Commission and Create the Climate Change Office with qualified staff and adequate funding 11. The Climate Change Commission has recently been formed but not the Climate Change Office that will support the Commission in implementing the law. The law’s implementing rules and regulation (IRR) that provides the legal procedures and processes to effectively implement the law have also recently been promulgated. With these positive developments, it is critical for the Commission to establish the Climate Change Office with adequate funding and staffed by qualified personnel. Training and capacity building for the Office will need to be done. Action 1.2 Develop the guidelines of the law’s implementing rules and regulations (IRR) 12. While the IRR has already been promulgated, this needs to be supported by clear guidelines to effectively implement the law and to also delineate functions and responsibilities of the Commission vis-à-vis sector agencies, including NEDA. In developing the guidelines, it is critical to consult various stakeholders. Action 1.3 Articulate a national climate change strategy and develop an action plan 13. The Philippines is very active in the climate change agenda both in the local and international arena. However, the country lacks a clear and coherent government strategy on climate change. The new law recognizes this shortcoming and now calls for the formulation of the strategy, which will be the basis for developing the priority action plan for a well-coordinated and fully-funded implementation. Policy Area 2: Focus resources and attention on adaptation and preparedness 14. Given the country’s vulnerability and experience on extreme climate-related events , the government needs to focus its resources and attention on adaptation and disaster preparedness. To this end, the following needs to be done: Action 2.1 Mainstream adaptation and disaster risk management 15. At present, climate risk and disaster risk management concerns are still not
PHILIPPINES Discussion Note No.19: Climate Change June 2011
DN19-7
mainstreamed in PPPs (policies, plans, and programs) at the national, sub-national and sectoral levels, although a number of sectors and a few LGUs (e.g., Province of Albay, Makati City) have started doing this. The government can use the existing review and approval process of sector programs and projects by the National Economic Development Authority – Interagency Coordination Committee (NEDA-ICC) to mainstream climate change in these programs and projects. The NEDA-ICC review guidelines can be amended to include mainstreaming of climate change into any programs and projects proposed by sector agencies. In line with this, NEDA also needs to revisit the formula for computing a project’s financial internal rate of returns (FIRRs) to take into consideration the additional cost and benefits involved in protecting investments from the impacts of climate change. For example, designing climate-resilient irrigation systems and farm-to-market roads may entail reduction in the project’s overall FIRR using the current formula used by NEDA because of the additional investment cost. The long term gains, however, of protecting investments from climate change impacts may outweigh the initial cost. 16. The preparation of the 2011-2016 PDP presented a good opportunity to mainstream CC and DRM in key decision-making processes by incorporating the results of relevant studies (e.g., vulnerability assessments), the establishment of CC scenarios for development planning, programming and project evaluation purposes, expert panels, and stakeholder consultations. At the LGU level, mainstreaming can take place in many different ways. One is through the LGU’s comprehensive land use plan required under the Local Government Code. Another is through the 5-year development plan and the annual investment plan of the LGU. The government and funding institutions may require mainstreaming before agreeing to finance any investment at the local level.
Box 4: Cost considerations for adaptation and mitigation
Before advancing detailed proposals, it may be instructive to reflect briefly on the costs involved. No precise estimates can be made due to the uncertainty of the impacts of climate change, but rough orders of magnitude can be provided. The main conclusion is that much can be achieved at costs that are small in comparison with the overall size of the economy, or the size of baseline investments.
The costs of adaptation will depend greatly on the degree of climate change, but some estimates are possible. A recent study (World Bank, 2009b) estimated the global costs for adaptation (2010-2050) in several forms. The three most costly areas are (i) coastal zones; (ii) infrastructure; and (iii) water supply and flood protection. The study is global and only regional and global estimates are reported. For coastal zone adaptation, the increased costs of adaptation were estimated for different categories of countries. Using the estimates for “deltaic and small island states” the average annual cost is in the order of 0.01 percent of the GDP.163 For infrastructure, the costs are calculated by region and in relation to the baseline investment scenario. The increase in costs for adaptation in East Asia is less than 2 percent of the baseline infrastructure investment. The water supply and flood protection costs for East Asia are about 10-20 percent of the increased costs for infrastructure.
For mitigation , a reduction in cumulative GHG emissions from the power sector by 25 percent until 2030 would cost about 5 percent more than the baseline. A reduction of 50 percent would increase the cost by about 15 percent. Comparative figures for the transport sector are not
163 Using GNP data (2008) from the Central Bank of the Philippines, this would correspond to about 825 million pesos, or some $18 million per year.
PHILIPPINES Discussion Note No.19: Climate Change June 2011
DN19-8
available. But a reduction of those cumulative emissions by 25 percent would cost about US$11 billion (more than 500 billion pesos) in cumulative investments until 2030, and a reduction of 50 percent would cost about US$26 billion (1,200 billion pesos). (Esguerra et al, forthcoming).
Action 2.2 Improve disaster preparedness and response 17. The government’s focus is on strengthening the capacities of institutions, especially at the local level, to reduce vulnerabilities to the impacts of natural disasters and to better manage disaster risks. The country’s disaster management system is mostly reactive and natural hazard risk management is not well integrated into development planning. There are a few local initiatives undertaken such as those in the province of Albay, which is taking a strong initiative to promote climate risk management and disaster preparedness. This is the first LGU to work on disaster- and climate-proof adaptation measures, including strengthening and improving evacuation sites, introducing climate change into school curricula and training of local officials. The country’s poor preparedness to respond to natural disasters was exposed by Typhoon Ondoy. Action 2.3 Protect key infrastructure and livelihoods against climate change impacts 18. Despite the country’s vulnerability, past and current interventions have focused largely on mitigation and only recently has adaptation been given attention. The Philippine Climate Change Adaptation Project is a key step towards helping the agriculture and natural resource management sectors to be made more climate-resilient. What this means is to identify risks (hazard, exposure, vulnerability) to specific assets as a result of climate variability and change, and to make sure that those risks are lowered through modifications of investment in a manner that is technically and environmentally sound, economically viable, and socially acceptable. For example, in the design for repair or construction of irrigation systems, rather than business as usual, climate risks can be included to make the systems more resilient. This may mean an additional investment cost, but savings would be considerable over the long term because of the resiliency of the system and the potential reduction in future rehabilitation and maintenance cost. The approaches developed could then be replicated elsewhere in the Philippines. Currently, infrastructure is designed based on historical climatic records, but future infrastructures will need to be designed based on predicted temperature changes and concomitant impact, and existing ones protected against the impacts of climate change. Action 2.4 Develop financing facilities for adaptation and disaster response 19. There is still some way to go in the development of significant international adaptation funds. The Copenhagen negotiations in December 2009 resulted in the Copenhagen Accord (UNFCCC, 2009), which takes note of the collective commitments by developed countries to provide new and additional resources, “… approaching US$30 billion for the period 2010-2012 with balanced allocation between adaptation and mitigation.” While the details of that Accord is being worked out, the government can explore innovative financing mechanisms to finance adaptation and disaster response. One mechanism is taxation of GHG emitting or polluting sources, such as coal-fired power plants, based on every kilowatt of power produced, or a “green tax” on gasoline. The funds collected could be earmarked for
PHILIPPINES Discussion Note No.19: Climate Change June 2011
DN19-9
adaptation programs. The principle is very similar to the Royalty tax imposed under Energy Regulation 1-94 of the Department of Energy, which requires energy projects to set aside small percentage of the proceeds based on per kilowatt generated for electrification and reforestation programs. Another mechanism is the taxation of CDM projects to finance adaptation activities. An example of this mechanism is the HFC-23 project in China, where the government established regulations that set aside 65 percent of the revenues of HFC-23 CDM transactions to constitute a CDM fund. Other innovative financing that can be explored include allowing individuals and firms to allocate up to a certain percentage of their income tax to adaptation activities/programs. A law could be passed to support this mechanism. This was done in Guayaquil area in Ecuador for environmental clean-up work. Another option is for companies, as part of their corporate social responsibility, to implement adaptation programs or set aside certain percentage of their revenues to support adaptation activities. Policy Area 3: Climate change mitigation programs in key sectors Action 3.1 Undertake selected mitigation programs using available financing facilities 20. Despite the Philippines’ being a minor emitter of GHGs, selective mitigation programs can be undertaken in sectors where emissions are on the rise. These include energy, transport and waste sectors, which show a strong emission increase under the business as usual scenario. The implementation of mitigation programs, albeit selectively, will help the country to sustain growth via a low carbon pathway, while attaining local environmental benefits through improved environmental quality. New mitigation financing instruments are available, particularly the Clean Technology Fund (CTF) and the Carbon Partnership Facility (CPF) (see Annex 1). The Philippines already has an approved Investment Plan under CTF (CIF, 2009). This plan entails CTF cofinancing of US$250 million to support scaled-up distributed generation with renewable energy resources and address transmission constraints through demand side management. The Investment Plan will also implement the government’s National Environmentally Sustainable Transport Strategy (NESTS) which aims to reduce energy consumption in the transport sector. The CTF investments will mobilize financing of about US$2.5 billion from the government, multilateral development banks, carbon finance and the private sector. The following are some of the areas and which can be considered under these programs. • Sustainable transport and renewable energy are among the programs identified under the
Philippine Investment Plan to be financed by the CTF, which is blended with concessional financing from multi-lateral agencies like the World Bank Group and the Asian Development Bank. The Bus Rapid Transit projects in Metro Manila and Metro Cebu are good candidates for the CTF. Energy efficient building and street lighting planned for big cities such as Quezon City and Marikina City can also be supported by the CTF, as well as the development of renewable energy sources such as geothermal and wind.
• Waste management is another candidate sector for CPF assistance. There is potential to develop the programs of activities (PoAs) for treatment systems for distillery waste, slaughterhouse waste and domestic waste water. The biggest challenge is to find a managing and coordinating entity (CME) that could develop the PoAs. Government financial institutions such as the Development Bank of the Philippines and the Land Bank
PHILIPPINES Discussion Note No.19: Climate Change June 2011
DN19-10
of the Philippines are good candidate CMEs because of their role in providing financing to project developers. The financing package they offer could include accessing carbon credits for eligible projects through enrolment under the CPF PoA. A programmatic/wholesale approach to developing the PoAs would be the key as opposed to developing and processing individual projects. The approach is more efficient and allows small scale interventions to participate and benefit from the carbon market. An example of this approach is the PoA for pig waste treatment system and for sanitary landfill developed by the Land Bank of the Philippines.
PHILIPPINES Discussion Note No.19: Climate Change June 2011
DN19-11
References CIF (Clean Investment Funds), 2009: Clean Technology Fund: Investment Plans for Philippines. Inter-sessional Meeting of the CTF Trust Fund Committee, Washington, D.C. December 1-2, 2009CTF/TFC.IS.1/4 DENR. 1999. The Philippines’ Initial National Communication on Climate Change (PINCC). Manila. Esguerra, G.C. Tiangco, S. Custodio and N. Gabiola. (Forthcoming). A Strategic Approach to Climate Change in the Philippines: An Assessment of Low-Carbon Interventions in the Transport and Power Sectors. Manila. IPCC, 2007a: Climate Change Mitigation. Contribution of Working Group III to the Fourth Assessment Report of the Intergovernmental Panel on Climate Change [B. Metz, O.R. Davidson, P.R. Bosch, R. Dave, L.A. Meyer (eds)], Cambridge University Press, Cambridge, United Kingdom and New York, NY, USA. IPCC, 2007b: Summary for Policymakers. In: Climate Change, 2007: The Physical Science Basis. Contribution of Working Group I to the Fourth Assessment Report of the Intergovernmental Panel on Climate Change [Solomon, S., D. Qin, M. Manning, Z. Chen, M. Marquis, K.B. Averyt, M.Tignor and H.L. Miller (eds.)]. Cambridge University Press, Cambridge, United Kingdom and New York, NY, USA. Philippines. 2009. Typhoons Ondoy and Pepeng: Post-Disaster Needs Assessment. November 26, 2009. Processed. UNFCCC, COP15, 2009: Copenhagen Accord. Decision -/CP.15. Advance unedited version. Copenhagen. http://unfccc.int/2860.php. Accessed December 28, 2009. World Bank, 2009a: Country Environmental Analysis. Manila. World Bank, 2009b: The Costs to Developing Countries of Adapting to Climate Change: New Methods and Estimates. The Global Report of the Economics of Adaptation to Climate Change Study. Consultation Draft. Washington, D.C. World Bank, 2009c: World Development Report 2010. Development and Climate Change. Washington, D.C.
WRI (World Resources Institute). 2009. CAIT Yearly Emissions. Climate Analysis Indicators Tool (CAIT) Version 6.0. Accessed January 31, 2010. http://cait.wri.org/cait.
Note prepared by: Jan Bojö (EASER) and Joe Tuyor (EASPS) The World Bank March 5, 2010
PHILIPPINES Discussion Note No.19: Climate Change June 2011
DN19-12
Annex 1
Climate Change Financing Facilities Mitigation The Philippines is on a growth path that will lead to much higher emissions in the future. Funding and assistance for nationally appropriate GHG mitigation programs can have significant co-benefits: Investments that reduce GHG emissions will also help to reduce the country’s dependence on imported fossil fuels, reduce local environmental pollution, and stimulate economic development. The Clean Technology Fund (CTF) seeks to scale up financing to contribute to demonstration, deployment, and transfer of low-carbon technologies with a significant potential for long-term GHG emissions savings. It includes programs in (i) the power sector, such as renewable energy and more power supply technologies; (ii) the transport sector, e.g., through improvements in public transportation; and, (iii) energy efficiency in buildings, industry and agriculture. Greater energy efficiency, a move towards renewables and a shift towards public transportation would all have significant co-benefits in terms of reducing urban air pollution. The Country Environmental Analysis for the Philippines (World Bank, 2009a) estimated that more than 1 million people get sick every year due to outdoor air pollution (OAP) in urban areas. About 15,000 people die prematurely due to OAP. The Carbon Partnership Facility (CPF) has the potential to be an important spring-board for the Philippines to achieve transformational change in GHG emitting sectors. The CPF purchases certified emission reductions under the CDM or other market schemes and offers a platform for collaboration of public and private sector partners from developed and developing countries. CPF programs are under development in Brazil, China, Indonesia, Mexico, Morocco, and Vietnam. The Philippines is exploring the possibility of mobilizing CPF for the program of activities (PoAs) in the waste management sector. An international conference was held in October 2009 and resulted in the identification of a number of potential PoAs including wastewater treatment systems for distillery waste, slaughter house waste and domestic waste water. The partnership comprises two trust funds: (i) the Carbon Asset Development Fund to prepare emission-reduction programs, and (ii) the Carbon Fund to purchase carbon credits from the pool of emission reduction programs. The CPF is open for all types of activities that (i) reduce greenhouse gases, and (ii) are suitable for scaling up, i.e., can be replicated as part of a program. Examples of the types of programs that can be included in the CPF portfolio include: power sector development, energy efficiency, gas flaring reduction, transport sector improvements and urban development programs. Adaptation There are grant financing windows that can be tapped by the country to implement adaptation measures and/or blend with loan financing to generate bigger impacts on implementing adaptation measures. As noted in the main text, the follow-up to the Copenhagen negotiations may well increase this type of funding significantly.
PHILIPPINES Discussion Note No.19: Climate Change June 2011
DN19-13
The Global Environment Facility (GEF) has been the main source of grants and concessional funding for adaptation projects globally. The first Philippine Climate Change Adaptation Project, which is under preparation by the World Bank, is to be financed by GEF. The Adaptation Fund under the UNFCCC will finance adaptation projects and programs. Funding comes from a 2 percent “tax” on certified emission reductions (CERs) issued under the Kyoto Protocol’s Clean Development Mechanism. However, the fund is not yet operational. The Global Facility for Disaster Reduction and Recovery (GFDRR) aims at mainstreaming disaster reduction and climate change adaptation measures in developing countries to reduce vulnerabilities to natural hazards. GFDRR funds disaster risk assessments, risk mitigation policies and strategies, disaster prevention preparation projects and recovery. The program has three tracks that support global, regional and country specific activities. There is already a US$1 million program in the Philippines, and this is expected to grow. Donors are working with the government to assess disaster risk at the provincial level, as a tool for designing local strategies. These risk profiles are based on historical data and cannot forecast events associated with climate change. Further work to strengthen the scientific basis for climate change risk modeling is required.
DN20-1
������������������������������ � � ���� ����������� Environment and Natural Resources Investing for a Sustainable Future T P
D
I
P
A P
W
T
LGU P
.
C. The Philippines Today: Progress and Challenges
1. The attention given to balancing utilization and conservation of natural resources, as seen in policy pronouncements, is a relatively recent development. For a long time, the government implemented a policy that emphasized economic development, with little regard for conservation. Natural resource exploitation was heavily encouraged since the American and Philippine Commonwealth periods. In fact, from the 1940s to the 1970s, the Philippines was one of the world’s leading exporter of logs. This bias toward extraction and utilization led to the degradation of Philippine forests and marine resources, with the country as a whole gaining little from this policy, and which benefited only a small, privileged segment of society. 2. In 1987, the Philippine Constitution declared that the main goal of environment and natural resources management in the country should be threefold, namely: (i) environmental protection; (ii) economic development and poverty alleviation, and (iii) the promotion of social justice and equity. It brought to the fore the Philippine Environmental Policy (PEP), embodied in Presidential Decree No. 1151 (1977). This set the stage for a policy shift from exploitation to management beginning with the 1989 Philippine National Strategy for Sustainable Development and the 1996 Action Plan for Sustainable Development, known as the Philippine Agenda 21. Executive Order (EO) No. 263 (1995) ushered in Community-Based Forest Management (CBFM) as a strategy for sustainable forest management. Several laws such as the National Integrated Protected Areas System Act and
PHILIPPINES Discussion Note No.20: Environment June 2011
DN20-2
the Indigenous Peoples Rights Act, and the Fisheries Code gave impetus to resources conservation and community-based management. 3. A comprehensive body of laws covering almost every aspect of the environment and natural resources (ENR) sector was passed since then. The Philippines has sound and comprehensive environmental laws and policies. A comprehensive framework for environmental management was set in place to replace the piecemeal legislation which prevailed in the past. These laws include the Clean Air Act (1999), the Ecological Solid Waste Management Act (2000), and the Clean Water Act (2004). The gains that could have been achieved by these legal instruments are marred by weak implementation because of inadequate capacity and financial constraints both at the national and local levels. Effective implementation is largely stifled by a highly regulatory and control-oriented approach that emphasizes compliance with rigid bureaucratic procedures, from overlap with many laws, from more attention being given to procedural compliance rather than technical contents, and from a complex and poor system of follow-up and monitoring. 4. The sustainable development agenda has been further strengthened by the formulation of the Medium-Term Philippine Development Plan (MTPDP) 2004–2010 and the country’s adherence to the Millennium Development Goals. The MTPDP identified five goals relating to the environment and natural resources sector:
• Sustainable and more productive utilization of natural resources to promote investments and entrepreneurship
• Promotion of responsible mining that adheres to the principles of sustainable development: economic growth, environmental protection, and social equity
• Strengthening the protection given to vulnerable and ecologically fragile areas
• Creating a healthier environment for the population • Mitigating the occurrence of natural disasters to prevent the loss of
lives and properties. 5. Still, the country’s rich physical and biological resources are seriously under threat because the ecosystems that support them have been severely degraded. Box 1 presents a snapshot of the main environmental problems plaguing the country.
6. It is important to realize the true economic value of the environment by putting a price on environmental degradation and its impacts on human health. The costs of environmental damage vary, depending on the economic values measured and the economic valuation method used. The Philippine Country Environmental Analysis (CEA, 2009) presents the following estimates of the economic costs of the five major environmental problems in the country: (1) for outdoor air pollution (AP), the cost of disease is Php 900 million/year and the cost of mortality is Php72 billion/year;∗ for indoor AP, the cost of disease is Php1.3 billion/year and the cost of mortality is Php27 billion/year,∗ (2) for water pollution, sanitation and hygiene, the cost of both morbidity and mortality is Php126 billion/year,* (3)
∗ in terms of the willingness to pay for the risk reductions of premature mortality
PHILIPPINES Discussion Note No.20: Environment June 2011
DN20-3
for coastal and marine resources, the cost of degradation at 2006 prices is Php5.4 billion/year, (4) for the over-extraction of forestry products the cost is Php2.7 billion/year, and (5) for soil erosion, the loss of productivity costs Php6.7 billion and for off-site costs the loss is Php27 billion. Box 1. Environmental problems and their main causes
Environmental Problem Extent of the Problem Main Causes Poor air quality in urban centers, particularly in Metro Manila
Particulate matter PM10 and PM2.5 levels in Metro Manila are at 72 and 48 micrograms(mg)/m3, respectively, above the WHO guidelines of 15 and 7.5 mg/m3
Mainly vehicular emissions
Poor water quality 11 of 88 rivers classified as biologically dead while 34 have high pollution level
Mainly from domestic waste (48%), followed by agriculture (37%) and industry (15%)
Declining old-growth forest cover and watershed degradation
Only 7 million of the 17 million hectares of forest remain
Population pressure; slash-and-burn cultivation; illegal logging
Loss of natural habitats and land degradation
3,660 hectares converted each year; 284 species considered endangered; 2 million hectares of upland cultivated for agriculture
Population pressure; encroachments; slash-and-burn cultivation; poaching and illegal wildlife trade
Declining coastal and marine resources
0.2% of the coral reefs are in excellent conditions; 5% of the mangrove cover are old-growth
Population pressure; overfishing and use of destructive methods; mangrove conversion
Sources: Philippine Environment Monitor 2000-2005
Institutional Performance 7. Both at the national and local levels, there is a good number of institutions mandated to perform ENR functions. While the decision to involve many agencies in ENR management is well-intentioned, the broad mandates of these agencies have led to contradictory roles, politicization of and instability in the ENR bureaucracy. At the executive branch, DENR is primarily responsible for the conservation, management, development, and proper use of the country’s environment and natural resources, specifically forest and grazing lands, mineral resources, and lands of the public domain, as well as the licensing and regulation of all natural resources. Other major agencies with ENR management functions include the Department of Agriculture (DA) and its Bureau of Fisheries and Aquatic Resources (BFAR), the Department of Energy; the Department of Health, as well as other agencies such as the Department of Trade and Industry, the Department of Transportation and Communication, and the Department of Public Works and Highways. At the local level, ENR management has been devolved to the local government units (LGUs) under the Local Government Code (LGC) of 1991. 8. The legislature has been quite successful in enacting landmark ENR laws, but this has resulted in the overlap of many laws which are mostly short in budget appropriations. The legislature has failed to address the acute shortage in financial, human, and technical resources to implement these laws, aggravated by unclear institutional arrangements and the incomplete devolution of the ENR functions to the LGUs. Certain ENR laws have been found to be outdated, and newer, more responsive laws are needed, e.g., a
PHILIPPINES Discussion Note No.20: Environment June 2011
DN20-4
Sustainable Forestry Act, to replace the 1970s-era Revised Forestry Code, and a new Public Land Act to replace Commonwealth Act No. 141. Also much needed are a National Comprehensive Land Use Law and a Land Administration Authority Law.
9. The judiciary influences ENR management through its power of judicial review. Trial courts have jurisdiction over criminal cases for offenses defined under ENR laws. To improve access to justice, the Supreme Court in 2008 designated 84 branches of first-level courts and 31 branches of second-level courts as special Environmental Courts, with jurisdiction to try and decide violations of environmental laws. For pollution and mining cases, the DENR’s Pollution Adjudication Board and Mines Adjudication Board have exclusive original jurisdiction, and courts only have appellate jurisdiction. In a recent citizens’ suit filed by the concerned residents of Manila Bay, the Supreme Court issued a mandamus order to the state agencies, led by the Department of Environment and Natural Resources (DENR), to clean up and rehabilitate the Manila Bay. 10. The private sector, non-government organizations, citizens’ groups and individuals are increasing their participation in ENR management. Their roles have expanded either through voluntary compliance of businesses to officially participating in natural resources planning and management arrangements such as production sharing, joint ventures, co-production agreements; representation in government councils and participation in multi-partite monitoring teams. However, a number of factors hinder participatory mechanisms from being wholly effective. These factors include poor access to environmental information, lack of mechanisms for transparency in local decision making, lack of mechanisms for feedback and/or integration of inputs, and overlapping jurisdictions. D. Where the Philippines Could be: Policy Options
11. To meet the key environmental challenges that the country is facing, the Philippines needs to make investments in better environmental management as it easily pays off in the short to medium term, not to mention its significant returns to the society at large. This section outlines policy reforms to work towards the sustainability of the country’s economy. Table 1: Philippines: Policy Areas and Actions Policy Area 1: Undertaking Cost-effective Investments to Address Environmental Issues
Action 1.1 Strengthen air and water pollution abatement Action 1.2 Protect coastal and marine resources Action 1.3 Selectively intervene in forestry and land management
Policy Area 2: Strengthening Institutions and Developing Innovative Financial Mechanisms
Action 2.1 Strengthen the capacity of DENR and LGUs in a devolved environment Action 2.2 Develop financial mechanisms for the payment for environmental services
Policy Area 3: Moving from Public Awareness to Participation Action 3.1 Promote transparency and accountability in the decision-making process Action 3.2 Enhance partnerships and improve tenure instruments for sustainable resource management
PHILIPPINES Discussion Note No.20: Environment June 2011
DN20-5
Policy Area 1: Undertaking Cost-effective Investments to Address Environmental Issues Action 1.1 Strengthen air and water pollution abatement 12. To significantly reduce air pollution, the government should build awareness and capacity regarding the widespread use of mass transit and non-motorized transport and the use of cleaner fuels in line with the full implementation of its National Environmentally Sustainable Transport Strategy. Investments in mass rapid transit systems are very important to improve access and affordability of transportation costs as well as to significantly reduce the public’s reliance on jeepneys and tricycles, which are notorious for outdoor air pollution emissions. Such investments need to address the social implications that may arise due to the displacement of the jeepney and tricycle drivers/operators. The recommended measures for reducing air pollution also result in reductions in carbon emissions that could be linked to the government’s commitment to its greenhouse gas mitigation strategy and its development of a Clean Technology Fund Investment Program.
13. A well-functioning inspection and maintenance program is one of the most cost-effective interventions in abating outdoor air pollution. The CEA estimates a benefit-cost ratio of 3.9 of an inspection and maintenance program for diesel vehicles in the Philippines. This indicates that health benefits (averted loss in human lives and reduced morbidity) of such a program are almost four times higher than the cost of the program. Switching from two-stroke to four-stroke tricycles will reduce particulate matter emissions from these vehicles by 80 percent. A cost-benefit analysis (CBA) of low-sulfur diesel and vehicle emissions control technology also shows promising results. Vehicle emission technologies are useful short-term interventions while the country is building capacity, awareness, and adoption of cleaner fuels. As such, a national program that requires vehicles (new and in-use)—especially public utility vehicles such as jeeps, buses, and tricycles is to install pollution control devices. Another intervention is the rehabilitation of the current traffic management system and strategies that can greatly improve the flow of traffic including coordinated signals/traffic lights, reversible lanes, one-way street pairs, parking controls, exclusive pedestrian zones, vehicle ban, etc.
14. For abating indoor air pollution, some of the most effective measures with high economic returns are improved ventilation, better stoves, and switching to cleaner fuels. Likewise, switching to liquefied petroleum gas is also found to provide higher benefits than costs in households cooking indoors in poorly ventilated conditions.
15. For water pollution abatement and health protection, improved sanitation and hygiene practices should be promoted widely. The largest reduction in diarrheal disease, which is the most important factor in water-sanitation-hygiene related morbidity, can be attributed to hand
PHILIPPINES Discussion Note No.20: Environment June 2011
DN20-6
washing with soap and household point-of-use drinking water treatment. Hand washing with soap can also prevent acute respiratory infections like pneumonia.164
16. Improved water supply, improved sanitation (that includes excreta disposal facilities such as latrines), improved hygiene (hand washing), and household point-of-use drinking water treatment (rural areas) show very high economic returns for boiling of water and hand washing and the reduction in diarrheal morbidity. The benefits are clear, with hand washing and household drinking water treatment being the most effective interventions in reducing diarrhea, followed by improved sanitation facilities and improved drinking water supply.
Action 1.2 Protect coastal and marine resources
17. The Philippines harbors coastal and marine resources of major international significance. Well managed, they could also contribute much more to sustainable income generation through eco-tourism and other alternative sources of livelihoods. One low-cost intervention that could give significant economic returns is through the protection and conservation of habitats through marine protected areas (MPAs), providing real alternatives through pro-poor aquaculture, and instituting a licensing scheme with the long-term objective of limiting entry to open access fishery and through nature-based tourism.
18. Mangroves, for example, although relatively small in size, generated net economic benefits of PhP 8,859 per hectare per year—the largest of any single coastal or marine resource on a per hectare basis. This somewhat surprising result reflects the large economic values associated with coastal protection, waste assimilation, and the role of mangroves in sustaining healthy fishery. Mangroves, an often overlooked resource considered as having little or no value, are actually a very important economic asset. (Mangroves will be increasingly important if climate change leads to rising sea levels; healthy mangroves provide important economic benefits too in land areas by controlling damages from storm surges.) Coral reefs were second on a per unit basis (PhP 1,487 per hectare per year), reflecting the important contribution of healthy coral reefs to fisheries, recreation, and shoreline protection.
19. The largest source of damage to coastal and marine resources is overfishing. One solution to this problem is to provide fishers with alternative sources of income that would reduce their dependence on capture fishing. A potentially attractive investment (if environmental issues can be overcome) is the development of aquaculture, especially aquaculture that is pro-poor. Aquaculture is not only potentially beneficial in terms of sustainable use of marine resources, it can accelerate socioeconomic growth and food security. However, the biophysical impacts of aquaculture may include fecal discharge of fish, waste food, and changes to genetics and biodiversity as well as poor siting, overcapacity,
164 Major findings include a 53 percent lower rate of diarrhea cases in children younger than 15, 50 percent reduction in pneumonia cases in children younger than five, and 34 percent lower impetigo incidence in households who received soap and hand washing promotion. The likelihood of frequent diarrhea is over 80 percent lower in children in communities with improved drainage and sewage systems, after controlling for potential confounders.
PHILIPPINES Discussion Note No.20: Environment June 2011
DN20-7
overstocking, and overfeeding with negative impacts on the environment. It is recommended that a 1:1 mangrove-to-fishpond ratio be maintained to improve the balance between production and conservation.
Action 1.3 Selectively intervene in forestry and land management 20. Forests in the Philippines have been a primary environmental and economic resource for centuries. The contribution of the forestry sector to the Philippine economy has two major components: the production of economic rents from the sustainable use of the forest resource (both timber and various non-timber goods and services) and the loss of forestry-dependent economic value from deforestation and land conversion. There has been large-scale conversion of forests to other uses as well as extensive commercial logging, often with limited or no replanting. 21. Selected interventions to remedy the situation of over-extraction of forestry products and conversion to other uses show promise in helping to maintain the sustainable flow of goods and services from forests. Several government actions are proposed, including the following: improvement of forest statistics and consistent application of definitions over time; long-term tenure arrangements to give forest users the proper incentives to make long-term investments; stepped up enforcement of logging regulations, including both logging techniques and reforestation and land management; and promotion of community forestry. The management and institutional costs of these interventions are high, but the potential exists for large gains for the Philippines if interventions can be successfully and efficiently carried out together with institutional strengthening and social “buy-in” on the part of those using forestlands. 22. Direct investments in soil conservation technologies can prevent or reduce soil erosion, providing on-site benefits to farmers and also reducing the off-site impacts of soil erosion. However, the benefits from avoided soil loss should be balanced against the costs of intervention. In many cases it is hard to justify the costs of soil erosion measures based solely on expected on-site benefits. Therefore off-site impacts need to be included to justify many soil control measures. Indirect measures include the use of both property rights (tenure) and economy-wide policies. In the Philippines, property rights policies have included the formalization of tenure in the uplands, which in theory should encourage farmers to make long-term investments in land quality, such as soil conservation, or to shift to permanent crops.
23. The results of several cost benefit analyses of soil conservation investments confirm the intuition that farmers would have an incentive to invest in such technologies only if they have long planning horizons and a low discount rate. Security of land tenure is not believed to be important in influencing the planning horizon, but high private interest rates imply that less soil conservation is undertaken than economically optimal. Added to this is the fact that off-site impacts will not be included in land managers’ decisions. Correction of this major market failure can be achieved by a system of payments for ecological services. These have high transactions cost but could be used selectively in watersheds that show major downstream impacts from upland land degradation.
PHILIPPINES Discussion Note No.20: Environment June 2011
DN20-8
Policy Area 2: Strengthening Institutions and Developing Innovative Financial Mechanisms Action 2.1 Strengthen the capacity of DENR and LGUs in a devolved environment 24. A review of the ENR laws and institutions shows serious fragmentation and overlaps of mandates, functions and responsibilities among the ENR institutions and the politicization and instability of the ENR bureaucracy. One critical intervention is for many of the national agencies to let go of their control over ENR matters as many of these have long been devolved to the LGUs. On the other hand, many LGUs have not fully internalized the ENR functions mandated to them, showing little interest toward ENR management. This can be traced to a number of reasons, namely: a lack of awareness of the value of good ENR management and its contribution to the local economy; the seemingly slow rate of return of ENR investments; blurred lines of responsibility between ENR institutions and LGUs; and lack of transparency and accountability for poor ENR management. The role of ENR institutions should be re-engineered to evolve from a “doer” to that of an “enabler” by providing policy guidance and technical assistance to LGUs. Devolution can be done on a phased approach by starting with LGUs that are ready and willing to assume responsibilities and allocate sufficient human and financial resources, and to be accountable for ENR management. 25. Interventions in consolidating or reallocating mandates, powers, and functions and improving coordination among national agencies and LGUs should be among the priorities of the government. These actions could include networking and knowledge sharing among the ENR institutions and LGUs including the formation of broad-based partnerships with the communities and the private sector. One strategy for sustainable ENR management is using an integrated and spatially based approach wherein management units composed of multi-sectoral teams that are organized around a critical resource following ecosystem boundaries such as those already done in several watershed areas in the Laguna Lake region and the Agno River Basin. The devolution of functions not previously passed on to LGUs under the Local Government Code and other environmental laws should be completed. Functions that can be devolved may include the administration of the EIA system and other environmental functions primarily local in scope such as sanitation, waste management, and community-based natural resources management.
Action 2.2 Develop financial mechanisms for the payment for environmental services
26. Given the country’s poor fiscal position, the limit on financial resources is a problem that the DENR and other ENR institutions share with the rest of the bureaucracy. The Government should continue streamlining the bureaucracy to free up resources for the much needed capital outlays and development expenditures. Issues on pollution are treated separately, with the responses highly compartmentalized and not fully coordinated. Budget allocations are fragmented across too many programs and projects, with priority programs changing from year to year with each new DENR secretary. This has limited the effectiveness of these programs as resources are not optimized and in many cases, issues remain unresolved. For example, within DENR, the allocation for personnel services is 62 percent of the total budget, while maintenance and operating expenses and capital outlays get 27 percent
PHILIPPINES Discussion Note No.20: Environment June 2011
DN20-9
and 10 percent, respectively. Also, its sectoral allocation reflects old mandates and priorities which has been historically focused on forestry, with the Forest Management Bureau getting 27 percent of the total budget, while the Environmental Management Bureau is allocated only 5 percent and the Protected Areas and Wildlife Bureau 4 percent (World Bank 2007). To put fiscal discipline in the allocation of its limited resources, the government could choose to focus on selected priority programs or areas to ensure impact, or tasks that can be completed despite limited resources, or those that are environmentally critical in the case of enforcement and compliance monitoring functions.
27. To address the ENR sector’s financial needs, reforms are necessary to generate more financial resources. This may include increasing the payment for environmental services and the use of environmental user fees to complement regulations and to generate revenues, encouraging private sector investments in ENR management, and tapping Government-Owned Companies and Corporations (GOCCs) and Government Financial Institutions. International development agencies could be engaged and encouraged to invest in longer-term, strategically programmed undertakings. Finally, to ensure that allocations went to the intended purposes, there should be results-based monitoring and evaluation. An assessment of the National Integrated Protected Areas Services (NIPAS) Act is also in order. The fees mandated by this act have not been used directly in the management of the protected areas where the fees are collected. 28. In the case of the Environmental User Fee system instituted by the Laguna Lake Development Authority, the system was used to complement the regulatory approaches to environment management in the lake and encourage industrial firms to invest in and operate pollution prevention and abatement systems. It includes a fixed fee for administrative costs and a variable fee that is calculated based on the biochemical oxygen demand (BOD) level and the volume of wastewater discharged into the lake. It is integrated in the payment of the discharge permit, which is only issued if the discharge complies with the BOD effluent standard.
Policy Area 3: Moving from Public Awareness to Participation Action 3.1 Promote transparency and accountability in the decision-making process 29. The Philippines has a vibrant citizens’ organization movement, with about 60,000 nongovernmental institutions. Participation by citizens and citizens’ organizations is backed by a strong legal framework. However, a number of factors hinder participatory mechanisms from being wholly effective. These factors include poor access to environmental information, lack of mechanisms for transparency in local decision making, lack of mechanisms for feedback and integration of inputs, and overlapping jurisdictions. The Philippines has a poor record of enforcing environmental legislation due to lack of political will, institutional capacity and incentives. It is important then that political intent that was demonstrated when the new environmental laws and policies were framed be continued through its implementation by involving civil society in the planning, decision-making and monitoring of ENR management.
PHILIPPINES Discussion Note No.20: Environment June 2011
DN20-10
30. Basic and essential information, such as a pollution inventory for major sectors and its health outcomes are outdated and not even available for key cities in the country. Large uncertainties in information on ENR make analysis and drafting of legislation and policies difficult. Without public knowledge and demand for specific actions, political action will continue to lag behind the rhetoric. Timely and accurate information on ENR management processes and its attendant costs and benefits can catalyze public participation. Civil society has an important role to play but must have access to the necessary information. Sharing such information encourages environmental stewardship among citizens, improves the willingness to pay for environmental services and enhances the effectiveness of economic instruments in achieving compliance. Action 3.2 Enhance partnerships and improve tenure instruments for sustainable resource management 31. Improving local livelihoods for communities is closely linked to building a base for a more sustainable management of ENR resources. It is important to see local communities as partners, working with the government to develop services and facilities. A big challenge is to ensure that the vulnerable groups, such as women, youth and indigenous peoples, are targeted beneficiaries of income-generating activities. The private sector and civil society are able to provide the human, technical and financial resources sorely missing to make ENR management sustainable. It is important to maintain systematic collaboration and consensus building across sectors, and among affected stakeholders to forge agreements on priorities and adoptable measures. To complement existing command-and-control regulations, successful initiatives to promote industry self-regulation, public-private partnerships, market-based policy instruments and community participation could be scaled up. Bureaucratic complexities and delays have often resulted in conflicts on the ground and limited the potential of these instruments to provide incentives for sustainable management and investments.
32. Enhancing the productivity of community-based natural resource management initiatives requires providing marketing assistance, improving means of transportation, improving access to credit, and fostering partnerships with the private sector (World Resources Institute 2005). The business model involving local communities and the private sector has been successfully applied to reforestation and the management of tree plantations and privately managed forestlands (under instruments like Industrial Forestry Management Agreements). While many of the private sector’s ENR projects fall under their corporate social responsibility programs, their participation in major ENR investments could include ecotourism development, sustainable agriculture, sustainable forestry, and the development of renewable energy. Beyond these activities, more substantial private sector participation and
PHILIPPINES Discussion Note No.20: Environment June 2011
DN20-11
investment in ENR management should be encouraged (such as the operation of sanitary landfills and wastewater treatment). 33. Experience shows that “open access” areas that are untenured are subject to uncontrolled and unmonitored conversion to agricultural lands and unsuitable cultivation practices that result in significant loss of soil cover and the regular occurrence of landslides, siltation, and flashfloods. Instituting a process to secure community and household tenurial rights to land and local resources equates to improving livelihoods and ensuring equitable distribution of natural wealth for the local people. Secured tenure is important because local communities are far more likely to act in ways that conserve natural resources if they have real control over it, are able to influence decisions on how resources are used and if they will end up with a fair share of the benefits. New institutional arrangements such as Protected Area Management Boards (PAMBs) and provincial environmental councils could bypass many of the existing institutional and bureaucratic constraints, and encourage local stewardship of natural resources.
PHILIPPINES Discussion Note No.20: Environment June 2011
DN20-12
References World Bank. 2009. The Philippines: Country Environmental Analysis. The World Bank, Washington DC. World Bank. 2000-2007. Philippines Environment Monitor. The World Bank, Washington DC.
Note prepared by: Maya Villaluz (EASPS), with comments from Jan Bojo, Baher El-Hefnawy, Josefo Tuyor and Gerardo Parco
DN21-1
������������������������������ � ������ ����������������������Breaking the Cycle of Conflict in Mindanao M T
T
T
A. Mindanao Today: Progress and Challenges 1. Despite persistent conflict, Mindanao has significant development potential. With a third of the country’s total land area, good soil and rainfall, and a relatively typhoon-free climate, Mindanao has earned a reputation as the country’s food basket. It has more than a third of the country’s farms and accounts for about two thirds of the country’s total agricultural exports. The Mindanao economy represents 17.7 percent of the Philippine economy (as of 2008) and about a fourth of the country’s total employment. During 1995-2008, the evolution of Mindanao’s regional gross domestic product followed closely the growth pattern of the overall Philippine economy, achieving a similar average growth rate of about 4.4 percent per annum (Figure 1). 2. But Mindanao lags behind Luzon and the Visayas, both economically and in terms of social indicators. The average per capita income in Mindanao is substantially lower than the national average with the consequence that the incidence of poverty in the region (46.7 percent in 2006) is significantly higher than the national average of 32.9 percent. Health and education indicators exhibit similar gaps, as does access to basic services. For example, in 2006, 30 percent of households in Mindanao were without access to electricity, compared to 23 percent in the Visayas and 11 percent in Luzon, while the telephone density in Mindanao
Figure 6 GDP Growth Rates: Philippines and Mindanao
(1995-2008)
Source: National Statistical Coordination Board (NSCB) Note: Growth rates are in terms of at constant 1985 prices
PHILIPPINES Discussion Note No.21: Peace and Development June 2011
DN21-2
was only 3.6 percent, versus 6.1 in the Visayas and 12 percent in Luzon.165 Indeed much of Mindanao suffers from the “accumulated neglect” of the island by central Governments which have not given Mindanao priority in the national development efforts. 3. One reason for the slower development progress is that Mindanao is trapped in a vicious cycle of conflict and underdevelopment. This conflict has its roots in colonial times when the increasing dominance of Christians resulted in the marginalization of Moros and Lumads166. This trend was exacerbated by the Government policy of promoting settlement by Christian Filipinos. Calls for Moro self-determination resulted in war against the Filipino Government in the 1970s. Since then, conflict between Moros and Christian settlers and between Moros and the national Government has waxed and waned, often with long periods of relative peace, but without permanent resolution. 4. Poor governance provides another reason for the relatively weaker development performance. Mindanao shares with the rest of the Philippines entrenched patterns of patronage politics. However, as demonstrated by the recent Maguindanao massacre, these patterns have been taken to an extreme in many parts of the region. Moro elites have tended to vacillate between opposition and accommodation to the national Government as means of attempting to consolidate power. This has tended to reinforce patronage politics and the use of force as politicians have assembled sizeable private armies, often in collaboration with the armed forces and national police. One result has been to promote intra-Moro conflict in parallel with Christian-Moro conflict. 5. Finally, economic factors, notably the limited degree of economic integration of much of Mindanao, are an equally significant causal factor. The Moro parts of Mindanao are often relatively isolated, in socioeconomic terms, from centers of growth. As a result, poverty feeds violence and vice versa.
6. Mindanao manifests two faces of development. On one side are the growth centers which exhibit sustained economic growth due to the presence of relatively good infrastructure, educational and health systems, a dynamic private sector, and world-class agribusiness firms. There are five of these in Mindanao: Cagayan de Oro, Iligan City, Zamboanga City, General Santos City, and Davao City. On the other hand are the economically lagging areas that suffer the opposite of what the growth centers enjoy, i.e., poor infrastructure and highly inadequate basic services (including education and health), poor local governance, a weak private sector, and hesitance of investors (both foreign and local) to locate their operations in these areas. A common denominator among these economically lagging areas/regions of Mindanao is the presence of armed conflict, be it Moro/Christian, intra-Moro (rido), or the presence of communist insurgents (Figure 2). 7. Poverty and armed conflict are inextricably linked in Mindanao. Conflict exacerbates poverty by destroying the physical infrastructure indispensable for the smooth operation of economic activities, discouraging the investments that generate jobs, and resulting in neglect in the delivery of basic services, particularly education and health, due to
165 These figures are taken from World Bank (2010), “Fostering More Inclusive Growth”, and based on the 2006 Family Income and Expenditure Survey. 166 The Muslim and indigenous populations, respectively.
PHILIPPINES Discussion Note No.21: Peace and Development June 2011
DN21-3
threats of physical violence to those assigned to deliver them. Consequently, the conflict-affected regions of the Autonomous Region in Muslim Mindanao (ARMM) and the Caraga Region are also the areas where the most severe forms of poverty in the Philippines can be found.167 In 2006, six of the 10 poorest provinces in the country were in Mindanao. Out of these six, three belong to the ARMM – Tawi-Tawi, Maguindanao, and Lanao del Sur. In turn, this has promoted a vicious cycle of conflict, leading to lack of investments, constraining economic growth, and resulting in limited economic opportunities, thereby giving rise to greater poverty which further fuels conflict. (The Annex describes the main triggers of conflict that are responsible for the most recent bouts of conflict.) Figure 2: Economic Distance from Growth Centers and Areas of Conflict
Source: World Bank (2010a) 8. Internal displacement is an enduring feature that aggravates poverty and vulnerability, particularly in Central Mindanao . The “All Out War” in 2000 led to an estimated 900,000 internally displaced persons (IDPs). For much of the following decade the number of IDPs hovered around the 200,000 mark, but the disturbances in the wake of the MOA-AD (cf. Annex) in 2008 brought the numbers back up. The Internal Displacement
167 By almost any measure, ARMM also has the poorest human development outcomes among the 16 regions in the Philippines. Poverty incidence is twice that of the nation as a whole. Life expectancies for men and women are more than 10 years below the national rates. Infant and maternal mortality are 30 percent and 80 percent higher than the national rates, respectively. And net primary and secondary enrollment rates are 14 and 33 percentage points lower than the national rates, respectively (World Bank 2003).
PHILIPPINES Discussion Note No.21: Peace and Development June 2011
DN21-4
Monitoring Center (IDMC - www.internal-displacement.org) currently estimates the number of IDPs as at about 160,000 (about 100,000 less than Colletta’s estimate for January 2010; cf. Figure 3). However, many of those who were earlier displaced have settled in new places and no longer show up in the statistics, yet they frequently remain amongst the most vulnerable.168 While hundreds of thousands of IDPs have returned since fighting broke out again in 2008, they have typically returned on their own, without assistance, and are now struggling to recover their livelihoods. Figure 3: Conflict-Induced Displacement in Central Mindanao, 2000-2010
Source: Colletta (2010) B. Where Mindanao Could Be: Policy Options 9. The following section lays out a multi-pronged approach to peace and development in the conflict-affected areas of Mindanao focusing on empowering communities, promoting economic integration, and addressing conflicting interests that make the achievement of peace difficult. It does not try to be comprehensive – e.g., no mention is made of education, although this is critical. Nor does it enter into the areas of promoting the peace negotiation process or security sector reform, which are farther removed from the mandate of the multilateral development banks. Rather, it presents a coherent set of actions intended to have a transformative impact on Mindanao. Note that these options are not dependent on the conclusion of a Peace Agreement.
168 To put this in perspective, the IDMC estimates the number of IDPs in Palestine as 160,000 and Afghanistan as at least 297,000.
PHILIPPINES Discussion Note No.21: Peace and Development June 2011
DN21-5
Table 1 Summary of Policy Actions to Foster Faster Development in Mindanao
Policy Area 1: Empowering Local Communities Action 1.1 Scale up Community-Driven Development (CDD) Action 1.2 Consolidate CDD programs in Mindanao under national umbrella Policy Area 2: Promoting Economic Integration Action 2.1 Develop a program of spatially connective infrastructure Policy Area 3: Addressing “Spoilers”/Strengthening Land Tenure Rights Action 3.1 Develop land policy and the regulatory framework
Action 3.2 Develop special mechanism to adjudicate conflicting land claims Policy Area 4: Improving Governance in Mindanao Action 4.1 Ensure clean, honest, and free elections Action 4.2 Audit the ARMM budget Action 4.3 Ensure greater transparency in budgetary allocations Action 4.4 Implement performance-based incentive schemes for LGUs Action 4.5 Dismantle private armies and return policing to the police Policy Area 1: Empowering Local Communities Action 1.1 Scale up Community-Driven Development (CDD) 10. Community Driven Development (CDD) has been adopted by many parties as an approach to fostering peace and development in conflict-affected parts of Mindanao. This approach is embodied in the ARMM Social Fund of the ARMM Government’s Department of Social Welfare and Development, the activities of the Bangsamoro Development Agency,169 the Mindanao Rural Development Program of the (national) Department of Agriculture, and the KALAHI-CIDSS program of the (national) Department of Social Welfare and Development. CDD has been successfully used to address the needs of conflict-affected communities in many countries around the world.170 11. Fundamentally CDD is about empowering communities to help themselves. CDD programs typically include at least two types of activities. The first is the facilitation of participatory development planning by communities in cooperation with local government authorities. The second is the implementation of priority investments (typically, but not necessarily, small roads, water supply systems, multipurpose community centers, classrooms, health posts) prioritized by the community through the planning process. Small-scale community-managed investments supported under an initial CDD approach can help rebuild
169 These activities are receiving support from the Mindanao Trust Fund – Reconstruction and Development Program and the Japan International Cooperation Agency. 170 CDD programs are appropriate in the conflict-affected parts of Mindanao because they (i) bring stakeholders together to address common problems, thereby promoting positive interactions between disparate community groups, (ii) provide solutions to issues of service delivery and local infrastructure prioritized by the community itself, and (iii) address issues of governance by empowering communities to ensure that they get what they need, thereby introducing elements of demand for good governance or social accountability.
PHILIPPINES Discussion Note No.21: Peace and Development June 2011
DN21-6
trust and improve accountability between the local state and conflict-affected communities. In Mindanao, CDD programs have also promoted income-earning activities and training (including literacy training). Action 1.2 Consolidate CDD programs in Mindanao under a national umbrella 12. In the medium term, as part of a scaled up nationwide CDD program (see Discussion Note No. 16), it would be important to provide stronger incentives for institutionalizing CDD into LGU planning and budgeting systems as part of a strategic framework for participatory decision making at the local level in Mindanao, with enhanced transparency and accountability in the use of public funds. There is a need to undertake more rigorous evaluation of CDD programs, with a view to determining what works best and what works less well in conflict-affected settings. This would provide a solid basis for scaling up such programs with enhanced effectiveness and more impact on local governance. Consequently, development partners, in collaboration with the Office of the Presidential Advisor on the Peace Process, are about to launch an evaluation of CDD programs in conflict-affected areas. It would also make sense to encourage consolidation and harmonization of approaches by bringing the CDD programs in Mindanao under the umbrella of the expanded CDD platform currently under discussion with DSWD. Additional benefits could also be achieved by bringing under the CDD approach those donor-financed programs that simply contract out the delivery of goods and services to communities. Policy Area 2: Promote Economic Integration 13. CDD is an important tool, but it is insufficient to have the transformative impact that could break the cycle of conflict in Mindanao. It is small in scale, can absorb only limited funding, and is typically less connected to larger, economy-wide development. To achieve transformative economic development it will be necessary to promote greater economic integration of lagging regions with growth poles. 14. If one compared the port and city of General Santos with Polloc Port and Cotabato City some 40 years ago, one would have found them to be at rather similar levels of development and economic activity. This is no longer the case. General Santos has outstripped its neighbor to the north, becoming one of Mindanao’s poles of growth, while the Cotabato City area has become an economic backwater. It is thus not surprising that Cotabato City’s hinterland is among the poorest parts of the Philippines. To reduce poverty in this hinterland (and in other isolated areas of Mindanao), it will be necessary to strengthen the economic links of such areas either to existing growth poles or to new ones. This is part of the logic behind the April 2010 declaration of Polloc Port as a free zone (non-Customs territory). Action 2.1 Develop a program of spatially connective infrastructure 15. Promoting new poles of growth is a worthwhile approach, but isolated areas need to be linked to them. As noted in Behind the Veil of Conflict (World Bank, 2010a), economic integration rewards localities that are linked to each other with efficient transport systems that increase mobility of people and goods. Building spatially connective infrastructure for Mindanao means:
PHILIPPINES Discussion Note No.21: Peace and Development June 2011
DN21-7
• At the national level, addressing infrastructure bottlenecks and improving competitiveness in the transport sector to allow Mindanao to participate in the large markets in the National Capital Region and outside the country.
• At the regional level, linking cities and rural areas with infrastructure improvements. Provincial road improvements linking growth centers to areas that produce raw material will reduce the disparities in economic opportunity between growth areas and lagging areas.
• At the local level, connecting remote locations to alleviate poor living conditions and reduce vulnerability to outbreaks of conflict.
16. To this end there is a need to formulate an integrated and comprehensive infrastructure plan for the island. The plan should highlight an economically and financially rational way of providing seaports and airports (both local and international), telecommunication facilities, energy, irrigation facilities, and roads (including farm-to-market and access roads) and bridges based on a value-chain development approach for the dominant agricultural economy of the island. Pertinent policies171 for the maximum and efficient use of these facilities should be reviewed such as the country’s air and sea policies, port (air and sea) management policy, energy policy, etc. The goal should be to make trading and transacting business as easy and cost-effective as possible for entrepreneurs and potential investors in Mindanao. 17. Once the hinterlands are linked by infrastructure and better policies to growth poles, they need to produce products to sell in the growth poles. The comparative advantage of the isolated areas of Mindanao is likely to lie in natural resource extraction and agricultural production. While the former has significant economic potential, transformation of the lives of the poor is more likely to come through the development of agriculture. The measures described in the Philippines Discussion Note No. 10 on Agribusiness Development are relevant here. In summary, the isolated areas of Mindanao would benefit from the promotion of measures to ensure tenure and the efficiency of land markets and to promote the participation of the private sector in agribusiness value chains. Policy Area 3: Addressing “Spoilers”/Strengthening Land Tenure Rights 18. While the conclusion of the elusive Peace Agreement with the MILF remains highly desirable, it will not be a panacea. Just as the Final Peace Agreement with the MNLF resulted in conflict with the MILF and the proposed conclusion of the MOA-AD prompted widespread opposition, there will be many interests opposed to any peace agreement. And even once signed, there will be many potential “spoilers” who could make the aftermath of a peace agreement less than peaceful. To ensure that peace holds, it will be necessary to understand the varying and conflicting interests so as to be able to mitigate, co-opt, or block these interests. And it will be necessary to recognize and address legitimate claims, even when these are in conflict, as will most certainly occur frequently with respect to land.
171 One such policy reform required is the repeal of the “Cabotage Law” to allow ships coming from international ports to pick up cargo in domestic ports (e.g., Manila) for shipment to another port (e.g., Davao or Cebu, for instance). This would have the effect of lowering the cost of cargo transport, which would be particularly beneficial for agricultural products which are shipped in bulk.
PHILIPPINES Discussion Note No.21: Peace and Development June 2011
DN21-8
19. Issues of land are central to conflict in Mindanao.172 The Moro self-determination movement is strongly motivated by a sense of injustice in being pushed out of ancestral domains, which began in the colonial period and was aggravated by the Government’s encouragement of settlement by Christians from Luzon and the Visayas in the twentieth century. Land grabbing continues to this day as powerful interests (both Christian and Moro) take advantage of the weak. One study of rido (Kamlian 2007) found that 35 percent of the examined cases of rido (clan feuds) had their origins in disputes over land. Of course, insecurity of land tenure, lack of title, and conflicting claims plague much of the Philippines, but the situation in Mindanao has been aggravated by the area’s conflicted history. Action 3.1 Develop land policy and the regulatory framework 20. The Department of Environment and Natural Resources has sought to address the problem of land insecurity through its Land Administration Project. This project seeks to develop a land policy and regulatory framework together with a consensus-building program for systematic land titling programs and awareness of community rights, roles, and responsibilities in the adjudication process for tenure rights and land boundaries, as well as implementing guidelines, standards, and procedures for property valuation. The project has been more successful in urban than in rural areas and in the area of valuation, as opposed to titling. While significant progress has been achieved, the overall needs still remain to be filled. Action 3.2 Develop a special mechanism to adjudicate conflicting land claims 21. Such administrative measures alone cannot resolve conflicting claims when they are aggravated by a sense of social injustice and when competing claims are equally legitimate. To resolve such issues will require a much better understanding of property rights and land tenure in Mindanao. It will also require a special mechanism to adjudicate and mediate such competing claims possibly coupled with a compensatory fund to compensate those who have been unduly dispossessed of their properties through ignorance of the law, inadequate knowledge of actual land values, and/or sheer threat of physical violence. The Philippines could potentially learn from the experiences of Uganda and South Africa in establishing commissions to clarify property rights, mediate disputes, and restitute land to or compensate those who have been forcibly displaced. Policy Area 4: Improving Governance in Mindanao 22. There have been many attempts in the past to improve the quality of governance in ARMM, but the results have not lived up to expectations. The recent “Maguindanao Massacre” points to a phenomenon of state failure at the local level given the employment of
172 World Bank (2010) Behind the Veil of Conflict notes that, “Land is an important asset for a largely agriculture region like Mindanao. But its full potential cannot be realized unless landowners or developers are assured of their rights to investments they might combine with land assets. Institutions governing land titling, registration, and land use are crucial. If there were widely accepted rules for gaining access to land resources and adjudicating conflict, investors would not have to be physically present to defend their investments. Unfortunately, the land market in the Philippines has been characterized by weak and inefficient institutional structures, rigid and outdated land laws and regulations, multiple and inconsistent land valuation systems used in various government agencies, and no transparency in the land registration system.”
PHILIPPINES Discussion Note No.21: Peace and Development June 2011
DN21-9
the powers of local government for sheer personal/family gain and the use of such powers in suppressing a rival political clan. There needs to be greater vigilance by the national Government on the use of such powers, particularly by well-known warlords in ARMM, exacting greater accountability from them in the use of public resources. Among the measures that can be undertaken to enhance local good governance in ARMM and other conflict affected areas are the following: Action 4.1 Ensure clean, honest and free elections 23. Declare that the President will not support any candidate for the ARMM Regional Governor position in the next ARMM election to be held in 2011. Instruct the Department of the Interior and Local Government and the Department of National Defense to collaborate with the Commission on Elections to ensure that an honest and free regional election is held. This will ensure that the umbilical cord of the political patronage system built in the past between the national political leadership and the ARMM leaders is effectively cut. In turn, this will allow the national leadership to exact greater accountability from ARMM leaders. Action 4.2 Audit the ARMM budget 24. Direct the Commission on Audit to lead a consolidated team, with representatives from all concerned government agencies and backed by sufficient security personnel, to undertake an audit of the regional government’s receipts and expenditures. This audit is necessary (i) to establish the baseline on the state of the fiscal position of the regional government before the next one is installed; and (ii) to establish clear terms of fiscal accountability for the incoming administration.173 Action 4.3 Ensure greater transparency in budgetary allocations 25. Initiate transparency in the release of public funds by the national Government to the ARMM Regional Government as well as to LGUs. These may include wider dissemination of Department of Budget and Management websites announcing internal revenue allotment releases to local media, and supporting the formation or strengthening the capacity of local budget monitoring bodies by civil society organizations, academe, and the media. Action 4.4 Implement performance-based incentives schemes for LGUs 26. Create a system of incentives for LGUs practicing good governance, such as full-time presence of local officials in their respective municipality/province and transparent and accountable use of LGU budgetary resources, such as the processes implemented under the community-driven development (CDD) programs. Action 4.5 Dismantle private armies and return policing to the police 27. Immediately start dismantling the private armies of local politicians and enforce stricter guidelines on the issuance of permits to carry firearms (particularly high powered ones by civilians). Arrest and prosecute those who violate laws on the carrying of deadly weapons. 173 Such an audit can build on the auditing done this year at the direction of the Arroyo administration.
PHILIPPINES Discussion Note No.21: Peace and Development June 2011
DN21-10
Revoke Executive Order (EO) No. 546, issued in July 2006, authorizing the police to use “Civilian Volunteer Organizations” (CVOs), supposedly unarmed (but in fact often armed) security volunteers as force multipliers against “rebel” groups. Allocate more resources to the police so that they are better able to fulfill their mandate. References
Abinales, Patricio N. 2000. Making Mindanao: Cotabato and Davao in the Formation of the Philippine Nation-State. Quezon City, Ateneo de Manila University Press.
Colletta, Nat. 2010. The Search for a Durable Solution: Armed Conflict and Forced Displacement in Mindanao, Philippines. Unpublished paper submitted to the WB-OM.
Dy, Rolando. 2004. Rural Growth and Development Revisited (Why and How can Mindanao be an Integral Component). Unpublished paper submitted to the WB-OM.
______and Fermin Adriano. 2006. Assessment of Mindanao’s Potential for Growth and Development and Linkage with the Mindanao Trust Funds’ Reconstruction and Development Project (MTF-RDP). Unpublished paper submitted to the WB-OM.
Foundation for Rural Institutions, Economics and Development . 2002. Mindanao Social Assessment of Conflict-Affected Areas. Unpublished paper submitted to the WB-OM.
Internal Displacement Monitoring Centre.
Kamlian, Jamail A. 2007. “Survey of Feuding Families and Clans in Selected Provinces of Mindanao” in Wilfredo Magno Torres III, ed. 2007. Rido: Clan Feuding and Conflict Management in Mindanao, Makati City: The Asia Foundation.
National Statistics Office. 2010. “Philippines: IDP Return Still Hampered by Insecurity and Lack of Assistance”. www.internal-displacement.org.
National Statistical Coordination Board.
World Bank. 2003. Human Development for Peace and Prosperity in the Autonomous Region in Muslim Mindanao. Pasig City: WB-OM.
World Bank. 2010a. Behind the Veil of Conflict: Moving Toward Economic Integration for Sustained Development and Peace in Mindanao. Philippines Country Management Unit.
World Bank. 2010b. “Fostering More Inclusive Growth”, Report No. 49482-PH, HD and PREM Units.
Note prepared by: Fermin Adriano and Mark Woodward (EASPS) The World Bank
PHILIPPINES Discussion Note No.21: Peace and Development June 2011
DN21-11
ANNEX Triggers of Current Destabilization
Evolution of the ARMM under the Arroyo Administration . Since taking office, the Arroyo Administration pursued a two-pronged strategy vis-à-vis Moro separatists. With respect to groups linked to international terrorism – the Abu Sayaf Group and Jemaah Islamiyah – as well as the kidnap-for-ransom (KFR) syndicates operating in Central and Southwestern Mindanao, the Government continued to pursue a military solution. However, for the Moro National Liberation Front (MNLF) and the Moro Islamic Liberation Front (MILF), which renounced terrorism as an instrument to pursue their goals, the Government pursued peace negotiations. In 2001, as part of the continuing compliance with the 1996 Final Peace Agreement (FPA) with the MNLF, Republic Act No. 9054 was passed with the purpose of conducting another plebiscite to determine which among the provinces originally claimed by the MNLF would like to be included in the ARMM. However, the “yes” vote won only in two additional areas: Marawi City in Lanao del Norte, and Basilan (except for its capital city of Isabela). They, together with the original provinces of Maguindanao, Lanao del Sur, Sulu and Tawi-Tawi, now constituted an “expanded ARMM”. An ARMM election was held in 2004 and a new set of political leaders, not affiliated with the MNLF, won. They were led by traditional Muslim political leaders with the son of the powerful Ampatuan patriarch of the Maguindanao province, Zaldy Ampatuan, elected as ARMM Governor. This has had a marginalizing effect on the MNLF which had provided leadership to the Muslim armed struggle in the 70s and 80s. The Ampatuan clan was closely allied with the Arroyo Administration, thereby leading many Moros to believe that Moro interests in ARMM were subordinated to those of the national Government. Memorandum of Agreement on Ancestral Domain (MOA-AD). The peace negotiations with the MILF broke down in August 2008 when the signing of the Memorandum of Agreement on Ancestral Domain (MOA-AD) by the Government and Moro Islamic Liberation Front (MILF) negotiating panels was aborted. The MOA-AD proposed the creation of a “Bangsamoro Juridical Entity” (BJE) which would have expanded the territory of the present ARMM to include municipalities where Muslims are the majority as part of the Muslims’ “ancestral domain”. While the territories included in the BJE are significantly smaller than the original list included in the 1976 Tripoli Agreement and the former Special Zones for Peace and Development (SZOPAD), Christian political leaders and groups in Mindanao protested the inclusion of additional territories to the current ARMM. A temporary restraining order (TRO) was issued by the Philippine Supreme Court to prevent the document from being signed and, later, it declared that the MOA-AD was unconstitutional. Some more radical elements within the MILF viewed the non-signing of the MOA-AD as a demonstration of the Government’s insincerity. Without any apparent directive from the MILF Central Committee, simultaneous attacks on civilian targets were launched in the provinces of Lanao del Norte, North Cotabato, Sarangani and Sultan Kudarat. The killing of civilians combined with the massive negative public reactions generated by the MOA-AD resulted in the abandonment by the national leadership of the MOA-AD and prompted punitive military operations against the so-called MILF “rogue” commanders. More than half
PHILIPPINES Discussion Note No.21: Peace and Development June 2011
DN21-12
a million civilians were displaced by the hostilities. Eventually (in July 2009) both the Government and the MILF suspended their military operations. The suspension of hostilities made it possible for the Government to resume informal talks with the MILF panel after reconstituting its negotiating panel. Late last year, the two panels met and agreed to form an International Contact Group (ICG), composed of three foreign government partners (UK, Japan and Turkey) and four international non-government organizations, to act as “observers” when negotiations resume. They also agreed to include a “Civilian Protection Component” to the International Monitoring Team (IMT) to protect non-combatants and internally displaced persons whenever armed hostilities break out between government troops and MILF rebels. The Maguindanao Massacre. With the peace situation still remaining explosive in parts of ARMM and the Central Mindanao provinces, the instability in the region was accentuated by the “Maguindanao Massacre” that occurred in November 2009. The ‘Maguindanao Massacre” involved the brutal killing of 57 unarmed civilians composed of scores of journalists and relatives and supporters of a rival political clan of the powerful Ampatuan family, the Mangudadatu clan. The crime was allegedly committed by one of Maguindanao Governor Andal Ampatuan’s sons and the family’s private armies. The closeness of the Ampatuan clan to the then incumbent President, the vicious manner in which the killings were perpetrated, and the existence of armed civilians serving as private armies of powerful families in Mindanao brought to the fore the numerous sources and complexities of conflict and instability in Mindanao. The incident demonstrated that “warlordism” in Mindanao exists not by mere accident but through a system of patronage nurtured by the national political leadership which relied on local warlords to deliver votes for administration candidates come election time. Powerful clans solidify their political and economic control of local resources through the formation of private armies which protect them from their political rivals or, in some instances, are used to physically eliminate political competitors. And in a socio-political milieu wherein the practice of “rido” is endemic, warlordism and the tacit support of the national political leadership for certain warlords174 by virtue of being a political ally is a major contributory factor to persistent instability in the region.
174In the case of the Ampatuan clan, it has not only been a reliable ally in delivering solid votes for the administration during election time, the family also formed an integral component of the Government’s counter-insurgency strategy against the MILF considering the existence of a “rido” between the Ampatuan clan and rival political families sympathetic to the MILF. Moreover, as traditional political leaders, the Ampatuans compete against the MILF for the loyalty of ordinary Muslims. Thus, the creation of private armies by the Ampatuan family should not only be seen as protection for members of the clan but a way to wean away ordinary Muslims from joining the MILF and for their military deployment against the MILF whenever needed.
IV. GOOD GOVERNANCE
DN22-1
������������������������������ � ��������
��������� Energizing the Governance Reform Agenda T
R A T
A T
T A
T
O O C A C S C .
A. The Philippines Today: Progress and Challenges 1. There is strong public demand for good governance in the Philippines. A recent Social Weather Stations poll indicated that the two issues that most concern the public are hunger and corruption. A poll of world opinion makers conducted by the World Bank in 2008 showed that respondents in the Philippines were the only ones among those polled in East Asia who identified “improving governance” as the most important means to generate faster growth in their own country. 2. The governance challenges are neither new nor unknown. The government’s own 2004-2009 Medium-Term Philippines Development Plan acknowledged that “graft and corruption are increasingly viewed as threats to the sustained growth and development of the country…the culture of corruption in the country breeds the vicious cycles of poverty and underdevelopment.” This statement remains valid today. Corruption diverts public resources and denies the poor access to schools, health care and other basic services. The impact of public investments is diluted and public confidence in the government eroded when funds are siphoned off by corrupt intermediaries.
F P
S W B G P
PHILIPPINES Discussion Note No.22: Governance June 2011
DN22-2
3. Corruption is just one aspect of broader governance challenges. The 2009 Philippine Human Development Report attributes the country’s slow progress in human development to perverse incentives that the weak public sector institutions create for the public officials who formulate and implement government policies. A 2004 World Bank study of the impact of corruption on service delivery, for instance, concluded that declines in corruption indexes are correlated with improvements in social indicators.175 Key Governance Challenges Executive control over the budget 4. The President of the Philippines has very wide discretionary powers over the budget. The President may veto a line-item in an appropriation, revenue or tariff bill. On an annual basis, successive Presidents have used this power to selectively veto a number of items inserted by legislators into the executive budget proposal. More importantly, the President has the prerogative whether or not to disburse funds appropriated by Congress and reallocate unspent balances as “savings.” In 2008, for instance, an estimated PHP 38 billion was realigned from the government’s overall “savings” to various agencies, in contravention of what was indicated in either the Executive’s original budget proposal or the General Appropriations Act as authorized by Congress.176 It is virtually impossible, even for the Commission on Audit, to know exactly from which parts of which agencies’ budget these “savings” were generated to fund the government’s “realigned” priorities. 5. The President has multiple forms of discretionary funds, including some of the Special Purpose Funds (SPFs). In 2010, SPFs represent 57 percent of the national budget. Although most of these are automatic payments for items such as debt service, transfer to Local Government Units (Internal Revenue Allotment) and pension benefits for retired public servants, they include some funds with significant allocations over which the President’s Office has a high level of discretion and limited public reporting and accountability obligations.
6. In 2008, highly discretionary portions of the SPFs amounted to PHP 58 billion.177 When combined with “savings”, the total highly discretionary budget equaled approximately PHP 90 billion, more than the appropriations that year for the Departments of National
175 Improvement of one standard deviation in the International Country Risk Guide corruption index leads to a 29 percent decrease in infant mortality, a 52 percent increase in satisfaction among recipients of public health care, and a 30–60 percent increase in public satisfaction in roads: see World Bank. (2004) Mainstreaming Anticorruption Activities in World Bank Assistance: A Review of Progress since 1997, Washington, DC: World Bank 176 The largest recipient of these transferred “savings” was the Department of Public Works and Highways which received PHP 32.9 billion on top of its originally proposed obligations level of PHP 94.5 billion. The largest “contributors” to the overall “savings” (i.e., those agencies from which most savings were derived) were the Department of National Defense (PHP 7.1 billion) and the Department of Education (PHP 6.0 billion). Data source: National Expenditure Program 2010. 177 This estimate includes the Area Development Assistance Fund, Calamity Fund, Contingent Fund, National Unification Fund, E-Government Fund, Priority Development Assistance Fund, parts of the Unprogrammed Fund, Economic Stimulus Fund and the Allocation to LGUs other than the IRA.
PHILIPPINES Discussion Note No.22: Governance June 2011
DN22-3
Defense, Justice, Labor & Employment and Health combined.178 In 2010, highly discretionary SPFs alone increased to an estimated PHP 114 billion (see Figure 2), or more than the Departments of Agriculture, Agrarian Reform, Environment & Natural Resources, Social Welfare & Development and Transport & Communications combined. Use of SPFs is not accounted to Congress. The Commission on Audit has difficulty accessing documentation to ensure the funds are appropriately used. Included among the SPFs is the Priority Development Assistance Fund (PDAF), which, although small as a proportion of the budget, represents important leverage for the President over Congress. Figure 2 depicts the evolution of discretionary SPFs, including the PDAF.179 7. Presidential discretion over budget disbursement – including the PDAF – increases executive control and asserts the importance of Presidential patronage to Congress. This undermines Congress’ motivation to monitor executive performance, facilitating abuse of power and lack of accountability. Spending agencies, for example, are required to submit quarterly financial progress reports to Congress, the Department of Budget and Management, and the Commission on Audit.180 In reality this is rarely done properly, yet Congress does not hold them to account. Many agencies also consistently fail to resolve adverse audit findings, but with Congress not taking action, agency budgets remain unaffected.181 Executive control over bureaucratic appointments 8. The independence of the civil service is undermined by considerable Presidential prerogative over appointments. With the power to appoint down to the Director level, the President has the direct authority to select more than 10,000 officials.182 This creates instability, uncertainty and volatility in the execution of government policy. In practice, this power is not exercised over all government agencies, but has the biggest impact when political appointees are placed in senior positions in agencies with regulatory, judicial and quasi-judicial functions. The appointment power also provides scope for prioritizing political criteria over merit. It has been estimated, for instance, that more than half of all
178 Because “savings” includes money drawn from the SPFs, the PHP 90 billion figure is an estimate, as it includes some double counting. 179 In addition to SPFs, there are multiple other budget items over which the Executive enjoys wide discretion. These include agency Intelligence Funds and so-called nationwide lump-sum allocations in individual agency appropriations, the exact use of which is at the discretion of the government (the President or agency heads). An example of a nationwide lump-sum allocation is the so-called GMA Rice Program, which comprised PHP 10.04 billion of the total PHP 14.47 billion appropriated in 2009 to DA’s Development of Crops Sector operations. 180 General Appropriations Act 2010, s 95. 181 For example, over the period 2006-2008, DPWH received three consecutive “adverse” audit findings and fully implemented only 11 of 138 CoA report recommendations. However, from 2007-2009, the Department’s budget increased from PHP 71 to PHP 130 billion. 182 This authority derives from the 1987 Constitution, Article VII, Section 16.
�
�W,>�W
F E D SPF
PDAF
H D SPF
PHILIPPINES Discussion Note No.22: Governance June 2011
DN22-4
undersecretaries and assistant secretaries in the civil service do not meet the mandated selection criteria.183 Agency capture 9. Despite the perception that corruption is widespread in the Philippines’ public sector, the degree to which politicization and rent-seeking has permeated the bureaucracy appears to vary across agencies. The Bureau of Internal Revenue and the Department of Public Works and Highways, for example, have consistently ranked among the most corrupt agencies in public opinion surveys and seem to have allowed outside vested interests to collude with elements inside to run a variety of sophisticated rent-seeking schemes. Various investigative reports suggest that other institutions such as the Department of Agriculture and the Department of Transportation and Communications have also been subject to capture by outside forces for rent-seeking opportunities. An investigative report on corruption in the construction of the Ninoy Aquino International Airport Terminal 3 (NAIA3), for instance, shows how the Department of Transportation and Communications was captured by rent-seekers to bend regulatory decisions in their favor.184 Weak procedural constraints over executive action 10. Given the limited nature of Congressional monitoring and the capture of certain government departments by vested interests, strong oversight agencies are required as a check on executive abuse of power. And yet the Office of the Ombudsman, the Civil Service Commission and the Commission on Audit suffer from technical deficiencies, a lack of accountability and political interference to be truly effective watch dogs of potential wrongdoings in the public sector. Prospects for Reform 11. Reforms to fix these problems have been proposed for many years but have been hampered by the absence of incentives for change. However, change that challenges vested interests is possible. Reforms during the Ramos era to open up competition in key industries, such as telecommunications, were initially rejected by those who previously held monopoly power. However, when competition created a larger market that ultimately generated greater business opportunities for all, opposition dissolved. 12. There are positive developments, such as in public procurement, that provide opportunities for incremental governance reform. Although it targets one of the largest sources of rent-seeking, procurement reform is arguably the most coherent and sustained governance reform in the Philippines in the last decade. The 2003 Procurement Reform Law (RA 9184) is widely considered a sound legal framework that stipulates consistent application of rules across all government agencies, including Local Government Units. The law introduced e-procurement, making tenders competitive and open to the public. It increased transparency by mandating civil society participation as observers on bids and awards
183 Human Development Network (2009) Philippines Human Development Report 2008/2009; Manila: HDN. 184 “Dirty Deal” Newsbreak Sep/Dec. 2007.
PHILIPPINES Discussion Note No.22: Governance June 2011
DN22-5
committees. Finally, the law created the Government Procurement Policy Board as the main government agency to oversee implementation of the law and promote transparency, accountability and competition in government procurement. Although procurement-related corruption continues to occur, significant progress has been made. A more competitive and open market has been created and an estimated 30 percent saving made in the cost of government procurement.185 B. Where the Philippines Could Be: Policy Options 13. The reputation and legacy of the government will be largely determined by its record on improving governance. Many other political leaders and governments around the world have faced these same challenges. This note lays out some suggested short- and medium-term priorities, drawing on successful experiences from the Philippines and other countries. Addressing the problems will require a combination of measures to restore proper checks and balances between the executive and the legislature, support a more professional and accountable civil service (including the judiciary and the statutorily independent constitutional bodies) and to strengthen public voice and oversight. Table 1: Philippines: Policy Areas and Actions
Policy Area 1: Short-term Priorities Action 1.1 Resolve high-profile graft cases Action 1.2 Reduce conflict of interest Action 1.3 Put forward a Freedom of Information Act for legislative approval Action 1.4 Voluntarily disclose financial information Action 1.5 Select a strategic agency widely perceived to be corrupt and launch a comprehensive reform plan Action 1.6 Try out different approaches to improving governance at the Regional Level
Policy Area 2: Medium-Term Reforms Action 2.1 Make the budget more accountable Action 2.2 Create a more professional and accountable bureaucracy Action 2.3 Strengthen constitutional bodies for stricter enforcement of rules Action 2.4 Propose amendment to the Bank Secrecy Act to facilitate corruption investigations and prosecutions
Short-term Priorities 14. In the short-term, confidence-building measures can generate much-needed credibility and public trust . It is important to send a signal to citizens who may have grown tired of hearing about one graft case after another involving high-ranking officials that the Administration is serious about holding those responsible for past offences to account while minimizing opportunities for similar wrong-doings in the future. Furthermore, history also demonstrates that conditions for reform will be favorable in the initial period of the new administration. Post-election reform momentum has been grasped in the past to push through change. Experience indicates that client-patron relationships between business interests that
185 Government of the Philippines, Medium Term Philippines Development Plan 2004-2010, p.250.
PHILIPPINES Discussion Note No.22: Governance June 2011
DN22-6
fund political campaigns, the politicians in question and high-level bureaucrats tend to crystallize within six months or so of an election. Thus, the “honeymoon” can be short, so the new government will need to have a set of plans in place for immediate post-election implementation. Action 1.1 Resolve high-profile graft cases 15. While it would not be appropriate for the President to interfere in the judicial process in specific cases, a fresh push to resolve some of the major high-profile corruption cases would garner public support and send a powerful message that the government is serious about anti-corruption. In some countries the public has the right to information on the status of ongoing corruption investigations. Coupled with systematic regular reporting by the Office of the Ombudsman on unresolved cases, this would be a useful transparency measure. Reviving once-successful programs, such as the lifestyle checks on senior government officials, would be an appropriate complement to beefed-up prosecutorial efforts.186 Action 1.2 Reduce conflict of interest 16. Many senior public officials (elected and appointive) have business interests that are directly affected by government policies. Rightly or wrongly, this inevitably creates public perceptions of a conflict of interest. The Philippines has a solid legal framework related to conflict of interest in both the Constitution and Republic Act No. 6713. This includes the requirement for all public officials to annually disclose a Statement of Assets, Liabilities and Net Worth (SALN). However, practice suggests that irregularities in SALN are often not acted upon, despite sanctions in the law for unexplained wealth. Furthermore, restrictions on the business interests of Cabinet Secretaries are less strict than in some other countries. Ministers in the Federal and some State governments of Australia, for instance, are required to divest themselves of all shares and interests in any for-profit company, even if the company does not fall under the Minister’s portfolio. Ministers in the US, UK, New Zealand and Canada are subject to specific Codes of Conduct or Standards of Ethical Conduct that set higher standards than those which apply to regular public officials. 17. To prevent conflict of interest, the Philippines could consider specific, stricter Codes of Conduct for Cabinet Secretaries and parliamentarians. This could include the requirement to divest all holdings in private companies, either through sale or placement in a blind trust under the control of a qualified independent financial management firm. This maintains the wealth of the official, reduces suggestions of corruption and raises the credibility of politicians in the public eye. The President could: (i) consider such action as a criterion for selection of the Cabinet; and (ii) promulgate a new Code of Conduct for Cabinet Secretaries with strict standards related to conflict of interest in the first 100 days of the government.
18. The government could also strengthen the impact of the SALN by auditing a randomly selected set of statements each year. In Albania, for instance, the government verifies four percent of all submitted statements using a lottery system to select those to be audited. The
186 Lifestyle checks have been undertaken at different times by the Revenue Integrity Protection Office under the Department of Finance, the Office of the Ombudsman and the Presidential Anti-Graft Commission (PAGC).
PHILIPPINES Discussion Note No.22: Governance June 2011
DN22-7
selection is conducted in public in the presence of the media and civil society to enhance transparency.
Action 1.3 Put forward a Freedom of Information Act for legislative approval 19. Breaking down the hold that vested interests have over governance requires action on multiple fronts. Citizens’ participation, transparency and public oversight are areas where significant gains have been made in the Philippines, drawing on the country’s strong and active civil society. The Administration could contribute significantly to governance reform by putting up for legislative approval a Freedom of Information (FOI) Act, as neighboring countries such as Thailand, Indonesia and India have done over the last decade. In addition to being an integral part of an open governance system, the Act would also send a strong signal that the government is committed to transparency. Numerous Bills have been introduced into this and previous Congresses, but none have been approved. House Bill No. 3732 and Senate Bill No. 3308 were passed by both houses but not ratified within the term of the pre-election Congress. So the passage of an FOI Act should continue to be part of the government’s priority legislative agenda. Once an FOI Act is passed, the government could commit to expedite drafting of Implementing Rules and Regulations to ensure rapid implementation of the law. Even before an FOI Act is passed, however, the President could immediately ensure the highest standards of public disclosure in the Executive branch of government through an Executive Order. Action 1.4 Voluntarily disclose financial information 20. Passage of an FOI Act would obviously require cooperation of the Legislature, but the executive alone could take unilateral actions to promote greater transparency in government operations. A good place to start would be voluntary disclosure of certain financial information, such as in-year transfers of appropriated funds across categories or programs. Currently, extensive transfers of funds across budget categories make it difficult for the public and auditors to know exactly how the government is spending its money. Another example would be public disclosure of information related to public procurement and contracting in high-value sectors such as public works. Full participation in the Construction Sector Transparency (CoST) Initiative and the Extractive Industries Transparency Initiative (EITI) could be an effective way to systematically improve transparency in these important areas. Action 1.5 Select a strategic agency widely perceived to be corrupt and launch a comprehensive reform plan 21. Many successful anti-corruption campaigns start by targeting a particular agency for reform to secure a quick win. The Medium Term Philippines Development Plan identifies the Bureau of Internal Revenue and the Bureau of Customs as potential showcases in the fight against corruption. The ambitious objective of reforming these agencies remains as valid today as in 2004. In other countries, a Customs Agency was reformed by introducing electronic clearing procedures including random searches to reduce corruption opportunities. In another, the Attorney-General’s Office was re-staffed and re-organized. Elsewhere, a supervisory unit of the Ministry of Finance was reformed, with increased wages provided to staff in return for tight scrutiny of their income and assets and strict accountability for
PHILIPPINES Discussion Note No.22: Governance June 2011
DN22-8
performance. Bold moves like these demonstrate the government’s commitment to action. And when the scope of problems appears overwhelming, targeting one strategic agency provides a credible, though not necessarily easy, starting point for a government’s anti-corruption campaign. Action 1.6 Try out different approaches to improving governance at the Regional Level 22. Governance reform is a continual process that has no “one-time fix” or clear end point – experimentation and constant improvement are necessary. One option that Central line agencies could consider in this regard is to use Regional Offices for the purpose of testing out new ways of doing business to improve governance. High spending agencies, for instance, could consider introducing an independent procurement agent in specific regional offices as a means of reducing corruption. Results in the pilot region could be compared with non-pilot regions in terms of reduced costs and leakage to measure benefits before considering scale-up. Medium-term Reforms 23. Medium-term reforms are needed to tackle the systemic problems. The short-term measures described above are unlikely to constitute the comprehensive governance reform that the country needs but, if credible, can provide time to launch plans for the medium-term. Identified short-term priorities, therefore, must be both achievable and of sufficient profile to generate public confidence. Reforms to reduce executive discretion and establish proper checks and balances are necessary but will undoubtedly be politically difficult. An appropriate strategy, therefore, is to pursue incremental change through a set of targeted small steps to cut back executive prerogatives over the budget and bureaucratic appointments, restore the oversight role of Congress, strengthen the role of oversight agencies to prevent and punish corruption, and enhance transparency and opportunities for citizens to participate in governance. Action 2.1 Make the budget more accountable 24. The ways in which the government budget is used or abused for political purposes have long been known thanks to investigative reports and advocacy by some civil society organizations. However, awareness of the need to tighten regulation of national budgeting has increased lately because of recent revelations of questionable handling of the budget by both the executive and the legislature, such as the alleged abuse of “savings” by the executive. 25. A number of bills have been filed in both houses of Congress to reform the legal framework governing different aspects of budgetary procedures, although none seem to have been pursued vigorously by either chamber. The new administration will be in an excellent position to seize post-election reform momentum and launch a serious review of the legal framework governing national budgeting and financial management. The thrust of the reform would be to increase transparency in the budget process, not only during formulation and approval, but also execution.187 Reform could also reduce discretion by both the executive and the legislature that facilitates motivated abuse of public money.
187 See companion Philippines Discussion Note on public financial management.
PHILIPPINES Discussion Note No.22: Governance June 2011
DN22-9
26. An ideal option would be to develop and propose for passage a new law that comprehensively regulates budgeting and financial management. Such a law could include, inter alia, tighter regulations on re-allocation of appropriated funds during a year (“virement” in specialist terms) including the use of so-called savings and unprogrammed funds; greater incentives for the executive and the legislature to pass the General Appropriations Act on time; cutting Special Purpose Funds and imposing stricter reporting requirements for those that remain; and greater transparency in the budget process, especially regarding the conduct of the bi-cameral conference to hammer out differences in House and Senate general appropriations bills. Likewise, laws and regulations that give legislators an active role in execution of the approved budget could be reviewed to limit the quasi-executive role such laws allow legislators to play.188 27. A new law would not necessarily translate into full implementation. However, the positive experience with procurement reform suggests that a strong legal framework can clarify the subsequent reform agenda around a set of implementation challenges that stakeholders, including civil society and international development agencies, can gather around to support reformers in the government. 28. The budget reform strategy needs to be carefully planned in view of political considerations. Once the overall reform direction is agreed upon, legislative changes could be introduced incrementally if it is not possible to muster sufficient votes in Congress for a comprehensive overhaul of the legal framework in a single attempt. The government could consider introducing specific changes through internal regulations (e.g., executive order) with proper enforcement mechanisms. Once a set of procedural changes is consistently applied, the government could then work with Congress to prepare an omnibus law that consolidates and codifies these procedural changes in a single piece of legislation.
188 An example is a requirement in the 2003 Governance of Basic Education Act that the Department of Education consult with a relevant member of Congress in identifying school/classroom building/repair projects.
Box 1: Budget Transparency: Earmark Reforms in the United States Congressmen in the Philippines, as in the US, often use their “power of the purse” during budget deliberations to increase agency appropriations above the allocation in the National Expenditure Plan prepared by the Executive. In 2010, for instance, so-called “Congressional insertions” increased the DPWH budget from PHP 96 to 126 billion. The lack of transparency in this process gives rise to regular allegations that insertions are made for political or personal benefit. In 2009, the US Congress initiated an eight step reform to increase accountability and transparency in the earmarking process:
1. Members are required to post all requests online 2. Member must certify to the Appropriations
Committee that they will not benefit financially from the earmark.
3. Executive Review: the appropriate agency will be given 20 days to check that the proposed earmark is eligible for funding
4. Full disclosure: Each bill must be accompanied by a list identifying each earmark and the requesting member
5. Cap of 1%: total funding for non-project based earmarks will be limited to 50% of the 2006 levels and no more than 1% of the total discretionary budget
6. Votes: proposed earmarks are subject to amendments on the floor of the Senate and House.
7. Competitive process: earmarks directed to for-profit entities will undergo a competitive bidding process.
8. Rescissions: in the event that any “clunkers” are discovered after enactment, Congress can consider proposals by the President to rescind funding.
PHILIPPINES Discussion Note No.22: Governance June 2011
DN22-10
Action 2.2 Create a more professional and accountable bureaucracy 29. A patronage-based system of bureaucratic appointments serves short-term aims of ensuring re-election by placing control of state resources in the hands of a few powerful people. However, it critically impairs the state’s ability to effectively execute policy and programs, because the most capable officials are not necessarily appointed to senior positions. Political interference also undermines the professionalism and policy consistency of the bureaucracy, reducing the quality of basic service delivery to the public. A gradual reduction of the President’s power of appointment would be appropriate, starting by removing authority to appoint Directors. Regulations preventing the appointment of Assistant Secretaries and Under Secretaries who do not meet the required qualifications could also be strengthened. Action 2.3 Strengthen constitutional bodies for stricter enforcement of rules 30. The drafters of the 1987 Constitution recognized that accountability in the public sector would not be achieved with self-restraint and good intentions of the executive branch alone. They thus entrusted in the three constitutional bodies – the Office of the Ombudsman (OMB), the Civil Service Commission (CSC) and the Commission on Audit (COA) – the role of enforcing public sector rules. However, effectiveness of these agencies has fluctuated depending on the actual level of independence the executive has given them and the quality of leadership. The perceived variation in the quality of leadership and hence the effectiveness of these agencies is often attributed to the politicization of appointments of the agency heads. Although changing the appointment procedures for the heads of the constitutional bodies might require constitutional amendment, it may be worthwhile considering such an option to reduce executive discretion. New rules could tighten eligibility criteria in terms of conflict of interest, whether merely perceived or real. Direct participation of civil society representatives in the appointment process (e.g., finalization of short lists) could also be explored. 31. Technical competence and political independence of agency leadership are essential, but not sufficient, for the effective functioning of constitutional bodies. The quality of the technical staff also needs to be elevated so that, for example, OMB lawyers would not be “out-gunned” by well-paid private sector lawyers in high-profile graft cases. In some countries (Indonesia’s Corruption Eradication Commission, for instance), this is done by exempting employees of the constitutional bodies from the salary standardization law and offering them pay comparable to lawyers and accountants with similar experience and qualifications in the private sector. 32. Finally, the constitutional bodies’ oversight functions would acquire real “teeth” if their findings and recommendations are properly followed up, including through criminal prosecutions. Prosecution for corruption of high-ranking government officials is the responsibility of the Office of the Ombudsman. For other offences, the agency responsible for criminal prosecution is the Department of Justice (DOJ). The Department is often seen as technically weak and politically too close to the executive – naturally so, as it is a line department headed by a Cabinet Secretary appointed by and answerable to the President. Creation of a constitutionally independent public prosecutor’s office might be an interesting option to consider, given the potential for political interference in DOJ’s investigative efforts.
PHILIPPINES Discussion Note No.22: Governance June 2011
DN22-11
Action 2.4 Propose amendment to the Bank Secrecy Act to facilitate corruption investigations and prosecutions 33. Republic Act 1405 or the Secrecy of Bank Deposits Act can be a hindrance for agencies that investigate and prosecute corruption from accessing the bank accounts of suspects. This is a significant constraint on the ability of the Office of the Ombudsman to investigate and punish corruptors. The Act could be proposed for amendment so that current and former public officials charged before the Courts under the Anti-Graft and Corrupt Practices Act are considered to waive their legal right to privacy, opening up their accounts to investigating authorities. If Congressional support cannot be secured for this reform, the government could instead pass an administrative measure that obtains from government officials under investigation a document authorizing the release of bank records. References Clausen, B., Kraay, A. & Nyiri, Z. (2009) Corruption and Confidence in Public Institutions: Evidence from a Global Survey; World Bank Development Research Group Policy Research Working Paper 5157; Washington DC: World Bank. Available online at http://econ.worldbank.org Government of the Philippines, World Bank & ADB (2008) Philippines Country Procurement Assessment Report; Manila: World Bank. Human Development Network (2009) Philippines Human Development Report 2008/2009: Institutions, Politics and Human Development, Manila: HDN. Available at http://hdn.org.ph/2009/05/21/20082009-philippine-human-development-report-2/ International Budget Partnership (2009) Open Budget. Transform Lives. The Open Budget Survey 2008, Washington DC. Available online at http://openbudgetindex.org/files/FinalFullReportEnglish1.pdf Parliament of Australia (2009) A Survey of Codes of Conduct in Australian and Selected Overseas Parliaments; Canberra: Commonwealth of Australia. Available online at http://www.aph.gov.au/Library/pubs/BN/pol/CodesOfConduct.pdf World Bank (2004) Mainstreaming Anticorruption Activities in World Bank Assistance: A Review of Progress since 1997, Washington, DC: World Bank World Bank (2007) Strengthening World Bank Group Engagement on Governance and Anticorruption; Washington DC: World Bank. World Bank (2007) The Many Faces of Corruption: Tackling Vulnerabilities at the Sector Level, Washington DC: The World Bank. World Bank (2010) Philippines Discussion Note on “What You See Is Not What You Get: Transparency, Accountability and Efficiency in Public Financial Management.” Note prepared by: Matthew Stephens (EACPF), Yasuhiko Matsuda (EASPR) and Anne Sevilla (EASPR) The World Bank
DN23-1
������������������������������ � � � � � ������������������������������������ Transparency Accountability and Efficiency in Public Financial Management What You See is Not What You Get R T
A P PFM
F
B PFM
I
1. Improving public financial management (PFM) is critical for making progress towards the Philippines’ development goals.189 Progress on key indicators of economic growth, poverty reduction and social development has not been as fast over the past decades as the government, the public and development partners had hoped or expected. Speeding up progress will require, among other things, effective service delivery by the government in areas such as education, health, and infrastructure development. In addition to coherent strategies and a sound policy framework in each of these sectors, a transparent and credible system to manage public resources is crucial for good decision making and adequate provision of public goods and services. 2. An important subset of PFM reforms for improving service delivery is to strengthen transparency, accountability and efficiency in resource use at the local levels.190 Local government units (LGUs) are playing important roles in providing devolved services. Yet weak PFM in terms of poor coordination in expenditure planning and prioritization across levels of government, limited availability and use of modern financial management information systems and a corresponding lack of fiscal transparency hamper efficiency and accountability in LGU service delivery. Lack of coordination among national oversight agencies and limited harmonization of fiscal reporting requirements further strains the already weak PFM capacities of most LGUs.
189 PFM refers to a system of rules, procedures and practices for the government to manage its public finances. Good budgeting is a core element of any PFM system, but a good PFM system is more than good budgeting. It also encompasses other crucial aspects and operations in the public sector such as management of public debt, assets and revenues, the arrangement governing fiscal relations between levels of government or between the government and public enterprises, and a system of public reporting on the public sector’s financial operations. 190 More detailed discussions on decentralization and local governance issues are found in the companion Discussion Note No. 23 “Decentralization: Improving Local Governance for Better Service Delivery.”
PHILIPPINES Discussion Note No.23: Public Financial Management June 2011
DN23-2
3. Equally importantly, PFM reform constitutes a core element of the governance reform agenda. It is widely asserted, though empirical or legal proof is often difficult, that the government budget is used for political purposes – by directing public expenditures to political allies (or denying them to rivals) in exchange for political favors with limited transparency about exactly how the funds are being utilized or reallocated. Some of the most notorious corruption scandals in the last decade, such as the Fertilizer Scam, involved abuses of discretions in budget management. Examples of poor financial governance are allegedly abundant at the local levels as well, as some local chief executives often enjoy even higher levels of discretion and take advantage of more limited transparency than at the national level. Lack of transparency in some critical aspects of PFM obscures how the government actually manages public money and feeds negative public perceptions even when no impropriety is being committed. 4. For both of these reasons – the need to get better results from investments in social and economic infrastructure and reduce poverty on the one hand, and the need to address the governance challenges on the other – a fundamental reform of PFM has to be a high priority for the government. A comprehensive PFM reform needs to include both short-term measures that demonstrate quick improvements and medium- to long-term measures that address more challenging tasks of building the institutional capacity of the government bureaucracy. By launching such a reform and by showing some tangible early results, the government can signal a decisive break from the “business as usual” of the past to turn governance into a facilitator, rather than an obstacle, of the country’s development. Strengths and Weaknesses of PFM in the Philippines 5. Over the last decade, various aspects of the Philippines’ PFM have been assessed by the World Bank, the IMF and numerous consultants hired for TA programs by other development partners such as AusAID and ADB. The Commission on Audit (COA) also conducted its own assessment of the effectiveness of the budget allocation system of the government in 2005. 191 The most comprehensive assessment to date is the Public Expenditure and Financial Accountability (PEFA) assessment conducted by the Bank in collaboration with AusAID and in partnership with DBM.192 6. These diagnostic studies found that some of the aspects of the national government’s PFM systems are operating reasonably well. These include:
• Tight controls of cash releases which have allowed the government in times of crises to effectively control expenditure and keep the fiscal aggregates from getting out of control,
• Reasonably comprehensive coverage of the budget documents, • A high-quality procurement law that approximates international best practice, and
191 The 2005 COA report concluded that “the existing budget allocation system needs improvement in order to ensure the implementation of priority programs and projects identified in the MTPDP for CYs 2004-2010 and the attainment of a balanced budget by 2010” (p. 4). 192 A PEFA assessment uses a standard set of performance indicators to rate the quality of selected key aspects of PFM on an objective basis. The PEFA assessments have been carried out in more than 100 countries in every region of the world, including two developed countries (Norway, Switzerland). In a number of countries, repeat assessments have been conducted to monitor reform progress.
PHILIPPINES Discussion Note No.23: Public Financial Management June 2011
DN23-3
• Reasonably transparent and predictable allocation of transfers to Local Government Units.
7. The studies have also revealed particular weaknesses in the management of the budget cycle, especially in the phases of budget execution and reporting, and in aspects related to transparency and accountability (see the Annex 1 for a summary assessment). Some of the key findings include:
• Limited public access to financial information especially the absence of meaningful in-year and ex-post reporting on budget execution due to the absence of a modern financial management information system and the lack of harmonization between the classification used in the budget and the chart of accounts used in accounting reports;193
• Insufficient institutionalization of policy-based budgeting in a multi-year perspective (medium-term expenditure framework) and the legislature’s repeated failure to enact the annual general appropriations acts (GAA) before the commencement of the fiscal year;
• Limited predictability in fund releases which, combined with weak planning and execution capacities of most line agencies, slow down budget execution and program/project implementation;
• Incipient internal control and audit systems, inadequate accounts reconciliation and the generally poor quality of annual financial statements, and the lack of the legislature’s interest in audit follow-up.
Box 1: Transparency and credibility of the Philippine budget – What you see is not what you get
One of the most glaring weaknesses in the Philippines’ fiscal transparency is the near total absence of meaningful reporting on how the government budget is executed. Fiscal transparency is further compromised by the complex appropriation structure in the Philippines, which consists of three different types of appropriations (General Appropriations Act, automatic appropriations, continuing appropriations). Besides, the budget is appropriated not only to the twenty or so departments and their attached agencies but also to various Special Purpose Funds (SPFs). During a fiscal year, the government executes the budget through frequent transfers of funds from one appropriation category (e.g., an SPF) to another (e.g., a Department). This complexity makes it virtually impossible not only for the public to know how the funds flow within the Philippine budget but sometimes prevents even the COA from offering definitive audit opinions on parts of the budget (especially the SPFs). To make matters worse, the President has the authority to declare an unspent balance of any appropriation as “saving” and reallocate it for other purposes. Once a particular portion of the budget is declared as “saving,” it reverts to the overall “savings” account before it is reallocated to another budget item. This transaction also makes it virtually impossible for an observer to track the exact origin of fund transfers.
193 A striking finding of the PEFA assessment is that the peculiarities of budget reporting in the Philippines make it impossible to estimate the most basic measures of budget performance, budget out-turns, which measure the extent to which the approved budget is executed. Large deviations during budget execution mean the budget as approved is not a credible guide of the actual government operations and suggest accountability issues. The inability to even estimate budget out-turns also means the credibility of the budget document is highly compromised
PHILIPPINES Discussion Note No.23: Public Financial Management June 2011
DN23-4
8. Other issues often highlighted in these studies include:
• High levels of executive discretions in budget management, which may increase flexibility in in-year resource allocation to address unanticipated situations but can also reduce transparency and accountability if they are abused;
• The existence of a number of Special Purpose Funds (SPFs) which sit outside the departmental appropriations and whose final uses are not systematically reported;
• The presence of multiple oversight agencies each responsible for different facets of PFM, which often complicates inter-agency coordination and weakens coherence of the government’s efforts to strengthen PFM comprehensively – the difficulty in inter-agency coordination is sometimes exacerbated by the unconventional assignment of responsibilities among the oversight agencies (e.g., putting the supreme audit institution, COA, in charge of government accounting policy).
PFM Reform Efforts So Far 9. The government’s efforts to improve PFM have so far focused on enhancing the policy base and performance orientations of budgeting through introduction of a medium-term expenditure framework (MTEF) and the Organizational Performance Indicators Framework (OPIF) as part of the budget documentation. 194 On the budget execution side, the efforts have concentrated on developing National Guidelines on Internal Control Systems (NGICS) and piloting an application in selected line departments along with a parallel effort to strengthen the internal audit function at the agency level, and modernizing the accounting framework (NGAS) to adopt accrual accounting. Although these ongoing efforts demonstrate the government’s strong desire to strengthen the system of internal control, some provisions of the PGIAM still do not fully meet good practice and professional standards of the internal audit profession. One of the reasons cited by the government was that making the PGIAM fully in line with the internationally accepted standards would result in violation of certain national laws. 10. These reforms have strengthened aspects of PFM. However they have yet to translate fully into a tangible difference in effective service delivery and visible improvements in fiscal governance. This is because (a) in the absence of an overarching strategy for PFM reform, the central agencies leading individual initiatives have not been able to coordinate fully with each other and the line agencies to maximize synergy; (b) the agenda has been primarily focused on budget formulation, and budget execution and financial accountability has not received as much attention; (c) implementation progress has been slow in some cases, often because the roll-out of reforms has been stymied when faced with broader systemic
194 The genuine efforts to improve strategic planning of the budget over the past few years perhaps have contributed to the prioritizations of additional spending in key areas of need such as education and infrastructure.
PHILIPPINES Discussion Note No.23: Public Financial Management June 2011
DN23-5
constraints; (d) initiatives launched have been revisited or halted in other cases;195 and (e) with the benefit of hindsight some initiatives were probably not properly sequenced.196 11. The experience with the government’s own reform efforts so far as well as relevant international experiences offer useful lessons. First, a reform has to follow a comprehensive strategy that considers inter-linkages among constituent parts of the entire PFM systems, or the government will run the risk of developing isolated initiatives that work at cross-purposes. Second, reforms are complex and their implementation is likely to be slow and incremental. As such, effective coordination of reform efforts among the oversight agencies with active participation of at least some of the key line agencies would be essential for sustaining the reform efforts. At the same time, tackling multiple reforms simultaneously would overburden the bureaucracy’s absorptive capacity and could lead to “reform fatigue” without actually reforming PFM. Third, introduction of sophisticated PFM techniques such as performance budgeting should follow consolidation of basic architectures and practices such as sound cash management and reliable financial reporting. The absence of a modern financial management information system has become a stumbling block for a number of reform initiatives. Fourth, addressing some of the fundamental challenges may require legal or even constitutional changes – but this should not deter would-be reformers from tackling them as long-term agenda even though reforms of such magnitude would necessarily require careful consensus-building over time.
0.00
0.50
1.00
1.50
2.00
2.50
3.00
Figure 1. Average PEFA Scores for the Philippines, by dimension
12. Despite the recent reform efforts, the PEFA assessment suggests there is still ample scope for strengthening various dimensions of PFM.197 Figure 1 graphically summarizes
195 An example is the launch of the Electronic New Government Accounting system (eNGAS) and the sudden halt in its roll-out subsequently as the agency in charge (COA) re-assessed its priorities and launched new initiatives (e.g., a review of the chart of accounts) before the roll-out was completed. 196 For instance, the roll-out of forward estimates has probably been compromised by the limited capacity of the basic budget information systems.
PHILIPPINES Discussion Note No.23: Public Financial Management June 2011
DN23-6
relative strengths and weaknesses in the Philippine PFM based on the PEFA methodology on a scale from 0 to 4.198 It shows particular weaknesses in budget credibility and accounting/reporting, although against the method’s best practice benchmark (i.e., the highest possible score of 4), none of the six dimensions is rated particularly high.199 Policy Options
Table 1: Philippines: Summary of Policy Actions Policy Area 1: Short-term Actions (6 months to 1 year)
Action 1.1 Take concrete actions to enhance transparency and accountability Action 1.2 Announce a comprehensive PFM reform program as a centerpiece of the government’s governance reform agenda Action 1.3 Launch a coordinated project to build a government financial management information system (GFMIS)
Policy Area 2: Medium-term Actions (1 to 3 years) Action 2.1 Make the budget documentation more user friendly Action 2.2 Implement a program of core PFM capacity development in line agencies Action 2.3 Review and possibly overhaul the legal foundations and the institutional arrangement for budget and financial accountability
13. The available diagnostic work points to the need to upgrade PFM quality in its multiple dimensions. Changes of government present an ideal opportunity to break the widely-held perceptions of poor governance. Few measures are likely to signal the government’s commitment to strengthen accountability more clearly than concrete steps to enhance fiscal transparency and reduce inappropriate discretions in PFM. Sustainable improvements in the overall quality of PFM would take a comprehensive approach over a number of years. The reform agenda should be realistic in its initial focus and yet comprehensive in its overall reach, divided between focused short-term measures aimed to signal the government’s commitment to reform and bring about immediate improvements by “grabbing some low-hanging fruits” and medium- to long-term measures intended to upgrade the institutional and technological foundations of PFM.
197 The PEFA method considers key PFM dimensions as (i) credibility of the budget; (ii) comprehensiveness and transparency; (iii) policy-based budgeting; (iv) predictability and control in budget execution; (v) accounting, recording and reporting; and (vi) external scrutiny and audit. 198 The PEFA method rates the quality of PFM in its various sub-dimensions in an A-D scale. Here we have converted the alphabetical ratings as A=4, B-3, C=2 and D=2 and converted them into an overall average score without any weighting. 199 Comprehensiveness and transparency appears to be in better form compared to the other dimensions, but this is due to the limited extent of unreported government operations, comprehensiveness (but not user-friendliness) of information included in the budget documentation, and reasonable transparency in inter-governmental fiscal relations. Among other sub-dimensions of interest for fiscal transparency, classification of the budget and public access to key fiscal information scored particularly poorly.
PHILIPPINES Discussion Note No.23: Public Financial Management June 2011
DN23-7
Short-term Actions (6 months to 1 year) Action 1.1 Take concrete actions to enhance transparency and accountability 14. It will be a while before investment in institutional strengthening of PFM will begin to yield tangible benefits (e.g., more efficient budget execution and improved service delivery). In the meantime, the government could take measures to signal its commitment to PFM reforms. One possibility is to immediately beef up some of the financial reporting to the public, especially on the usage of the approved budget (i.e., budget execution reports). Although the absence of a computerized information system that captures budget execution makes this a somewhat tedious exercise, the agencies already submit Statements of Allotments and Obligations Balances (SAOBs) more or less regularly to DBM. If DBM were to consolidate these and publish them regularly – given that this exercise will have to be done manually, twice a year may be a reasonable frequency – it would signify a considerable improvement in budget transparency. Such budget execution reporting is routine in most middle-income and high-income countries and there is no reason why the Philippines should not be able to attain a similar level of transparency. 15. Another option would be for the government to voluntarily tie its hand in the area of budget management. For example, the government may adopt a policy whereby any reallocation from so-called savings would remain within the same agency that generated the unspent balance. In the budget execution reports, the exact sources of the “savings” and the destinations of the reallocated fund should be clearly specified in terms of program/activity/project and expense class. If there is a need to reallocate a fund across agencies, the government could report its intent to Congress ex ante, at least for informational purposes. Eventually, there should be a clearer and tighter regulation of what constitutes savings and when and how the government is authorized to reallocate them for other purposes. Such an action would be a part of a reform of the PFM legal framework which is proposed as a medium-term measure below. The new president could also support institutionalization of responsible planning and budgetary prioritization by refraining from announcing “pet projects” that have not been duly considered in the government’s formal planning and project screening processes. Action 1.2 Announce a comprehensive PFM reform program as a centerpiece of the government’s governance reform agenda 16. Immediate measures of the types suggested above should be complemented with a commitment (and a concrete plan) to address other fundamental reform requirements with a comprehensive approach. One option would be to announce formation of an independent commission to deliberate on the reform agenda with a mandate to prepare a more detailed action plan over a certain time period (e.g., six months).
17. Once a comprehensive long-term vision is developed, it is important to devise a realistic implementation strategy. Reform measures should be sequenced on the basis of priorities (e.g., urgent need to establish fiscal control) as well as feasibility (e.g., “low-hanging fruits”) while making sure to introduce basic building blocks or foundations for more sophisticated elements first and leaving more sophisticated elements to a later stage. Cambodia’s platform approach
PHILIPPINES Discussion Note No.23: Public Financial Management June 2011
DN23-8
(Box 2) offers an example of a well-considered strategic approach to sequencing PFM reforms, although neat conceptual design does not guarantee effective implementation. The Philippines would be well-advised to adopt the principle of strategic sequencing but opt to simplify actual steps so as to minimize the risk of implementation failure.
18. Although PFM is largely a technical matter alien to the general citizenry, the government would be well-advised to articulate its importance for strengthening governance (transparency, accountability, and efficiency in government operations), a topic the general public can more easily relate to. The preparation of a reform agenda should ideally gather views of the country’s PFM experts and follow broad discussions among stakeholders both inside and outside the government. A group of senior technical staff from several agencies are working together to craft a PFM reform road map, which could serve as a valuable input. Action 1.3 Launch a coordinated project to build a government financial management information system (GFMIS) 19. No matter what the specific content of the PFM reform agenda mentioned above, there is no doubt that the government will need a functional government financial management information system (GFMIS), which is a backbone of good financial management in modern times. It minimizes human errors in financial transactions and makes record keeping more speedy and reliable. Countries ranging from Brazil to Turkey have developed a system that processes key financial transactions such as control of obligations and cash payments and allows real-time reporting on these financial operations on a real-time basis. In some countries, these systems include a web-based public interface which gives the general public access to some of the reporting functions. Within the East Asia Region, Indonesia and Vietnam, among others, have been implementing ambitious GFMIS projects of their own.
PHILIPPINES Discussion Note No.23: Public Financial Management June 2011
The platform approach developed in Cambodia is an example of a sequenced approach to PFM reform (Figure 2). In Cambodia, the focus of the first phase (Platform 1) was to make the budget a credible instrument for guiding the government’s strategic and operational management. The critical attribute of a credible budget is predictability of funding, which in turn requires improving the budget’s comprehensiveness and realism, and among other, streamlining the spending process. In the second phase, the government aimed to improve financial accountability by strengthening internal control, accounting, reporting and auditing. In the platforms 3 and 4, the intention was to develop capacities to link policy priorities to budget and service delivery targets, and introduce performance management.
Source: Taliercio (2008).
20. Even under the best of circumstances, full implementation of a GFMIS project will take several years and cost millions of pesos. Often these projects are implemented over several phases spanning a decade or longer, with each phase extending the system’s functional scope and institutionally coverage, and updating its technical elements. It is advisable to take the time necessary to design a sound project, in line with the overall PFM reform strategy. A wrong choice at the beginning could compromise the integrity of the project and cause costly reversals or modifications later on. An excessively ambitious design – a common pitfall – is especially prone to implementation failures. 21. A smart approach would be to first develop a clear conceptual design that determines the functional scope (treasury functions and financial reporting, budgeting, procurement, etc.) and
PHILIPPINES Discussion Note No.23: Public Financial Management June 2011
DN23-10
institutional coverage (oversight agencies, line departments, LGUs), taking into account the PFM framework, the overall reform objectives, the plan/need to reengineer some business processes and user requirements. It is better to start with a core treasury system for accounting (general ledger), management of payments, revenues, cash, expenditure commitments and financial reporting. Other systems, such as budget preparation and procurement, can be developed and integrated to the core treasury system later on. 22. There are other design and operational details that need to be considered in designing and implementing a GFMIS project. Policy-makers’ role would be to establish clear objectives and expectations of a GFMIS, take the challenges of project implementation seriously and provide adequate resources, both financial and human, as well as time to maximize the success of the project. If the project is launched at the beginning of the administration, it should be possible to have a fully functioning system, perhaps without some of the non-core modules, by the end of the six-year presidential term. Medium-term Actions (1 to 3 years) Action 2.1 Make the budget documentation more user friendly 23. Over the medium term, a relatively doable and yet substantively meaningful reform would be to improve the presentation of the budget documentation. Currently the national government’s budget documentation consists of the General Appropriations Act (GAA), the National Expenditure Program (NEP) which is the Executive’s budget proposal submitted for review and approval by Congress and which also contains some “actual” data, the Budget of Expenditures and Sources of Financing (BESF) which compiles a large volume of fiscal/budgetary data, the Organizational Performance Indicator Framework (OPIF) which is a collection of national government agencies’ performance indicators and the program logframes. Although this set of documents provide some reasonable amount of budgetary data, including a large amount of details, overall the presentation of the data in these documents is quite unwieldy and is not particularly user-friendly. Besides, none of these documents includes straightforward reporting on budget out-turns (approved vs. executed), nor do they include any narrative to explain the government’s budgetary priorities and policy intent or its program performance. 24. Redesigning the format and content of these budget documents requires a fair amount of technical work. However, from the point of view of user-friendliness (and thus transparency in a practical sense), it would be worthwhile investing some effort in improving public accessibility of these documents. Eventually the government may consider codifying a series of reporting and transparency requirements in the form of a fiscal/budget transparency law. Action 2.2 Implement a program of core PFM capacity development in line agencies 25. The most important objective of developing a strong PFM system is to strengthen the bureaucracy’s capacity to implement priority programs/projects efficiently and effectively. Available evidence suggests inefficiency in budget execution is caused by both the cumbersome (and often unpredictable) budget release procedures and weak institutional capacities of most of the line agencies. Both factors negatively reinforce each other and create a situation where the
PHILIPPINES Discussion Note No.23: Public Financial Management June 2011
DN23-11
oversight agencies try to retain tight control of budget releases because of the mistrust of the agencies’ ability to spend and the line agencies fail to develop their capacities fully because their staff resources are devoted to meeting transactional requirements of the release procedures. The introduction of the “spend it or lose it” policy for cash releases by DBM in 2009 and the revival of selective pre-audits by COA are two recent examples of reactive measures by oversight agencies triggered by mistrust in the agencies’ ability to absorb the allocated cash and account for its use properly. The two sides of the budget execution reform – gradual relaxation of central procedural control and upgrading of line agencies’ execution capacities – need to go hand in hand in a coordinated fashion in order to break this vicious circle. 26. DBM might consider developing a program similar to the “hurdle” approach attempted elsewhere (e.g., Thailand). This approach allows those agencies that meet certain pre-specified conditions to be granted gradually increased financial autonomy and reduced oversight of day-to-day operations. Irrespective of the specific design of the reform, key to supporting agency-level PFM improvements is to adopt a consistent strategy across the government but allow for adaptation of the strategy to fit agency-specific conditions (i.e., avoiding “cookie-cutter” reforms) in actual implementation. In general, it appears to be the case that those agencies which already have a reasonably coherent sectoral policy framework in place are better placed to invest in improving their PFM. In contrast, those which suffer from ad hoc policies - one of the most serious sources of uncertainty in budget management - are less capable of adopting consistent approaches to reforming their PFM practices. Hence one of the “hurdle” criteria could be the existence of a coherent sector policy/reform framework. Another one could be some level of basic financial accountability, evidenced in an operative internal control system and effective internal audit, and budget absorptive capacity. Action 2.3 Review and possibly overhaul the legal foundations and the institutional arrangement for budget and financial accountability 27. To upgrade the Philippines’ PFM to a world-class system, it is desirable or may even be necessary to review certain legislation, including aspects of the Constitution, which concern efficient budget management and clear lines of accountability. Some long-term questions that require resolution include the high level of discretion the Executive enjoys in managing the approved budget and the use of the special purpose funds, as highlighted in the companion note on governance reforms. Both of these obscure the relationships between the approved budget and its actual execution as they both lead to considerable levels of in-year fund reallocations. Tighter regulations (and more explicit codifications) of executive discretions and of the conditions under which SPFs can be created and managed could enhance transparency and credibility of the government budget and hence improve financial accountability. 28. Another contentious aspect of the constitutional basis of the Philippine PFM has to do with the appropriate role of COA as the supreme audit institution (SAI) in charge of external audit as well of the overseer of government accounting policy. In the recent past, COA has also played an important role in spearheading development of a key government financial management information system (eNGAS). Experts generally agree that having the SAI take charge of government accounting is undesirable as it could lead to potential conflict of interest since the same agency is responsible for preparing the government’s financial reports and
PHILIPPINES Discussion Note No.23: Public Financial Management June 2011
DN23-12
auditing them. COA maintains that the internal separation between the audit and the accounting arms minimizes such a risk. In truth, COA’s institutional focus is already heavily weighted towards the audit role, having approximately 9000 auditors, and only 150 accounting posts, of which only 70 are filled. Therefore the issue may be less about the potential conflict of interest between COA’s simultaneous roles in external audit and government accounting than about the difficulty of inter-agency coordination in financial management matters (e.g., accounting policy) that COA’s independent status often creates for the government. Such difficulty has arisen recently over coordination of efforts to develop financial management information systems. 29. If the government chooses to adopt a legislative measure, it might also consider charging a single body with full responsibility of overseeing the government’s financial management policy including accounting and internal audit matters (i.e., the financial comptroller of the government; effectively a ‘PFM Czar’). An example of such an agency includes the US Office of Budget and Management, the Treasury Board Secretariat of Canada, and the UK Treasury. Creating such a body could minimize the problem of ineffective inter-agency coordination. The source of inter-agency discord has not been limited to DBM and COA but may also involve NEDA vs. DBM (over planning and budgeting), the Office of the President vs. DBM (over the internal audit policy), DBM vs. BTr (over cash management), and NEDA vs. DOF vs. BSB (over macroeconomic framework). Although effective inter-agency coordination has been possible at times, it has often been a challenge to overcome the structural built-in tendency for each agency to “go its own way.”200 A “PFM Czar” agency could help in overcoming the problem of institutional fragmentation. 30. Another issue related to the institutional arrangement that merits attention is the fact that in the Philippine legislature there is no permanent committee responsible for scrutinizing government finances (such as a Public Accounts Committee), other than the ones in charge of reviewing the government’s budget proposal (i.e., the House Appropriations Committee and the Senate Finance Committee). Partly as a result, follow-up on COA audit findings is non-systematic. Although COA audit reports typically report on an agency’s progress in implementing the prior year’s COA recommendations, the absence of public scrutiny, such as hearings at a legislative public accounts committee, weakens the agencies’ accountability. Given the relatively higher prominence of the Senate, it may be more effective to add such a committee to the upper house’s 36 permanent committees. 31. A sensible first step would be to identify these and other operational problems that can be attributed to aspects of the legal/constitutional framework. If the consensus emerges that these are serious enough obstacles to efficient PFM and that fundamental fixes require some legal/constitutional changes – for example, we have already encountered a situation where the government is legally constrained to upgrade its internal audit manual fully in line with internationally accepted professional standards – then a more thorough review of the legal/constitutional framework can be conducted to identify other (most likely unintended)
200 Having a single agency is not necessarily a magic bullet solution to the problem of coordination. Anecdotes abound of cases where coordination failures within a single agency result in inefficient institutional outcomes. Nevertheless, it should help, given that COA’s constitutionally independent status limits the government’s ability to force coordination as COA is not obligated to respond to presidential directives.
PHILIPPINES Discussion Note No.23: Public Financial Management June 2011
DN23-13
negative consequences on PFM.201 There are a number of bills related to PFM in both Houses of the Legislature that could serve as basis for broad debate on a modern PFM law reform.
32. Whatever the specific focus of the actual reform plan the government develops, its implementation will require building of institutional capacities both in the oversight agencies and line departments. However, a massive investment in training as such (especially if it is not closely linked to a “job at hand”) may not provide the best means of building those capacities if the critical issues of staff qualification and incentives are left unaddressed. In other words, to make the new ways of managing public finance deliver on its potential, it is necessary to invest in parallel efforts to further professionalize technical careers related to PFM, including possible changes in staff recruitment and performance and career management.
201 The main legal instruments governing aspects of PFM include EO292 (Administrative Order) regulating general budgetary matters and PD1445 on audit issues. In addition, certain sector-specific legislation (e.g., RA7880 of 2004 on governance of basic education) includes provisions that regulate aspects of PFM practices, which merit scrutiny as part of the legal review).
PHILIPPINES Discussion Note No.23: Public Financial Management June 2011
DN23-14
References Commission on Audit (2005) “Effectiveness of the Budget Allocation System of the
Government: Department of Budget and Management”, Management Services Report No. 2005-05, Special Study.
Abdul Khan and Mario Pessoa (2009) “Conceptual Design: A critical element of a successful government financial management information system project,” PFM Technical Guidance Note, Fiscal Affairs Department, IMF. http://blog-pfm.imf.org/files/gfmis-conceptual-design.pdf
Ian Lienert and Israel Fainboim (2007) “Reforming Budget System Laws,” PFM Technical Guidance Note, Fiscal Affairs Department, IMF. http://blog-pfm.imf.org/files/reforming-budget-system-laws.pdf
Rob Taliercio (2008) “Sequencing for Success: Cambodia’s Public Financial Management Reform Program – The Platform Approach”, a presentation made at the Public Financial Management Workshop: From Diagnosis to Action – Sequencing and Politics of PFM Reform, March 21, 2008, Washington, DC. http://intranet.worldbank.org/WBSITE/INTRANET/SECTORS/PUBLICSECTORANDGOVERNANCE/INTPUBLICFINANCE/0,,contentMDK:21722936~pagePK:210082~piPK:210098~theSitePK:1339414,00.html
Sanjay Vani and Bill Dorotinsky (2008) “PFM Global Landscape: What can we say about PFM systems and trends around the world?”, a presentation made at the Public Financial Management Workshop: From Diagnosis to Action – Sequencing and Politics of PFM Reform, March 21, 2008 , Washington, DC. http://intranet.worldbank.org/WBSITE/INTRANET/SECTORS/PUBLICSECTORANDGOVERNANCE/INTPUBLICFINANCE/0,,contentMDK:21722936~pagePK:210082~piPK:210098~theSitePK:1339414,00.html
World Bank (2010) Philippines, “Public Expenditure and Financial Accountability”.
Note prepared by: Yasuhiko Matsuda EASPR The World Bank and Andrew Cumpston AusAID
PHILIPPINES Discussion Note No.23: Public Financial Management June 2011
PI-1 Aggregate expenditure out-turn compared to original approved budget Not rated
PI-2 Composition of expenditure out-turn compared to original approved budget Not rated
PI-3 Aggregate revenue out-turn compared to original approved budget A PI-4 Stock and monitoring of expenditure payment arrears �
B. KEY CROSS-CUTTING ISSUES: Comprehensiveness and Transparency PI-5 Classification of the budget D PI-6 Comprehensiveness of information included in budget documentation B
PI-7 Extent of unreported government operations A
PI-8 Transparency of inter-governmental fiscal relations B PI-9 Oversight of aggregate fiscal risk from other public sector entities C+ PI-10 Public access to key fiscal information C
C. BUDGET CYCLE C(i) Policy-Based Budgeting
PI-11 Orderliness and participation in the annual budget process B
PI-12 Multi-year perspective in fiscal planning, expenditure policy and budgeting D+S
C(ii) Predictability and Control in Budget Execution PI-13 Transparency of taxpayer obligations and liabilities C
PI-14 Effectiveness of measures for taxpayer registration and tax assessment C
PI-15 Effectiveness in collection of tax payments D+
PI-16 Predictability in the availability of funds for commitment of expenditures D+
PI-17 Recording and management of cash balances, debt and guarantees B
PI-18 Effectiveness of payroll controls C+
PI-19 Competition, value for money and controls in procurement B
PI-20 Effectiveness of internal controls for non-salary expenditure D+
PI-21 Effectiveness of internal audit D+
C(iii) Accounting, Recording and Reporting PI-22 Timeliness and regularity of accounts reconciliation D
PI-23 Availability of information on resources received by service delivery units D
PI-24 Quality and timeliness of in-year budget reports D
PI-25 Quality and timeliness of annual financial statements D+
C(iv) External Scrutiny and Audit PI-26 Scope, nature and follow-up of external audit B+
PI-27 Legislative scrutiny of the annual budget law C+
PI-28 Legislative scrutiny of external audit reports D
D. DONOR PRACTICES
PHILIPPINES Discussion Note No.23: Public Financial Management June 2011
DN23-16
PFM Performance Indicator Overall Rating
D-1 Predictability of Direct Budget Support Not rated
D-2 Financial information provided by donors for budgeting and reporting on project and program aid D
D-3 Proportion of aid that is managed by use of national procedures D
DN24-1
PHILIPPINES Discussion Note No. 24 ����������������� Improving Local Governance for Better Service Delivery Incomplete decentralization contributes to weak governance in the Philippines. A number of binding constraints in the current intergovernmental arrangements and associated institutional and structural weaknesses constrain Local Government Units’ (LGU) incentives and capacities to provide public services and serve as catalysts for dynamic and inclusive economic activities in their respective localities. These constraints include weak systems for LGU accountability, a high level of fragmentation among LGUs, and inequities in the LGUs’ resources base. Important progress has been achieved in local governance with the enactment of the Local Government Code (LGC). But the pace of progress has been too slow, and its spread too narrow, to deal adequately with the country’s enormous poverty reduction challenges. All LGUs, regardless of level or size, need to be able to provide a minimum level of basic services to their citizens. The better endowed ones need to step up to a more ambitious role of facilitating economic development within and around their jurisdictions. Evidence suggests that most LGUs are failing to adequately fulfill these roles. A comprehensive reform of the decentralization framework could correct many of the distortions, but that may be a politically difficult proposition for which there does not seem to be a clear demand in the country at the moment. There are, however, a number of intermediate policy options that could help make decentralization work better in the Philippines. These options seek to address the problems of weak LGU accountability, fragmentation, and resource base inadequacy with the overall aim of improving local service delivery. A. The Philippines Today: Progress and Challenges 1. Decentralization has the potential to bring about significant benefits, especially to countries characterized by such diversity as the Philippines. These benefits include a more accountable and responsive handling of public affairs, and thus more adequate provision of public services that meet the specific needs and demands of each locality. 2. The passage of the 1991 Local Government Code (LGC) represents a turning point in the history of Philippine governance. It promotes the lofty ideal of a more democratic state capable of serving its citizens in the rich diversity of geographic and social fabrics that characterize the country. It also entrusts local political leaders, duly elected through a democratic process, with the responsibility of guiding the development process in their respective localities, and has helped to strengthen local autonomy and provide LGUs with a significant increase in resources. 3. Along with the devolution of basic local services, the Code provides LGUs with enhanced powers of taxation and enhanced access to fiscal transfers through the Internal Revenue Allotment (IRA). Both the IRA and the assignment of specific taxes have enabled local governments to increase their share of expenditures relative to the country’s Gross National Product (GNP) from 1.9 percent in 1991 to 3 percent in 2007. Furthermore, own-source
PHILIPPINES Discussion Note No.24: Decentralization June 2011
DN24-2
revenues generated by LGUs have increased from 0.8 percent of GNP in 1991 to 1.1 percent in 2007.
Box 1: The 1991 Local Government Code With the enactment of the Local Government Code (LGC) in 1991, the responsibility for providing and financing the following services was devolved to LGUs:
• land use planning • hospital care • agricultural extension and research • local public buildings and structures • community-based forestry • local public parks • solid waste disposal system • environmental management
• local services and enterprises (e.g., public markets, public markets, slaughterhouses, etc.)
• pollution control • primary health care • social welfare services
• local infrastructure facilities (e.g., local roads and bridges, school buildings, health facilities, housing, communal irrigation, water supply, drainage, sewerage, flood control)
4. The available evidence suggests that devolution has failed to improve service delivery in a significant manner. Despite the strong shift towards devolution, LGUs have not fully realized their collective potential as envisioned by the architects of the Local Government Code, and while positive examples of good local governance can be found throughout the Philippines, these appear to be exceptions rather than the norm. Table 1 presents a simple Human Development Index (HDI) transition matrix which indicates whether provinces, grouped by their HDI scores in 1990, progressed, regressed, or stagnated over the following 10 years. Of the 74 provinces analyzed, only eight (in bold) managed to improve their scores enough to move up to the next higher cohort while three provinces (italicized) actually registered lower HDI scores. Furthermore, a recent study found that the growth in provincial income after decentralization has had a weak impact on poverty reduction, which suggests that the current intergovernmental arrangement is unable to translate growth at the provincial level into poverty reduction through more effective service delivery (Balisacan, 2007).
Source: Capuno (2007), HDN (1997, 2000, 2002). 5. Several fundamental constraints and weaknesses in the current framework for decentralization have limited the incentives and capacity of LGUs to fulfill their primary role as basic service providers. Much of the discussion on decentralization in the Philippines highlights the weak management capacities of the LGUs and inadequacy of resources as obstacles to improving LGU service delivery. While these are important, experience elsewhere shows that capacity building is often ineffectual unless it is accompanied by incentives for local governments to do better. Likewise, simply increasing resources is not likely to result in better service delivery unless other fundamental weaknesses are addressed. Three sets of binding constraints that weaken LGUs’ performance in the Philippines, regardless of their capacity and
PHILIPPINES Discussion Note No.24: Decentralization June 2011
DN24-3
resource endowments, are (i) weak LGU accountability for performance, (ii) a high level of fragmentation among LGUs, and the corresponding lack of effective inter-LGU coordination, and (iii) inequities in the LGUs’ resource bases, which leave a number of poorly-resourced LGUs unable to provide the most basic services adequately while allowing others to embark on projects of questionable economic and social impacts. Constraint No. 1: Weak Systems for LGU Accountability 6. The mechanisms for holding local chief executives accountable for performance are weak and frequently ineffective. Factors include the confusing and overlapping assignment of service delivery functions across levels of government, the national government’s focus on procedural compliance in monitoring LGU operations, and ineffective bottom-up accountability. 7. Unclear assignment of functions. While many basic services have nominally been devolved to the local governments, national government agencies (NGAs) continue to take advantage of loopholes in the Code to continue the direct delivery of certain services. This has resulted in a multi-track system of service delivery in certain sectors that compromises the lines of accountability for these local services. Table 2 illustrates the situation in the local roads sector using case study data for seven LGUs in two provinces. Even though local roads are devolved to LGUs, the NGA share of total local road and bridge investments in 2004-07 exceeded 90 percent for one of the two provinces and for three of the five barangay road networks. Also, NGA investments in local roads were often not coordinated with local plans and were typically based on either political motivations or on direct requests from communities, bypassing the LGU itself. Table 2: Road Expenditures by Type and Funding Source in seven LGUs (2004-07)
(Real 1985 Pesos, in ‘000 PhP) Road Class /
Case Study LGU Total Road & Bridge Expenditures
% LGU % NGA Total Provincial Roads Province A 82% 18% 65,537 Province B 6% 94% 224,306 City/Muni Roads City A 87% 13% 13,059 City B 98% 2% 15,192 Municipality A1 100% 0% 492 Municipality A2 100% 0% 142 Municipality B 87% 13% 881 Barangay Roads City A 0% 100% 2,042 City B 84% 16% 12,710 Municipality A1 2% 98% 2,598 Municipality A2 39% 61% 858 Municipality B 4% 96% 9,557
Source: World Bank, Local Service Delivery Case Studies (2010, draft). 8. Excessive and uncoordinated procedural requirements. LGUs are flooded with mandates and requirements from NGAs and national laws, most of which are focused on dictating LGU processes and inputs and are generally not harmonized and coordinated among
PHILIPPINES Discussion Note No.24: Decentralization June 2011
DN24-4
the respective NGAs. These generate significant compliance costs for LGUs, although their impact in substantially improving the quality of resource management by the LGUs is doubtful. Furthermore, the NGAs themselves have little capacity to monitor and enforce LGUs’ compliance with these requirements. 9. Weak social and electoral accountability. The Code introduced mechanisms to institutionalize citizen participation in the LGU planning and budgeting processes, primarily through special bodies such as the local development council and the local health and school boards. However, the functionality of these special bodies varies significantly across LGUs and the voice of non-government stakeholders in local governance is generally very weak. No systematic information on LGU performance is available to allow voters to assess their local governments’ performance and use elections to reward good performers and punish laggards. Not surprisingly, recent research suggests that local elections have been ineffective instruments for holding local chief executives accountable for their performance in service delivery. Table 3 summarizes the outcome of the 2001 election of provincial governors in conjunction with changes in the HDI scores of their provinces over the preceding six year period (equivalent to two full electoral terms). The re-election rates of the governors who presided over significant increases in HDI scores (i.e., over 10 percent) were not higher than those of governors who presided over negligible or decreasing changes in HDI scores. Table 3: Changes in HDI Score (1994-2000) and Gubernatorial Election Outcomes in 2001
Governors Standing for Re-election Change in HDI Score Re-elected Defeated > 20% 1 - 10 – 20% 6 6 0 – 10% 24 9 0% (no change) 2 1 < 0% 3 4 Total (n=56) 36 20
Source: Capuno (2007), National Statistical Coordinating Board. Constraint No. 2: High Level of Fragmentation among LGUs 10. The Philippines exhibits a hyper-division of jurisdictional boundaries, resulting in a local government system comprised of a large number of relatively small jurisdictions at each level of sub-national government. (The sub-national government consists of approximately 80 provinces, 120 cities, 1,500 municipalities, and 42,000 barangays.) This severe fragmentation reduces the efficiency of basic service delivery, particularly as each LGU demands a basic organizational structure with inherent overhead costs, and complicates inter-LGU coordination/cooperation. This problem is particularly acute in sectors where geographic coordination beyond municipal/city boundaries and economies of scale play a crucial role. Examples are the management of road networks, health referral systems, environmental management, and the provision of certain public utilities (e.g., water and electricity).
PHILIPPINES Discussion Note No.24: Decentralization June 2011
DN24-5
11. Figure 1 shows an inverse relationship between the population size of municipalities and the share of expenditures allocated for General Public Services.202 This indicates that smaller LGUs are forced to spend a larger share of their budgets on overhead administration costs – rather than on direct service delivery – compared to larger LGUs. 12. The fragmentation of LGUs fosters local governance problems and inhibits inter-LGU cooperation. Smaller jurisdictions tend to be dominated by a smaller number of entrenched clans in control of local political and economic affairs. Meanwhile, neighboring LGUs are often controlled by rival clans. Coupled with the relatively short three-year local election cycle, this weakens incentives for inter-LGU cooperation and coordination in service delivery and investments. The existing system of LGU finance (particularly the automatic IRA transfer and the proliferation of congressional allocations that bypass higher levels of local government) reinforces the individualism of LGUs and creates further disincentives for cooperation. Constraint No. 3: Inequities and Inconsistencies in the LGUs’ Resource Base 13. Establishing appropriate levels of funding across levels of government in a decentralized system is difficult, though critical in designing a well-functioning inter-governmental system for effective governance. The current inter-governmental fiscal arrangement in the Philippines is sub-optimal in many ways. First, the large transfers from the center have a disincentive effect on local tax efforts, as evidenced by the continued high dependency of most LGUs on IRA and limited increase in the generation of own-source revenues over the last 18 years. Second, the current formula does a poor job of compensating for the varying levels of fiscal capacities across LGUs, often worsening the horizontal resource imbalances across LGUs. (Manasan, 2007) Figure 2 shows the average IRA transfers for the three types of LGUs classified according to the amounts of own-source revenues they generate. The data shows that on average the IRA distribution to the provinces is highly regressive, allowing those provinces with the highest own-source revenues to receive three times more IRA than those with the least own-source revenues. The distribution becomes somewhat less regressive for municipalities and progressive for cities.
202 The relationship is statistically significant (at the 0.01 level), with an R2 of 0.09. General Public Services expenditures include general administration expenditures that cannot be attributed to other sectors/departments of the LGU.
Figure 1: The smaller, the more inefficient? The LGU size and public spending patterns
PHILIPPINES Discussion Note No.24: Decentralization June 2011
DN24-6
Figure 2. IRA per capita vs. own-source revenues per capita (PhP), 2002-07 Average
Source: World Bank, Commision on Audit Annual Financial Reports (2002-07) 14. The pattern of horizontal imbalance is also evident from expenditure data for case study LGUs. Table 4 compares the overall health expenditures over a five year period of two provinces: one that inherited a tertiary hospital from DOH after devolution in 1991 (Province B) and another that did not (Province A). While Province A’s health expenditures per capita were right in line with national averages, Province B’s expenditures were almost 2.5 times greater as a result of the higher operating costs and investment needs of the tertiary hospital. Province B has been forced to allocate much larger shares of both the total spending and the IRA to health.
Table 4: Cumulative health expenditures in case study provinces, 2003-07 (Real 1985 Pesos, 000 PhP)
Province A Province B Total Expenditures 95,934 319,464 Personal services 77,310 137,326 MOOE 16,250 117,498 Capital Outlay 2,373 64,639 Annual Exp. Per Capita 16 39 Personal services 13 17 MOOE 3 14 Capital Outlay 0 8 Estimated Average National Annual per Capita Expenditure on Health
16
Health expenditure/Total Expenditure 20.1% 37.5% Health expenditure/IRA 21.2% 50.5%
Source: World Bank, Local Service Delivery Case Studies (2010, draft). 15. The vertical distribution of the IRA allocation across the three main levels of LGUs is inconsistent with the distribution of expenditure responsibilities. Cities generally emerge as net winners from the system, and the increased access to IRA transfers is the primary reason why there has been a push among municipalities to convert to cities. This issue is illustrated by the way that the IRA distribution relates to the relative needs for public spending in the roads sector. Table 5 summarizes the distribution of IRA and road expenditures on a per km basis in a sample of seven LGUs in two provinces. In this sample, both provinces receive far less IRA
PHILIPPINES Discussion Note No.24: Decentralization June 2011
DN24-7
allocations per kilometer than their component cities and municipalities, which have substantially fewer spending needs on account of their far shorter road lengths.
Table 5: Relative Resource availability and Spending in LGU Road Sector 2003-07 (Real 1985 Pesos, 000 PhP)
IRA Total LGU Income Road Class Total Per Km Total Per Km
Provincial Roads Province A 452,743 466 499,955 515 Province B 633,076 1,479 839,918 1,962 City/Muni Roads City A 106,369 1,597 203,840 3,061 City B 173,954 8,698 297,209 14,860 Municipality A1 24,284 3,624 43,140 6,439 Municipality A2 14,553 2,347 18,462 2,978 Municipality B 58,853 4,946 75,215 6,321
Source: World Bank, Local Service Delivery Case Studies (2010, draft). B. Where the Philippines Could Be: Policy Options 16. After nearly two decades since the enactment of the Code, it is becoming increasingly evident that the current framework is not providing the LGUs with sufficient incentives to take advantage of their de jure autonomy and become good agents of local development. A wide range of opinion leaders thinks that the Code could benefit from a “face-lift”. But this apparent consensus has not translated into actual amendments, in part because of opposing views on the specific reform path to be followed. While search on a consensus on reforming the overall decentralization framework continues among key stakeholders, there are a number of measures that policymakers can consider to address each of the binding constraints on better local service delivery that were identified above.
Table 6: Philippines: Policy Areas and Actions Policy Area 1: Addressing Weak LGU Accountability
Action 1.1 Clarify service delivery responsibilities and improve budget transparency and performance reporting Action 1.2 Relax NGA-imposed procedural control and regulatory constraints
Policy Area 2: Addressing Fragmentation and its Negative Consequences Action 2.1 Give provinces a greater role in inter-LGU prioritization and coordination Action 2.2 Integrate barangay captains into the local council (Sangguniang Bayan)
Policy Area 3: Addressing Improvements in LGUs’ Resource Bases Action 3.1 Consider options for utilizing additional fiscal transfers
Policy Area 1: Addressing Weak LGU Accountability 17. The preceding analysis showed a confluence of factors that limit incentives for LGUs to be held accountable for their service delivery performance. No single measure is likely to be sufficient for changing these incentives and some of them may require reforms in the
PHILIPPINES Discussion Note No.24: Decentralization June 2011
DN24-8
political institutions (e.g., the electoral system), which this note does not address. Without properly aligning LGU incentives toward better service delivery, however, it is unlikely that investments in other measures, such as capacity building or increased fiscal transfers, will produce the desired outcome of a better service delivery. Action 1.1 Clarify service delivery responsibilities, create budget transparency, and improve performance reporting 18. The murky assignment of functions across levels of government is a common problem in decentralized states in developing countries. Although it is tempting to call for clarification of responsibilities in a law (e.g., via amendments to the Code), that is unlikely to be the most effective remedy as (a) what the Law defines may still not be fully implementable because of resource and capacity constraints at the local level, or (b) the NGA may be unwilling or unable to orchestrate a well-organized devolution process because it lacks a coherent sector policy framework (or have other incentives to retain officially devolved functions in its hands). Clarification of service delivery responsibility is therefore best approached on a sector-by-sector basis, allowing those sectors with a relatively coherent policy framework and sufficient coordination capacity in the NGA to experiment with gradual adjustments in the assignments of service delivery responsibilities. 19. NGAs that are actively involved in the provision of devolved services need to shift their focus away from direct provision. They should instead move towards setting minimum service standards or performance targets for their respective sectors, monitoring LGU performance, and providing additional technical and financial support to LGUs, when necessary. In cases where the Code is ambiguous about the extent of the devolution of a sector, the corresponding NGAs need to establish clear criteria and agreements with LGUs on the exact assignment of roles and responsibilities across levels of government. It would be advisable to rely on pilot trials in this context. The central government might start with a sector where there are on-going efforts to introduce reforms in devolved service delivery, such as the health sector. Similar schemes will have to be worked out for each devolved sector on a sector-by-sector basis. A crucial element of this scheme is to make information on LGU performance available to the public in order to increase accountability for local service provision (see Box 2). Action 1.2 Relax NG-imposed procedural controls and regulatory constraints 20. Multiple national oversight agencies frequently impose excessive rules and regulations on planning, budgeting and financial management/reporting. Simplification and harmonization of the LGU reporting requirements currently pursued jointly by the oversight agencies could ease administrative burdens on the LGUs and improve transparency and accountability in LGU fiscal management. Additional improvements in fiscal transparency and financial accountability could be achieved with elimination of some of the legally-mandated special funds. Although some of them, such as the calamity fund, are justified as an element of prudent fiscal management, others seem to add little value to the quality of financial management while adding unnecessary complexity in the budget structure of the LGUs. The typical LGU practice of reporting on the use of these funds separately from the on-budget activities further reduces transparency. A case in point is the Local Development Fund (LDF) composed of 20 percent of the IRA which the LGUs are legally required to use to fund
PHILIPPINES Discussion Note No.24: Decentralization June 2011
DN24-9
“development” projects and account for separately from the general fund.203 The definition of what constitutes “development” is inevitably open to interpretations and for those LGUs that count on significant amounts of own source revenues or borrowing for financing projects, the LDF concept is virtually meaningless as it only captures part of the LGUs’ development-related activities. Eliminating the LDF would therefore cost little in terms of expenditure prioritization and improve the quality of fiscal management by reducing complexity and increasing transparency.
Box 2: Measuring Local Performance
Colombia’s sub-national performance measurement system
As a result of sub-national fiscal distress in the late 1990s, Colombia introduced fiscal indicators to monitor the solvency of local governments. This first attempt was later expanded to include a more comprehensive set of indicators designed to measure the effectiveness and efficiency of local service delivery. This new system is intended both as an accountability and a managerial tool, and features: (i) a manageable number of indicators that measure performance at the input, output and outcome level, (ii) a benchmarking system which ranks municipalities nationally, but does not involve any financial rewards or sanctions, and (iii) indicators that capture the level of administrative capacity and resources in each municipality, which help explain differences in performance across sub-national entities.
The methodology assesses five components of sub-national performance: (i) Effectiveness, (ii) Efficiency, (iii) Legal Requirements, (iv) Management Capacity, and (v) Exogenous Variables. The first four components are used to construct an overall Performance Indicator that is used to rank municipalities, both nationally and within each regional department. The methodology defines performance as “the results (mainly outputs) obtained by delivering goods and services, through the use of available inputs/resources and the existing administrative capacity, and measured against the goals defined in each sub-national development plan and the requirements established in the legal framework.”
The system has three important strengths: first, it focuses on outputs and outcomes (results), and is not merely process oriented; second, it takes into account both available inputs and administrative capacity, so it is mindful of the diverse circumstances faced by local governments, and; third, baselines are established by both law and a self-imposed yardstick as defined and embedded in each local development plan. These data are publicly accessible.
21. A similar set of constraints on LGUs’ operational autonomy (and thus accountability) arise from unfunded mandates and LGUs’ inability to own, manage or dispose of certain public assets. For example:
• In most cities, the land classification by the Department of Environment and Natural Resources (DENR) dates from the first half of the 20th century. Rapid urbanization has led to the occupation of land still classified by DENR as timberland. As a result, cities are not able to impose taxes on these lands because the occupiers cannot get legal titles.
• The Land Transportation and Franchise Regulatory Board (LTFRB), under the Department of Transport and Communications (DOTC), continues to issue franchises to taxis in some highly congested LGUs despite the efforts by the city councils to impose a moratorium. As a result of these uncoordinated policies, pollution and congestion have continued to rise.
203 Another example is the Special Education Fund (SEF), a 1-percent additional levy on the real property tax earmarked for education expenditures. The SEF, however, may be more justifiable given the chronic under-investment in public education in the Philippines and the relatively simple accounting it would allow by virtue of the fact that the use of this Fund is limited to one sector.
PHILIPPINES Discussion Note No.24: Decentralization June 2011
DN24-10
• Some national agencies own significant portions of land in LGUs. These properties are not only exempted from the real property tax but they may sometimes interfere with the implementation of badly needed infrastructure projects or service facilities.
22. As long as LGUs are unable to exert some degree of control over factors that affect the local economy, it will be difficult for them to improve basic service delivery and become effective facilitators of local economic development. A recommended solution would be reviews and rationalization of rigid provisions in the Code and in national government circulars which create significant compliance costs for LGUs and limit their flexibility to allocate resources to address specific local needs. Policy Area 2: Addressing Fragmentation and its Negative Consequences 23. Given the high level of fragmentation among LGUs, it would be desirable to amalgamate small LGUs into larger, more economically viable LGUs. However, given the expected political obstacles inherent in consolidating multiple jurisdictions into a single LGU, it will be difficult to stem this trend in the short run, other than to uphold stringent rules on conditions and procedures for allowing a community to split from an existing LGU to form a new unit.204 A more promising remedy would be to strengthen existing LGUs’ incentives and capacities for inter-jurisdictional coordination. Action 2.1 Give provinces a greater role in inter-LGU prioritization and coordination 24. In decentralized systems of governance, the intermediate levels (i.e., states, provinces) often play important coordinating roles. Following this general pattern, provinces in the Philippines could take on a more pronounced role in defining province-wide strategic priorities and in leveraging their political and financial capital to align the local activities of its component LGUs. Provinces could also serve as the primary partners of sectoral NGAs in monitoring the performance of component LGUs according to prescribed minimum service standards, and in implementing performance incentive programs targeted towards component LGUs. An alternative approach to strengthen coordination at the intermediate level would be to revamp the Regional Development Councils, transforming them into more technical bodies that are accountable to the political structure both at the local and central level.205 Either the provinces or RDCs could be empowered to assume this more expansive role through the additional transfer of resources. These resources could come from additional transfers from the national government (on top of the IRA) that are distributed on the basis of sector-specific and/or non-sectoral performance-based contracts. If resources are channeled through provincial governments, these could be used to enhance their own service delivery and to provide incentives to component LGUs through performance sub-contracts. 204 A conversion of a municipality to a city, on the other hand, does not have the same negative effect of hyper-division, at least in the aggregate, although it would reduce IRA allocations to the existing cities. 205 To be functional, the RDCs would need to be given the necessary independence and tools to effectively perform their technical coordination role (i.e., staff and financial resources). Also, their composition and decision making process would need to be consistent with a more technocratic view of the world that is still accountable to existing political structures. Most important is that RDCs remain accountable to local chief executives but are not easily subject to capture by national authorities or a small number of local interest groups.
PHILIPPINES Discussion Note No.24: Decentralization June 2011
DN24-11
Action 2.2 Integrate barangay captains into the local council (Sangguniang Bayan) 25. The mismatch between spending/service needs and resource availability is greatest at the barangay level. Although the barangays as a whole receive 20 percent of the total IRA, this amount is hyper-divided among more than 40,000 micro jurisdictions, each with its own administrative structure. As a result, the amount available to each barangay is too minuscule to fund development initiatives of any significance, which makes the barangays heavily dependent on higher tiers of government and local members of congress for funding their long list of investment needs. Pooling these resources allocated to the barangays into a larger fund would permit their more efficient use. Integrating the resource allocation decisions at the barangay level, along with the corresponding IRA allocation, with those of the municipal/city governments, the tier immediately above the barangays, could accomplish this objective.206 26. One option, though a bold one, is to incorporate barangay captains as members of the municipal/city councils, replacing the current council members. A figure traditionally invested with the executive duty to enforce local ordinances, as well as maintain public peace and order, the barangay captain also serves the role of community organizer and intermediary between the community and the local government, that is, representative functions. Because the amounts of resources each barangay receives are insufficient for the provision of much-needed services (such as barangay roads) on their own, the barangay captains are forced to expend quite a bit of effort lobbying local governments for resource allocation and service delivery in their own barangays. This, however, is supposed to be the role of local council members. Such overlap suggests that blending these positions, as well as their duties and responsibilities, might bring about several benefits to local governments.207 Policy Area 3: Addressing Improvements in LGUs’ Resource Bases 27. An ideal solution would be to redesign the IRA formula. Fundamentally, the IRA formula needs to be refined to reflect a more explicit alignment of service delivery responsibilities and resource requirements across different levels of LGUs, and the equalization of uneven fiscal capacities among LGUs of the same level. In past years, the national government commissioned various studies to review the IRA and propose reforms to the distribution formula (the most recent being a JICA study commissioned by the Department of the Interior and Local Government in 2008). Alternative options for reforming the IRA to address the identified issues with the current formula are already available to the national government. However, the political incentives to change the current formula are weak, both among national-level legislators who would be responsible for enacting a change to the LGC, and among local government officials, many of whom are afraid of losing part of their IRA allocations.
206 The share of the IRA that barangays currently receive, which represents 20 percent of the total IRA allocation, would then be transmitted to the respective municipal and city governments, which could then earmark these funds to pay for wages of the barangay captain and staff and to finance barangay activities across the LGU. 207 Internationally, some countries organize their local governments in wards, wherein each ward (basically equivalent to a barangay) elects a member to the legislative council of their local government. The council acts as a legislative body and acts as a check on the executive branch of the local government. As a representative of a particular ward, the elected official is also responsible for bringing issues important to the community he or she represents to the attention of the council and the local chief executive.
PHILIPPINES Discussion Note No.24: Decentralization June 2011
DN24-12
Action 3.1 Consider options for utilizing additional fiscal transfers 28. Revising the formula is politically difficult to achieve, at least in the short run. Given the possibility that some stakeholders may push for increasing the total amount of national government transfers to the LGUs, several options for utilizing additional fiscal transfers can be explored to address inequities in the existing transfer system and to leverage improved local service delivery.208 The most promising approach would be to identify additional resources for transfers to LGUs and design them following certain rational criteria.209 One possible criteria to consider as a basis for augmenting the intergovernmental fiscal transfer arrangement is to link the transfer to some measurable aspects of LGU performance. Another is to use the equalization criteria to direct additional resources to LGUs in greater need. 29. Performance-based grant systems: From the point of view of enhancing LGU accountability and correcting vertical imbalances, performance-based grant systems that transfer additional resources to provinces and low-capacity municipalities on the basis of pre-specified performance criteria would offer an interesting option. For example, in the health sector, formal performance contracts between DOH and provinces could serve as a basis for awarding grants to provinces, particularly those that absorbed tertiary hospitals from DOH during devolution. In turn, provinces could enter into performance sub-contracts with component LGUs to provide fiscal incentives for achieving health service standards agreed in the sub-contracts. This system could be coupled with the minimum standards in service delivery defined by NGAs as discussed above. A basic set of indicators, targets and outcomes in key sectors would need to be agreed with LGUs as part of the process of setting up a performance measurement system as discussed in Box 2 on the Colombian experience. 30. Equalization grant scheme: The current intergovernmental fiscal system does not fully take into account the divergent fiscal capacities of the LGUs, leaving poorly-resourced LGUs with inadequate capacities to provide the most basic services. Decentralizing countries have often used one of the following two options to address this common problem of horizontal inequity. The first option is to include a measure that captures differences in revenue generating capacity in the allocation formula, such as poverty incidence or percentage of land exempt from property tax, or with tax breaks (i.e., government property and certain agricultural and timber lands). The second option utilizes a set of minimum expenditure levels that ensure the provision of a basic level of services to the population. A balancing or equalizing transfer is given to those local governments that are not able to meet that minimum expenditure level (see Box 3).
208 As suggested above, the IRA share of barangays can be blended with the shares of municipalities and cities as part of a fundamental reform of the LGU organizational structure. This reform would not entail an increase in the overall IRA allocation but would help to improve the efficiency of local service delivery. 209 There have been repeated calls from LGUs to increase the share of the IRA from 40 percent of national internal revenues to perhaps 50 percent or more, and numerous proposed bills supporting such increase have been filed in past Congresses. Furthermore, it has been estimated that additional national government transfers to LGUs to finance devolved services (including Congressional allocations) are collectively equivalent to approximately 20 percent of the IRA in a given year. A combination of a legislated increase in the share of the IRA as well as a re-orientation of existing non-IRA transfers may be used to finance additional transfer programs for LGUs.
PHILIPPINES Discussion Note No.24: Decentralization June 2011
DN24-13
Box 3: Achieving Greater Inter-Regional Equity through the Transfer System
Chile’s Common Municipal Fund and Vietnam’s “Balancing Transfers”
In Chile, the Constitution established a common municipal fund (FCM) that works as a “solidarity redistributing mechanism of self generated resources between municipalities”. Under this arrangement, local governments are required by law to pool a share of their real property tax collection, which is then re-distributed among all local governments following a formula that includes a share in the national poverty head count and the proportion of taxable land in each local government (to measure the depth of the tax base).
Vietnam’s central government designed and implemented so-called “Balancing Transfers” to increase the financial viability of poor provinces. These are unconditional grants determined by a formula that utilizes a set of expenditure norms. The exact amount is to remain nominally fixed during a three-year stability period. An important improvement in the system was the adoption of an explicit methodology or formula to estimate the transfer. This formula replaced the old bargaining process that used to dominate allocation of the grants in earlier years. The new formula uses the differences between estimated expenditure needs (based on a set of minimum expenditure norms adjusted for each region depending on geography and remoteness) and revenue capacity (based on actual revenues from previous years and taking into account tax policy changes implemented that year and economic growth).
References Azfar, Omar, et al. 2000. Decentralization and Governance: An Empirical Investigation of Public Service Delivery in the Philippines. Department of Economics, Center for Institutional Reform and the Informal Sector. Maryland: University of Maryland. Balisacan, Arsenio M. 2007. “Local Growth and Poverty Reduction.” The Dynamics of Regional Development: The Philippines in East Asia. Ed. Arsenio M. Balisacan and Hal Hill. Asian Development Bank Institute. Manila: Edward Elgar Publishing Ltd. and Ateneo de Manila University Press. Capuno, Joseph J. 2007. “The Quality of Local Governance and Development under Decentralization.” The Dynamics of Regional Development: The Philippines in East Asia. Ed. Arsenio M. Balisacan and Hal Hill. Asian Development Bank Institute. Manila: Edward Elgar Publishing Ltd. and Ateneo de Manila University Press. Manasan, Rosario G. 2007. “Decentralization and the Financing of Regional Development.” The Dynamics of Regional Development: The Philippines in East Asia. Ed. Arsenio M. Balisacan and Hal Hill. Asian Development Bank Institute. Manila: Edward Elgar Publishing Ltd. and Ateneo de Manila University Press. Steffensen, Jesper, Ma. Cecilia G. Soriano, E.P. Makayan, and J.B. Nisperos. 2005. “Assessment of Non-IRA Transfers and Other Funds for Devolved Services in the Philippines.” Manila: World Bank. Note prepared by: Lawrence Tang (EASPS) Yasuhiko Matsuda (EASPR) Victor Dumas (PRMPS) The World Bank March 5, 2010
DN25-1
������������������������������ � �������� ������������Improving Statistics to Strengthen Evidence based Policy Making I P A
P D P PDP T
F T F
T P S D P PSDP T
W
A. The Philippines Today: Progress and Challenges 1. Good statistics — meaning accurate, timely and useful statistics — are important for achieving the development targets in the Philippine Development Plan (PDP). Without good statistics, targets such as “accelerating growth to 8 percent by 2010 and reducing poverty incidence among families by 10 percentage points” would be difficult to achieve, in part due to the inability of the government to make appropriate policies and allocate scarce resources to the sectors yielding the highest returns or offering the best prospects for reducing poverty.210 For example, weaknesses in the Philippine System of National Accounts (PSNA) have reduced the ability of the government to determine priority sectors to support. Moreover, the absence of reliable provincial-level poverty statistics and the late release of national and regional poverty statistics have limited the government’s ability to design better poverty reduction programs.211 2. Good statistics are crucial in supporting the government’s social protection program. With a limited budget and large number of poor and vulnerable people, accurate, timely, and disaggregated statistics are needed to ensure that limited resources are well-targeted to the people who are most in need. In the past, the lack of accurate provincial and municipal-level poverty statistics and a good proxy means test have led to large leakages in the government’s various social protection programs.212 This has since been rectified by the development of a good proxy means test using municipal-level poverty statistics. The
210 This point was already made earlier by President Quezon. As related by Corpuz (1997), “In December 1935, the Philippine legislature created a national economic council as the Commonwealth government’s advisory body in the formulation of economic plans. The Commonwealth president, Manuel L. Quezon, however, saw the imprudence of formulating and adopting a ‘comprehensive program of economic development,’ due to the ‘absence of adequate data and sufficient information about the different phases of Philippine economic life...’ ” 211 While provincial statistics are produced, the current master sample is not designed to produce reliable estimates of provincial level statistics. This results in a mix of reliable and non-reliable provincial level statistics. 212 Refer to the Discussion Note on Social Protection in the Philippines.
PHILIPPINES Discussion Note No.25: Statistics June 2011
DN25-2
government’s conditional cash transfer (CCT) program offers an example of how good statistics can improve resource allocation and help bring down poverty rates. In recent times, the increasing frequency and magnitude of calamities and disasters have made the production of good statistics even more urgent. When typhoons Ondoy and Pepeng hit the country in 2009, the lack of accurate spatial data slowed down rescue and recovery efforts in the most affected areas. Ensuring the availability of good statistics is essential to improve disaster preparedness, crisis monitoring, and the design of rapid response mechanisms. 3. Finally, good statistics are needed for good governance. A government that seeks to be transparent and accountable to the people must produce good statistics to back its claims. Bad statistics can mask inefficiencies in public expenditure and increase opportunities for corruption. Key Challenges 4. The Philippine Statistical System (PSS) is the government-wide system for providing statistical information and services. It has a decentralized structure composed of six major statistical agencies (MSAs) and other units in the national and local government engaged in the production of statistics.213 A total of 19 government agencies support the delivery of about 60 designated statistics which include, among others, the estimation of the national income accounts and poverty, regular monitoring of prices, and various economic and social censuses and surveys. 5. 5. The PSS is regarded positively by the international community. The PSS ranks high in the 2009 Statistical Capacity Indicators of the World Bank.214 The IMF’s 2004 review of the Philippines’ observance of standards and codes found that Philippine macroeconomic data exceeds international standards of good practice in terms of the coverage, periodicity, and timeliness.215 Dissemination practices are consistent with Special Data Dissemination System (SDDS) requirements and the PSS as a whole exhibits a high degree of professionalism and integrity. The competency of Philippine statisticians is also well regarded in the region. Several
213 The major statistical agencies in the PSS include the statistical policy-making and coordinating body, the National Statistical Coordination Board (NSCB), which has an executive board and a secretariat; producer of general purpose statistics, National Statistics Office (NSO); producer of agriculture and fishery statistics, Bureau of Agricultural Statistics (BAS) under the Department of Agriculture (DA); producer of specific purpose statistics on labor and employment, Bureau of Labor and Employment Statistics (BLES) under the Department of Labor and Employment (DOLE); producer of monetary and banking statistics, Department of Economic Statistics of the Bangko Sentral ng Pilipinas (BSP); and a research and training institution on statistics, Statistical Research and Training Center (SRTC). Other data producers in government include divisions/units usually within the planning service of the various departments and bureaus. The functioning of each of these agencies is governed by separate statistical laws that are geared to meet their own statistical information requirements. 214 The World Bank Statistical Capacity Indicator provides an overview of the statistical capacity of developing countries. It is based on a diagnostic framework developed with a view to assessing the capacity of statistical systems. The framework consists of three assessment areas: methodology; data sources; and periodicity and timeliness (institutional framework has not been included in score calculation). In 2009, the Philippine garnered an overall score of 86. It scores high in the area of collection (100) but lower in the area of data availability (78). The mean overall score is 73 for 145 countries. The Philippines scores higher than Thailand, Malaysia and Indonesia. 215 The availability of Philippine macroeconomic data is comparable to that of Indonesia and Thailand, and are generally better than those of other countries in East Asia and the Pacific, such as Cambodia, Vietnam and Myanmar (World Bank 2002).
PHILIPPINES Discussion Note No.25: Statistics June 2011
DN25-3
countries have sent delegations to learn from the PSS and have benefited from the advice of leading Philippine statisticians on how to improve their statistical systems.
6. There are several areas for improvement, however, starting with the need to improve inter-agency cooperation and focus more on developing good source data to enhance accuracy and reliability. According to the Report of the Special Committee to Review the PSS (2008), the decentralized nature of the PSS has spawned problems of overlapping functions, duplication of efforts, and inconsistencies in government-produced statistics (). These problems arose because departments do not use harmonized data collection procedures and standard definitions. At the local level, specific data collection activities are undertaken according to the priorities and needs of the local governments for planning purposes, but not necessarily in coordination with national agencies or following prescribed standards and guidelines. 7. Longer-term statistical planning is not given enough attention and priority. The NSCB prepares the Philippine Statistical Development Program (PSDP) at the start of a new administration every six years to outline the directions, thrusts, and priorities of the PSS and to help the government achieve its targets. PSDP preparation and implementation is generally underfunded in the Budget, and high level officials are not actively involved in this process.216 Furthermore, the PSDP does not benefit from active participation of all the statistical agencies and government departments. Attendance in the NSCB Board is weak (Report of the Special Committee to Review the PSS 2008) and some agencies say that they are not consulted enough. 8. Although the Philippine System of National Accounts (PSNA) is regarded as the most important measure of the country’s economic performance, there are questions about its integrity. A recent assessment (Harvey 2009) revealed that the integrity of the national accounts is compromised by three major issues. First, there are discontinuities in the national accounts series which renders the GDP series non-comparable over time. Second, the PSNA uses outdated benchmarks and parameters that do not reflect the current state of the economy. For example, it still uses 1985 as base year (unlike most other countries that use a more recent base year or have transitioned to chain volume measures), an industry classification as of 1977, and sector parameters from the 1980 Census of Agriculture and 1988 Census of Establishments. Third, data from the national income accounts do not correlate well with other official statistics, such as the foreign trade statistics and the balance of payments. This reliance on weaker data raises the risk of making wrong decisions that can harm the economy.217 9. Many surveys that produce key economic and social indicators have problems of coverage, timeliness, and accuracy. Some statistics, such as poverty statistics and estimates of income and expenditure, are inadequate for their intended purposes because they (i) do not meet the desired level of disaggregation needed for planning, (ii) are released with significant lags, and (iii) do not capture some of the key social indicators that are essential to poverty monitoring. Data users complain that these statistics are often released too late to be useful for timely and
216 In some countries, such as Mongolia and Vietnam, the Planning Minister takes an active role in leading the preparation of the statistical strategy, helping to raise the public visibility of this effort. 217 In Nicaragua, for example, the underestimation of GDP (by around 70 percent) in the 1990s distorted a number of economic indicators, vastly overestimating the public sector’s role in the economy (World Bank 2001).
PHILIPPINES Discussion Note No.25: Statistics June 2011
DN25-4
appropriate inputs to policy making. Significant lags in the delivery of pertinent statistics have constrained the government’s responsiveness to address pressing challenges such as the recent crises and calamities. 10. Expenditure compression in the national government has led to a significant decline in the real budget for the generation of statistics. On non-census years, the total budget allocated to the PSS averaged 0.5 percent of the national budget and this has declined further since 2001 (NSCB 2005a). The budget for statistical operations has been cut or delayed in many occasions, resulting in the delay or cancelation of crucial surveys and censuses.218 The budget for research, training, and product improvement was also totally removed, making it very difficult for statistical agencies to improve their capacities and products amid the growing demand for statistics, especially sub-national statistics. This resulted in a statistical system that is very hard-pressed to deliver its mandate given poor quantity and quality of resources. 11. The government’s tight fiscal policies also have adversely affected the number and quality of staff in the statistical agencies. Regular staff positions in the PSS declined by about 25 percent in spite of higher demand for statistics. The rationalization plans of some statistical agencies have not been approved, which has delayed the filling of key positions. In other agencies, the approved rationalization plans contain more cuts in positions than what the agencies had originally proposed. In addition, the technical expertise of personnel has declined because of the lack of training and skills development, not to mention turnover. An underlying reason for the low staff count is low compensation and weak career opportunities for statisticians, especially for senior level statisticians. On average, government compensation for experienced statisticians is about a third of what is offered in the private sector and by development agencies. This has led to frequent turnover and loss of seniority in the PSS. Recent Steps 12. Recognizing these problems, the government commissioned a special review of the PSS in 2007 — the first major review in 22 years. A committee of experts was tasked to evaluate major issues and concerns in the current structure of the PSS and the functions and mandates of the MSAs vis-à-vis the quality and integrity of their products and services, and provide recommendations on how the system can be improved. The findings of the committee highlight the growing difficulties in the current statistical system. Among others, the review recommends the reorganization of the PSS into a single agency to “improve its efficiency and effectiveness in meeting demands for statistics.” In addition, it recommends that the budget for designated statistics be automatically appropriated and the research and training arm of the PSS be strengthened to address the increasing need for improved statistical products. 13. The major statistical agencies have begun to work towards improving key designated statistics. In 2008, NSCB and NSO embarked on a project to improve the quality
218 The Annual Poverty Indicators Survey, which is supposed to provide poverty estimates in between the triennial FIES, was not conducted in 2001 and 2005. The Annual Survey of Philippine Business and Industry, which is an important data source for the national accounts and is supposed to be conducted every year, was also not conducted in 2002 and 2004. Meanwhile, the 2002 Census of Agriculture and Fisheries was delayed to 2003 and the 2005 Census of Population was delayed to 2007.
PHILIPPINES Discussion Note No.25: Statistics June 2011
DN25-5
and usefulness of the National Accounts, in particular adopting the recommendations of SNA 1993 and 2008 and moving towards chain volume measures. The quality and coverage of surveys are also being improved by NSO, beginning with a comprehensive review of the household surveys and the development of an enterprise survey. To address the demand for more disaggregated statistics, city and municipal level poverty estimates were produced for 2000 and 2003 using the latest available census and surveys. Since their release, many LGUs and national government agencies have used them to improve the formulation of local development plans, improve targeting of social assistance programs, and in monitoring progress towards achieving the MDGs at the local level (NSCB 2009). NSCB has also begun preparatory work to formulate the Philippine Statistical Development Program (PSDP) for 2011-2017. B. Where the Philippines Could Be: Policy Options 14. To overcome the challenges, a coherent set of policy actions is needed. Foremost, coordination among statistical agencies needs to be strengthened, preferably via a unifying legal framework. This should be followed by formulating a realistic Philippine Statistical Development Program (PSDP). These two foundational reforms would then help the statistical system improve its resource pool. With more resources, the statistical agencies can then move to improve the quality of statistics.
Table 1: Summary of Key Policy Areas and Actions Policy Area 1: Coordination Among Statistical Agencies Improved
Action 1.1 Propose the enactment of a unified legal framework for statistics or, enact an executive order mandating sharing of data Action 1.2 Review further the proposal to centralize the statistical system
Policy Area 2: Statistical Planning Prioritized Action 2.1 Encourage high-level participation in the formulation of the PSDP
Policy Area 3: Adequate Resources for Key Statistics Ensured Action 3.1 Review list of designated statistics and identify key ones Action 3.2 Ensure automatic budget appropriation for key designated statistics Action 3.3 Ensure budget for statistical development Action 3.4 Protect staff resources
Policy Area 4: Accuracy, Usefulness, and Timeliness of Key Statistics Improved Action 4.1 Improve the quality of key designated statistics Action 4.2 Enact policy giving priority to national accounts compilation Action 4.3 Improve household surveys
Policy Area 1: Coordination Among Statistical Agencies Improved Action 1.1 Propose the enactment of a unified legal framework for statistics
PHILIPPINES Discussion Note No.25: Statistics June 2011
DN25-6
15. To improve coordination in the PSS, a first best solution would be to enact a unified legal framework that consolidates all existing laws governing the production of statistics.219 Having a unified framework for statistical operations can significantly improve horizontal coordination and institutional linkages among statistical agencies as well as vertical coordination within statistical agencies and the government bureaucracy. Such a law could also specify clearly how various government agencies could cooperate especially on data sharing. For instance, the law should mandate all government agencies to share data with NSO and NSCB, subject to provisions of existing laws, for national accounting purposes.220 Or: Enact an executive order mandating sharing of data 16. If a new legal framework cannot be realized in the short-term, then a second best solution would be to enact an executive order which would mandate free sharing of data across all government agencies. This will avoid instances when NSO, for example, has to pay a fee to get data from another national government agency, such as the Securities and Exchange Commission (SEC) or when NSO and NSCB have to enter into a memorandum of agreement (MOA) with other agencies to be able to acquire their data. This will not only promote greater appreciation and utilization of officially produced data but also build internal demand for statistical products in the formulation of government programs. Action 1.2 Review further the proposal to centralize the statistical system 17. Based on the findings of the PSS review, a bill is currently in congress that calls for a centralized statistical system. This proposal needs to be reviewed further. While the proposal appears to be well founded on the need to improve coordination among statistical agencies, such a move does not guarantee better results in the PSS. International experience on this issue is mixed and provides no clear-cut evidence that a centralized statistical system works better than a decentralized one. Countries with a more centralized system, such as Australia, Canada, and the Netherlands, perform as well as countries with a decentralized statistical system, such as the US, UK, Japan, and Indonesia. In many countries, good performance is conditional on effective implementation of current statutes and the availability of adequate resources and not solely on how the statistical system is organized. The proposal would benefit from a more in-depth study, with the aid of international advice, on how the PSS can be better organized. Policy Area 2: Statistical Planning Prioritized Action 2.1 Encourage high-level participation in the formulation of the PSDP
219 Currently, various laws govern statistical agencies in the Philippines with some that are already antiquated and no longer responsive to current needs. For example, the law governing NSO is now 70 years old. Moreover, existing laws are also unable to penalize non-compliance as the penalty structure enacted in 1940 has become so obsolete that it has become cheaper to pay a fine (if enforced at all) than to comply with the law. 220 Key agencies that should share data for national income compilation include the SEC, Bureau of Internal Revenue, the central bank, and the Department of Trade and Industry.
PHILIPPINES Discussion Note No.25: Statistics June 2011
DN25-7
18. High level support needs to be given to the formulation of the Philippine Statistical Development Program (PSDP) and the active participation of key stakeholders, both data users and producers, in the PSDP process ensured. Given the resource constraints amid the growing demand for statistics, strategic planning in the area of statistics is essential in ensuring that scarce resources for statistics can be allocated efficiently and decisions on which statistics to produce, what methods to use, and how data are to be disseminated, can be made optimally. The experience of other countries, such as Indonesia, shows that well prepared plans raise the profile of statistics, increase the likelihood of getting adequate resources, and often translate to better performance. To build up the profile of statistics in the Philippines, it is important that high level officials, in particular key members of the NSCB Board and the NEDA Board, actively support the formulation of the next PSDP. Support can come in the form of active participation during consultation forums and in the form of budgetary support to improve both the development phase (2010-2011) and the monitoring and evaluation phase (2011 to 2017).
Box 1: Indicative costs of the PSDP
Preparing a good PSDP is not expensive relative to the large potential gains it can provide in terms of improved coordination, better statistical products, and higher user satisfaction, as well as the medium to long-term gains of better development outcomes. A budget of P20 million is adequate for the preparation stage while at least P4 million each year is needed for program implementation and monitoring and evaluation or a total of P40 million for the next six years—a trivial sum compared to the potential benefits. To ensure that donor support is aligned with the PSDP, it is suggested that all donor support henceforth be confined to the priority programs, projects, and activities of the PSS as set forth in the PSDP. Proper management of the PSDP process could raise the profile of statistics in the Philippines, ensure adequacy of funds for statistical operations and development, build a constituency for the future, and ensure that all stakeholders agree on the main priorities for the future. Policy Area 3: Adequate Resources for Key Statistics Ensured Action 3.1 Review list of designated statistics and identify key ones 19. The list of designated statistics needs to be reviewed and updated with the identification of key ones that should be protected at all times. The current list consists of about 60 designated statistics but there are some inadequacies. For example, the list does not provide statistics on Small Area Estimates (SAE) of poverty and data needed for rapid disaster or calamity response, both of which are very important to support the government’s social protection program. Meanwhile, new and important surveys, such as the enterprise survey and the survey of the informal sector, are not on the list. Furthermore, as discussed above, even within the current set of designated statistics some important surveys and censuses were not conducted due to budget shortfalls. This undermines to varying extents the ability of the government to make good policies and quickly respond to emergency needs, such as disaster and crisis management. The food crisis in 2008 is a case in point.
Action 3.2 Ensure automatic budget appropriation for key designated statistics
PHILIPPINES Discussion Note No.25: Statistics June 2011
DN25-8
20. Protection of key designated statistics could come in the form of “automatic appropriation”; that is, by exempting the survey/census budgets from general budget cutbacks, should they occur. If the budget for key designated statistics is not adequate to meet minimum quality standards, then it needs to be increased. To ensure that an adequate budget will always be available for the key designated statistics, the PSS needs to continue enhancing its medium-term expenditure budgeting. Table 2 proposes 16 statistics, surveys, and censuses that can be considered key designated statistics.
Table 2: Proposed List of Key Designated Statistics Economic Statistics Social Statistics
Census of Agriculture and Fisheries Census of Population and Housing Rice and Corn Survey Family Income and Expenditure Survey Census of Philippine Business and Industry Labor Force Survey Annual Survey of Philippine Business and Industry
Poverty Statistics
Quarterly Survey of Philippine Business and Industry
National Demographic and Health Survey
National Accounts National Nutrition Survey Input-Output Table Nutritional Status of Filipino Children Consumer Price Index Functional Literacy, Education and Mass
Media Survey (FLEMMS)
Source: World Bank Staff Recommendation Action 3.3 Ensure budget for statistical development 21. Apart from operations, the budget for statistical development also needs to be ensured. It is recommended that the government appropriates an adequate budget for statistical development that will enable the statistical agencies to fund improvements in their products or develop new products. In the 1990s, some statistical agencies, such as NSCB, received some P3 million a year as “grant in aid.” However, in the last decade, this budget item has not been provided. As an alternative, major statistical agencies have resorted to donor agencies to fund the development of new statistics (such as the SAE, the informal sector survey, and the rebasing of the national accounts) or to supplement their need for training and computers. Based on recent needs of the major statistical agencies, it is estimated that around P5 million to P10 million per year for each major statistical agency would be an adequate amount to start with for statistical development. Action 3.4 Protect staff resources 22. To solve the depletion of human capital in the PSS, one recommendation is to reverse the present pyramid structure in the statistical agencies. In NSO for example, the number of low ranking staff could be reduced by about 10 percent (in large part due to the computerization of many processes and the emergence of better ways to capture responses, such as via the internet), while the number of senior statisticians can be quadrupled to improve the analytical capacity of NSO to produce better data. This reorganization should be reflected in a realistic rationalization plan. This should also include a succession plan to ensure that in the long-term, statistical
PHILIPPINES Discussion Note No.25: Statistics June 2011
DN25-9
agencies remain adequately staffed with competent leads. This would also help institutionalize projects which are having difficulty in integrating into the regular work program of statistical agencies because of the lack of qualified staff despite the availability of financial resources.221 Consideration can be given to improving the remuneration of senior statisticians by putting them in higher salary grades if the statistical agencies cannot operate outside the civil service law. More generous graduate scholarships can also be provided as staff incentives but in exchange for longer scholarship bonds, such as a minimum of two years of PSS service for every year of study. Policy Area 4: Accuracy, Usefulness, and Timeliness of Key Statistics Improved Action 4.1 Improve the quality of key designated statistics 23. With adequate resources, priority can next be given to improving the quality and usefulness of key designated statistics. Statistical concepts, definitions, and classifications used by various statistical agencies need to adhere to internationally-agreed standards at all levels and should be measured consistently across various statistical agencies. Correctly measuring key indicators and ensuring their consistency, such as the growth rates in production and poverty incidences, have important implications on the direction of policies the government takes. For example, incorrectly measured agricultural production indicators disguised an impending food shortage in Malawi, delaying appropriate response to the 2002 food crisis (World Bank 2002). In contrast, accurate and timely data in Tanzania led to better targeting of health programs and a positive impact on human development. In the Philippines, municipal level poverty estimates enabled the government to improve targeting of some of its biggest social assistance programs, such as the CCT program. Action 4.2 Enact policy giving priority to national accounts compilation 24. As the country’s premiere statistics, priority should be given to the compilation of the national accounts by enacting a policy recognizing national accounts compilers as the primary users of economic statistics and aligning all economic surveys/censuses to meet its needs. This may entail amending the present mandate of NSO to provide general purpose statistics to one that prioritizes national income compilers over and above the needs of the general public.222 223 As a priority area, budgetary support should be provided to ensure that the NSCB and NSO have adequate resources to continuously improve the PSNA. To date, most of the resources have come from various donor agencies. While this alleviates the problem in the short-term, full budgetary support is needed to ensure long-term gains and ownership in this area. Action 4.3 Improve household surveys 221 For example, the small area estimates of poverty could not be institutionalized yet because the NSCB’s social statistics office has fewer than half of its staffing potential, this despite the availability of funds from donors. 222 Refer to paragraphs 4-7 of Discussion Note No. 2 on consistency problems between the national income accounts and the results of household surveys. 223 In many countries such as Australia and Indonesia, the SNA office is part of the major statistical agency, and the head of agency can mandate the other offices to prioritize the needs of the national accounts office. This is not the case in the Philippines.
PHILIPPINES Discussion Note No.25: Statistics June 2011
DN25-10
25. To generate more timely and disaggregated statistics, the current set of household surveys need to be improved. This requires (i) providing a more coherent framework for the implementation of household surveys, (ii) speeding up the processing time of results, (iii) minimizing the response burden, (iv) providing for provincial representation, and (v) producing annual poverty estimates. More specifically, the following are suggested:
• Ensure that basic socio-economic indicators are captured in the household surveys (i.e., LFS, FIES, and APIS) and censuses to be more relevant to policy makers. For this to happen, a comprehensive review of the various household survey modules needs to be undertaken immediately, taking stock of user needs versus data gaps and re-engineering the design of pertinent household surveys.
• Ensure that the next master sample of households has provinces as a domain. In addition, the urban and rural classification should be restored in the household surveys.
• Redesign the FIES to improve the response rate and shorten the time needed to release the results. A study by Fuwa (2007) showed that the second round does not add value to the FIES since the difference between the first and second round is statistically insignificant. The Living Standard Measurement Survey (LSMS), in particular its modular approach, could be used as a guide in redesigning the FIES. This should also be done with a view to increasing the frequency of releasing poverty estimates.
• Ensure that the LFS and FIES always form a panel of households to track the dynamics
of poverty.
• Produce municipal level poverty statistics following the methodology for small area estimation every three years.
26. By re-engineering the FIES and allocating the right amount of resources, timeliness in the release of poverty estimates can be improved from the current 24 months after the reference year to at most 12 months. To ensure the timely release of statistics, the list of designated statistics should be updated to reflect these changes. Moreover, a performance contract could be used to ensure that statistical agencies produce the required data with the resources given to them. This should put the Philippines on a par with countries such as Vietnam and Cambodia in terms of the timely release of poverty statistics.224 Note prepared by: Karl Kendrick Chua (EASPR) Rashiel Velarde (EASHS)
224 It only takes at most 12 months after the survey period for Cambodia and Vietnam to release their income and expenditure data. One reason for this is that these countries have simpler survey designs.
PHILIPPINES Discussion Note No.25: Statistics June 2011
DN25-11
References Corpuz, O. (1997) “An Economic History of the Philippines.” University of the Philippines Press. Fuwa, N. (2007) “A Methodology for Predicting Annual Income and Expenditure Given One Round of the Family Income and Expenditure Survey (FIES).” Technical Assistance Report to NSO. Harvey, R. (2009) Assessment Report on the Philippine System of National Accounts.” Technical Assistance Report to NSCB. International Monetary Fund (IMF) (2004) “Philippines: Report on the Observance of Standards and Codes—Data Module, Response by the Authorities, and Detailed Assessments Using Data Quality Assessment Framework.” National Statistical Coordination Board (2005a) "Budgets for Statistical Activities in the PSS: Are They Enough?" _______ (2005b) “Minutes of the NSCB Technical Committee on Poverty Statistics Meeting,” in http://www.nscb.gov.ph/poverty/TCPovStat/meetings/8thMeeting21Jan05/highlights2.asp _______ (2009) “Actual Policy Uses of Poverty Statistics in the Philippines.” PARIS 21 Secretariat. (2004) “A Guide to Designing a National Strategy for the Development of Statistics.” Pacificator, A. et al. (1995) “Estimating Annual Income and Expenditure Based on the First Visit of the FIES.” University of Los Banos. Special Committee to Review the Philippine Statistical System (2008) “2007 Strategic Review and Evaluation of the Philippine Statistical System.” World Bank (2001) "Nicaragua: Public Expenditure Review: Improving the Poverty Focus of Public Spending." Report no. 23095-NI. _______ (2002) “Building Statistical Capacity to Monitor Development Process.” _______ Bulletin Board on Statistical Capacity, website http://web.worldbank.org/WBSITE/EXTERNAL/DATASTATISTICS/EXTWBDEBTSTA/0,,contentMDK:22109675~menuPK:5898862~pagePK:64168427~piPK:64168435~theSitePK:3561370,00.html.
DN25-12
������������������������������ � � � ��������������� ������������� Strengthening Access to Justice in the Philippines Public trust and confidence in the Philippines’ justice system continue to be undermined by delayed delivery of justice, limited access to justice, corruption, and inefficient resource management. Justice system performance and credibility could be improved through joint executive-judicial leadership on time-bound actions to: (i) reduce courts’ case backlogs, (ii) improve access to justice, (iii) decongest jails, (iv) improve prosecutors’ conviction rates, (v) harness information and communications technology (ICT) for transparency and accountability, and (vi) publish performance indicators to monitor efficiency and increase transparency. A. The Philippines Today: Progress and Challenges 1. In the World Bank’s 2008 Global Poll, the Philippines was the only country in East Asia where ‘improving governance’ was identified as the most important means to generate faster growth and mentioned among the top two priority actions for reducing poverty. While many institutions contribute to good governance and development, none are as closely associated with governance and the rule of law as the courts, the prosecution, the police and the corrections system – together the core of a country’s justice system. To become a stronger force for good governance and development, the justice system has to surmount long-standing challenges: (i) reduce delays in the delivery of justice, (ii) mobilize and manage resources – financial, human, physical, and information technology – more efficiently, (iii) reduce barriers in access to justice for the poor and marginalized, and (iv) strengthen public trust and confidence.
2. Slow disposal of lower court cases remains the main obstacle to improving the delivery of justice, eliminating case backlogs could take another 25 years at current rates. The pace of disposal is reflected in two key performance indicators for lower courts, where the bulk of the cases reside: the case disposition rate (Figure 1), and the proportion of backlog cases (Figures 2 and 3). First, the overall annual disposition rate225 has averaged about 27 per cent for 2005-2008. Second, high-volume lower courts such as Regional Trial Courts (RTCs), Metropolitan Trial Courts (MeTCs) and Municipal Trial Courts (MuTCs) never disposed
225 Case disposition rate: the ratio of the total number of cases decided in a year to the sum of (a) the number of backlog cases carried over from the previous year, and (b) new cases filed during that year. This indicator is normally expressed as a percentage. A ‘backlog’ case is defined as one submitted for decision beyond the prescribed (‘reglamentary’) period. The case disposal rate (used in the Supreme Court’s Annual Reports) includes cases decided and cases archived or transferred/remanded to other courts. The latter figures are higher than the former.
Dis
posi
tion
rat
e fo
r th
e Su
prem
e C
ourt
(%
)
Dis
posi
tion
Rat
es f
or lo
wer
cou
rts
(%)
Figure 1: Case disposition rate for Lower Courts (2005-2008)
S C R T CM T C M T C CM C T C S D CS C C
S SupremeC
PHILIPPINES Discussion Note No. 26: Justice Reform June 2011
13
more than 40 percent of their stock of cases in any year during 2005-2008. Figure 2: Percentage of backlog cases in
selected courts (2004-2008)
A L C A CL L C C O CC M
Source: Program Management Office, Supreme Court
Cas
eloa
d (t
hous
and
case
s)
Figure 3: Trends for case backlogs and case disposal (2005-2008)
B E D Y
Source: Program Management Office, Supreme Court
3. The total volume of cases disposed is declining (Figure 3). Across all lower courts, 282,000 cases were disposed during 2008, down from 340,000 in 2005, a 17 percent reduction. These low disposal rates appear to be caused by a combination of poor courtroom management, adjournments due to judges’ reluctance to use subpoenas and contempt rules to compel adherence to time frames by attorneys and litigants, vacant judgeships and dilapidated/unsafe physical facilities. The 1998 Speedy Trial Act has not been effective in reducing delays.
4. Poor enforcement of Barangay Justice System (BJS) awards and settlements has led to case spillovers to regular courts. Since enforcement actions can be politically sensitive, Barangay officials tend to wait out the six-month execution period under section 417 of the “Katarungang Pambarangay law”, after which the parties have to file an enforcement case with the appropriate court: this has added cases to court dockets instead of reducing them.
5. The real judicial budget has increased, but its management remains weak, and audits have disclosed persistent issues. The judiciary has been requesting an increase in the share of the judicial budget to about 2 percent of the national budget. Trends show a decreasing proportion in nominal terms - from 1.17 percent in 1998 to 0.88 percent in 2004 and a projected 0.75 percent in 2011. But the real judicial budget increased by 34 percent (Figure 4) between 2004 and 2009. However, the Supreme Court views this as insufficient to address years of under-resourcing, especially for capital outlays and maintenance and operating expenditures (Figure 5). Taking the totality of judicial resources into account – national budget appropriations, the Judiciary Development Fund, and LGU expenditures on lower courts - annual audits by the Commission on Audit have disclosed persistent management and control issues.
PHILIPPINES Discussion Note No. 26: Justice Reform June 2011
14
Real Budget growth (Base year=2004)
Nominal Budget (In Billion PHP)
Figure 4: G rowth of Judicia l budget in Rea l and Nom inal Terms
N B R B B Y
Source: Suprem e C ourt annual reports
Figure 5: Composition of the Supreme Court’s Expenditure
P M O C O
Source: Supreme Court annual reports
6. Poor physical facilities in lower courts, prosecution offices and jails perpetuate inefficiency and raise barriers for access to and delivery of justice. These facilities are characterized by (a) poor or unsafe physical conditions, (b) lack of office supplies and furniture, (c) under-resourced operation and maintenance of buildings and equipment, causing inability to pay utility bills and non-availability of basic amenities such as water and sanitation. Chronic under-resourcing has led to lower courts’ reliance on LGUs for office supplies, equipment, maintenance and judges’ allowances, severely compromising judicial independence in actuality. The condition of jails is equally dismal, with poor facilities and overcrowding.
7. Inefficient human resource management contributes to systemic inefficiency. Although there is a shortage of judges and prosecutors, there is overstaffing on administrative
personnel. The situation has marginally improved in respect of judges (Figure 6): while 29.5 percent of positions were reported vacant in 2005, this figure decreased to 22.7 percent in 2008, though 519 courtrooms still did not have a dedicated judge. A similar shortage of prosecutors and public attorneys has led to high caseloads for individual prosecutors, causing further delays, conflicting schedules, poorly prepared cases and low conviction rates. The average staff-to-judge ratio in lower courts is estimated to be about 12 in 2010.
8. Justice ICT infrastructure remains obsolete, fragmented and ineffective despite years of small-scale modernization attempts: as a result, ICT’s enormous potential to improve efficiency and reduce corruption remains unharnessed. Numerous lower courts do not have adequate ICT facilities. And ICT applications to improve case management have mostly been stand-alone attempts to improve small elements of the system (often driven by donor priorities). A judiciary-wide approach is absent. Executive entities suffer from similar problems. For example, the Department of Interior and Local Government (DILG), which oversees prisons, does not yet have basic modern networked information systems for corrections facilities, while the Department of Justice (DOJ), which oversees prosecutors, lacks a basic electronic prosecution case tracking system. The judiciary’s fragmented ICT systems have had
W
��
�
�
�
Figure 6: Vacancies in positions of Judges
F V P
Source: Supreme Court annual reports
PHILIPPINES Discussion Note No. 26: Justice Reform June 2011
15
little impact on reduction of case backlogs or delays (Figures 1-3). On the executive side, the story is similar. In the DILG, basic information for overseeing prisons is not readily available or accessible, facilitating non-transparent functioning and human rights violations226. In the executive and the judiciary, business processes remain cumbersome and mostly manual.
9. Delays in case disposal, high cost of litigation, and limited resources in the public attorney’s office create barriers for access to justice for the poor. Access of poor litigants to public attorneys is restricted by eligibility criteria (e.g., threshold income level), a first-come-first-served condition which can exhaust funds, and the geographic spread of the country over more than 7,000 islands causing dispersed court locations and physical barriers to access. In regions like Mindanao, access to justice is further affected by security threats and instances of violence which have led to the resignation of several judges.227
10. Public trust and confidence in the lower courts, the DOJ and the DILG remains low. For courts, this appears to be due to (a) slow progress on efficiency, anti-corruption228 and impartiality229 and (b) the resulting ‘image deficit’.230 Corruption in courts involving lawyers and judges continues, with functions such as enforcement by sheriffs and transcript preparation by stenographers appearing to be more susceptible. Current Status of Key Justice Reforms 11. Since 2000, the Philippines judiciary, led by the Supreme Court, has implemented its Action Program for Judicial Reform (APJR), focusing on three major themes: (i) reducing case backlogs, increasing the use of alternate dispute resolution (ADR) mechanisms, piloting small claims courts, and modernizing case flow management using IT applications, (ii) enhancing access to justice, and (iii) restoring public trust and credibility. These reforms have been supported by multilateral and bilateral partners. 12. The Supreme Court has attempted to identify the reasons for delays, but these initiatives have had limited impact. The Court formed a Committee of Justices in 2006 to suggest practical procedures to achieve zero case backlogs. The Committee held dialogues with judges, clerks of courts, prosecutors and lawyers to promote efficient disposition of cases. These discussions and the 2004 Guidelines on Pre-Trial were expected to shorten court proceedings but did not. The Supreme Court established a pilot Regional Court Administration Office (RCAO) to
226 E.g. when prisoners are released with significant delays, or when detainees – including children and juveniles – sometimes languish before trial for periods beyond the maximum sentences prescribed for their crimes. 227 Since 1999, 15 judges have been murdered. More have received death threats (Global Integrity Report, 2008). 228 The Global Corruption Barometer score (Transparency International) for the Philippines judiciary worsened from 3.4 to 3.1 (with 1 being not corrupt and 5 being extremely corrupt) between 2005 and 2010. 229 A 2005 Freedom House report found that 60 percent of respondents believed that the rich and the poor do not get equal treatment in the courts. 230 However, the Supreme Court’s net satisfaction rating published by Social Weather Stations (SWS) improved between 2007 and 2010. The SWS defines net satisfaction rating as “Percent Satisfied” minus “Percent Dissatisfied”. The SWS net satisfaction rating for the Supreme Court improved from +5 (2007) to +36 in end-2010.
PHILIPPINES Discussion Note No. 26: Justice Reform June 2011
16
test decentralization of administrative functions and responsibilities. The practicality of the RCAO concept appears doubtful, given the possibility of more cost-effective decentralization through business process streamlining, automation and ICT-enabled communications capability.
13. A more successful approach has introduced summary procedures, providing long-awaited relief to litigants. The Supreme Court rolled out Small Claims Courts (SCC) in all 1,137 first instance courts (except Shari’a courts) after piloting this in 22 selected first instance courts.231 These courts are authorized to dispose civil disputes for payment or reimbursement of sums not exceeding P100,000 (approx. US$2,217).232
14. ADR233 is also used to reduce backlogs. The Philippines Judicial Academy (PHILJA) has been implementing the Justice Reform Initiatives Support (JURIS) Project with assistance from the Canadian International Development Agency (CIDA) to deliver training programs and supporting ADR mechanisms. Since 2001 Court Annexed Mediation (CAM) is an alternative to regular judicial processes. The Supreme Court established a Philippines Mediation Centre Office (PMCO) and Mediation Centre Units (MCUs) to systematize recruitment, training, accreditation, and evaluation of mediators, besides adopting special ADR rules that acknowledge new practices and technology.234 The Asian Development Bank (ADB) financed a Governance in Justice Sector Reform Program (GJSRP), which includes expanding the delivery of justice through ADR.
15. Justice entities have initiated budget reforms, but the pace is slow. The Department of Budget Management (DBM) and the Supreme Court’s Fiscal Management and Budget Office (FMBO) have prepared an Organizational Performance Indicator Framework (OPIF) which specifies the judiciary’s objectives and goals, and defines major final outputs (MFOs). This is a key first step towards integrating strategic planning, budgeting and performance management. However, judicial planning and budgeting capacity is low, and internal controls are not applied consistently: large unliquidated advances persist, often with no consequences for the officials concerned (such as stoppage of salaries until advances are liquidated), trust receipts are not deposited timely to the Bureau of Treasury, and asset verification is not undertaken with consistency and rigor. Slow and cumbersome procurement further limits absorptive capacity and constrains timely resource use235. Under the umbrella of the DBM’s budget reform initiatives, the DOJ and the DILG have also moved towards MFOs and performance indicators.
231 The SCCs are existing designated first instance courts authorized to follow summary procedures for resolving small monetary civil disputes. This initiative is supported by USAID and the World Bank. 232 The summary procedure is also applicable to enforcement of settlements under the Barangay Justice System. 233 ADR mechanisms include Court-Annexed Mediation (CAM), Appellate Court Mediation (ACM), Judicial Dispute Resolution (JDR), Mobile Court-Annexed Mediation (MCAM), and Court-Annexed Arbitration (CAA). 234 Special ADR rules allow filing and service by electronic means and provide for online dispute resolution. 235 The Netherlands Judicial Council (see Annex B) and Finland’s Ministry of Justice are good examples of justice entities with a strategic approach to budget management, linking allocations to objective performance indicators.
PHILIPPINES Discussion Note No. 26: Justice Reform June 2011
17
16. In 2009 the Supreme Court approved a visionary policy to modernize judicial ICT systems, but internal resistance has stalled implementation. The two complementary pillars of this policy promise to increase efficiency: (i) an Enterprise Information Systems Plan (EISP) for judiciary-wide ICT systems design, financing and implementation, and (ii) a MISO Re-engineering and Development Plan (MRDP) to strengthen capacity236. For the first time, the Court has a clear plan to transform its fragmented, obsolete and non-scalable ICT applications into a modern suite of ICT applications. However, a cautionary example of the extent of resistance from entrenched interests is the E-Library, an ‘early win’ application released five years ago at the initiative of the Justices, which made available free of charge, to judges and lawyers, a searchable electronic databank of Supreme Court decisions. Despite user plaudits and demand, MISO resisted upgrading it: the E-Library now languishes, its promise steadily waning.
17. Case flow management improvements have been incremental237, with limited court coverage, low inter-operability, poor scalability and few O&M resources. For example, the CIDA-assisted “Court Administration and Management Information System” (CAMIS) has led to better management of caseload and case flow information through automated reporting of cases in first and second level courts. Similarly, the World Bank-financed “enhanced Case Flow Management” (e-CFM) aims to improve management of case dockets in first and second tier courts. The “Case Management Information System” (CMIS) financed by USAID is used in the Supreme Court, the Court of Appeals, the Sandiganbayan and the Court of Tax Appeals.
18. The judiciary’s decade-long ICT modernization effort has contributed little to improving efficiency at the chokepoints: the courts of first instance and municipal/regional trial courts. The impact of ‘boutique’ stand-alone efforts mainly addressed to appellate courts and the Supreme Court has been limited, and has come at the cost of modernizing ICT applications for lower courts. And MISO’s ICT implementation approach has delayed the streamlining of business processes for key front-end (e.g. electronic case processing) and back-end (e.g. payroll, pensions, budgeting and procurement) functions. Serious mindset and capacity issues underlie such persistent implementation failures, and point to the necessity of a radically different approach (e.g. outsourcing implementation) for successful ICT modernization.
19. The judiciary’s “enhanced-Justice on Wheels” (E-JOW) program has improved access to justice. The E-JOW operates through mobile courts to reduce backlogs (especially those involving poor litigants who do not have the means to engage attorneys and post bail) and de-clog prisons. The program operates through eight buses deployed in regions and cities. The results are impressive: by end-2009 more than 2,500 cases were dismissed/inmates released, 6,883 inmates provided medical/dental assistance, 5,361 cases settled, and over 1,100 poor
236 The EISP constitutes the ‘what’ (i.e. the blueprint) for ICT modernization and the MRDP the ‘how-to’ (i.e. actions to strengthen MISO capacity, skills and knowledge to implement the EISP). The MRDP approach appears to be the only way to induce the transformation of MISO from “a single-family kitchen” servicing only the Supreme Court to a commercial-style industrial-scale “cafeteria” serving the entire judiciary. 237 Mainly through ICT applications supported by different development partners.
PHILIPPINES Discussion Note No. 26: Justice Reform June 2011
18
people provided free legal aid. E-JOW has also spread legal literacy: over 11,900 Barangay officials participated in discussions on, for example, rights of vulnerable populations.238
20. The Supreme Court has also pursued “soft actions” to strengthen access to justice. It has commissioned studies to improve outreach of justice with the support of the UNDP239, implemented the Access to Justice for the Poor Project supported by the EC, and taken important steps to ensure environmental justice. These efforts have created an “access to justice” network for coordinating women and child empowerment, training of court officials, and sensitization of the police force to respect for human rights. The designation of 117 courts as “Green Courts” by the Supreme Court could significantly improve compliance with environmental regulations.
21. Restoration of public trust and credibility remains a priority for the judiciary. Initiatives include: (a) implementing the “Strengthening the Integrity of Judiciary” (SIJ) project to eliminate opportunities for corruption within the judiciary, (b) the adoption of Codes of Judicial Conduct and Court Personnel Conduct, and (c) focus group discussions on whistle-blowing, reporting, and investigation of corrupt and fraudulent practices.
22. A critical gap is the lack of a forum where the executive, judicial and legislative leadership can reach consensus on justice reform priorities and policies. The existing forum is the Judicial-Executive-Legislative Advisory and Consultative Council (JELACC). The JELACC comprises nine members240. It would be desirable for the JELACC to focus on ‘big picture issues’ without impinging on judicial independence or being sidetracked by technical issues. It would also be helpful to ensure that eliminating inefficient, wasteful and duplicative expenditures, and reducing opportunities for corruption, are accorded equal priority to allocating resources. JELACC leadership on time-bound adoption of appropriate performance indicators by and for the courts, prosecution and jails would be a most welcome initiative.
B. Where the Philippines Could Be: A “5x5” Matrix of Policy Priorities and Actions Table 1: A Menu of Possible Policy Priorities and Actions
Policy Area 1: Reduce Delays in the Delivery of Justice Action 1.1 Decongest jails: expedite release of children, juveniles and elderly (Action: DILG, DOJ, SC) Action 1.2 Reduce judiciary case backlog volume by 50 percent in five years (Action: Supreme Court) Action 1.3 Fast-track procedures/ basic equipment for Small Claims Courts & prosecutors (Action: SC, DOJ) Action 1.4 Monitor resolution of key pending anti-corruption/plunder cases (Action: DOJ, Sandiganbayan) Action 1.5 Multi-year training program for Barangay officials on the Barangay Justice System (Action: DILG)
238 Discussions and information dissemination sessions have been organized under the e-JOW program for key Acts (e.g. on rights of indigenous population, rights of children & women, juvenile justice welfare, environment). 239 UNDP-supported projects include a study of the Shar’ia justice system, an assessment of the Public Attorney’s office, and preparation of a medium term development plan for the criminal justice system. 240The President of the Republic, as Chairperson, with the Vice-President, the Senate President, the House Speaker, and the Chief Justice as regular members, a Cabinet member to be designated by the President, one Senator and one member from the House Representative to be designated by their respective leaders, and an Associate Justice of the Supreme Court of the Philippines to be designated by the Chief Justice.
PHILIPPINES Discussion Note No. 26: Justice Reform June 2011
19
Policy Area 2: Improve the Efficiency of the Justice System Action 2.1 Complete EISP and MRDP implementation in five years (Action: SC) Action 2.2 Improve prosecutors’ conviction rates: install electronic case tracking system (Action: DOJ) Action 2.3 Implement an electronic corrections information system in three years (Action: DILG) Action 2.4 Adopt performance indicators for courts & prosecutors, publish statistics (Action: SC, DILG, DOJ) Action 2.5 Adopt a Medium-term Justice Sector Expenditure & Results Strategy in 2012 (Action: JELACC)
Policy Area 3: Reduce Barriers in Access to Justice for the Poor and Vulnerable Action 3.1 Increase the number of mobile courts, deploy them more efficiently (Action: Supreme Court) Action 3.2 Augment the budget for the Public Attorney’s Office (Action: DOJ, DBM) Action 3.3 Implement rule on mandatory legal aid services (Action: Supreme Court) Action 3.4 Establish legal aid committees to expand the reach of legal aid (Action: DILG, DOJ) Action 3.5 Improve access of vulnerable populations to ‘green courts’ (Action: Supreme Court)
Policy Area 4: Strengthen Public Trust and Confidence in the Justice System Action 4.1 Stop LGU payment of lower court judges’ allowances & MOOE (Action: SC, DILG, DBM) Action 4.2 Install ICT-based information kiosks in courts and Public Attorney Offices (Action: SC, DOJ) Action 4.3 Periodic user surveys in prosecution offices and lower courts, publish results (Action: SC, DOJ) Action 4.4 Commission an independent evaluation of the APJR, publish findings (Action: SC) Action 4.5 Improve employee morale and trust through sustained outreach (Action: SC, DOJ, DILG)
Policy Area 5: Improve Internal Governance in Justice Sector Entities Action 5.1 Streamline pension processing and payment241 (Action: SC, DOJ, DILG) Action 5.2 Enforce submission of Statements of Assets, Liabilities and Net Worth (Action: SC, DOJ) Action 5.3 Enact and implement National Prosecutors’ Service and Public Attorneys law (Action: DOJ) Action 5.4 Adopt Action Plan to fill vacancies in lower courts & prosecution service (Action: SC, DOJ, JBC) Action 5.5 Tighten controls242, reduce corruption/fraud/waste, protect whistleblowers (Action: SC, DOJ,
DILG).
Policy Area 1: Overcoming Delays in the Delivery of Justice Action 1.1 Decongest jails by expediting the release of eligible prisoners and detainees 23. The success of the e-JOW mobile courts in expediting release of eligible prisoners and detainees could be considerably ramped up through a well-coordinated effort among the Supreme Court, the DOJ and the DILG where such mobile courts, with magistrates, prosecutors and lawyers could be deployed as part of a special program to decongest jails.
Action 1.2 Reduce judiciary case backlog volume by 50 percent in five years 24. Sharp reductions in case backlogs, perhaps the most effective signal of efficiency and resolve in improving justice, could be achieved through concerted efforts. Not all the challenges relate to lack of equipment or finances, but some do relate to more efficient personnel deployment, and much to leadership. Some courts have seen impressive progress in backlog reduction – the presiding judges could serve as role models. Another option could be to create a
241 Within three years, retirees should receive the first pension payment on the day of retirement. 242 E.g. stop salaries till advances are liquidated, verify assets.
PHILIPPINES Discussion Note No. 26: Justice Reform June 2011
20
faster track for deciding petty cases, which form the bulk of the total caseload.243 The Supreme Court could also consider publishing, at quarterly intervals, data from lower courts on case backlogs and case disposition rates. Lastly, suitable adaptation of appropriate international good practices could accelerate backlog reduction. Some examples to consider include: (i) developing adjournment protocols,244(ii) transferring cases from over-burdened courts, (iii) encouraging on-line money claims as in the United Kingdom, and (iv) observing settlement weeks in courts.245
Action 1.3 Equip Small Claims Courts and prosecutors with fast-track procedures and basic equipment to deliver speedier justice
25. Adoption of summary processes and encouraging prosecutors, judges and lawyers to adopt plea bargaining for petty cases (a sizeable proportion of the criminal caseload) could lead to reduced case processing times and backlogs. The Supreme Court is considering faster rollout of SCCs to reduce civil case backlogs, and trying to rapidly address SCC basic equipment needs.
Action 1.4 Monitor the resolution of 5-10 long-pending prosecutions and court cases on anti-corruption, plunder and recovery of stolen assets
26. It would be desirable for the DOJ and the Sandiganbayan to monitor and ensure the resolution of 5-10 key prosecutions and court cases. Specialized training and technical support for prosecutors and investigators on recovery of stolen assets could also be considered.
Action 1.5 Launch a multi-year training program for Barangay officials to improve the effectiveness of the BJS
27. It would be desirable for the DILG, in collaboration with the judiciary, to launch a multi-year training program at the Barangay level to improve the knowledge and understanding of the BJS among Barangay and other LGU officials. An outreach campaign in LGUs where uptake of BJS cases is low could be considered. And improving enforcement procedures at the Barangay level for settlements under the BJS could avoid spillover of cases to the regular court system.
Policy Area 2: Improving the Efficiency of the Judicial System Action 2.1 Complete implementation of the EISP and MRDP within five years 28. It would be desirable for the Supreme Court to act decisively to implement its EISP, the key instrument to harness ICT’s efficiency-inducing and corruption-reducing capacity. However, given the judiciary’s ICT implementation track record over the last decade and MISO’s severe capacity constraints, the only realistic possibility of implementing the EISP and MRDP is to outsource implementation. While doing so, care should be taken to ensure that four high-visibility and high-impact EISP elements are implemented on a priority basis: (a) an e-JCMS
243 E.g., Cases which are minor criminal offences like traffic violations, petty thefts, etc. and other criminal acts punishable with fine or imprisonment for one year or less. 244 As has been done by the Netherlands Judicial Council to define acceptable situations for adjournments (Practical ways of combating delays in the justice system, excessive workloads of judges and case backlogs, CEPEJ 2005) 245 ‘Settlement week’ is a joint effort by local trial courts and local bar association to mediate and settle cases. Courts in Ohio (USA) have reported settlement rates of over 50 percent in mediated cases.
PHILIPPINES Discussion Note No. 26: Justice Reform June 2011
21
(Judiciary Case Management System) pilot to reduce lower court case processing times, (b) an automated pension processing module which, within three years, should generate pension payment orders on an employee’s date of retirement (and eliminate graft in such processing), (c) a technical and functional upgrade for the E-Library, and (d) ICT support to first-level courts.
Action 2.2 Improve prosecutors’ conviction rates: install an electronic prosecution case
tracking system within three years 29. The prosecution could benefit from the installation of an electronic case tracking system which can (a) help individual prosecutors manage their caseloads more efficiently, and (b) enable management to oversee the organizational caseload and monitor its progress. The data generated would provide DOJ leadership with a reliable instrument to supervise the functioning of the prosecution system, periodic publication of the statistics could improve public accountability and reduce corruption, and over time, prosecution conviction rates could be expected to improve. It would be possible to acquire and install such a system within three years through focused procurement efforts overseen by the DOJ leadership.
Action 2.3 Implement an electronic corrections information system within three years 30. The corrections system could also immensely benefit from the acquisition and installation of an electronic information system which, besides providing readily accessible data on inmates, is also connected with other elements of information systems in the criminal justice system. Some middle-income countries (e.g. Croatia) are establishing such systems, and their experience could be useful for the Philippines.
Action 2.4 Adopt monitorable performance indicators for courts, prosecutors and jails and publish statistics quarterly
31. It would be desirable for the Supreme Court, the DILG and the DOJ to adopt, within two years, appropriate performance indicators. It would be desirable for such indicators to be outcome-based, for baseline values to be published as rapidly as possible, and updates every quarter. Such periodic results reporting would instill greater accountability and transparency246. As part of this effort, it would be immensely helpful to periodically publish data on the results from the programs for free legal aid and mobile courts (e-JOW) (see Actions 3.1 to 3.5 below).
Action 2.5 Conduct a justice sector Spending and Results Review as the basis for a Medium-term Justice Sector Expenditure and Results Strategy, which could be adopted by the JELACC in 2012
32. Significant budget resources have been spent by justice sector entities in the last five years. However, it is unclear: (i) to what extent resources were allocated in line with stated policy priorities, (ii) what results were achieved, and (iii) what needs to change. An independent review of justice sector spending and results is now essential. More efficient and transparent
246 This reporting is not meant to be at the level of individual judges/prosecutors but at the spending unit level (e.g. a regional trial court).
PHILIPPINES Discussion Note No. 26: Justice Reform June 2011
22
resource use and management will underpin increased operational efficiency in a constrained fiscal environment. A rapid review of justice sector expenditures, results and institutional arrangements could provide actionable recommendations for the Supreme Court, DOJ, DILG and DBM. It would inform a costed and prioritized Medium Term Public Investment Program (MTPIP) for the justice sector (i.e. the judiciary, DOJ and DILG), which would produce: (i) a three- to five-year rolling capital investment/facility improvement plan, (ii) stronger links between resource allocation and performance, and (iii) arguments to augment resources through a contestable budgetary exercise. Completing such a review by mid-2012 could provide the JELACC with the information to prioritize reforms and resource allocation.
Policy Area 3: Reducing Barriers in Access to Justice for the Poor and Vulnerable Action 3.1 Increase the number of mobile courts, deploy them more efficiently 33. Improving access to justice for the poor, marginalized and vulnerable implies rapidly scaling up the e-JOW program. A sizeable population still does not have adequate access to justice. Rapid scaling-up of the e-JOW could reach out to this under-served population without the high fixed costs implied by new physical facilities. Funding from the World Bank’s Judicial Reform Support Project has been available to the Supreme Court should it desire to rapidly acquire and deploy several more mobile courts. However, offers of donations of mobile courts from NGOs or private parties should be dealt with cautiously to avoid any perception that parties which have, or may have, litigation pending are donating such equipment.
Action 3.2 Augment the budget for the Public Attorney’s Office 34. There may be a need to increase the budget allocation for the Public Attorney’s Office to ensure that higher numbers of eligible poor and disadvantaged persons are able to access the free legal aid program. Any increase in budget allocations could be made conditional on simultaneous implementation of measures to decrease the administrative costs of such legal aid programs, and periodic public reporting of the number of persons assisted as well as the measures taken to reduce administrative costs.
Action 3.3 Implement rule on mandatory legal aid services 35. The rule on mandatory legal aid services by practicing lawyers requires immediate implementation through appropriate consultation with the bar. The Supreme Court and executive entities could also explore the feasibility of mandatorily requiring law students to work in Public Attorney’s offices, as part of their professional apprenticeship or training, to increase the availability of free legal aid.
Action 3.4 Establish legal aid committees to expand the reach of legal aid
PHILIPPINES Discussion Note No. 26: Justice Reform June 2011
23
36. The Supreme Court could consider establishing district legal aid committees247 to better leverage resources and wider involvement of all sections of the society. Such committees could be chaired by the head of the first instance court, with representatives from the LGU, NGAs, the bar association and NGOs.
Action 3.5 Improve access of vulnerable populations to ‘green courts’ 37. The Supreme Court’s initiatives to support environmental preservation have struck a significant chord across the country. Access of vulnerable groups to environmental justice could be expedited by funding civil society entities to raise awareness and provide legal aid to eligible persons to avail the protection available from the courts.
Policy Area 4: Strengthening Public Trust and Confidence in the Justice System Action 4.1 Eliminate LGU influence on judicial independence: stop payment by LGUs
of lower court judges’ allowances and lower courts’ operating expenses 38. The result of LGU funding of lower courts is that justice is seen to be compromised, and expenditures on courts from LGU budgets is difficult to estimate. It is now time to review this historical anomaly, and provide for all court-related funding – Personal Services (PS), Maintenance and Other Operating Expenditures (MOOE) and Capital Outlays (CO) - to flow through the judiciary’s allocation from the national budget. Given the political economy implications of this exercise, it would be appropriate for JELACC to put this issue on its agenda.
Action 4.2 Implement ICT-based applications and information kiosks in lower courts, prosecution offices and Public Attorney Offices to (i) improve service provider-user interface, and (ii) publish statistics and user survey data
39. Greater transparency in justice entities’ interface with citizens could reduce corruption and improve public trust and confidence. This could be done, for example, through ICT and web-based applications which support online publication of decisions, web posting of case allocations, online case filing, and online public access to judicial decisions.
Action 4.3 Verify users’ actual experience with justice entities through quick surveys in
prosecution offices and lower courts, publish results quarterly 40. In line with good practice in several countries, and in view of the low public trust and confidence, it would be desirable for the Supreme Court and the DOJ to conduct continuous, short user surveys in courts, prosecution offices and Public Attorney Offices. These could be administered online in the offices/courts to clients and users when they come to transact business, the results automatically aggregated at the entity level, and published quarterly on the Supreme Court and DOJ websites and on the websites of respective courts/offices. Such surveys are relatively inexpensive to standardize and administer.
247 District legal aid committees in India and Bangladesh involve Bar Associations, local governments, civil society.
PHILIPPINES Discussion Note No. 26: Justice Reform June 2011
24
Action 4.4 Commission an independent evaluation of the APJR and publish the findings 41. The APJR has provided a framework for reforms for a decade. An independent and objective evaluation of the APJR being commissioned by the Supreme Court is expected to draw lessons and provide inputs to the judicial leadership to define the next stage of judicial reforms. The evaluation is expected to involve extensive consultations with APJR stakeholders.
Action 4.5 Improve employee morale and trust through sustained outreach 42. The spurt in reform initiatives implied by the executive and judicial leadership will require sustained efforts from all personnel categories in the courts, DOJ and DILG. It would be desirable for the respective leaderships to implement a sustained outreach effort targeted to employees, to address work-related constraints and improve employee morale and trust.
Policy Area 5: Improving Internal Governance in Justice Sector Entities Action 5.1 Streamline pension processing: within three years any judiciary/DOJ/DILG
retiree should receive the first pension payment on the day of retirement 43. It can take years for a judge’s pension to be approved and payments to begin. In some cases, bribes are reportedly demanded to expedite processing. Some retired judges/employees have fallen ill or even died before they received their pension. It would be inspiring if the Supreme Court, DOJ and DILG leadership publicly committed to streamline/automate their employees’ pension processing such that within three years, a retiree could receive the pension payment order on the day of retirement. This would also cast the judiciary and DOJ ICT modernization in concrete motivational terms, with employees having a stake in such reforms.
Action 5.2 Ensure compliance of submission of Statements of Assets, Liabilities and Net Worth (SALN) by judges and prosecutors
44. It would be desirable for the leadership of the Supreme Court and the DOJ to ensure compliance of submission, by judges and prosecutors, of SALNs.
Action 5.3 Fast-track enactment and implementation of legislation on the National Prosecutors’ Service and Public Attorneys
45. It would be desirable for the DOJ to fast-track enactment and implementation of proposed legislation on the National Prosecutors’ Service and the Public Attorneys. To ensure that implementation is funded, a regulatory impact assessment of the legislation is recommended.
Action 5.4 Adopt a time-bound Action Plan to fill vacancies in the lower courts and the prosecution service
46. Three measures could significantly improve the utilization of human resources: (a) filling the large number of judges’ vacancies through a time-bound action plan, including expediting the
PHILIPPINES Discussion Note No. 26: Justice Reform June 2011
25
lengthy JBC process,248 (b) improving recruitment and placement practices for court personnel by amending job classifications and skill requirements, and (c) suitably redefining job classifications and job descriptions of court staff in anticipation of business process automation.
47. Urgent improvements include the tightening of available – but unused – internal controls in the judiciary, DOJ and DILG. Actions could be taken to: (i) stop salaries of officials with large unliquidated advances – until the advances are liquidated, (ii) annually verify movable and immovable assets and improve their inventorying and recording, (iii) streamline procurement processes to reduce opportunities for corruption, fraud, waste and delay, and (iv) strengthen whistleblower protection (as the Supreme Court is trying to do).
Note prepared by: Amit Mukherjee (ECSP4) The World Bank
248 The Judicial and Bar Council processed 3,552 applications for vacancies in 2008. Each year, numerous vacancies remain due to cumbersome and lengthy procedures and a perceived lack of transparency in selection.
PHILIPPINES Discussion Note No. 26: Justice Reform June 2011
26
ANNEX A: THE STRUCTURE OF THE PHILIPPINES JUSTICE SECTOR
FUNCTION OFFICE BRANCH OF GOVERNMENT Courts Judicial Branch
Quasi-Judicial bodies (including National Labor Relations Commission) and administrative agencies with quasi-judicial functions (such as Presidential anti-graft commission)
Executive Branch
Barangay Justice System Executive Branch (Department of the Interior and Local Government)
National Commission on Indigenous Peoples Executive Branch (Office of the President) Commercial arbitration and other alternative dispute resolution mechanisms
Framework set by legislature, implementing rules to be set by Department of Justice, corresponding rules to be adopted by judiciary
Dispute Resolution
Juvenile Justice System on Diversion (local social welfare and development departments, Barangays, law enforcement officers, prosecutors)
Executive branch
National Prosecution Service Executive branch (Department of Justice) Office of the Solicitor General Executive branch (Department of Justice) Ombudsman Independent Constitutional Commission Commission on Elections Independent Constitutional Commission
Prosecution
Commission on Human Rights Independent Constitutional Commission Commission on Human Rights Independent Constitutional Commission Ombudsman Independent Constitutional Commission Anti-Money Laundering Council Independent financial intelligence unit Presidential Anti-Graft Commission Executive branch
Law Enforcement: Investigation
Various executive and administrative agencies Executive branch Philippine National Police Executive Branch (National Police
Commission and the Department of Interior and Local Government)
National Bureau of Investigation Executive branch (Department of Justice) Philippine Drug Enforcement Agency Executive branch (Department of Justice)
Law Enforcement: Police Action
Other law enforcement agencies with power to arrest and effect searches and seizures
Executive branch
Public Defence Public Attorney’s office Executive branch (Department of Justice) Bureau of Corrections Executive branch (Department of Justice) Parole and Probation Administration Executive branch (Department of Justice) Bureau of Jail Management and Penology and Philippine National Police–supervised jails
Executive branch (Department of Interior and Local Government)
Provincial jails Executive branch (LGU) Department of Social Welfare and Development Executive branch (Department of Social
Welfare and Development)
Corrections
Local Government Units Executive branch (LGU) Senate Legislative branch Law Enactment House of Representatives Legislative branch
Source: Background Note on the Justice Sector of the Philippines (Asian Development Bank, 2009)
DN25-27
ANNEX B:
PERFORMANCE BUDGETING IN THE NETHERLANDS : A FOCUS ON EFFICIENCY
A performance budgeting approach was introduced in the Netherlands judiciary from 2005. The aim was to improve the efficiency and equity of resource allocation among courts, and enhance the transparency and accountability of the judicial system. The new approach is based on a workload analysis and requires a robust monitoring system in place in all courts. During budget negotiations the Judicial Council and the Ministry of Justice agree on an annual caseload for the next budget year based on which the allocations for the courts system are made. The budgeting model is based on estimates of average time for groups of cases and categories of courts and estimated cost of processing each group of cases. The ‘price’ per case is agreed every 3 years between the Ministry of Justice and the Council and covers the cost of operations and maintenance including personnel. The average time to process each case is estimated on the basis of a detailed time measurement survey conducted every 3 years. Information on the number of cases is produced every quarter. An equalization account covers the difference between the agreed and actual number of cases at the end of the year. For example, courts that have processed more cases than planned can access additional funds from the equalization account up to a certain limit, while courts that “under-produce” in terms of number of cases, have to transfer “unused” or “excess” funds to this account. The new performance budgeting system provides incentives for improved performance in terms of speed of completion of cases. Its prerequisites are a robust benchmarking system, a detailed monitoring system, and an overall public financial management system based on program budgeting underpinned by agreed and monitorable indicators of performance. However, reservations have been expressed, especially by judges, that the system’s emphasis on cost and speed could compromise the quality of judicial decisions. Source: Information provided by the Council Bureau, Netherlands