21
www.nt.gov.au Roper River fish movement study Report on 2015/2016 data Report number 19/2016D Photograph: P. Cowan Photograph: P. Cowan Photograph: P. Cowan
www.nt.gov.au
Roper River fish movement study
Report on 2015/2016 data
Report number 19/2016D
Photograph: P. Cowan
Photograph: P. Cowan
Photograph: P. Cowan

Roper River fish movement study. Report on 2015/2016 data
ii
This report can be cited as: Dostine, P.L. and Crook1, D.A. (2016). Roper River fish movement study. Report on 2015/2016 data. Department of Environment and Natural Resources. Report number 19/2016D. Palmerston, Northern Territory.
Water Resources Division Department of Environment and Natural Resources PO Box 496 Palmerston NT 0831 1 Research Institute for the Environment and Livelihoods Charles Darwin University Darwin NT © Northern Territory of Australia, 2016 ISBN 9781743501153

Roper River fish movement study. Report on 2015/2016 data
i
Executive summary
This report presents a summary of the results of the first year of data collection by the
Roper River fish movement study.
The project is tracking the movements of 100 fish (80 barramundi and 20 fork-tailed
catfish) using an array of acoustic receivers from near Mataranka to the mouth of the
Roper River.
The movements of fish have been tracked since October 2015, and the database
held 1.25 million records by the end of July 2016.
Results to date highlight the strong connection between large-scale movement by fish
and river flow.
While most fish were relatively sedentary and did not make substantial movements
beyond the original tagging location, a minority of barramundi made substantial
movements in both directions.
Four (mostly) large barramundi embarked on a downstream spawning migration.
Most of these movements coincided with periods of high flow in the river, but the
timing and nature of the downstream movements were highly variable.
A small number of (mostly) juvenile barramundi undertook an extensive upstream
migration commencing near the peak of the first flood pulse of the wet season. One
fish moved upstream 85 kms, and another 106 kms, in 10.3 and 8.7 days
respectively.
Although the study is in its early stages, there is preliminary evidence that river
barriers present impediments to fish movement even under moderately high flows.
For example passage across Roper Bar occurred at flows in excess of 40 cumecs.
Further data will allow modelling of the relationship between flow and the probability
of passage across potential barriers.
Additional work is required to more fully describe the phenomenon of juvenile
migration, and in particular the flow conditions required for transition to freshwater
habitats.

Roper River fish movement study. Report on 2015/2016 data
ii
Contents
1. Introduction ........................................................................................................................ 1
2. Methods .......................................................................................................................... 2
2.1 Hydrology ............................................................................................................... 2
2.2 Fish movement ....................................................................................................... 5
3. Results ........................................................................................................................... 9
3.1 Hydrology ............................................................................................................... 9
3.2 Fish length frequency distribution ......................................................................... 10
3.3 Database records ................................................................................................. 10
3.4 Fish movement ..................................................................................................... 11
4. Discussion ................................................................................................................... 16
5. Acknowledgements ..................................................................................................... 17
6. References ................................................................................................................... 17
Roper River fish movement study. Report on 2015/2016 data
1
1. Introduction
Increased demand for water resources from expanding agriculture in northern Australia will
impact natural flow regimes of spring-fed rivers, including the Daly and Roper Rivers.
Sustainable development of water resources will require information on the relationships
between river flow and the ecology of key aquatic species, in order to ensure that the
ecological requirements of these species are not compromised.
The maximum annual extraction limit under the draft water allocation plan for the Tindall
Limestone Aquifer, Mataranka, is 19,500 ML, or 15% of the average annual recharge
calculated for the period 1900 to 2008 of 130,000 ML. The annual extraction limit is the
lesser of the maximum annual limit and 20% of the seasonal recharge, calculated by
modelling based on the rainfall of the previous wet season. Water extraction will reduce river
base-flow and potentially impact river functions and ecological processes. These impacts
include an increase in the frequency of cease to flow events, and an increase in the spatial
extent of cease to flow conditions; declines in late dry season water quality and potentially an
increase in the frequency of fish kill events; diminished connectivity within the river and
disruption of fish migration; changes in the ratio of groundwater and surface water leading to
changed light environments and effects on benthic primary producers; and loss of productive
flow dependent habitat such as riffles.
Better understanding of the spatial ecology of key fish species will contribute to an improved
ecological basis for water resource management of large perennial rivers of the Top End.
Barramundi (Lates calcarifer) is regarded as a priority species due to its high public profile
and cultural importance. The basic ecology of barramundi in northern Australia has been well
described in a series of publications dating from 1982-1985 (Davis 1982, Davis and Kirkwood
1984, Davis 1985, Russell and Garrett 1985). The life history of the species includes
migration between freshwater and coastal marine habitats, and sequential hermaphroditism
whereby larger individuals are female. Individuals can move between marine and freshwater
habitats several times during their lifetime, though there is much individual variability. For
many years, it has been widely accepted that the life history of barramundi includes an
obligatory downstream migration for breeding followed by upstream movements of juveniles
which occupy freshwater habitat until maturity. However, recent research has demonstrated
high levels of individual variation in barramundi migration. The recent availability of acoustic
telemetry provides the opportunity to collect much better information on the movement
requirements of barramundi to support water allocation decisions. Although most of the
research effort will be focussed on barramundi, some effort will be directed towards other
species such as fork-tailed catfish and potentially involve other culturally important species
such as bull sharks and freshwater sawfish.
This project will document and model movement responses in relation to intra and inter-
annual variation in flow. This information can be used for the development of environmental
flow recommendations. The project will identify specific behavioural responses to flow that
could be used to optimise the utilisation of water while still protecting key components of the
flow regime. Incorporation of the results of this project into environmental planning processes
will achieve improved conservation outcomes for a range of fish species and riverine
ecosystems more generally.

Roper River fish movement study. Report on 2015/2016 data
2
This is a collaborative project involving researchers from the Aquatic Health Unit of the
Department of Environment and Natural Resources (DENR), Charles Darwin University
(CDU) and NT Fisheries. Field support is provided by the Yugul Mangi Land and Sea
Management rangers based at Ngukurr, NT Fisheries, and the Water Monitoring Group of
DENR. The co-leaders of the project are Dr Peter Dostine (DENR) and Associate Professor
David Crook (CDU). This report summarises results for the 2015/2016 wet season.
2. Methods
2.1 Hydrology
Hydrological data for the Roper River is available from gauging stations at Mataranka
(G9030176) and Red Rock (G9030250). Data on mean daily flow and mean daily water level
in the 2015/16 flow season was downloaded from the NT Water Data Portal
https://nt.gov.au/environment/water/water-data-portal. Gauge station data will be augmented
by water level data collected using submersible loggers at key points along the river including
immediately downstream of tagging sites, and upstream of potential in-stream barriers to fish
passage, including Roper Bar. Seven INW PT2X pressure and temperature loggers, and one
INW CT2X pressure, temperature and conductivity logger have been deployed to record data
at 15 minute intervals (Table 1, Figure 1). Five environmental loggers were downloaded in
mid-June; two could not be accessed and were not downloaded.
No. Site G code Latitude Longitude Type Data types
1 Rocky Bar G9035144 -14.73621 134.05002 PT2X Level, Temp
2 Rocky Bar d/s G9030029.02 -14.70175 134.08401 PT2X Level, Temp
3 The Swing u/s G9030029.01 -14.68034 134.10974 PT2X Level, Temp
4 Big River reach G9030036 -14.58913 134.31926 PT2X Level, Temp
5 Rockbar 24 G9030035 -14.60402 134.35753 PT2X Level, Temp
6 Rockbar 27 G9030034 -14.64233 134.37035 PT2X Level, Temp
7 Scraper Hole G9030037 -14.6848 134.37395 PT2X Level, Temp
8 Roper Bar G9030012 -14.71383 134.50578 CT2X Level, Temp, EC
Table 1. Location of environmental data loggers at eight sites on the lower Roper River.

Roper River fish movement study. Report on 2015/2016 data
3
a)
b)
Figure 1. (a) Map of Roper catchment showing study reach and localities mentioned in text; (b) study reach and location of environmental loggers.
Roper River fish movement study. Report on 2015/2016 data
4
a)
b)
c)
d)
e)
f)
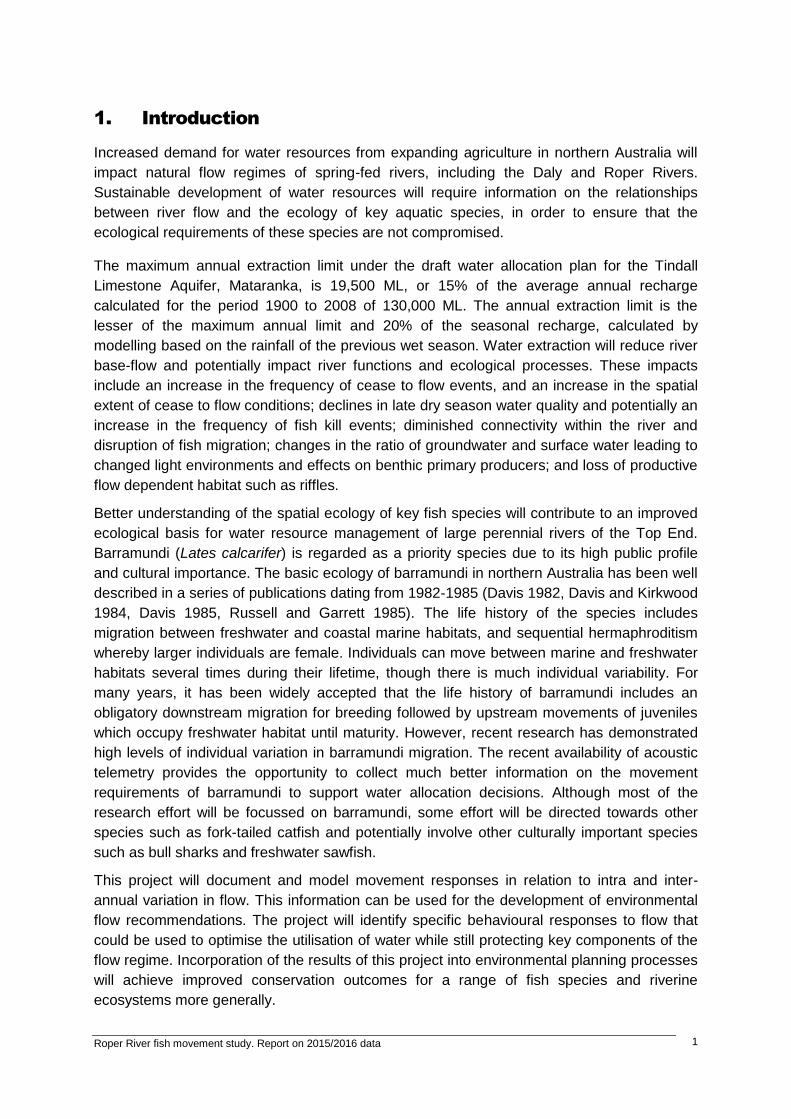
Figure 2. (a) Riffle cascade at ‘The Swing’ on Lonesome Dove station, (b) aerial view of ‘The Swing’, (c) riffle cascade beside lateral gravel bar, Scraper Hole paddock, Mt McMinn station, (d) aerial view of lateral gravel bar on Mt McMinn station, (e) road crossing at Roper Bar, and (f) aerial view of Roper Bar.
Roper River fish movement study. Report on 2015/2016 data
5
2.2 Fish movement
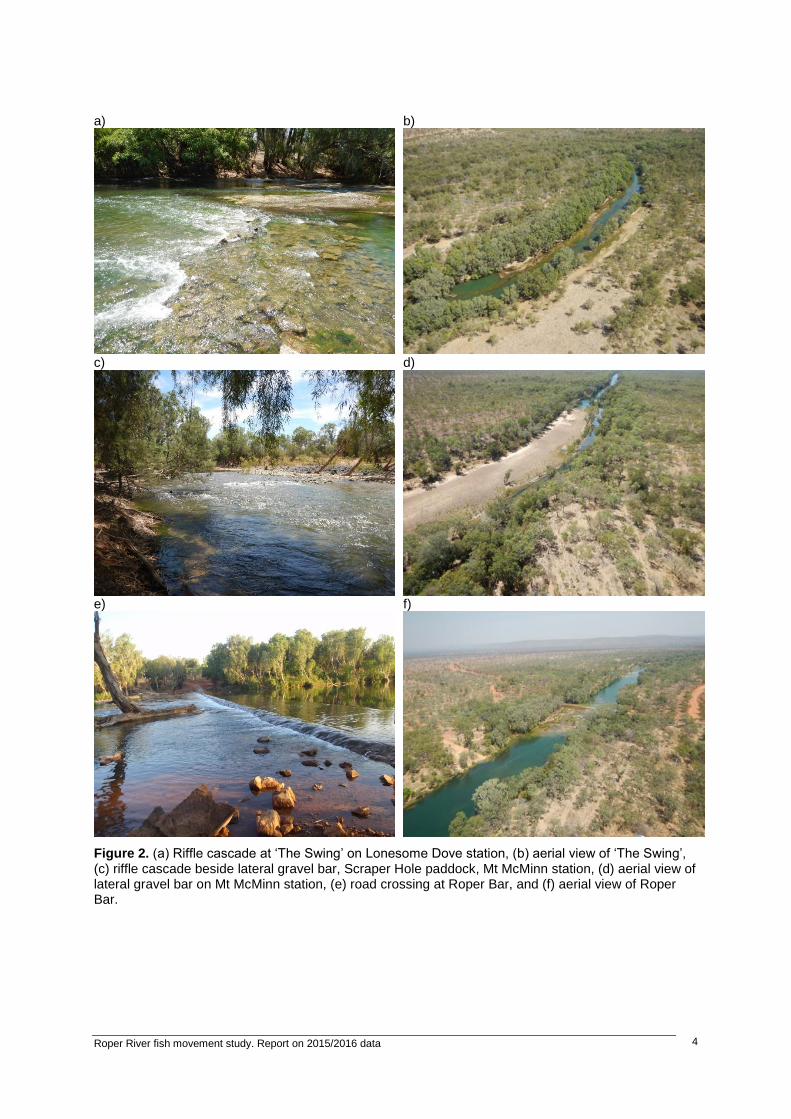
Patterns of movement of tagged fish are described from detections by an array of passive
receivers. Thirty eight receivers have been deployed along the main stem of the Roper River
from Elsey Station near Mataranka to the river mouth, a distance of >300 kilometres (Figure
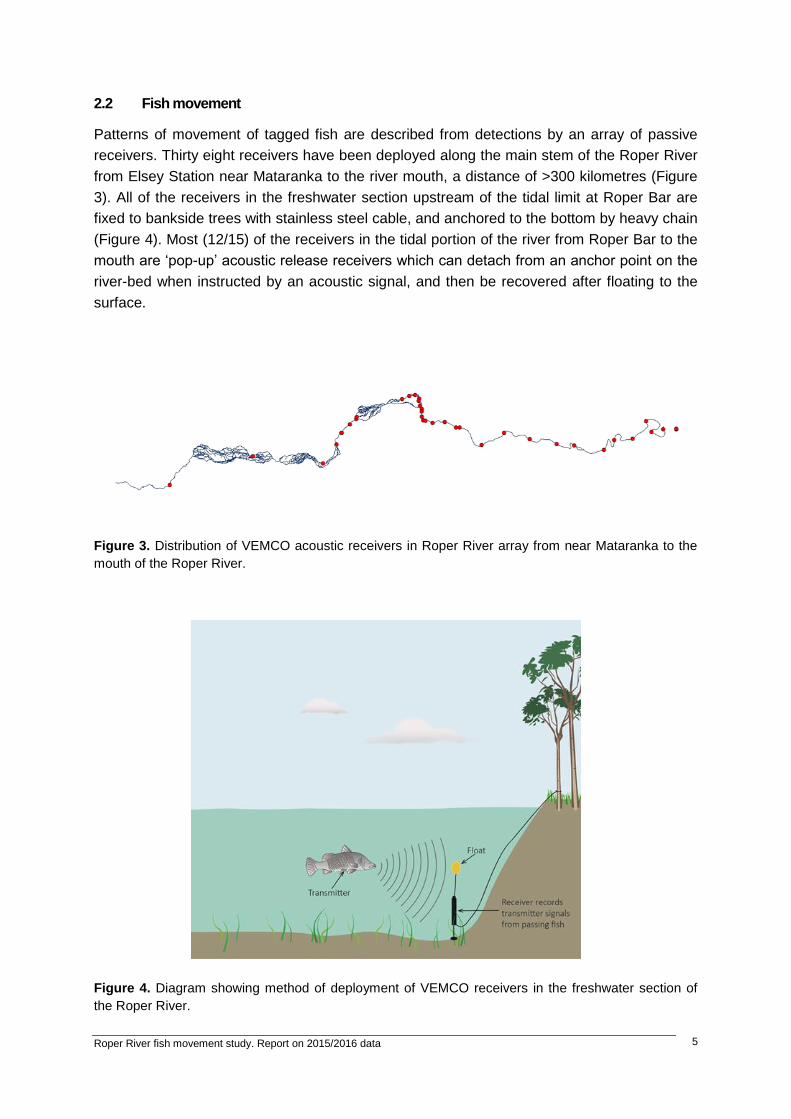
3). All of the receivers in the freshwater section upstream of the tidal limit at Roper Bar are
fixed to bankside trees with stainless steel cable, and anchored to the bottom by heavy chain
(Figure 4). Most (12/15) of the receivers in the tidal portion of the river from Roper Bar to the
mouth are ‘pop-up’ acoustic release receivers which can detach from an anchor point on the
river-bed when instructed by an acoustic signal, and then be recovered after floating to the
surface.
Figure 3. Distribution of VEMCO acoustic receivers in Roper River array from near Mataranka to the
mouth of the Roper River.
Figure 4. Diagram showing method of deployment of VEMCO receivers in the freshwater section of
the Roper River.

Roper River fish movement study. Report on 2015/2016 data
6
Transmitters have been surgically implanted into the abdominal cavity of 100 fish, including
80 barramundi (Lates calcarifer) and 20 fork-tailed catfish (Neoarius graeffei). Fifty
barramundi and 20 fork-tailed catfish were tagged in the Roper River on Mt McMinn station
between 14-23rd September 2015. All but two barramundi were tagged at the same site; two
fish were captured, tagged and released in the channel just downstream from the main site.
Thirty barramundi were tagged in the Roper River on Flying Fox station from 16-19th
November 2015. Given the estimated tag-life of 1,316 days, tags are expected to expire from
22nd April 2019. This tag-life will provide data across four wet seasons until the end of the wet
season of 2018/19.
Dates of data retrieval from acoustic loggers in 2015/16 are listed in Table 2.
a)
b)
c)
d)
Figure 5. (a) Mean daily flow (cumecs) at Mataranka gauge station (G9030176) from 1 Sep 15 to 31
May 16, (b) mean daily river height (m) at Mataranka, (c) mean daily flow at Red Rock gauge station
(G9030250) from 1 Sep 15 to 31 May 16, (d) mean daily river height at Red Rock.

Roper River fish movement study. Report on 2015/2016 data
7
Receiver number Receiver type Date River reach # detections
126746 VR2W 22-Jun-16 freshwater 13
126727 VR2W 08-Oct-15 freshwater 32
126727 VR2W 16-May-16 freshwater 14
126728 VR2W 17-May-16 freshwater 298
126749 VR2W 17-May-16 freshwater 49904
126744 VR2W 17-May-16 freshwater 163567
126753 VR2W 17-May-16 freshwater 8526
126752 VR2W 17-May-16 freshwater 198
126745 VR2W 17-May-16 freshwater 93
126735 VR2W 18-May-16 freshwater 42
126736 VR2W 21-Sep-15 freshwater 5720
126736 VR2W 23-Sep-15 freshwater 6972
126736 VR2W 13-Oct-15 freshwater 68475
126736 VR2W 18-May-16 freshwater 508694
126747 VR2W 16-Sep-15 freshwater 890
126747 VR2W 21-Sep-15 freshwater 11665
126747 VR2W 23-Sep-15 freshwater 5237
126747 VR2W 23-Oct-15 freshwater 56993
126747 VR2W 17-May-16 freshwater 345805
126724 VR2W 17-May-16 freshwater 19375
126741 VR2W 18-May-16 freshwater 696
126738 VR2W 18-May-16 freshwater 42
126739 VR2W 18-May-16 freshwater 82
126733 VR2W 18-May-16 freshwater 37
126742 VR2W 18-May-16 freshwater 55
126748 VR2W 18-May-16 freshwater 987
126734 VR2W 12-Sep-15 freshwater 1
126734 VR2W 18-May-16 freshwater 130
126743 VR2W 12-Sep-15 freshwater 1
126743 VR2W 18-May-16 freshwater 210
126731 VR2W 08-Dec-15 freshwater 0
126731 VR2W 04-Apr-16 freshwater 1003
126731 VR2W 17-May-16 freshwater 174
126729 VR2W 04-Apr-16 tidal 15
126729 VR2W 17-May-16 tidal 0
126737 VR2W 05-Apr-16 tidal 294
126737 VR2W 17-May-16 tidal 298
126726 VR2W 05-Apr-16 tidal 74
126726 VR2W 17-May-16 tidal 0
545970 VR2AR 05-Apr-16 tidal 40
545970 VR2AR 17-May-16 tidal 0
545966 VR2AR 17-May-16 tidal 45
545967 VR2AR 17-May-16 tidal 46
545964 VR2AR 17-May-16 tidal 51
Roper River fish movement study. Report on 2015/2016 data
8
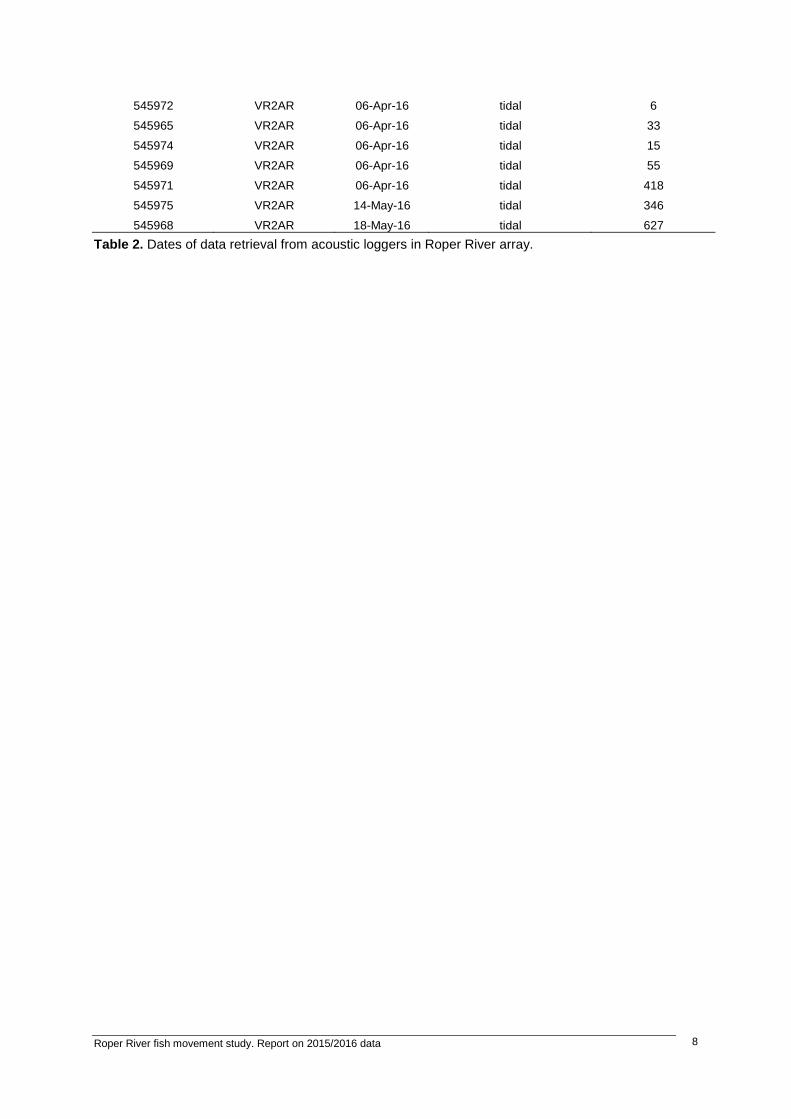
545972 VR2AR 06-Apr-16 tidal 6
545965 VR2AR 06-Apr-16 tidal 33
545974 VR2AR 06-Apr-16 tidal 15
545969 VR2AR 06-Apr-16 tidal 55
545971 VR2AR 06-Apr-16 tidal 418
545975 VR2AR 14-May-16 tidal 346
545968 VR2AR 18-May-16 tidal 627
Table 2. Dates of data retrieval from acoustic loggers in Roper River array.
Roper River fish movement study. Report on 2015/2016 data
9
3. Results
3.1 Hydrology
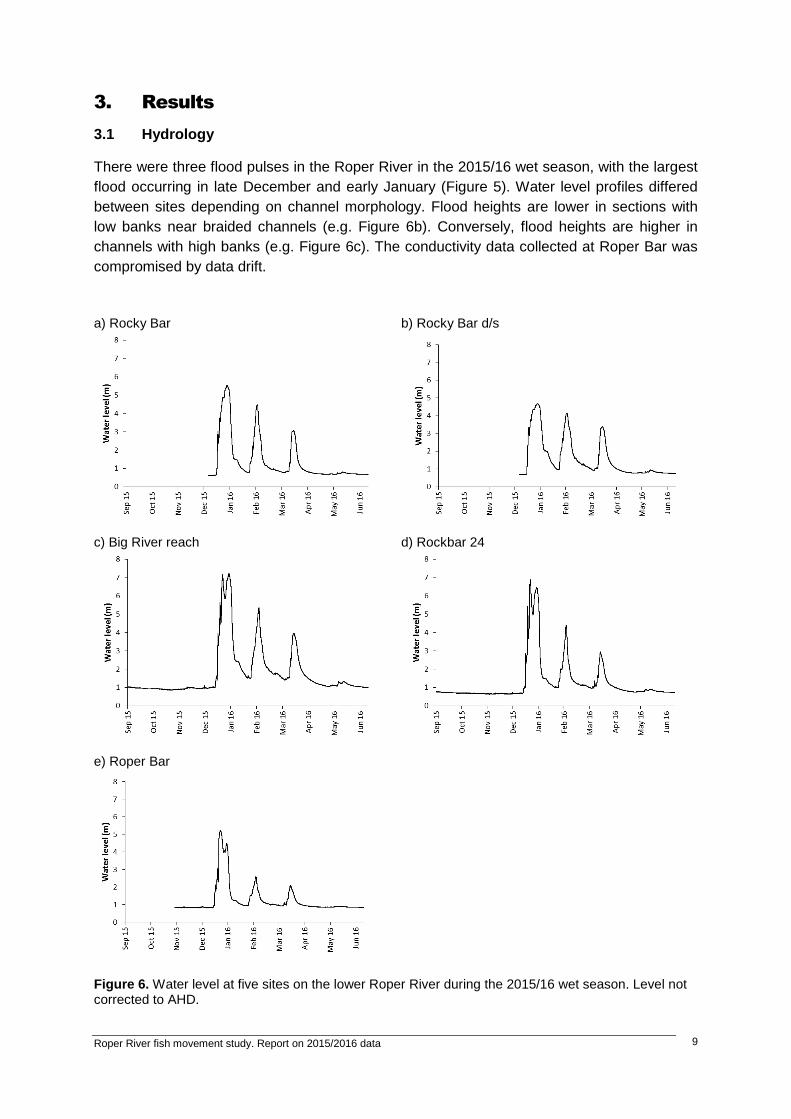
There were three flood pulses in the Roper River in the 2015/16 wet season, with the largest
flood occurring in late December and early January (Figure 5). Water level profiles differed
between sites depending on channel morphology. Flood heights are lower in sections with
low banks near braided channels (e.g. Figure 6b). Conversely, flood heights are higher in
channels with high banks (e.g. Figure 6c). The conductivity data collected at Roper Bar was
compromised by data drift.
a) Rocky Bar
b) Rocky Bar d/s
c) Big River reach
d) Rockbar 24
e) Roper Bar
Figure 6. Water level at five sites on the lower Roper River during the 2015/16 wet season. Level not corrected to AHD.
Roper River fish movement study. Report on 2015/2016 data
10
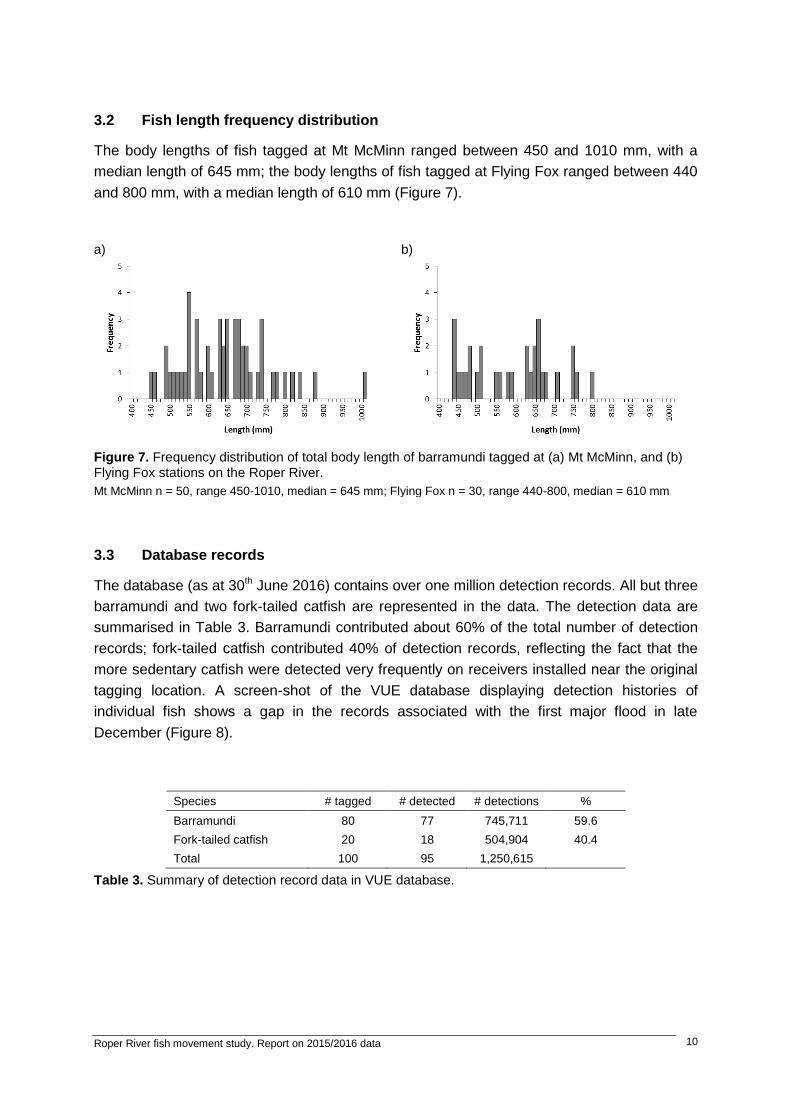
3.2 Fish length frequency distribution
The body lengths of fish tagged at Mt McMinn ranged between 450 and 1010 mm, with a
median length of 645 mm; the body lengths of fish tagged at Flying Fox ranged between 440
and 800 mm, with a median length of 610 mm (Figure 7).
a)
b)
Figure 7. Frequency distribution of total body length of barramundi tagged at (a) Mt McMinn, and (b) Flying Fox stations on the Roper River.
Mt McMinn n = 50, range 450-1010, median = 645 mm; Flying Fox n = 30, range 440-800, median = 610 mm
3.3 Database records
The database (as at 30th June 2016) contains over one million detection records. All but three
barramundi and two fork-tailed catfish are represented in the data. The detection data are
summarised in Table 3. Barramundi contributed about 60% of the total number of detection
records; fork-tailed catfish contributed 40% of detection records, reflecting the fact that the
more sedentary catfish were detected very frequently on receivers installed near the original
tagging location. A screen-shot of the VUE database displaying detection histories of
individual fish shows a gap in the records associated with the first major flood in late
December (Figure 8).
Species # tagged # detected # detections %
Barramundi 80 77 745,711 59.6
Fork-tailed catfish 20 18 504,904 40.4
Total 100 95 1,250,615
Table 3. Summary of detection record data in VUE database.

Roper River fish movement study. Report on 2015/2016 data
11
Figure 8. Screen shot of VEMCO VUE database showing effect of high wet season flow on detection histories. Tagged fish are less likely to be detected during periods of high river flow (shown at red arrow).
3.4 Fish movement
Most barramundi tagged on Mt McMinn station (42 of 50) did not undertake significant
movements in either an upstream or downstream direction. Six barramundi were detected
immediately upstream of Roper Bar during the wet season, with four fish migrating to the
Roper estuary mouth. The timing of departure of these fish varied between individual fish, but
mostly coincided with flow peaks during the wet season, although one fish departed after the
cessation of high flows in late April. Three of the four fish that migrated to the mouth were
>800 mm in length. The migration from fresh water was accomplished either in a single direct
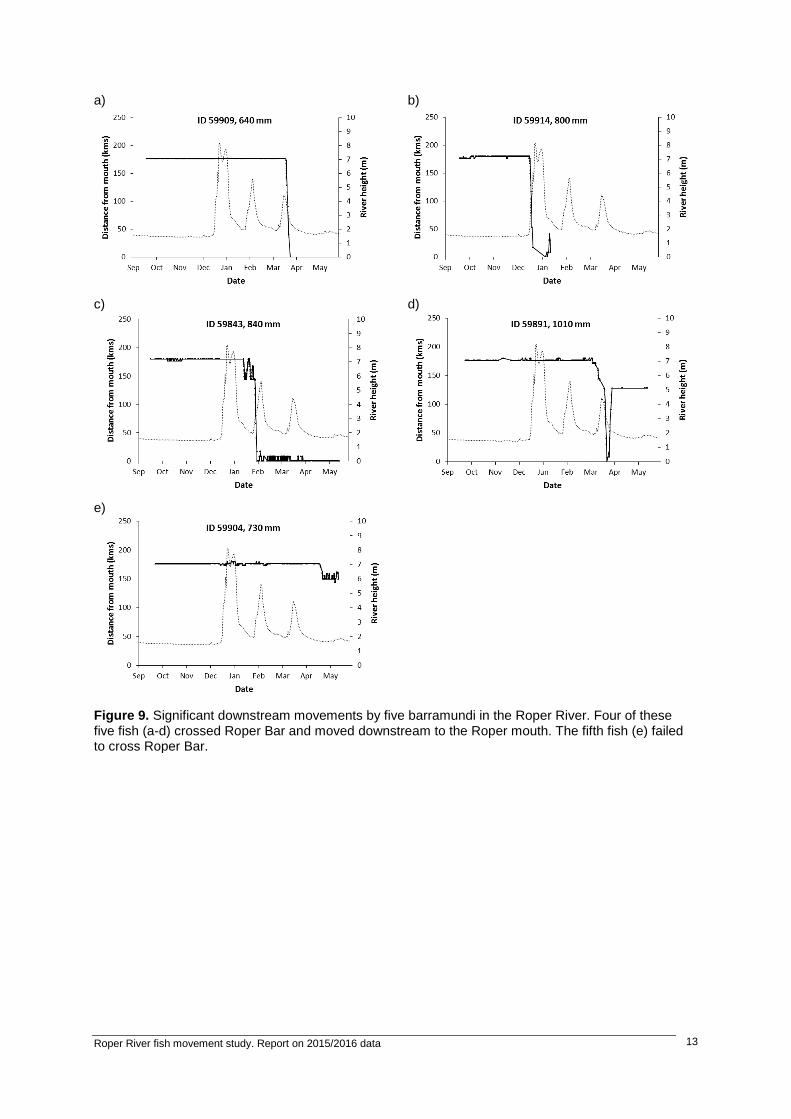
movement (Figure 9a) or with several ‘false starts’ (Figure 9c). One fish made a return
upstream journey from the Roper mouth almost to Roper Bar (Figure 9d).
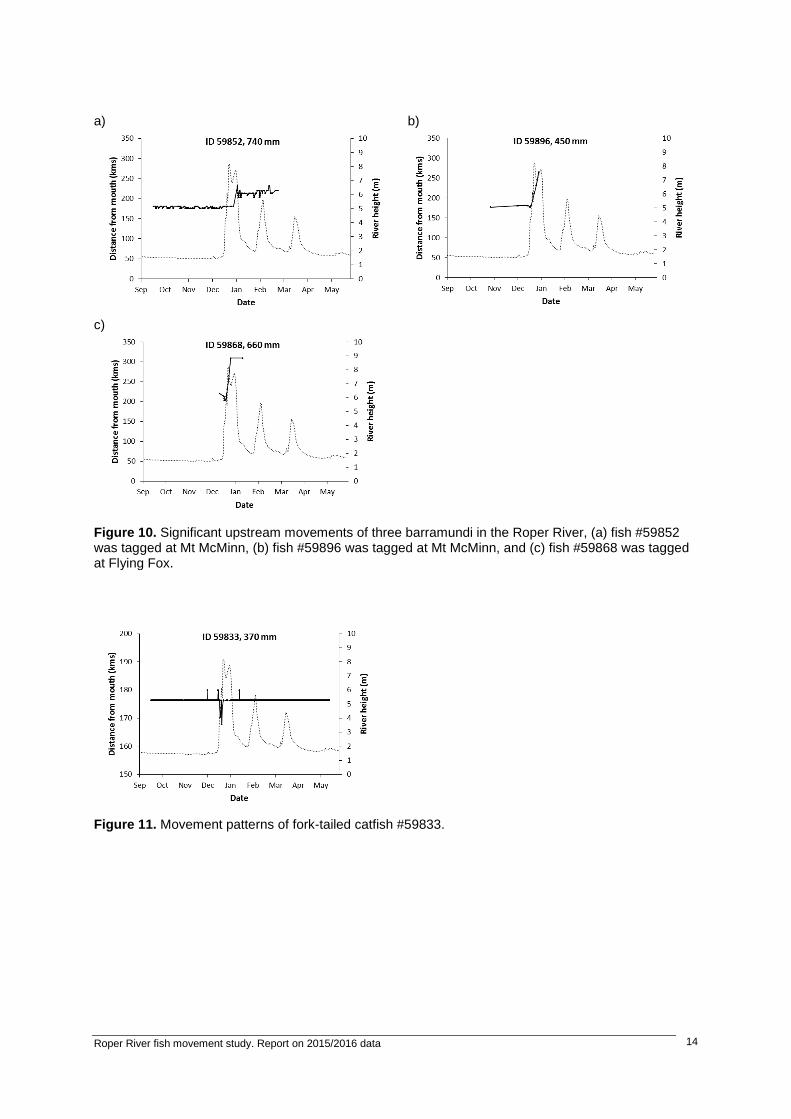
Four barramundi made significant upstream movements during the wet season. The longest
upstream movement was undertaken by fish #59868 which moved 106 kilometres from
Flying Fox Station to Red Lily lagoon on Elsey station in 8.7 days at an average of 12.2
km/day. By comparison, fish #59909 moved a distance downstream of 173 kilometres in 5.6
days, at an average rate of 30.9 km/day (Table 4).
Data for the dates of commencement of movement by barramundi, and flows at the time of
the commencement of movement, are presented for four movement classes: downstream,
upstream, successful crossing of Roper Bar, and approach but unsuccessful crossing of
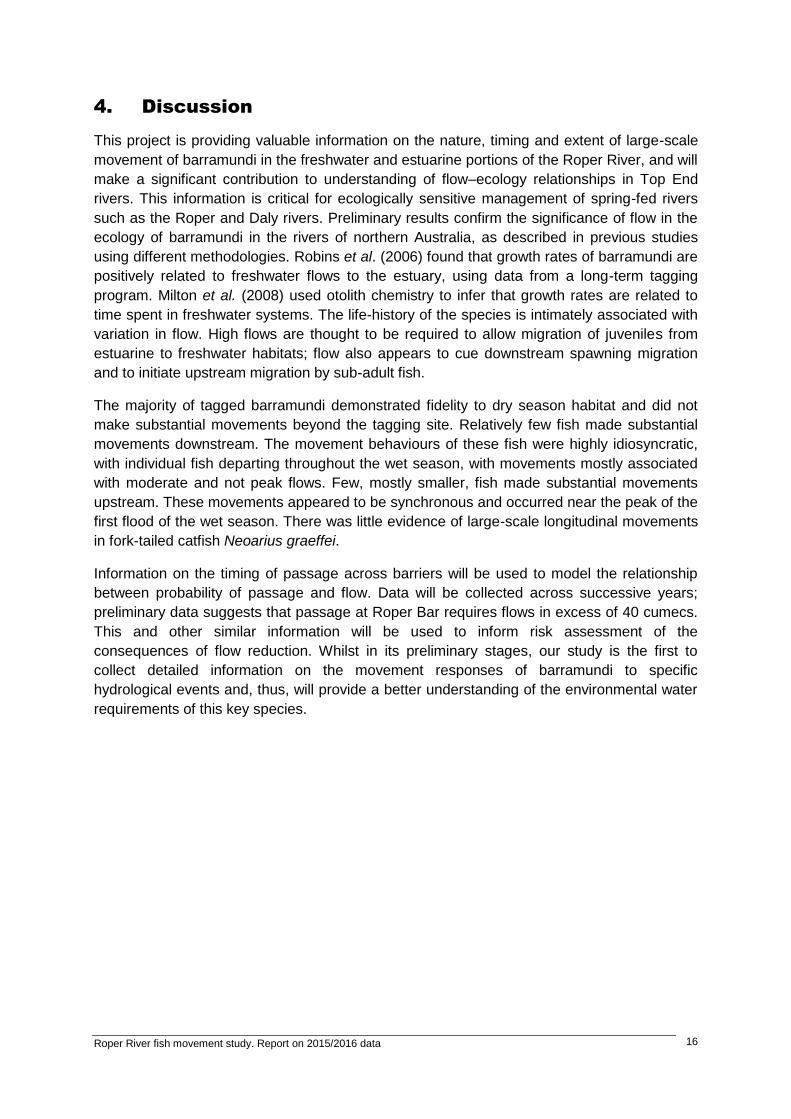
Roper Bar (Table 5, Figure 12). In summary, downstream movements involved large fish
(range 550-1010 mm), coincided with a steady or falling hydrograph, and spanned the wet
season from mid-December to late April. In contrast, upstream movements involved small
fish (450-740 mm), were initiated near peak flood, and occurred nearly simultaneously in late

Roper River fish movement study. Report on 2015/2016 data
12
December. Fish crossed Roper Bar at flows of at least 43 cumecs, and were not recorded
crossing the bar at flows of 24 cumecs and below.
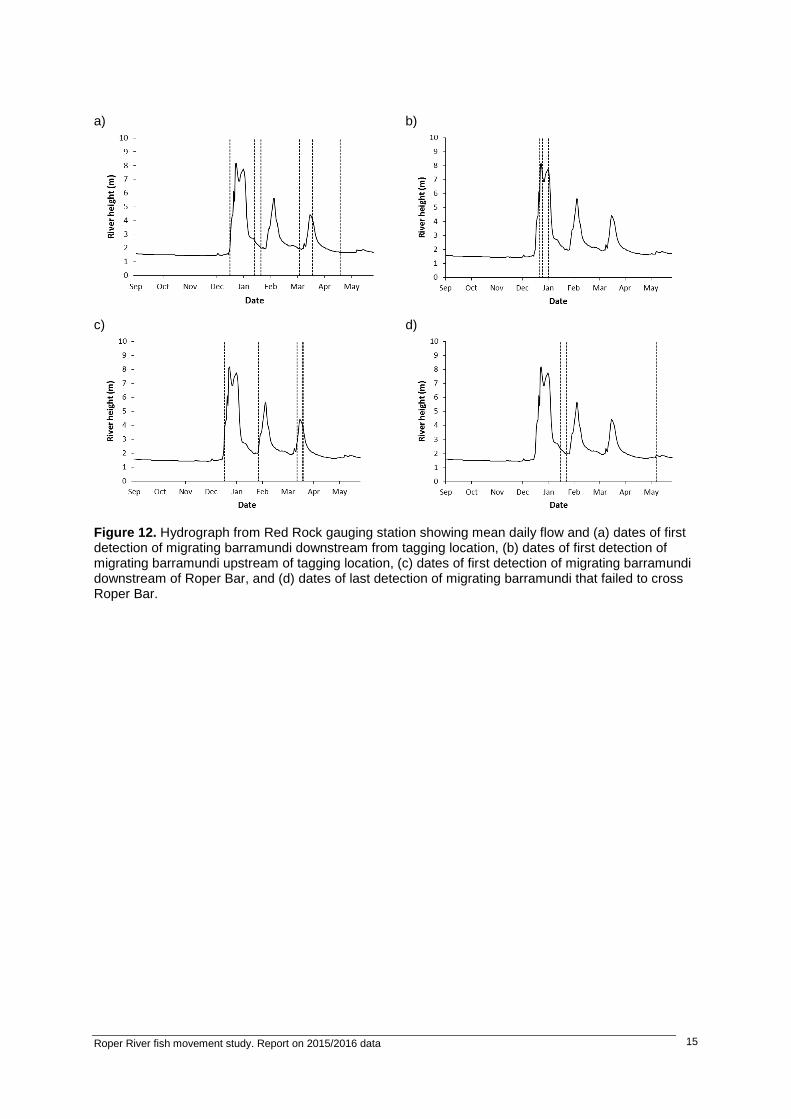
Of the 20 tagged fork-tailed catfish, two were undetected throughout the period, ten were
detected by only a single receiver, seven were detected by both receivers at the tagging site,
and only one moved beyond the tagging pool at Mt McMinn station (Figure 11). Fish #59833
made two forays downstream during the rising limb of the first flood in late December,
returning to the tagging site on each occasion, and remained in the vicinity of the
downstream logger for the remainder of the period.
Fish ID Direction Distance (kms) Duration (days) Rate (kms/day)
59896 upstream 85 10.3 8.3
59852 upstream 52 5.0 10.4
59868 upstream 106 8.7 12.2
59909 downstream 173 5.6 30.9
Table 4. Direction, distance moved, duration and rate of movement of four tagged barramundi.
Movement type Fish ID Length (mm) Date Flow (cumecs) Hydrograph
Downstream 59914 800 18/12/15 45 Rising
Downstream 59843 840 15/1/16 38 Falling
Downstream 59843 840 23/1/16 12 Steady
Downstream 59891 1010 7/3/16 10 Steady
Downstream 59909 640 22/3/16 141 Falling
Downstream 59855 550 22/3/16 141 Falling
Downstream 59904 730 23/4/16 4 Steady
Upstream 59868 660 23/12/2015 428 Rising
Upstream 59878 480 23/12/2015 428 Rising
Upstream 59896 450 27/12/2015 524 Falling
Upstream 59852 740 3/01/2016 592 Rising
Roper Bar success 59914 800 19/12/2015 181 Rising
Roper Bar success 59843 840 29/01/2016 43 Rising
Roper Bar success 59891 1010 16/03/2016 69 Rising
Roper Bar success 59909 640 22/03/2016 141 Falling
Roper Bar success 59855 550 24/03/2016 83 Falling
Roper Bar failure 59843 840 18/01/2016 24 Falling
Roper Bar failure 59843 840 25/01/2016 13 Steady
Roper Bar failure 59904 730 12/05/2016 8 Rising
Table 5. Date, estimated flow and hydrograph behaviour at onset of migration of barramundi.
Roper River fish movement study. Report on 2015/2016 data
13
a)
b)
c)
d)
e)
Figure 9. Significant downstream movements by five barramundi in the Roper River. Four of these five fish (a-d) crossed Roper Bar and moved downstream to the Roper mouth. The fifth fish (e) failed to cross Roper Bar.
Roper River fish movement study. Report on 2015/2016 data
14
a)
b)
c)
Figure 10. Significant upstream movements of three barramundi in the Roper River, (a) fish #59852 was tagged at Mt McMinn, (b) fish #59896 was tagged at Mt McMinn, and (c) fish #59868 was tagged at Flying Fox.
Figure 11. Movement patterns of fork-tailed catfish #59833.
Roper River fish movement study. Report on 2015/2016 data
15
a)
b)
c)
d)
Figure 12. Hydrograph from Red Rock gauging station showing mean daily flow and (a) dates of first detection of migrating barramundi downstream from tagging location, (b) dates of first detection of migrating barramundi upstream of tagging location, (c) dates of first detection of migrating barramundi downstream of Roper Bar, and (d) dates of last detection of migrating barramundi that failed to cross Roper Bar.
Roper River fish movement study. Report on 2015/2016 data
16
4. Discussion
This project is providing valuable information on the nature, timing and extent of large-scale
movement of barramundi in the freshwater and estuarine portions of the Roper River, and will
make a significant contribution to understanding of flow–ecology relationships in Top End
rivers. This information is critical for ecologically sensitive management of spring-fed rivers
such as the Roper and Daly rivers. Preliminary results confirm the significance of flow in the
ecology of barramundi in the rivers of northern Australia, as described in previous studies
using different methodologies. Robins et al. (2006) found that growth rates of barramundi are
positively related to freshwater flows to the estuary, using data from a long-term tagging
program. Milton et al. (2008) used otolith chemistry to infer that growth rates are related to
time spent in freshwater systems. The life-history of the species is intimately associated with
variation in flow. High flows are thought to be required to allow migration of juveniles from
estuarine to freshwater habitats; flow also appears to cue downstream spawning migration
and to initiate upstream migration by sub-adult fish.
The majority of tagged barramundi demonstrated fidelity to dry season habitat and did not
make substantial movements beyond the tagging site. Relatively few fish made substantial
movements downstream. The movement behaviours of these fish were highly idiosyncratic,
with individual fish departing throughout the wet season, with movements mostly associated
with moderate and not peak flows. Few, mostly smaller, fish made substantial movements
upstream. These movements appeared to be synchronous and occurred near the peak of the
first flood of the wet season. There was little evidence of large-scale longitudinal movements
in fork-tailed catfish Neoarius graeffei.
Information on the timing of passage across barriers will be used to model the relationship
between probability of passage and flow. Data will be collected across successive years;
preliminary data suggests that passage at Roper Bar requires flows in excess of 40 cumecs.
This and other similar information will be used to inform risk assessment of the
consequences of flow reduction. Whilst in its preliminary stages, our study is the first to
collect detailed information on the movement responses of barramundi to specific
hydrological events and, thus, will provide a better understanding of the environmental water
requirements of this key species.
Roper River fish movement study. Report on 2015/2016 data
17
5. Acknowledgements
The project benefited greatly from the support and assistance of the Yugul Mangi rangers.
Thanks are also due to the following individuals and organisations: Chris Errity, Wayne
Baldwin, Simon Xuereb and Thor Saunders from NT Fisheries; Lachlan Hetherington, Kyle
Tyler and Allen Fitzsimmons from Charles Darwin University; Andrew Drenen from Roper
Landcare; Dean Donald and the Mangarrayi ranger group; Richard Campbell and Russell
Irving from the Northern Land Council; and the leaseholders and managers of pastoral
stations along the Roper.
6. References
Davis, T.L.O. (1982). Maturity and sexuality in barramundi, Lates calcarifer (Bloch), in the
Northern Territory and south-eastern Gulf of Carpentaria. Australian Journal of Marine and
Freshwater Research 33: 529-545.
Davis, T.L.O. (1985). Seasonal changes in gonad maturity, and abundance of larvae and
early juveniles of barramundi, Lates calcarifer (Bloch), in Van Diemen Gulf and the Gulf of
Carpentaria. Australian Journal of Marine and Freshwater Research 36: 177-190.
Davis, T.L.O. and Kirkwood, G.P. (1984). Age and growth studies on barramundi, Lates
calcarifer (Bloch), in northern Australia. Australian Journal of Marine and Freshwater
Research 35: 673-689.
Milton, D., Halliday, I., Sellin, M., Marsh, R., Staunton-Smith, J., and Woodhead, J. (2008).
The effect of habitat and environmental history on otolith chemistry of barramundi Lates
calcarifer in estuarine populations of a regulated tropical river. Estuarine, Coastal and Shelf
Science 78: 301-315.
Robins, J., Mayer, D., Staunton-Smith, J., Halliday, I., Sawynok, B. and Sellin, M. (2006).
Variable growth rates of the tropical estuarine fish barramundi Lates calcarifer (Bloch) under
different freshwater flow conditions. Journal of Fish Biology 69: 379-391.
Russell, D. J. and Garrett, R.N. (1985). Early life history of barramundi, Lates calcarifer
(Bloch), in north-eastern Queensland. Australian Journal of Marine and Freshwater Research
36: 191-201.


