M.Sc. Thesis report Pico Cell Densification Study in LTE Heterogeneous Networks Guanglei Cong Supervisors: Fredric Kronestedt Systems & Technology Development Unit Radio Ericsson AB Ming Xiao Communication Theory Lab School of Electrical Engineering KTH
Transcript
M.Sc. Thesis report
Pico Cell Densification Study in LTE Heterogeneous Networks
Guanglei Cong
Supervisors:
Fredric Kronestedt
Systems & Technology
Development Unit Radio
Ericsson AB
Ming Xiao
Communication Theory Lab
School of Electrical Engineering
KTH
Pico Cell Densification Study in LTE Heterogeneous Networks Guanglei Cong
Abstract 2012-09-13
ii
Abstract Heterogeneous Network (HetNet) deployment has been considered as the main approach to boost capacity and coverage in Long Term Evolu-tion (LTE) networks in order to fulfill the huge future demand on mo-bile broadband usage. In order to study the improvement on network performance, i.e. capacity, coverage and user throughput, from pico cell densification in LTE HetNets, a network densification algorithm which determines the placement locations of the pico sites based on pathloss has been designed and applied to build several network models with different pico cell densities. The study has been taken based on a real radio network in a limited urban area using an advanced Matlab-based radio network simulator. The simulation results show that the network performance generally is enhanced by introducing more pico cells to the network.
Pico Cell Densification Study in LTE Heterogeneous Networks Guanglei Cong
Acknowledgements 2012-09-13
iii
Acknowledgements This thesis was performed in System & Technology, DU Radio, Ericsson AB in cooperation with Communication Theory lab, EES, KTH. First of all, I would like to express my appreciation and gratitude to my super-visor from Ericsson AB Fredric Kronestedt for his great guidance and kindness during the last six months. I would also like to thank my supervisor from KTH Prof. Ming Xiao who gave me a great deal of assistance and provided me with support throughout the entire thesis. I must express my thanks to Dirk Gerstenberger and Fredric Kronestedt for giving me this opportunity to spend six months in Ericsson AB to accomplish my master thesis. My sincere gratitude is also directed to my examiner Prof. Mikael Skoglund for his time and for his help when applying for this thesis.
I would also like to thank the following people from Ericsson AB for their support and kindness during the last six months: Gunther Auer, Jason Chen, Peter Björkén, Stefan Ström, Thomas Chapman and Tomas Lundborg.
Pico Cell Densification Study in LTE Heterogeneous Networks Guanglei Cong
Table of Contents 2012-09-13
iv
Table of Contents Abstract ............................................................................................................. ii
Acknowledgements ....................................................................................... iii
List of Figures ................................................................................................. vi
List of Tables ................................................................................................. viii
Terminology .................................................................................................... ix
1 Introduction ............................................................................................ 1 1.1 Background and problem motivation ...................................... 1 1.2 Overall aim ................................................................................... 1 1.3 Scope ............................................................................................. 1 1.4 Problem statement ...................................................................... 2 1.5 Outline .......................................................................................... 2
2 Theory ...................................................................................................... 3 2.1 Heterogeneous networks in LTE ............................................... 3 2.1.1 Low power nodes deployment ....................................... 3 2.1.2 Cell selection ..................................................................... 5 2.2 Two packet traffic models .......................................................... 7 2.2.1 Full buffer model .............................................................. 7 2.2.2 Equal buffer model ........................................................... 8 2.2.3 Comparison ....................................................................... 9 2.3 Related Tools .............................................................................. 10 2.3.1 TEMS CellPlanner .......................................................... 10 2.3.2 Elin .................................................................................... 12 2.3.3 LTE Astrid ....................................................................... 12
Pico Cell Densification Study in LTE Heterogeneous Networks Guanglei Cong
List of Figures 2012-09-13
vi
List of Figures Figure 2.1: Heterogeneous Network .............................................................. 3 Figure 2.2: Cell selection in 3GPP LTE HetNets ........................................... 6 Figure 2.3: Users with different radio link condition................................... 8 Figure 2.4: Average bitrate in full buffer model ........................................... 8 Figure 2.5: Average bitrate in equal buffer model ....................................... 9 Figure 3.1: Analyzed area .............................................................................. 14 Figure 4.1: Work flow ..................................................................................... 20 Figure 4.2: Flow chart of pathloss based pico sites densification algorithm .......................................................................................................... 22 Figure 5.1: Densified networks using pathloss based pico sites densification algorithm (chapter 4.2) ........................................................... 25 Figure 5.2: Densified networks using randomly distributed pico sites densification algorithm (chapter 4.2) ........................................................... 26 Figure 5.3: Pathloss based pico sites densification algorithm .................. 27 Figure 5.4: Randomly distributed pico sites densification algorithm ..... 27 Figure 5.5: Uplink comparison ...................................................................... 28 Figure 5.6: Downlink comparison ................................................................ 29 Figure 5.7: Uplink comparison ...................................................................... 30 Figure 5.8: Downlink comparison ................................................................ 31 Figure 5.9: Uplink mean user throughput vs uplink subscriber capacity ............................................................................................................................ 32 Figure 5.10: Uplink cell edge user throughput vs uplink subscriber capacity ............................................................................................................. 33 Figure 5.11: Improvement of uplink capacity ............................................ 34 Figure 5.12: Improvement of uplink coverage ........................................... 35 Figure 5.13: Downlink mean user throughput vs downlink subscriber capacity ............................................................................................................. 36 Figure 5.14: Downlink cell edge user throughput vs Downlink subscriber capacity .......................................................................................... 37 Figure 5.15: Improvement of downlink capacity ....................................... 37 Figure 5.16: Improvement of downlink coverage ...................................... 38 Figure 5.17: Uplink user throughput maps ................................................. 39 Figure 5.18: Improvement of uplink mean user throughput .................... 40 Figure 5.19: Downlink user throughput maps............................................ 41 Figure 5.20: Improvement of downlink mean user throughput .............. 42 Figure 5.21: Downlink geometry distribution ............................................ 42 Figure 5.22: Uplink throughput vs capacity ................................................ 43
Pico Cell Densification Study in LTE Heterogeneous Networks Guanglei Cong
List of Figures 2012-09-13
vii
Figure 5.23: Downlink throughput vs capacity .......................................... 44 Figure 5.24: Average uplink utilization of pico and macro cells with the target of 1 Mbps uplink cell edge user throughput ................................... 45 Figure 5.25: Average downlink utilization of pico and macro cells with the target of 10 Mbps downlink cell edge user throughput ..................... 45 Figure 5.26: Pico and Macro cells served area ............................................ 46 Figure 5.27: Comparison of Pico and Macro cells served area ................. 47
Pico Cell Densification Study in LTE Heterogeneous Networks Guanglei Cong
List of Tables 2012-09-13
viii
List of Tables Table 2.1: Guidelines for LPNs deployment [3] ........................................... 5 Table 2.2: Comparison of Full and Equal buffer model ............................ 10 Table 3.1: LPNs deployment.......................................................................... 15 Table 3.2: Simulation parameters.................................................................. 16
Pico Cell Densification Study in LTE Heterogeneous Networks Guanglei Cong
Pico Cell Densification Study in LTE Heterogeneous Networks Guanglei Cong
Terminology 2012-09-13
x
ISD Inter Site Distance
Pico Cell Densification Study in LTE Heterogeneous Networks Guanglei Cong
1 Introduction 2012-09-13
1
1 Introduction 1.1 Background and problem motivation
Mobile broadband usage has increased dramatically the last couple of years due to new types of terminals such as smart phones and tablet computers. According to [1], in 2010, wireless devices only accounted for 37% of IP traffic; but by 2015, wireless devices is estimated to con-sume 54% of IP traffic while wired devices will only consume 46% of IP traffic, which means that traffic from wireless devices will exceed wired devices.
To support the huge future demands as both the number of users and the user demand will increase, it is essential to enhance the network capacity and coverage. But with the knowledge that the deviation be-tween Long Term Evolution (LTE) link level performance and Shannon capacity is very small which limits the potential to increase spectrum efficiency [2], forcing us to find other means to meet the future demands.
A key method to fulfill the future needs is network densification through adding smaller low power nodes (LPNs) in traditional high power macro nodes, namely Heterogeneous Network (HetNet), which is expected to boost capacity and coverage beyond what is available in current LTE networks [3].
With the knowledge that HetNet deployment has a large potential to improve the network capacity and coverage, the influence of pico cell densification on the network performance is obviously of large interest.
1.2 Overall aim In order to see how effective the method of HetNet is to solve the prob-lem of the huge future demand on network performance, the project’s overall aim is to investigate how the network performance will be affected by deploying more and more pico cells in the network.
1.3 Scope The study has its focus on the impact of pico cell densification on the network performance, the cost of the pico sites deployment is ignored;
Pico Cell Densification Study in LTE Heterogeneous Networks Guanglei Cong
1 Introduction 2012-09-13
2
as a result, the number of pico sites in the network models that have been built in this project might be unrealistic.
The study will be taken based on a real radio network in a limited urban area in a dense major European city, the results might vary for different area and cities due to different terrain features and macro sites deploy-ment.
1.4 Problem statement To achieve the overall aim stated in chapter 1.2, the study has an objec-tive to respond to the following questions:
• Is it true that adding more and more pico cells will result in larger and larger capacity and coverage?
• Is there any upper limit on how many pico cells can be added to a dense urban macro network and still improves the network per-formance?
To achieve this objective, it is also desired to design a strategy of pico sites deployment:
• How should the pico sites be deployed to achieve better network performance from capacity and coverage point of view?
1.5 Outline Chapter 2 provides the related theory concerning some aspects of HetNet in LTE and some tools that have been used during this thesis work.
In chapter 3, the network model and simulation parameters of this project are presented, in addition with a brief discussion of an indoor propagation model which has been applied in a part of this study.
Chapter 4 describes how the network models with different pico cell densities have been built and simulated. A pico sites densification algorithm to decide where to place the pico sites has been designed and is also discussed in this chapter.
In chapter 5, the simulation result of this work will be presented.
The conclusions and possible future work will be presented in chapter 6.
Pico Cell Densification Study in LTE Heterogeneous Networks Guanglei Cong
2 Theory 2012-09-13
3
2 Theory 2.1 Heterogeneous networks in LTE
Heterogeneous network (HetNet) has been identified as a key method to fulfill the huge future demands on mobile broadband usage as both the number of users and the user demand will increase. In 3GPP LTE HetNets, traditional high power macro nodes are complemented with low power nodes (LPNs) which cover small areas and offer very high capacity and data rates in these areas [3], as illustrated in Figure 2.1.
Figure 2.1: Heterogeneous Network
Besides simply adding LPNs to the existing macro networks, there are some other approaches to expand network capacity and coverage as well, such as improving macro cells by allocating more spectrum and densifying the macro sites. Compared with these two methods, adding LPNs performs the same in the downlink and better in the uplink [3]. These three approaches can of course be combined together to meet higher demand.
2.1.1 Low power nodes deployment LPNs deployment is a real challenge in HetNets, many aspects need to be considered [3]:
• Demand: traffic volumes, traffic location, target data rates
• Supply: macro cell coverage, site availability, backhaul transmis-sion , spectrum and integration with the existing macro network
Pico Cell Densification Study in LTE Heterogeneous Networks Guanglei Cong
2 Theory 2012-09-13
4
• Commercial: technology competition, business models
In [3], some guidelines for LPNs deployment are provided:
• Open or closed access
Open access means LPNs are available for all subscribers to ac-cess. Open access should be chosen for public systems deployed by operators.
Closed access refers that LPNs belong to a Closed Subscriber Group (CSG), that is to say access is only available for users in CSG. Closed access is always used in user-deployed cases (by in-dividual, enterprises).
• Indoor or outdoor deployment
Deploying indoor LPNs is suitable in cases when traffic is con-centrated to specific indoor locations such as shopping malls.
Outdoor LPNs deployment that also covers indoor areas is pref-erable in cases such as local traffic hotspots cover a wide area in-cluding several buildings or the macro cells in the existing net-works are too sparse to meet indoor service demand.
• Type of LPNs
There are several types of LPNs: Remote Radio Units (RRUs), conventional pico nodes, relay nodes. RRUs are suitable for net-works with low-latency and high-capacity backhaul; otherwise stand-alone pico base stations should be preferable. Deploying relay nodes is a preferred option for networks without wire backhaul.
• Frequency reuse
The HetNets can be seen as composed of two layers: macro cell layer and pico cell layer. The two layers can use different fre-quency band or share the same band. Reusing the frequency band of the macro cell layer for the pico cell layer is of course spec-trum-efficient. When spectrum is scarce or capacity is the diver, frequency should be reused. However, due to the inter-layer in-terference, elaborate cell planning and interference management technique is needed.
Pico Cell Densification Study in LTE Heterogeneous Networks Guanglei Cong
2 Theory 2012-09-13
5
Table 2.1 summarizes the rules addressed above.
Choices Guidelines
Access Open access Operator-deployed
Closed access User-deployed
Deployment Indoor Concentrated large indoor
hotspot
Outdoor Outdoor hotspot or many smaller indoor hotspot
Type of LPNs
RRU Low-latency and high-capacity backhaul (fiber)
Stand-alone pico base stations
High-latency and low-capacity backhaul (copper/microwave)
Relay nodes No wire backhaul
Frequency reuse Reuse macro spectrum Spectrum is scarce /
Capacity is driver
Separate spectrum CSG
Table 2.1: Guidelines for LPNs deployment [3]
2.1.2 Cell selection Conventionally, cell selection is based on the downlink received signal strength which means mobile users will connect to the site from which the received power is strongest. For example, in 3GPP LTE, cell selection is performed according to two parameters measured by a User Equip-ment (UE): Reference Signal Received Power (RSRP) and Reference Signal Received Quality (RSRQ) [4].
“Reference signal received power (RSRP), is defined as the linear av-erage over the power contributions (in [W]) of the resource elements that carry cell-specific reference signals within the considered meas-urement frequency bandwidth” [4].
RSRQ is calculated based on RSRP which provides additional infor-mation and ensures a reliable cell selection decision when RSRP is not sufficient.
In homogeneous networks, RSRP based cell selection guarantees good channel conditions in both downlink and uplink. But in HetNets, since the transmission power in the downlink is different between the LNPs and the macro nodes and this transmission power difference doesn’t
Pico Cell Densification Study in LTE Heterogeneous Networks Guanglei Cong
2 Theory 2012-09-13
6
present in the uplink, RSRP based cell selection only guarantees good downlink channel conditions. As illustrated in Figure 2.2: in the grey area, the macro node is selected based on the downlink RSRP, but for the uplink the LPN is better since the transmission power is the same and the pathloss is lower towards the LPN [3]. That is to say, a better cell selection for the uplink is minimum pathloss cell section [5].
Downlink RSRP cell boundary
Uplink minimum pathloss cell boundary
Biased RSRP cell boundary (RSRP + offset)
Figure 2.2: Cell selection in 3GPP LTE HetNets
As shown in Figure 2.2, the optimal cell boundary of downlink and uplink is not identical. To solve this problem, the RSRP cell boundary of the LPN should be extended. The most straightforward way is to extend the RSRP cell boundary by increasing the LPN transmission power, but this method reduces site availability since it affects the site size and the cost [3]. Another means without increasing the output power is to add an offset to the RSRP from the LPNs which will affect the cell selection and increase the pico cell range – Biased RSRP cell selection [3][5][6], see Figure 2.2.
Biased RSRP cell selection mechanism could of course improve the uplink performance. However, it causes higher downlink interference for users in the extended cell range area. Some interference management techniques have been developed to solve this problem such as enhanced Inter-cell Interference Coordination (eICIC) [7]. Without this kind of interference management, there should be a tradeoff between downlink and uplink performance. Biased RSRP cell selection with a modest offset 3-4dB performs the best in many cases [6].
Pico Cell Densification Study in LTE Heterogeneous Networks Guanglei Cong
2 Theory 2012-09-13
7
2.2 Two packet traffic models In the simulation of LTE networks, there are mainly two packet traffic models: full buffer model and equal buffer model. These two models are both implemented in the simulator used in this project.
2.2.1 Full buffer model Definition of full buffer:
• Static traffic: the number of active users in the system is fixed, no arrivals and departures;
• Infinite sessions: each active user’s session lasts forever creating infinite data volume;
• Best effort: each active user fully utilizes the radio link.
In full buffer model, on one hand, the radio links are always utilized since active users are fixed and last forever.
On the other hand, users with different radio conditions spend same time in the system (infinite session), that is to say, users with poor radio conditions generate less data. As shown in Figure 2.3, user A and B are always sending data, as a result A and B contributes the same to the system throughput as illustrated in Figure 2.4.
As a conclusion, full buffer model gives optimistic performance estima-tion which may deviate from reality.
Pico Cell Densification Study in LTE Heterogeneous Networks Guanglei Cong
2 Theory 2012-09-13
8
User A: 10 Mbps User B: 1 Mbps
Figure 2.3: Users with different radio link condition
t
Bitrate
average
Figure 2.4: Average bitrate in full buffer model
2.2.2 Equal buffer model Definition of equal buffer:
• Dynamic traffic: the number of active users in the system is not fixed, new session arrivals and complete session departures;
• Finite sessions: each active user’s session ends when all data have been transmitted, all sessions have the same volume of finite data to send;
• Best effort: available link bitrate is utilized.
In equal buffer model, on one hand, radio links will be idle when all users are inactive.
Pico Cell Densification Study in LTE Heterogeneous Networks Guanglei Cong
2 Theory 2012-09-13
9
On the other hand, users with different radio conditions have same finite data volume to send (finite session), that is to say, users with poor radio conditions spend more time in the system. As shown in Figure 2.3, user A and B are sending the same volume of data, say 100 Mbits, user A needs 10s and user B needs 100s. As a result, B contributes 10 times more than A to the system throughput as illustrated in Figure 2.5.
As a conclusion, equal buffer model brings down the system capacity but it is more realistic. As a result, equal buffer model is chosen for this study and the simulation results shown in chapter 5 are all from equal buffer model.
t
Bitrate
average
Figure 2.5: Average bitrate in equal buffer model
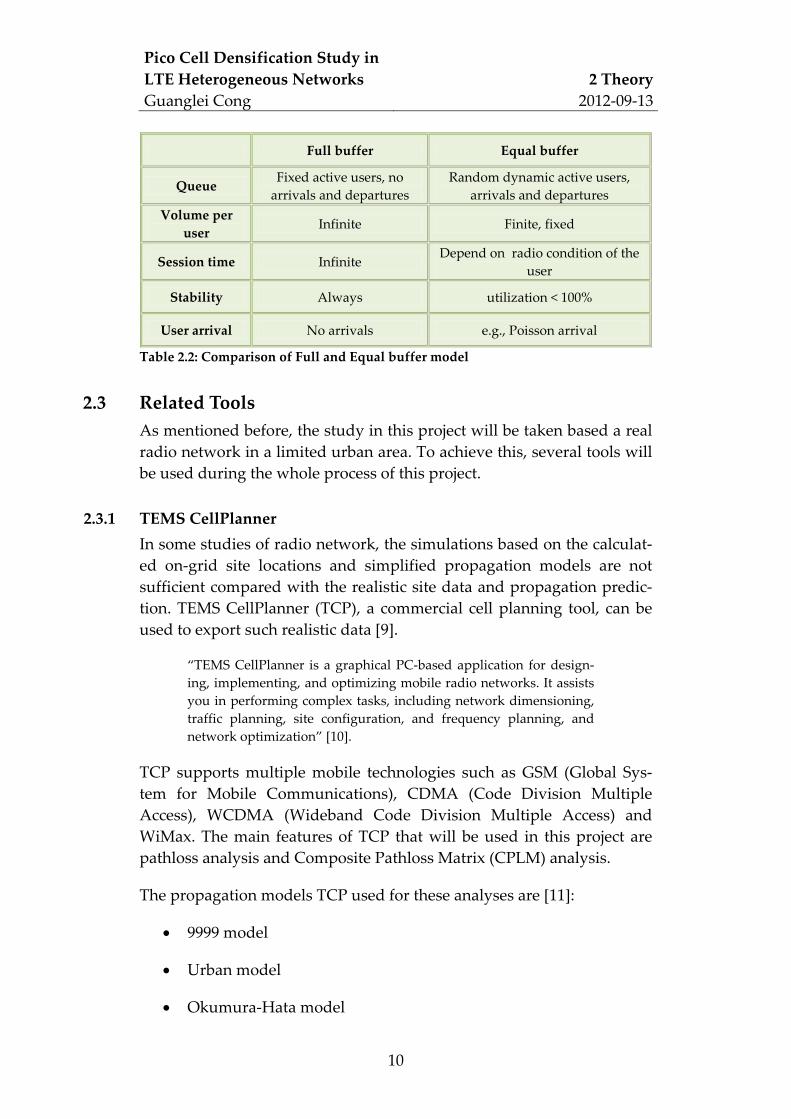
2.2.3 Comparison Some main differences between full buffer model and equal buffer model are listed in Table 2.2.
Pico Cell Densification Study in LTE Heterogeneous Networks Guanglei Cong
2 Theory 2012-09-13
10
Full buffer Equal buffer
Queue Fixed active users, no arrivals and departures
Random dynamic active users, arrivals and departures
Volume per user Infinite Finite, fixed
Session time Infinite Depend on radio condition of the user
Stability Always utilization < 100%
User arrival No arrivals e.g., Poisson arrival
Table 2.2: Comparison of Full and Equal buffer model
2.3 Related Tools As mentioned before, the study in this project will be taken based a real radio network in a limited urban area. To achieve this, several tools will be used during the whole process of this project.
2.3.1 TEMS CellPlanner In some studies of radio network, the simulations based on the calculat-ed on-grid site locations and simplified propagation models are not sufficient compared with the realistic site data and propagation predic-tion. TEMS CellPlanner (TCP), a commercial cell planning tool, can be used to export such realistic data [9].
“TEMS CellPlanner is a graphical PC-based application for design-ing, implementing, and optimizing mobile radio networks. It assists you in performing complex tasks, including network dimensioning, traffic planning, site configuration, and frequency planning, and network optimization” [10].
TCP supports multiple mobile technologies such as GSM (Global Sys-tem for Mobile Communications), CDMA (Code Division Multiple Access), WCDMA (Wideband Code Division Multiple Access) and WiMax. The main features of TCP that will be used in this project are pathloss analysis and Composite Pathloss Matrix (CPLM) analysis.
The propagation models TCP used for these analyses are [11]:
• 9999 model
• Urban model
• Okumura-Hata model
Pico Cell Densification Study in LTE Heterogeneous Networks Guanglei Cong
2 Theory 2012-09-13
11
• Walfish-Ikegami model
Pathloss analysis in TCP is performed for each individual sector: a bin matrix is built for each sector with the pathloss from the sector antenna to each bin within the prediction radius set manually. And TCP gives pathloss predictions very close to realistic data based on the inputs of TCP such as [11]:
• Terrain data: elevation, etc.
• Land use data: buildings, trees, open area, etc.
• System data: technology, frequency, etc.
• Site data: site location, etc.
• Antenna data: height, gain, etc.
CPLM analysis in TCP merges the pathloss results from individual sectors into a composite dataset based on the following parameters [11] [12]:
• Max. pathloss (dB): largest pathloss which is considered to be rel-evant and allowed for the calculation. Any pathloss higher than this value is not included in the resulting CPLM calculation;
• Max delta pathloss (dB): largest difference between lowest and largest pathloss values in the resulting CPLM calculation. The lowest pathloss value is searched. Any value higher than lowest pathloss + maximum delta pathloss is not included in the calcula-tion;
• Max. number of cells: maximum number of cells from which the pathloss values are considered in CPLM calculation at any one bin.
Another useful module of TCP is Automatic Cell Planning (ACP) which optimizes the network performance in a limited area by modifying the parameters of the sector antennas. ACP runs under some user-defined performance targets on coverage, quality and capacity, as well as some user-defined configuration constraints on the sector antennas, e.g., constraints on power, electrical tilt, mechanical tilt and azimuth.
Pico Cell Densification Study in LTE Heterogeneous Networks Guanglei Cong
2 Theory 2012-09-13
12
2.3.2 Elin Elin is a program package which can be integrated with the TCP instal-lation. Elin is used to export system data, site data and calculated prop-agation data (see chapter 2.3.1) from TCP into some wireless network simulators (e.g., LTE Astrid which will be introduced in the following chapter) [9]. The exported data is stored in a so called proj mat-file (Matlab data file) created by Elin.
The pathloss values are stored in a g-matrix in proj. The pathloss values are sorted to have the best values of each bin in the first column of the g-matrix, second best in the second column and so on. Another matrix, namely cellno-matrix, with the same size of the g-matrix contains the cell numbers corresponding to the pathloss values in the g-matrix [9].
These two matrixes together can be used by the wireless network simu-lators to calculate received signal strength, Signal to Interference plus Noise Ratio (SINR) and so on, and to do cell selection for each bin dur-ing the simulation.
2.3.3 LTE Astrid LTE Astrid is a static LTE network simulator in Matlab which conducts Monte Carlo method [13] in the simulation. The realistic network data exported from TCP via Elin can be analyzed with respect to capacity and coverage by LTE Astrid.
The entire simulation in LTE Astrid comprises of several Monte Carlo runs. Each run is a network snapshot with randomized distributed users in the area [14]. The number and locations of the users follows the pre-defined parameters, i.e., traffic distributions and utilization.
LTE Astrid simulates the network using RSRP based cell selection. With LPNs deployed, the simulator should be modified to apply Biased RSRP cell selection with an offset added to the RSRP from LPNs as discussed in chapter 2.1.2.
The two packet traffic models, full and equal buffer models, addressed in chapter 2.2 are both implemented in LTE Astrid. Achievable bitrate (ABR) is the main output from LTE Astrid Monte Carlo simulation which is the way to calculate system throughput (STP) for full and equal buffer model:
• Full buffer model estimate: uABRmeanSTPFB ×= )(
Pico Cell Densification Study in LTE Heterogeneous Networks Guanglei Cong
2 Theory 2012-09-13
13
• Equal buffer model estimate: uABRmeanSTPEB ×= )/1(/1
• EBFB STPSTP ≥
Here, u means utilization which defines the probability that a cell has a user to schedule. In LTE Astrid, STP is actually calculated in a similar but more advanced approach.
One problem in wireless network simulation is “border effects”, i.e., the number of cells in an area might be very large which makes the simula-tion of all the cells infeasible, but simulating a part of them would underestimate interference for the users in the border cells. One method to avoid this problem is called “wrap-around” which models the system as homogeneous and connects the edges of the simulation area in a torus fashion. But this method is not realistic in HetNets for analyzing real networks. Another solution is to analyze a small area while simulate a relatively larger area. The smaller area is denoted active area while the larger one is denoted supporting area. The cells in the active area are active cells while surrounding cells are supporting cells [14]. These two areas should be defined in TCP by polygons in advance and network data in the supporting area should be exported via Elin.
Pico Cell Densification Study in LTE Heterogeneous Networks Guanglei Cong
3 Models 2012-09-13
14
3 Models 3.1 Studied Network
As mentioned before, the study will be taken based on a real radio network in a limited urban area in a dense European city as shown in Figure 3.1.
[m]
[m]
5.28 5.285 5.29 5.295 5.3 5.305
x 105
1.802
1.804
1.806
1.808
1.81
1.812
1.814
1.816
1.818
1.82
1.822
x 105
Figure 3.1: Analyzed area
The studied network models are built based on existing WCDMA 2.1 GHz site grid:
• Macro cells: 228 cells in total (83 sites)
• Macro inter site distance(ISD): 250-350 m
• 60% of study area is indoor area
• Macro sites average antenna height ~33 m
Pico Cell Densification Study in LTE Heterogeneous Networks Guanglei Cong
3 Models 2012-09-13
15
• Macro sites average antenna electrical tilt: ~5.15 deg
• Macro sites average antenna mechanical tilt: ~1.46 deg
Analyzed area:
• Area: ~1.4 km2
• Macro cells: 24 cells (9 sites)
High resolution maps are used:
• 3D building data bases
• 5x5m bin resolution
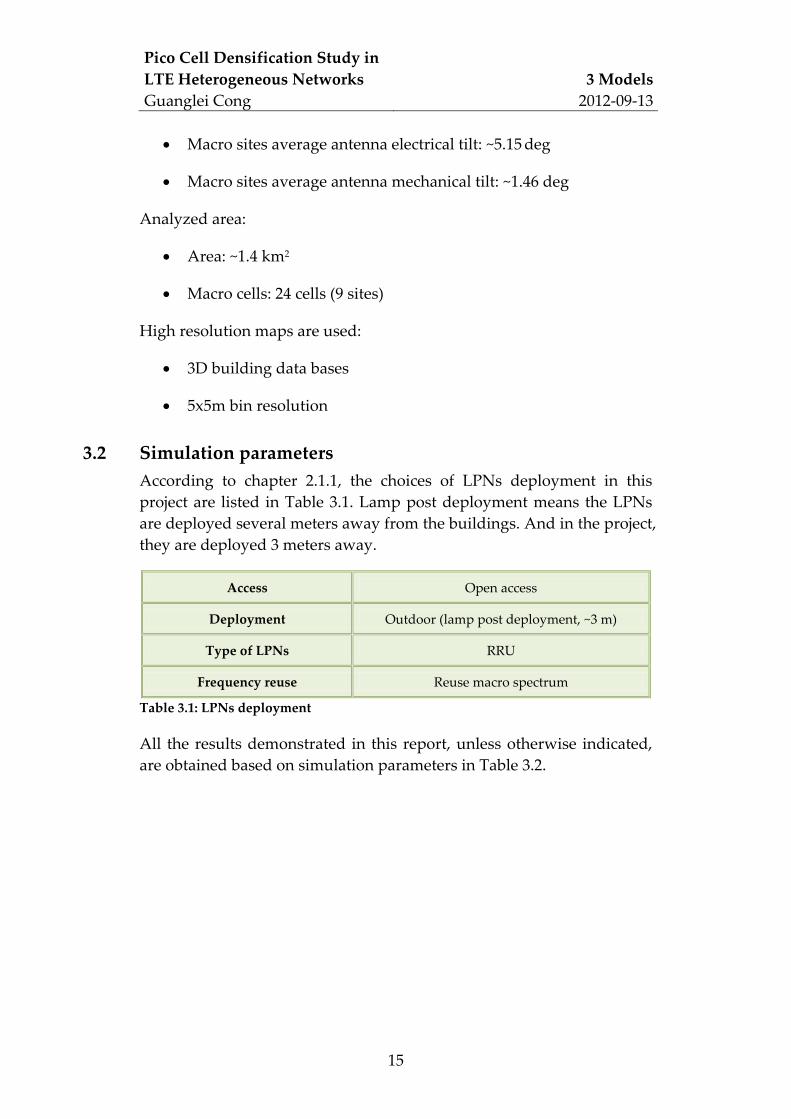
3.2 Simulation parameters According to chapter 2.1.1, the choices of LPNs deployment in this project are listed in Table 3.1. Lamp post deployment means the LPNs are deployed several meters away from the buildings. And in the project, they are deployed 3 meters away.
Access Open access
Deployment Outdoor (lamp post deployment, ~3 m)
Type of LPNs RRU
Frequency reuse Reuse macro spectrum
Table 3.1: LPNs deployment
All the results demonstrated in this report, unless otherwise indicated, are obtained based on simulation parameters in Table 3.2.
Pico Cell Densification Study in LTE Heterogeneous Networks Guanglei Cong
80% of the traffic is generated from indoor area (all buildings in the area), the rest 20% is distributed
outdoor
Utilization 1, 5, 10, 20, 30, 50, 70 , and 95 %
Packet traffic model Equal buffer model
Macro Sites
Output power 60 W
Average antenna height ~33 m
Average antenna gain ~16 dBi
Average antenna tilt ~5.15o (Electrical tilt)
~1.46o (Mechanical tilt)
Tx/Rx 2 Tx/2 Rx
Diversity combining Maximal Ratio Combining (MRC) in uplink
Pico Sites
Output power 5 W
Antenna height 5 m
Antenna gain 12 dBi
Antenna half power beam width (HPBW)
63o (Horizontal)
28o (Vertical)
Tx/Rx 2 Tx/2 Rx directional antenna
Diversity combining MRC in uplink
UE
Max output power 21 dBm
Min output power -40 dBm
Antenna height 1.5 m
Antenna gain -1 dBi
Tx/Rx 1 Tx/2 Rx omni antenna
Body loss 3 dB
Diversity combining Interference Rejection Combining (IRC) in downlink
Table 3.2: Simulation parameters
Pico Cell Densification Study in LTE Heterogeneous Networks Guanglei Cong
3 Models 2012-09-13
17
3.3 Propagation models
3.3.1 Urban model As addressed in Chapter 2.3.1, there are several propagation models which are implemented in TCP. Since this study will be taken in an urban environment, the urban model is the one which will be mainly used for pathloss analysis.
In an urban environment, radio wave propagation has two dominant paths which are over the rooftops and along the street. The first path dominants when the UE is far from the site, while the second path dominants when the UE is near to the site [15].
The urban model is valid under the following conditions [10][15]:
• Frequency from 450 MHz up to 2200 MHz;
• Receiving antenna at distance to the base station antenna from 0 m up to (at least) 50 km;
• Base station antenna heights between 5 m and 60 m and antennas placed below as well as above rooftops;
• Large receiving antenna height from 1.5 m up to 5 m.
The urban model consists of three wave propagation algorithms [15]:
• Half-screen model: calculates propagation above the rooftop and generates pathloss Labove;
• Recursive micro cell model: calculates propagation between buildings, i.e. along the street, and generates pathloss Lbelow;
• Building penetration model: calculates propagation from an out-door base station antenna to an indoor UE and generates pathloss Linside;
The urban model pathloss is expressed as:
),min( belowaboveurban LLL =
Pico Cell Densification Study in LTE Heterogeneous Networks Guanglei Cong
3 Models 2012-09-13
18
As mentioned before, the radio waves propagation has two dominant paths and the received signal strength is the sum of both. In most situa-tions, one of the paths will dominate, so Lurban which takes the minimum is justified [15].
The building penetration model pathloss is determined by [15]:
αswoutsideinside dLLL ++=
in which
Loutside is the pathloss from the base station antenna to a point just outside the external wall;
Lw is the penetration loss through the external wall;
ds is the distance inside building [m];
α is the building penetration slope [dB/m].
In this project, Lw=12 dB and α = 0.8 dB/m.
3.3.2 ITU indoor propagation model ITU (International Telecommunication Union) indoor propagation model estimates the pathloss of radio propagation in the indoor envi-ronments. This model is applicable to frequency from 0.9 up to 5.2 GHz and to buildings with 1 to 3 floors [8].
According to ITU indoor propagation model, the indoor propagation pathloss is [8]:
28)(loglog20 −++= nPdNfL findoor ,
in which,
f is the transmission frequency [MHz];
d is the transmission distance [m];
N is the distance power loss coefficient;
Pf(n) is the floor loss penetration factor;
n is the number of floors via transmission.
Pico Cell Densification Study in LTE Heterogeneous Networks Guanglei Cong
3 Models 2012-09-13
19
In this project, ITU indoor propagation model is applied in pico sites placement algorithm which will be addressed in chapter 4.2. It is just used for rough estimation of the pathloss from the newly added pico site. After pico cell placement is done, the pathloss will be calculated in TCP.
Since only rough estimation is needed, the floor loss penetration factor Pf(n) is ignored here. And the distance power loss coefficient N is chosen to be 28.
Taking into account of the exterior wall loss Lwall=12 since the pico sites will be placed outdoor, the total pathloss estimation can be expressed as:
16log28log20 −+=+= dfLLL wallindoor
Pico Cell Densification Study in LTE Heterogeneous Networks Guanglei Cong
The whole project process is organized as Figure 4.1:
1. Export Elin project of the original network with macro cells only from TCP;
2. Based on the Elin project, densify the network with new pico sites in Matlab using the pico sites densification algorithm which will be discussed in chapter 4.2. Network densification should be done with several pico cell densities;
3. Import the new pico sites to the original TCP project, run ACP to optimize the network and export Elin projects of the networks af-ter densification;
4. Run LTE Astrid for the networks with different pico cell densities;
5. Evaluate simulation results.
Pico Cell Densification Study in LTE Heterogeneous Networks Guanglei Cong
4 Implementation 2012-09-13
21
4.2 Pico sites densification algorithm As mentioned in chapter 1.4, how should the pico sites be deployed to achieve better network performance is of the interest of this project as well, a pico sites densification algorithm based on pathloss is designed.
Briefly speaking, the core of the algorithm is as following:
1. Find the indoor bins with worst pathloss;
2. Find the closest outside-wall bin;
3. Find an outdoor bin 3 meters away from this outside-wall bin (lamp post deployment);
4. Place the pico site in this outdoor bin and point the sector anten-na to the worst pathloss indoor bin.
The details about how the algorithm works are illustrated in Figure 4.2:
1. Find the worst pathloss indoor bin based on the first column of the g-matrix from the Elin project file exported from TCP;
2. Find the closest outside-wall bin to this indoor bin, then find an outdoor bin 3 meters away from this outside-wall bin;
3. Check if this outdoor bin fulfills the distance constrain predefined, minpico2pico: if not, redo the previous steps for the next worst pathloss indoor bin; if yes, continue;
4. Place a pico site in this outdoor bin and point the antenna to the worst pathloss indoor bin currently considered;
5. Calculate pathloss vector for the indoor bins within 100 meters to the new pico site;
6. Compare the new pathloss vector with the first column of previ-ous g-matrix and modify the pathloss values of the indoor bins covered by the new pico site;
7. Check if the picodense target is fulfilled: if not, redo the previous steps to find the next pico site position; if yes, stop searching.
Pico Cell Densification Study in LTE Heterogeneous Networks Guanglei Cong
4 Implementation 2012-09-13
22
Start
Find the worst pathloss
indoor bin
Find the closest outside-wall bin
Find the next worst pathloss
indoor bin
pico2pico>minpico2pico1
no
Place a pico in this outdoor bin
yes
Point the sector antenna to the worst pathloss indoor bin
Calculate pathloss for the indoor bins within 100 meters to the new
pico site2
Modify pathlossvalues of the indoor bins covered by the
pico site
End
1. minpico2pico: minimum distance between pico sites, a constraint to reduce interference between pico sites.
2. Pathloss calculated based on ITU indoor propagation model.
Figure 4.2: Flow chart of pathloss based pico sites densification algorithm
In this project, the parameter minpico2pico has been chosen to be 30 meters. This might not be a perfect choice. And the parameter picodense has been chosen to be 4, 8, 12, 16 and 20 in order to build network mod-els with different pico cell densities; an extreme case with picodense being 40 has also been studied.
In the following chapter, the network performance will be compared between the network where pico sites are placed using this pathloss
Pico Cell Densification Study in LTE Heterogeneous Networks Guanglei Cong
4 Implementation 2012-09-13
23
based algorithm and the network where pico sites are placed randomly. In the randomly distributed algorithm, the pico sites are also deployed outdoor (lamp post deployment), but the placement positions are ran-domly selected without the constraint of the parameter minpico2pico.
Pico Cell Densification Study in LTE Heterogeneous Networks Guanglei Cong
5 Results 2012-09-13
24
5 Results In this chapter, the results of pico sites densification will be shown followed by the simulation results for the network models with different pico cell densities.
5.1 Network densification Figure 5.1 and Figure 5.2 illustrates the densified networks: the results of the pathloss based pico sites densification algorithm are shown in Figure 5.1 while the results of randomly distributed algorithm are presented in Figure 5.2. Compare these two figures, it can be seen that some of the pico sites in Figure 5.2 are very close to each other since there is no constraint on the minimum distance between pico sites (minpico2pico) in the randomly distributed algorithm.
In Figure 5.1 and Figure 5.2, only network models with pico cell density up to 20 picos/macro are shown since the sites in the 40 picos/macro case are too dense and won’t be very clear to be shown on the map here.
Pico Cell Densification Study in LTE Heterogeneous Networks Guanglei Cong
5 Results 2012-09-13
25
Macro only 4 picos/macro cell
8 picos/macro cell 12 picos/macro cell
16 picos/macro cell 20 picos/macro cell
Figure 5.1: Densified networks using pathloss based pico sites densification algorithm (chapter 4.2)
Pico Cell Densification Study in LTE Heterogeneous Networks Guanglei Cong
Pico Cell Densification Study in LTE Heterogeneous Networks Guanglei Cong
5 Results 2012-09-13
27
Figure 5.3 shows the average cell density (per km2) and average ISD of the networks where pico sites are placed using the pathloss based algo-rithm, while Figure 5.4 shows the average cell density and ISD of the networks where pico sites are placed randomly. Here one extreme case with pico density to be 40 picos/macro is also illustrated. As shown in these two figures, the average cell density presents no large difference; however the ISD of the pathloss based algorithm is longer since there is a constraint on the minimum distance between pico sites (minpico2pico) in this algorithm.
0 4 8 12 16 20 400
100
200
300
400
500
600
700
18
74
129
191
251
303
579
Average cell number per km2
Pico cell density (picos/macro)
Ave
rage
cel
l num
ber [
/km
2 ]
0 4 8 12 16 20 400
50
100
150
200
250
300
350
305
110
8670
60 5538
Inter site distance [m]
Pico cell density (picos/macro)
ISD
[m]
Figure 5.3: Pathloss based pico sites densification algorithm
Pico Cell Densification Study in LTE Heterogeneous Networks Guanglei Cong
5 Results 2012-09-13
28
5.2 Comparison of Pico sites densification algorithms In order to choose a better pico sites densification algorithm for the main parts of this project, in this chapter the network performance is com-pared between the pathloss based algorithm and the random one.
Figure 5.5 and Figure 5.6 show the user performance (y-axis) versus capacity (x-axis) for both uplink and downlink. Two types of user per-formance measures are used: mean and 10% worst user throughput. In this project, the cell edge user throughput is defined as the 10th percen-tile of the user throughput in the analyzed area.
As illustrated in Figure 5.5, the two pico sites densification algorithms result in almost the same uplink performance for lower pico cell densi-ties, e.g., 4 picos/macro. That is to say, for low pico cell densities the uplink performance is mainly related to the number of cells in the net-work rather than the position of cells. However for higher pico cell densities, e.g. 20 picos/macro, the pathloss based algorithm performs better than the random one according to Figure 5.5. As a conclusion, for the uplink, the advantage of the pathloss based algorithm compared
Pico Cell Densification Study in LTE Heterogeneous Networks Guanglei Cong
5 Results 2012-09-13
29
with the random one becomes clearer for higher pico cell densities. The difference between the algorithms increases with pico cell density.
Figure 5.6 illustrates the downlink performance comparison. It is obvi-ous that the pathloss based algorithm results in better performance than the random one on the downlink.
Pico Cell Densification Study in LTE Heterogeneous Networks Guanglei Cong
5 Results 2012-09-13
30
5.3 Comparison of RSRP and Biased RSRP According to the results in chapter 5.2, the pathloss based pico sites densification algorithm will be chosen for the following simulation and discussion.
As shown in Figure 5.7 and Figure 5.8, biased RSRP cell selection with 4dB offset presents a better improvement than RSRP based cell selection on both uplink and downlink performance. But according to some previous studies, biased RSRP cell selection with higher offset will degrade the downlink performance.
5.4 Network Performance Based on the comparisons in chapter 5.2 and 5.3, the following simula-tion results are obtained from the network models where pico sites are placed using the pathloss based algorithm, and biased RSRP cell selec-tion with 4dB offset has been applied during the simulation.
In this chapter, the uplink and downlink performance for the indoor and outdoor users will be analyzed separately.
Pico Cell Densification Study in LTE Heterogeneous Networks Guanglei Cong
5 Results 2012-09-13
32
5.4.1 Capacity and Coverage As illustrated in Figure 5.9 and Figure 5.10, for the uplink, with the same target of mean user throughput or the same target of cell edge user throughput, the subscriber capacity keeps increasing with pico cell densification.
Figure 5.10: Uplink cell edge user throughput vs uplink subscriber capacity
Figure 5.11 illustrates one example of the improvement of uplink capac-ity: with the same target of 1 Mbps uplink cell edge user throughput, uplink capacity improves with pico cell densification. For the network with pico cell density less than 4 picos/macro, the cell edge throughput can never reach 1 Mbps, thus the capacity is shown to be 0.
Pico Cell Densification Study in LTE Heterogeneous Networks Guanglei Cong
From Figure 5.10, it is also possible to see that with the same target of uplink capacity, the cell edge user throughput grows with densification, that is to say the uplink coverage of the network has been improved. An example is shown in Figure 5.12 with a target of 3.1 GB/month/subscriber uplink capacity, the improvement of cell edge user throughput is significant especially for the indoor users which presents an exponential growth manner. For the uplink, pico cell densi-fication benefits the indoor users much more than the outdoor users from the coverage point of view.
Pico Cell Densification Study in LTE Heterogeneous Networks Guanglei Cong
5Uplink all area, Capacity=3.1GB/month/subscriber, RSRP+4dB offset
Pico cell density (picos/macro)
Cel
l edg
e th
roug
hput
[Mbp
s]
Figure 5.12: Improvement of uplink coverage
According to Figure 5.13 and Figure 5.14, the same result with the uplink can be drawn for the downlink. Compare Figure 5.15 with Figure 5.11 and Figure 5.16 with Figure 5.12, the enhancement of the downlink capacity and coverage from pico cell densification is not as significant as the uplink capacity and coverage. Furthermore, the capacity in Figure 5.15 seems to increase linearly; and the increase of cell edge user throughput in Figure 5.16 slows down with higher pico cell densities which indicates an upper limit.
Pico Cell Densification Study in LTE Heterogeneous Networks Guanglei Cong
40Downlink all area, Capacity=7.8GB/month/subscriber, RSRP+4dB offset
Pico cell density (picos/macro)
Cel
l edg
e th
roug
hput
[Mbp
s]
Figure 5.16: Improvement of downlink coverage
5.4.2 User throughput From Figure 5.9 and Figure 5.10, it can be seen that both indoor and outdoor users’ uplink throughput is improved when more pico cells are added to the network.
With the same target of 3.1 GB/month/subscriber uplink capacity, the uplink user throughput maps for the networks with different pico cell densities are shown in Figure 5.17. As can be seen, there is some notice-able improvement from the original case to the 4 and 8 picos/macro cases; after that, the throughput improvement is not very clear accord-ing to the throughput maps.
Pico Cell Densification Study in LTE Heterogeneous Networks Guanglei Cong
Figure 5.18 illustrates the average uplink user throughput within the analyzed area. It can be seen that, the gain for indoor users in general is larger than for outdoor users.
Pico Cell Densification Study in LTE Heterogeneous Networks Guanglei Cong
5 Results 2012-09-13
40
0 4 8 12 16 200
5
10
15
20
25
30
35Uplink all area, Capacity=3.1GB/month/subscriber, RSRP+4dB offset
Figure 5.18: Improvement of uplink mean user throughput
From Figure 5.13 and Figure 5.14, it can be seen that both indoor and outdoor users’ downlink throughput is improved when more pico cells are added to the network.
Figure 5.19 shows the downlink user throughput maps with the same target of 7.8 GB/month/subscriber downlink capacity. It is obvious that the improvement is significant from the reference case to the 4 pi-cos/macro case. This dramatic increase of mean user throughput can also be noticed in Figure 5.20. After 4 picos/macro, the enhancement is not so noticeable. As illustrated in Figure 5.21, the downlink geometry keeps being strengthened with the increase of pico cell density, but the increase slows down with higher density.
Pico Cell Densification Study in LTE Heterogeneous Networks Guanglei Cong
Pico Cell Densification Study in LTE Heterogeneous Networks Guanglei Cong
5 Results 2012-09-13
43
5.4.3 An extreme case In order to answer the question in chapter 1.4: Is there any upper limit on how many pico cells can be added to a dense urban macro network and still improves the network performance? An extreme network model with 40 picos/macro has been investigated, both the pathloss based pico sites densification algorithm and the randomly distributed algorithm have been studied; the results are shown in Figure 5.22 and Figure 5.23.
As can been seen from the figures, for both the two algorithms, the network keeps performing better with higher pico cell density up to 40 picos/macro. Figure 5.22 also confirms the result in chapter 5.2 which is for the uplink the pathloss based algorithm performs better than the random one for higher pico cell densities. The difference between the algorithms increases with pico cell density.
Figure 5.24 illustrates the average uplink utilization of pico and macro cells separately with the same target of 1 Mbps uplink cell edge user throughput; while Figure 5.25 illustrates the average downlink utiliza-tion of pico and macro cells separately with the same target of 10 Mbps downlink cell edge user throughput.
From these two figures, it can be seen that with the target of 1 Mbps uplink and 10 Mbps downlink cell edge user throughput, even for the densest network model with 40 picos/macro, the average utilization of pico and macro cells is below 50%. The probability of interference will hence be rather low. Also, pico cells have much lower utilization than macro cell since each pico cell covers smaller area. In the figures, the capacity is not the same for each case since the pico cell densities are different and the cell edge user throughput is kept the same.
Pico Cell Densification Study in LTE Heterogeneous Networks Guanglei Cong
Figure 5.25: Average downlink utilization of pico and macro cells with the target of 10 Mbps downlink cell edge user throughput
5.5 Comparison of pico and macro cells served area In order to see the level of pico cell densification in this project, Figure 5.26 shows the pico cells served area (green area) and the macro cells served area (red area) separately; Figure 5.27 compares these two areas. As can be seen from Figure 5.26 ad Figure 5.27, with an extensive num-ber of pico cells, the macro cells will cover diminishing area. And for the 40 picos/macro case, the macro cells will run mostly idle since they cover really small fraction of the area. This is definitely not realistic in real networks, but this indicates that the study has reached an extreme level with very high pico cell density but the network performance still seems to keep being improved.
Pico Cell Densification Study in LTE Heterogeneous Networks Guanglei Cong
5 Results 2012-09-13
46
4 picos/macro cell 8 picos/macro cell
12 picos/macro cell 16 picos/macro cell
20 picos/macro cell 40 picos/macro cell
Pico cells Macro cells
Figure 5.26: Pico and Macro cells served area
Pico Cell Densification Study in LTE Heterogeneous Networks Guanglei Cong
5 Results 2012-09-13
47
0 4 8 12 16 20 400
5
10
15
20
25
00.91307
1.84873.0512
4.5243
6.5064
22.9016
Pico to macro served area ratio, RSRP+4dB offset
Pico cell density (picos/macro)
Pic
o to
mac
ro s
erve
d ar
ea ra
tio
0 4 8 12 16 20 400
2
4
6
8
10
12
14x 10
5 Pico cells served area [m2], RSRP+4dB offset
Pico cell density (picos/macro)
Pic
o ce
lls s
erve
d ar
ea [k
m2 ]
0 4 8 12 16 20 400
2
4
6
8
10
12
14x 10
5 Macro cells served area [m2], RSRP+4dB offset
Pico cell density (picos/macro)
Mac
ro c
ells
ser
ved
area
[km
2 ]
Figure 5.27: Comparison of Pico and Macro cells served area
Pico Cell Densification Study in LTE Heterogeneous Networks Guanglei Cong
6 Conclusions 2012-09-13
48
6 Conclusions This thesis analyzes the impact of pico cell densification on the network performance in LTE HetNets. Pico cell densification up to around 600 cell/km2 has been investigated. The pico sites densification algorithm based on pathloss has been proved to perform better than the randomly distributed algorithm especially for the downlink, while for the uplink the pathloss based algorithm performs better with higher pico cell density. The main simulation results indicate that:
• Both the network capacity and coverage have been continuously enhanced by introducing more pico cells to the network. From coverage point of view, with the same capacity target, the uplink cell edge user throughput increases dramatically especially for the indoor users which presents an exponential growth manner.
• With the same capacity target, the average user throughput in the analyzed area keeps being improved with pico cell densification, but the improvement slows down with higher pico cell density.
• Generally speaking, the pico sites densification benefits the up-link performance more than the downlink performance and bene-fits the indoor users more than the outdoor users.
• After reaching an unrealistic case with extremely high pico cell density, the network performance still keeps increasing. However, except for the uplink capacity and coverage, the results indicate a trend that the performance enhancement slows down with more and more pico cells added.
The study has been taken based on a real radio network in a limited urban area in a dense European city. The results might vary for different area and cities due to different terrain features and macro sites deploy-ment, so the results might be valid only for this study.
Due to the constraints of TCP, the pico sites in this project have all been deployed outdoor. The indoor deployment is also of interest since the interference between macro and pico layers will be reduced.
Pico Cell Densification Study in LTE Heterogeneous Networks Guanglei Cong
References 2012-09-13
49
References [1] Cisco, “Cisco Visual Networking Index: Forecast and Methodolo-