Austin Energy Austin, TX July 26-27, 2017 Plant Management, Engineering & Operations Conference and Roundtable Instructed by: Elliot Hunt, Production Operations Engineer, Omaha Public Power District Jon S. Cavote, President/COO, United Dynamics “AT” Corporation Kandi Forte, Director, Asset Management Services, Black & Veatch Ed Seal, Director, Design Engineer & Projects, Arizona Public Service Mike Preston, Industrial Water Treating Section Leader, Black & Veatch Michael Enger, Interim - Energy Market Manager, Austin Energy Craig Schaub, Control Engineering Manager, Austin Energy Richard DIllon, Director, Market Policy, Southwest Power Pool Mike Ducker, Director, Market Analysis, Mitsubishi Hitachi Power Systems Americas, Inc. John Wester, Energy Market Manager, Austin Energy Brian Foley, Director, Sales, PowerPhase Edward Woods, Territory Sales Manager, Distributed LNG Solutions, Siemens RMEL ~ 6855 S. Havana, Ste 430 ~ Centennial, CO 80112 ~ (303) 865-5544 ~ FAX: (303) 865-5548 ~ www.RMEL.org
Transcript
Austin EnergyAustin, TX
July 26-27, 2017
Plant Management, Engineering & Operations Conference and Roundtable
Instructed by:Elliot Hunt, Production Operations Engineer, Omaha Public Power District
Jon S. Cavote, President/COO, United Dynamics “AT” Corporation Kandi Forte, Director, Asset Management Services, Black & Veatch
Ed Seal, Director, Design Engineer & Projects, Arizona Public Service Mike Preston, Industrial Water Treating Section Leader, Black & Veatch
Michael Enger, Interim - Energy Market Manager, Austin Energy Craig Schaub, Control Engineering Manager, Austin Energy
Richard DIllon, Director, Market Policy, Southwest Power Pool Mike Ducker, Director, Market Analysis, Mitsubishi Hitachi Power Systems Americas, Inc.
John Wester, Energy Market Manager, Austin Energy Brian Foley, Director, Sales, PowerPhase
Edward Woods, Territory Sales Manager, Distributed LNG Solutions, Siemens
RMEL ~ 6855 S. Havana, Ste 430 ~ Centennial, CO 80112 ~ (303) 865-5544 ~ FAX: (303) 865-5548 ~ www.RMEL.org
Wednesday, July 26, 20178:00 a.m. – 9:00 a.m.Panel: Maintaining and Operating Equipment with Pending Shutdown in 5-10 yearsElliot Hunt, Omaha Public Power DistrictJon S Cavote, President/COO, United Dynamics “AT” CorporationKandi Forte, Director Asset Management Services, Black & Veatch
9:00 a.m. – 9:45 a.m.Workforce Management during the Uncertain Future of Coal Fired UnitsEd Seal, Director, Design Engineer & Projects, Arizona Public ServiceWill discuss real world scenario on the approach and actions taken at Cholla Power Plant when given direction and free rein to make the plant as cost ef-fective as possible, without compromising safety or environmental stewardship. Will discuss methodology used to achieve worker’s engagement, maintain leadership’s attention, and ultimately rethink daily op-erations given the reality of economic shutdowns. When a coal plant is no longer a base loaded unit, how is maintenance planned and executed, training of new personnel completed, opera-tor proficiency maintained.
9:45 a.m. - 10:00 a.m.Networking Break
10:00 a.m. - 10:45 a.m.ELG Compliance OptionsMike Preston, Industrial Water Treating Section Leader, Black & VeatchELG compliance has become an intense focus for many
coal fired power stations. The range of solutions has been expanding as utilities seek cost effective solutions. We will review a range of solutions and offer some high level cost expectations depending on the extent of treatment.
10:45 a.m. - 11:45 a.m.Austin Energy Generation Overview (Successes & Challenges)Michael Enger, Interim – Energy Market Manager, Austin EnergyThe presentation provides a brief history of the evolu-tion of the ERCOT market. Now a nodal market, the presentation looks into how the nodal market operates, including the settlement and scheduling of genera-tion and renewable assets as well as load. After the basic constructs of the nodal market have been outlined the presentation moves to an overview of Austin Energy’s generation assets and policy driven goals. The presentation will talk about successes in regards to moving towards achiev-ing those goals while also discussing the challenges of each generation type within the ERCOT nodal market and what tools/instruments are available to help address those challenges.
11:45 a.m. – 12:45 p.m.Networking Lunch
12:45 p.m. - 2:45 p.m.Roundtable (Starter Top-ics: Managing Workforce and Impact of Cycling Coal Plants)Roundtables offer a unique forum for peer-to-peer shar-ing of experiences, critical issues and expertise. The roundtable is a discussion group, open only to RMEL members. Discussion is
based on topics brought by attendees. Roundtables are focused on the open discus-sion period and provide each attendee the oppor-tunity for participation and dialogue on their particular issue. Roundtables are held in conjunction with a conference and many topics presented at the conference are discussed further in the roundtable setting. The roundtable is a good oppor-tunity to share experiences, troubleshoot problems and network with peers in a smaller, informal setting. Each participant is offered a chance to pose questions and share information. All attendees are encouraged to bring issues for discussion and materials for sharing.
3:00 p.m. - 4:00 p.m.Austin Energy’s System Control Center (SCC) TourCraig Schaub, Control Engineering Manager, Austin Energy This is a guided tour of Aus-tin Energy’s Control Center. From an observation room overlooking the Control Room, participants will be given a brief explanation of the System Controllers’ mis-sion and a description of the technologies applied. Austin Energy commissioned this control room in early 2013, employing state-of-the-art technologies.
Thursday, July 27, 20178:00 a.m. – 9:00 a.m.Panel: Operating Optimization of Plant for Energy Market you are In
Market Dispatch and Plant Optimization can be CoordinatedPanelist #1: Richard Dillon, Director, Market Policy,
CONFERENCE AgENdASouthwest Power PoolInputs to the market offer can help or hurt a genera-tor’s ability to operate op-timally. This discussion will increase awareness of how a market offer impacts the generator operations.
Economic and Operational Benefits of Improved CCGT TurndownPanelist #2: Mike Ducker, Director, Market Analysis, Mitsubishi Hitachi Power Systems Americas, Inc.Today’s utilities and markets are seeing an ever-increasing penetration of variable renewable energy resources. The existing grid system is being tasked with integrating these resources without jeopardizing reli-ability while still maintain-ing affordable electric rates. As a result, new and exist-ing dispatchable generation resources are considering technology improvements to further accommodate this market trend while maintaining their own positive operability outlook and financial health. One such improvement is the technology evolution of combined cycle gas turbine (CCGT) turndown. As new and existing resources are upgraded to improve their minimum emissions compliance load, positive outcomes are realized for both the individual plant as well as the grid system. At the plant level, these include lower O&M costs, decreased fuel costs, increased revenues and profitability, and increased operating hours. At the system level, these benefits include lower overall system costs, reduced emissions, and an improved outlook on the integration of vari-able energy resources. This presentation will seek to provide attendees with
Thank You RMEL Generation Committee
CHAIRJeff Karloff
Division Manager, Production Engineering & FuelsOmaha Public Power District
VICE CHAIRCurt Brown
Associate Vice President, Retrofit and Plant Betterment, Power Generation Services
Black & Veatch Corp.
David ArandaNewman Plant Manager
El Paso Electric Company
Ben CluffArizona Public ServiceEngineering Manager
Matt FergusonVP, Power & Energy Section Manager
HDR, Inc.
Richard ThreetDirector, Power Generation
PNM Resources
Kellen WaltersRegional Sales Director
Mitsubishi Hitachi Power Systems Americas, Inc.
John WesterDirector, Project and Asset Management, Power
ProductionAustin Energy
Tom WosRegulatory Program Administrator
Tri-State Generation and Transmission Assn.
The RMEL Generation Committee plans all RMEL Generation events. If you’d like to send
information to the committee, email James Sakamoto at [email protected].
updates on the key market changes influencing these CCGT flexibility improve-ments, an overview of the improvements, and how plant-level and system-level optimizations can realize the benefits of these new advancements.
Austin Energy Generation – Operating in the ERCOT MarketPanelist #3: John Wester, Director, Project and Asset Management, Power Production, Austin EnergyAustin Energy, a munici-pally owned electric utility, operates in the ERCOT nodal market. Even though Austin Energy has elected to remain a regulated and vertically integrated utility, the market design requires our generation assets to participate in the deregu-lated wholesale market. This presents a number of operational challenges which will be identified along with lessons learned to date and strategies we have employed to address these challenges.
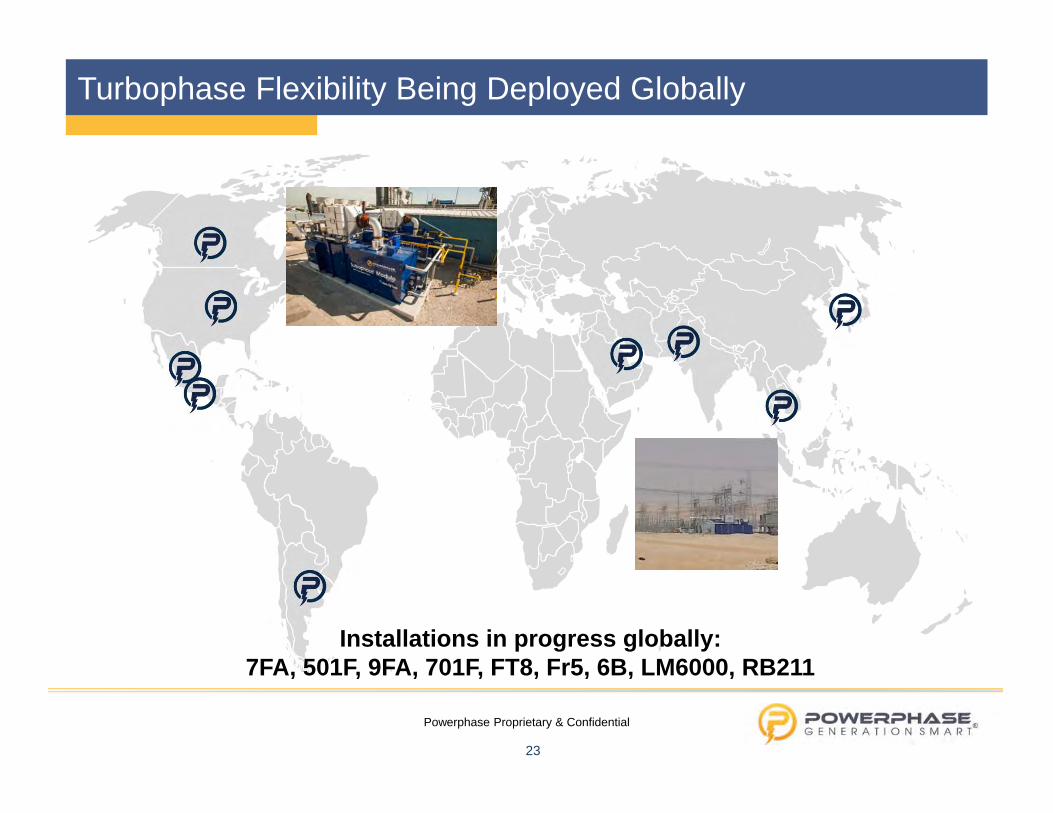
9:00 a.m. – 9:45 a.m.Turbophase Dry Air Injection – Fast Ramp Power for Peak Power and Renewables FirmingBrian Foley, Director, Sales, PowerPhaseRenewable Energy Firming has become an increasing important issue as solar and wind generation continue to grow as part of the gen-eration portfolios across the United States. There are a number of compet-ing technologies that can provide this firming service, including reciprocating engines, small gas turbines and new technologies such as Turbophase.
This presentation will explore the pros/cons of various
renewable firming technolo-gies, looking at the financial and technical benefits for each choice. Case studies for ERCOT and PJM will be presented.
9:45 a.m. - 10:00 a.m.Networking Break
10:00 a.m. - 10:45 a.m.LNG Infrastructure – Distributed LiquefactionEdward Woods, Territory Sales Manager, Distributed LNG Solutions, Dresser-Rand Company, A Siemens BusinessThe point-of-use, micro-scale LNG production plant is a standardized product made up of packaged modules that work together to offer a decentralized, distributed approach to meet the growing demand for LNG supply. This presentation will cover the technology included with the LNGo micro liquefaction system, the distributed LNG value chain and how the distributed LNG model promote the growth of LNG as a clean fuel for multiple markets.
10:45 a.m. - NoonRoundtable (Starter Topic: Base Load to Peak Load)
Noon - 1:30 p.m.Grab & Go Lunch and Transportation to ERCOT Tour
PLANT MANAGEMENT, ENGINEERING AND OPERATIONS CONFERENCE, ROUND TABLE AND PLANT TOUR
Meeting the Challenges of Market Transition
PANEL: Maintaining and Operating Equipment with Pending Shutdown in 5-10 years
Elliot Hunt Production Operations Engineer
Omaha Public Power District
Kandi Forte Director, Asset Management Services
Black & Veatch
Jon S. Cavote President/COO
United Dynamics “AT” Corporation
PANEL: Maintaining and Operating Equipment with Pending Shutdown in 5-10 years
Elliot Hunt Production Operations Engineer
Omaha Public Power District
Maintaining High Reliability at Stations Nearing Retirement
Elliot HuntProduction Operations EngineerOmaha Public Power District
• Introduction to OPPD• OPPD’s reliability goal• Background on North Omaha Station• Action items to improve reliability• Results• Questions
Maintaining High Reliability at Stations Nearing Retirement
OPPD’s Reliability Goal• 90% equivalent availability factor (EAF) on
a three year rolling average basis• 4 Coal burning units.
– Nebraska City Station Units 1 & 2 with capacity of 1,347 MW
– North Omaha Station Units 4 & 5 with capacity of 317 MW / 557 MW
• Five PRB coal burning steam generators built from 1954 -1968
• Coal burning capabilities were decommissioned for Unit 1, 2, and 3 in 2016
• Unit 4 and 5 slated to convert to natural gas in 2023• OPPD still depends on North Omaha Station (NOS) for
capacity and high reliability.
North Omaha Station
June 17, 2017
• North Omaha served for many years as OPPD’s main baseload generator and in recent years has shifted to a more flexible load follower.
• This has required adapting to allow:– Lower loads– Higher loads on AGC– Increased reserve shutdowns
• Simultaneously the plant undergoes:– Decreasing staff– Pressure on maintenance budget– Additional emissions equipment and
consumables • All of these changes challenge plant
reliability.
• Formed team responsible for progress towards EAF goal.• Employee reliability mentality • Condition based maintenance• Detailed outage scheduling analysis• Encourage out of the box problem solving• Implement economically justified projects• Adopt new lean methodologies• Plan around known bad actors• Always keep safety a priority
Actions
• Comprised of div. managers, plant managers, maintenance superintendents, engineering, and energy marketing.
• Tasked with meeting corporate EAF goal.• Reviews all events to confirm follow-up action plan and owner.• Focused on reliability rather than maintenance.• Discusses current or future risks.• Evaluates need or benefit from outside help.• Increases information flow between plants.• Developed and updates Reliability Dashboard and
Top 10 Lists
Formed GREAT(Generation Reliability Evaluation and Analysis Team)
• Goal: Energy production employees aware of EAF target and their ability to move the needle.
• Ways to increase employee focus on reliability.– Post Dashboard and Top 10 Lists– Monthly review of top 10 lists– Demonstrate importance by steady progress on
reliability impacting projects.– Share lost opportunity costs.
Employee Mentality
• Transition to condition based maintenance is not new at NOS.
• Pressure on O&M budget has pushed NOS to fully adopt CBM strategy.
• Examples:– Unit 4 condensate pump– 2017 mini outage scope
Condition Based Maintenance
Outage Scheduling and Planning• Historically:
– Standard outage frequency – Minimizing outage duration– Maximizing PM completion rate
• Recent changes:– NOS revisits duration evaluation as outage approaches using expected value of lost generation,
overtime cost, and scope.– In some cases this may increase EAF but is economical for the station.– Allocating resources sparingly
• Current effort to evaluate outage schedule involves:– Bottom up review - all outage work orders and PM’s evaluated to determine optimal frequency– Top down review -
• Possible schedules are evaluated with major outage jobs included• This method attempts to lengthen outage frequency and improve EAF
Outage Schedule Spreadsheet
Out of the Box Problem Solving• Magnetic drives
– Some drives replaced years ago but cannot justify replacement of remaining drives– Overhaul task review– Lock nut repairs
• Mill hydraulics– Frequent leaks and lengthy troubleshooting process – New valves installed to speed troubleshooting process
• Boiler feed pump fluid drive– Identified vibration that poses risk to 50% of unit load. – Purchasing refurbished rotating element
• Primary air fan repairs and balancing– Unit 5 was available to run at ~2/3 load after temporary duct blank installed while repair
work completed on fan wheel and housing
Out of the Box Problem Solving• Balancing act • Something between full replacement /
rebuild and:
Justify New Projects• NOS installed vibration monitoring system on
critical plant equipment in 2016. – Basic continuous vibration monitoring on 35
machine trains.– Allowed for better CBM information and led to
more informed decisions.– Improved machine protection – Station has already benefitted from timely shut
down of operating machines.
Justify New Projects• Online blowout method for Unit 4 magnetic drives.
– Compressed air routed to each side of 6 remaining regular service magnetic drives
– Regular frequency blowdown of magnetic drive to reduce dust build-up
• Mill table seals– Unit 5 mills have long term problem with mill table
seals– New style of table seal is in trial and will replace old
style completely if satisfactory
Adopt New initiatives• OPPD 2017 Lean Fossil effort introduced new
methodologies• Idea Generation Sessions(IGS), Swarm
meetings• Root cause analysis
• craft involvement• standard procedure• verify results
Plan Around Bad Actors• As retirement horizon approaches, more problem
areas will be identified that cannot be eliminated.• Develop plans to mitigate the outages or derates
caused by identified area. – Unit 4 throttle pressure reduced by ~20% to prevent
low temp super heater boiler tube leaks• No MW impact at normal operating load
– Nebraska City Unit 1 slope tube leaks• Long term struggle to reduce slag fall but have
developed methods to repair leaks quickly
Results• Unit 4
– 7 year average EAF 88.1%– 7 year average EFOR 5.9%
• Unit 5– 7 year average EAF 79.7%– 7 year average EFOR 14.8%
PANEL: Maintaining and Operating Equipment with Pending Shutdown in 5-10 years
Jon Cavote President/COO
United Dynamics Corporation
The Name Behind The Flame
“Begin With a Plan, Execute , End with Resolve”
Jon S Cavote
2681 Coral Ridge Road
Brooks, KY 40109
502.957.7525 Tel
502.957.5441 Fax
Serving the Power Industry Since 1979
United Dynamics AT Corporation
“Commonalities between utilities facing unit shut down
and gas conversion.”
The key is to focus on recommendations that will improve existing coal-fired power plants' reliability and availability to eliminate or reduce forced outages and extend the time between planned maintenance outages. Achieving this goal, understanding an upcoming shut down or off line date being immanent is the common challenge for many utilities across the country.
"Do More with Less" corporate environments.
Maintenance projects are typically driven by unrealistic time constraints and typically delivered late.
Data, and the trends found & realized within data, paint a vital picture. Decisions on pressure part component repairs are varying based on future unit shut down projections.
A Risk Driven Project contains all the planning elements of traditional planning approaches, a focus on detailed analysis of risk events and classification of risk events as critical risks events or non-critical risk events. Instead of the work flow or logic of a project considering only time and resource constraints, the Risk Driven Project highlights the highest priority events and utilizes a pre conceived plan to monitor and control these critical risk events
Once projects are selected and planning is ready to start, key Risk Driven Project objectives are:
Establishment of Unacceptable and Acceptable Project priority constraints by senior management based on remainder of time before shutdown vs. no shutdown.
Consideration of inspection risk events, chains of risk events and risk responses in structuring the planning, execution, control & evaluation, and termination of repair items based on criteria.
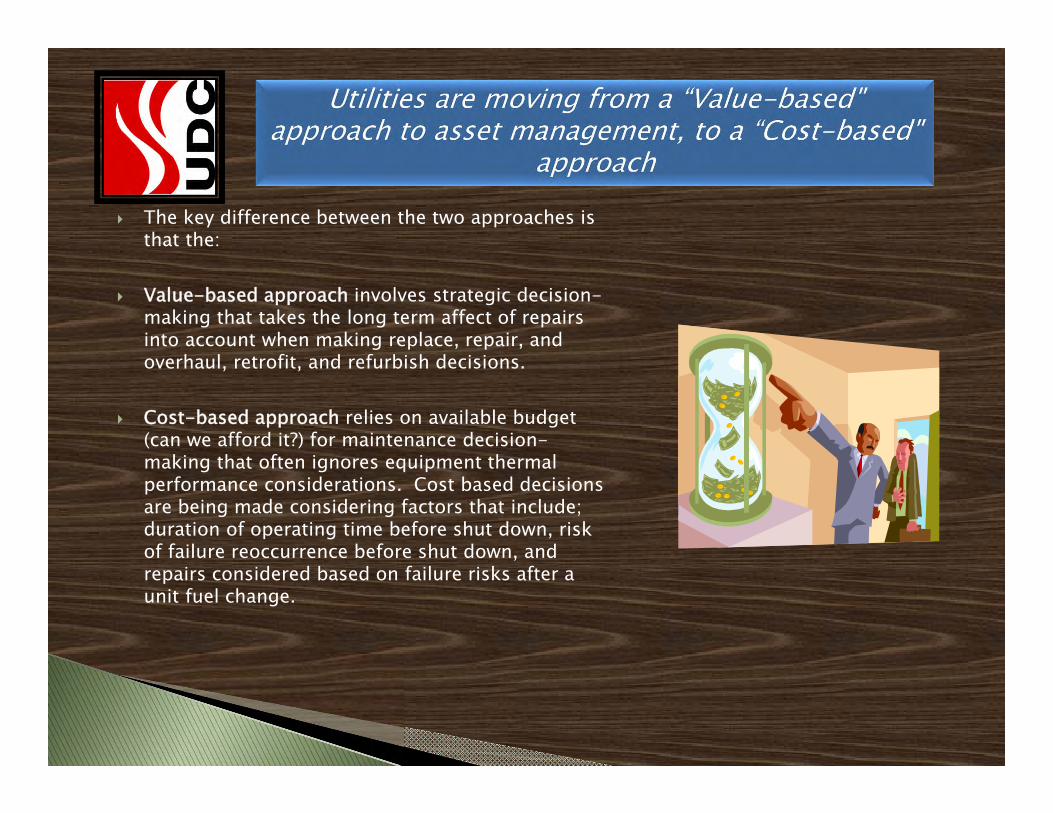
The key difference between the two approaches is that the:
Value-based approach involves strategic decision-making that takes the long term affect of repairs into account when making replace, repair, and overhaul, retrofit, and refurbish decisions.
Cost-based approach relies on available budget (can we afford it?) for maintenance decision-making that often ignores equipment thermal performance considerations. Cost based decisions are being made considering factors that include; duration of operating time before shut down, risk of failure reoccurrence before shut down, and repairs considered based on failure risks after a unit fuel change.
Gather data Determine goals based on budget,
time frame, and shut down or gas conversion dates.
Establish schedule requirements and constraints
Establish an outage tracking system to track daily progress
Work together on outage scope development
Hold routine meetings throughout overhaul attended by outage management, inspection, QAQC, scaffolding, and Craft foreman.
Track daily progress on scope items and completion.
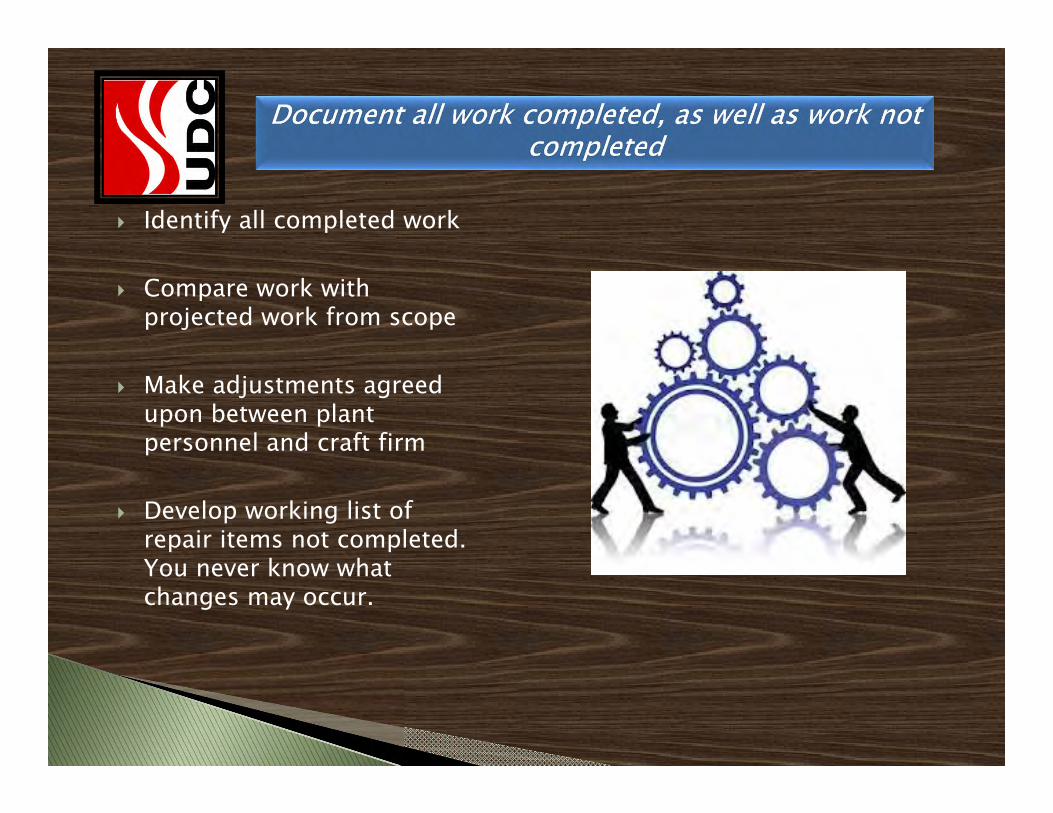
Identify all completed work
Compare work with projected work from scope
Make adjustments agreed upon between plant personnel and craft firm
Develop working list of repair items not completed. You never know what changes may occur.
Questions!!
Thank You
2681 Coral Ridge Road
Brooks, KY 40109
502.957.7525 Tel
502.957.5441 Fax
Serving the Power Industry Since 1979
United Dynamics AT Corporation
PANEL: Maintaining and Operating Equipment with Pending Shutdown in 5-10 years
Kandi Forte Director, Asset Management Services
Black & Veatch
Workforce Management during the Uncertain Future of Coal Fired
Units
Ed Seal Director, Design Engineer & Projects
Arizona Public Service
Workforce Management during the Uncertain Future of Coal Fired Units
Ed SealDirector, Design Engineer & ProjectsArizona Public Service
Goal: Create a New Cholla
2
Problem statement:How to man and operate Cholla as a three unit, peaking coal plant, with one unit online for voltage control?- This was modified to three unit peaking coal plant October-May,
base loaded (at reduced load) for summer run (June-September),with one unit online for voltage control.
Old Cholla:• 4 coal fired units, built 1961 – 1978
• One unit decommissioned in Oct 2015, decom activities into Spring 2016 (air gap vice removal)
• One unit wholly owned by Pacific Corporation• Base loaded 24/7• Coal delivered by rail• Located northern Arizona – Joseph City, AZ• Union workforce – Operations and Maintenance• Three Control Rooms• Maintenance Modifications Contractor (MMC) support
Method• Formed small group, consisting of all Managers (Production,
Operations, Maintenance, Planning, Engineering) and select forward thinkers. Total team of 13, including two Union Stewards.
• Initial meeting was to brainstorm items to further investigate.• Grouped items into areas
– Training and Manning– PMs and work actually being done– Supply Chain– Outside Services– Long range planning, LRF– Plant Operating characteristics
• List socialized with Plant personnel via Managers/Supervisors.• Assigned areas to team members, tasked with discussing ideas
with their team and returning with suggested action items.• Developed action items within each area (over 50 total
initially)• Weekly meetings for first month, 2-3 hours per meeting
3
Sample actions
Review of top ten material conditions
Top 10 Material Conditions may not all be issues that Cholla needs to support based on being a peaking instead of base load running plant.
Evaluate material condition list and determine if the issues are long term issues or short term issues and if Cholla needs to do to support the plant for time we will run.
ALREADY Reviewed by Maintenance Supervisors & Engineering
We need to get the right corrective maintenance work orders in the schedules, too often WO's are sent from CAR Screening to Engineering or Planning that are nice to do work.
ACTION: Institute better screening of pri. 4 WO's to determine nice to do vs need to do instead of sending WO on to ENG and/or Planning. This review should be outside of CAR SCRG MTG, review WO's from week prior. CompleteACTION:Set meeting notice for review of last 7 days of WO's to determine the following: EI, Mech, hrs, description, Need/Want/Question. Attendance: Planners, WWC, Maint. Sup, SS's CompleteACTION:Set expectations SS Reviews Complete
CHQ costs to Cholla(FTEs)There is a CH cost associated with corporate affiliated positions that needs to be evaluated to determine potential way to save.
Action: Determine cost for CHQ (CFAL's support, 2016 new job plan initiative w/ contractor, etc..) to determine if changes can be made to support Cholla savings (I.E. travel to Cholla vs audio/visual, engaging CH employees to perform assessments/audits, allowing CH to maintain Job plan development static, etc…).
Plant Manager to request information
Note: The 2016 initiative to change fleet job plans to a standardized method will cause CH to change all current Job plan's as CH built tasks in Maximo long ago that support job plan development.
Knowledge transfer of Gas and Oil Plants
Gas and Oil plants have knowledge pertaining to how the G/O plants ran to support peaking plant operation effectively that needs to be shared with CH. Benchmarking needed to ensure knowledge transfer.
Benchmark G/O plants to determine how they were sucessful in being peaking plants (Operations, Maintenance, Planning, Engineeering) 4
Manning dynamics
• Retirement (near term)– Operations = 2, including one Shift Supervisor (SS)– Maintenance = 3– Planning = 1
• Transferring (immediate)– Operations = 2
• Flight risk (estimates)– Operations = 3, including one SS– Maintenance = 3
• CO requirement will reduce by five once U1 Control room relocated
5
Workforce utilization
• Operations utilization when one unit operating– Training (Fire Brigade, cycle, OJT, Control Operator
intensive include on simulator) – Housekeeping– Support Supply Chain in the warehouse when needed – Augment maintenance crews during outages and scheduled
work weeks – Back shift manning: 1 SS, 2 COs, 4 AOs, 2 MOS, 2 UEOs
• Maintenance on Shift (MOS) include E&I (1) and Mechanic (1)– Will use AOs as Helpers– Will cross qualify in an Ops area to cover if needed
• Equipment overhauls (Mills, crushers, etc) and outages worked on Straight time basis
• Numerous personnel loaned throughout the Fleet
6
Operations activities (April/May)
• Two weeks of specific systems and operating board training for ALL CO’s. This will also complete a majority of OJT training requirements.
• Cycle training 3-8 will be conducted on straight time for operations.
• Fire brigade training requirements completed through August/Sept will also be completed on straight time
• Plant wash down (including boilers).• Maintenance support from Operations and UEO’s (coal
handling).• UEO’s working with maintenance will be completing
qual card components during this time.• On-shift activities include running equipment checks,
fire watch, combustible dust reports, monthly fire extinguisher inspections and backlog reduction (hours apply to OJT).
7
Operations
• Current structure:– 12 SS’s – 19 CO’s– 44 AO’s– 14 UEO’s– 1 Manager+1 Administrator– Total - 91
2016 Navigant number for operations is 91. Currently at 81 (10 Vacancies).
• Proposed – 11- SS’s (2 per crew, LOTO, Relief, Days)– 19*- CO’s (will reduce to 14 once U1 Control
room moved to U3)– 38 - AO’s– 11- UEO’s (2 per Ops crew, 3 in relief)– 1 Manager + 1 Administrator– Total - 76
8
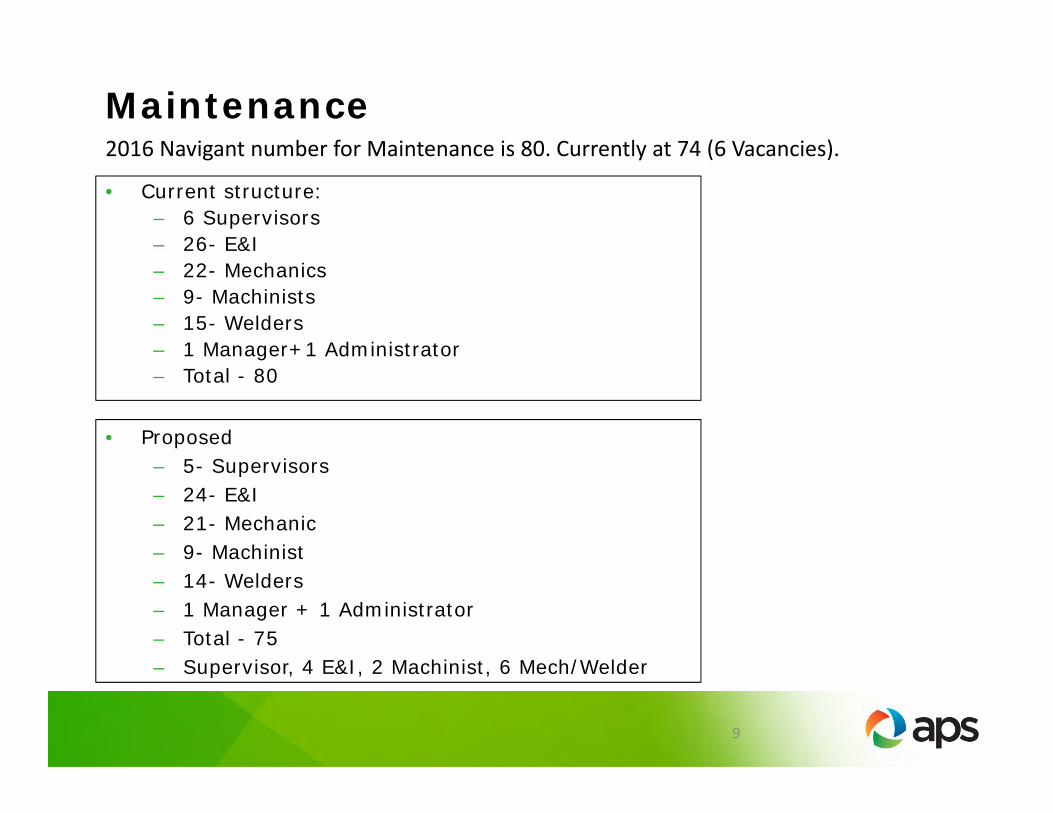
Maintenance
• Current structure:– 6 Supervisors – 26- E&I– 22- Mechanics– 9- Machinists– 15- Welders– 1 Manager+1 Administrator– Total - 80
2016 Navigant number for Maintenance is 80. Currently at 74 (6 Vacancies).
• Matrix folks • Engineering at Cholla – reduced by one • Training – reduced by 0.5 • Supply Chain at Cholla – reduced by two
• Billets not being pursued: Assistant Operations Mgr, Operations Technical Advisor, Planning Supervisor.
• Still under evaluation: Production Mgr, Administrative Assistants, sharing of Fire Chief with Four Corners
11
Coal Pile
• Current coal pile status is 907K tons (89 days)• Target for coal pile storage is 1.15M tons but has been
as high as 1.2M tons. • Initial engineering reviews show could stack
approximately 127K tons north railroad tracks• Environmental considerations
• Storm water pollution prevention plan update• Aquifer Protection Plan update• Particulate matter
• Soil preparation• Grading and compaction of top 8” of soil • $165K
• Retention pond capacity evaluation
12
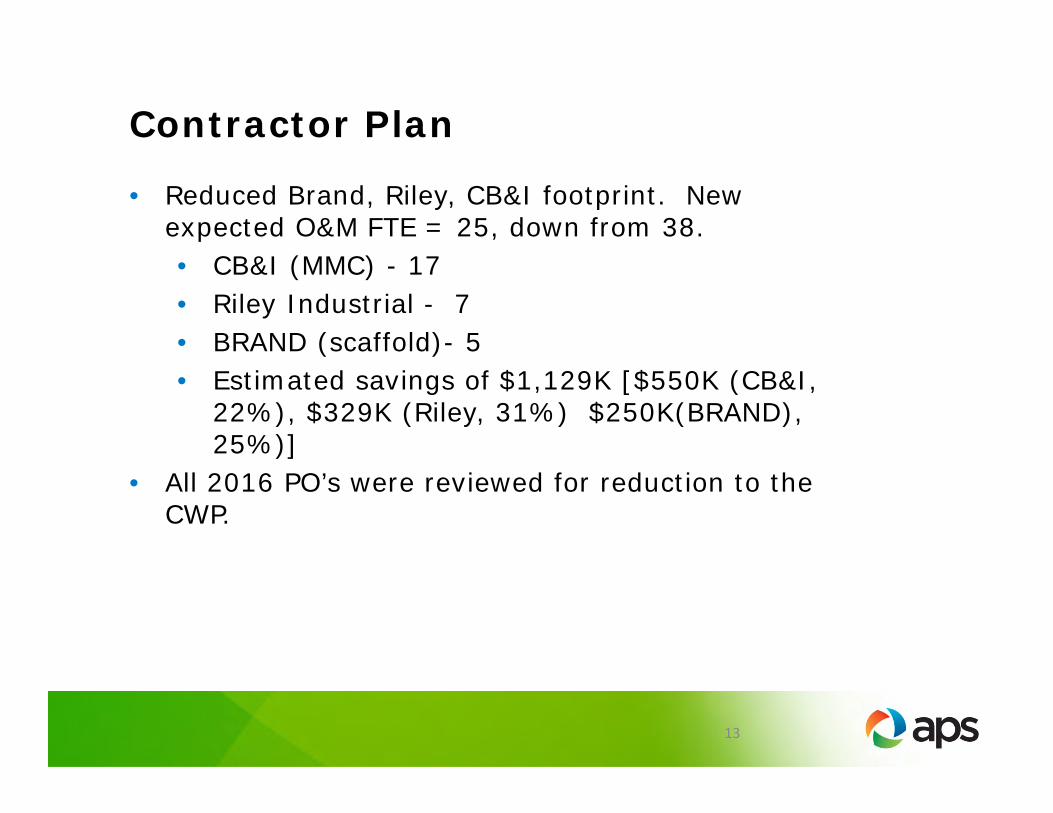
Contractor Plan
• Reduced Brand, Riley, CB&I footprint. New expected O&M FTE = 25, down from 38. • CB&I (MMC) - 17• Riley Industrial - 7• BRAND (scaffold)- 5• Estimated savings of $1,129K [$550K (CB&I,
22%), $329K (Riley, 31%) $250K(BRAND), 25%)]
• All 2016 PO’s were reviewed for reduction to the CWP.
13
Progress report at 60 days
• Reduced the Cholla organization to 176 direct report to Plant Mgr.
• Reduced the number of matrix personnel, specifically Supply Chain, training and Plant Engineering. Initial cuts were taken, but in reality it is a process of continuous evaluation.
• Reduced cost of U1 outage, worked nearly entirely on days.• Deferred U3 major outage to Spring 2017, will accomplish a
limited scope outage in April-May 2016, working days only. • Changed the Ops crew manning for single Unit operations.
Remaining Ops crew personnel are attending training or working with Maintenance dept.
• Reviewed all Special Maintenance Project budgets for 2016, total savings $1,034K. Reduction generated based on new anticipated run hours and historical spend to accomplish projects. (U1-$110K, 17%), (U3-$195K, 12%), (U4-$369K, 17%), (Common-$359K, 17%).
14
Progress (cont)• Commenced project to combine U1 control room into existing
U3 control room. Project is managed by Cholla Engineers, may be able to complete prior to summer run.
• Negotiated with the Union to allow MOS to be trained and qualified 1 or 2 Operations areas (General water + ?), will allow MOS to cover Ops crew unscheduled PTO.
• Negotiated with IBEW to have UEO as flaggable position, effective first pay period in April 2016.
Progress (cont)• Scheduled all Ops crew training for cycles 3-8 to be
accomplished prior to June 01, which is start of summer run and expected three unit operations.
• Fully manned the relief crew, allowing reduction in need for OT.• Reinstated mechanical MOS, minimizing the need to call out for
Pri 1-2 work. Expect additional benefit in reduction of CM back log.
• Increased utilization of AO secondary skill to assist with Maintenance work – both with MOS and assigned maintenance crew.
• Loaned several folks – Ops, Maintenance and Engineering - to other Plants within Fossil. {Turbine expert to 4C since early January, four to Redhawk (10 days), two to Ocotillo (6 weeks), four to 4C (6 weeks), Boiler Engineer to Saguaro (3 weeks), two to West Phoenix (2 weeks)}
16
Significant initiatives still in progress• Review and reduce Capital Projects based on new run
profile: U1 , U3, U4, Common• Review and reduce Corrective Maintenance back log based
on expected lifetime: U1, U3, U4, Common, Coal• Review Planned Maintenance, eliminating duplicates. • Changed PM scheduling to base on run time vice calendar
days, able to accomplish this due to adding counters. PM reduction based on new run time:
• Review of DCPs, to work only Safety, Environmental, and those tied to Cholla Top Ten Material Issue.
• Consolidating to one manned warehouse vice two; modifying materials handling processes.
17
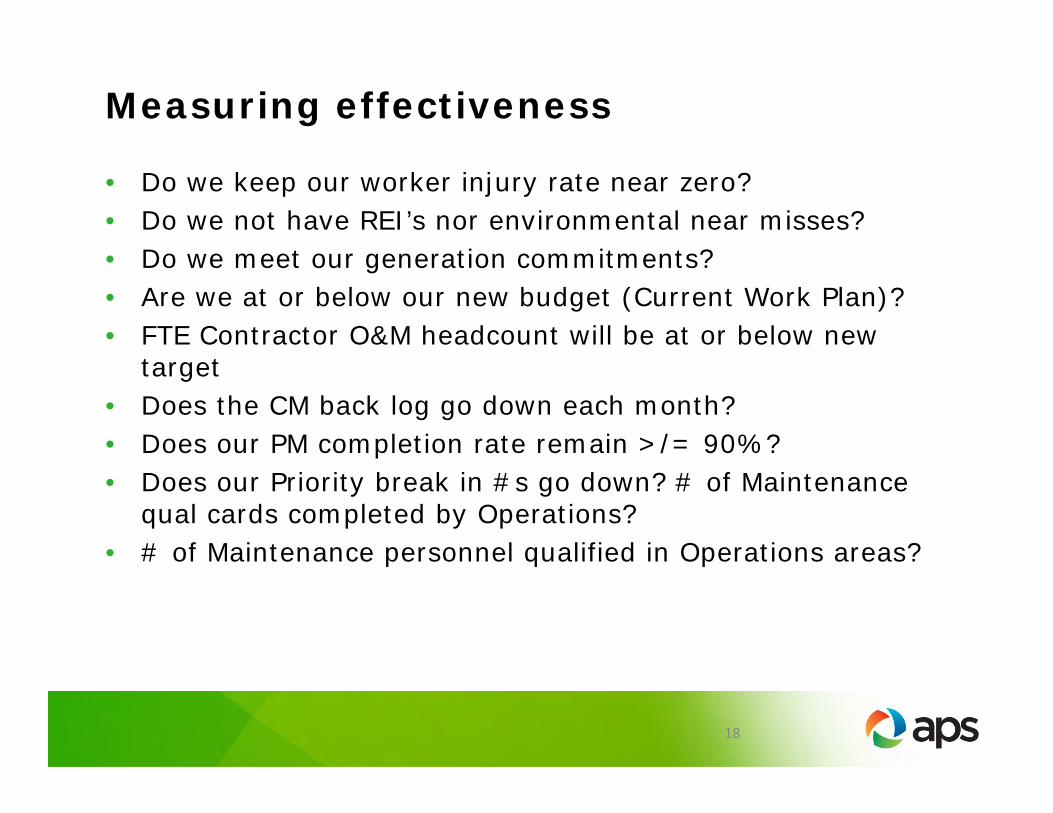
Measuring effectiveness
• Do we keep our worker injury rate near zero? • Do we not have REI’s nor environmental near misses? • Do we meet our generation commitments?• Are we at or below our new budget (Current Work Plan)?• FTE Contractor O&M headcount will be at or below new
target• Does the CM back log go down each month? • Does our PM completion rate remain >/= 90%? • Does our Priority break in #s go down? # of Maintenance
qual cards completed by Operations?• # of Maintenance personnel qualified in Operations areas?
18
Comments
19
ELG Compliance Options
Mike Preston Industrial Water Treating Section Leader
Black & Veatch
7/24/2017
1
ELG COMPLIANCE OPTIONS
Mike Preston, P.E.INDUSTRIAL WATER TREATING SECTION [email protected]
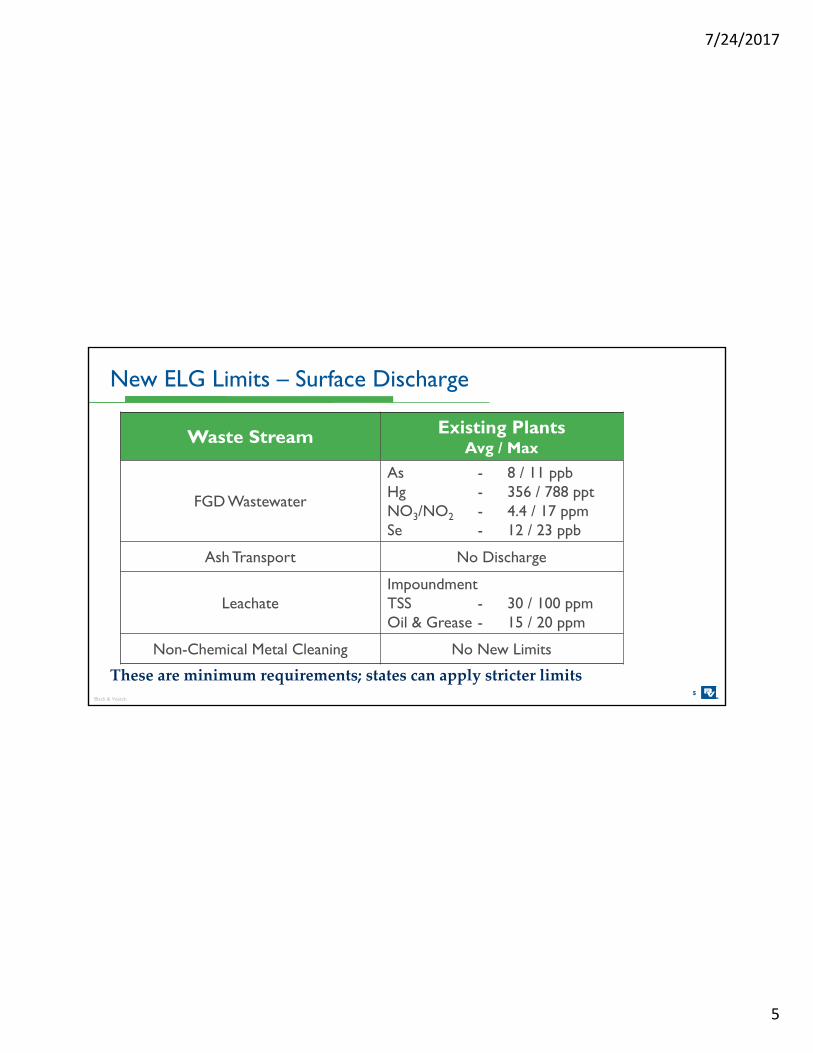
These are minimum requirements; states can apply stricter limits
7/24/2017
6
6
Anti Circumvention Provision (ACP)
• Requires a particular waste stream for which a zero discharge limitation has been established not be used in another plant process that results in a surface water discharge. The exception to this provision is use of ash transport water as FGD makeup water.
Legacy Provisions
• Ash transport water generated prior to the date established by the ELG as the control date (earliest Nov 2018; latest Dec 2023) would be treated under current BPT (settling ponds).
Combined Waste Streams
• Factored approach to limits where waste streams of different categories are combined for discharge.
Black & Veatch
Additional Provisions
7/24/2017
7
7Black & Veatch
Recent EPA Decisions May Affect Schedule, Or May Not
Heartland LM-HT® Concentrator• Requires a fuel source or hot gas stream (600-800F)• Wastewater and hot gas mixed in high turbulent zone• No water recovery; concentrated brine stream
Black & Veatch
Both technologies eliminate heat exchangers within evaporator
Other evaporation technologies…
7/24/2017
29
Black & Veatch
Brine Disposal Options
29
Crystallizer
• Expensive materials• High energy• Difficult
pretreatment
Fly Ash Disposal
• Limited flow rate• Material upgrades• Impact to fly ash
sale
Blending
• Pozzolanic Solidification• Fly ash and reagent• Requires bench scale
testing
7/24/2017
30
• Fully evaporate wastewater, leaving only crystals
• Evaporated water is not recovered
• Old technology, new application
• No pretreatment; carbon steel vessel
• 0.5 – 1% heat rate impact
• Flow rate limited by flue gas temperature, pressure drop, and flue gas volume
Spray Dryer
Black & Veatch
Need to evaluate additional solids loading and impact to fly ash quality
30
7/24/2017
31
31Black & Veatch
Spray Dryer – Flow Diagram
7/24/2017
32
ESTIMATED COST
32
7/24/2017
33
• Spring 2016 study
• Two units
• Original flow rate – 275 gpm
• Revised flow rate – 50 gpm
• No existing physical/chemical system
• Comparison of 5 treatment options
Recent ELG Project
33
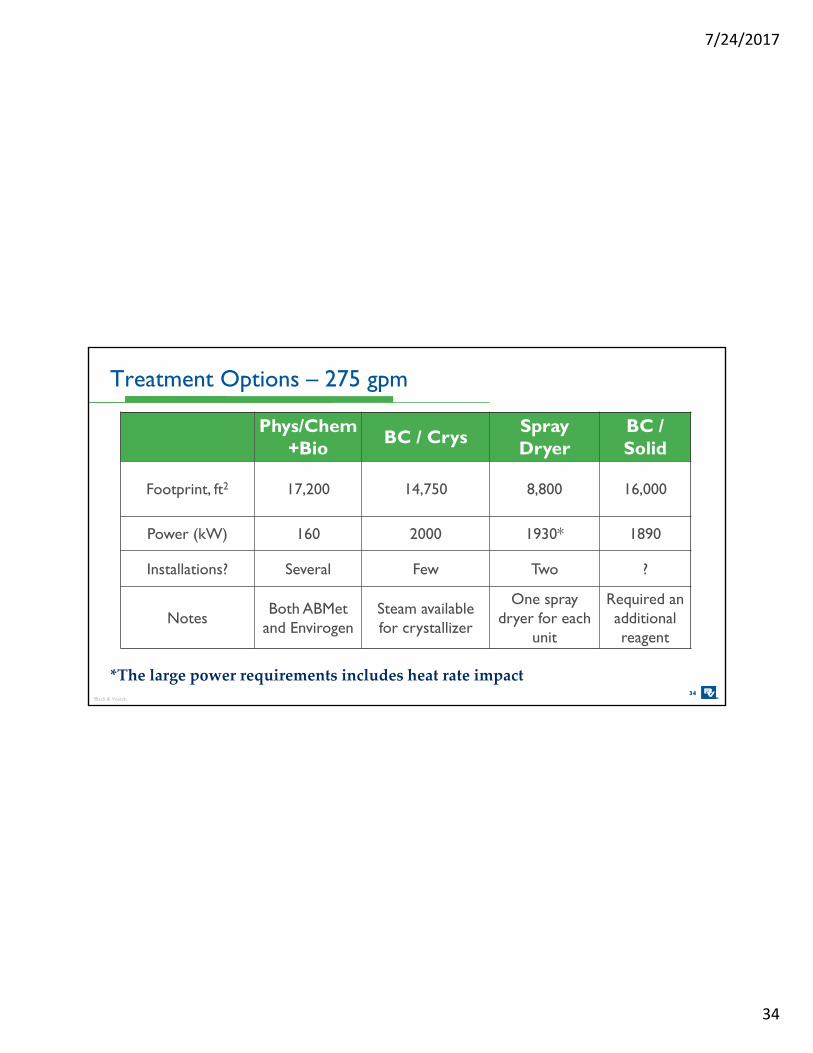
7/24/2017
34
Phys/Chem +Bio
BC / CrysSpray Dryer
BC / Solid
Footprint, ft2 17,200 14,750 8,800 16,000
Power (kW) 160 2000 1930* 1890
Installations? Several Few Two ?
NotesBoth ABMet
and EnvirogenSteam available for crystallizer
One spray dryer for each
unit
Required an additional reagent
Treatment Options – 275 gpm
Black & Veatch34
*The large power requirements includes heat rate impact
7/24/2017
35
Black & Veatch35
$9.6M
$7.2M
$12.2M
$18.5M
$10.6M
$5.5M $5.0M
$8.6M$7.1M
$8.1M
ABMet Envirogen BC/Cryst Spray Dryer BC/Solid
Major Equipment Costs275 gpm50 gpm
7/24/2017
36
Black & Veatch36
$41.4M
$31.9M
$51.9M
$81.4M
$46.0M
$25.3M $23.3M
$37.2M$31.2M
$36.3M
ABMet Envirogen BC/Cryst Spray Dryer BC/Solid
Total Installed Costs275 gpm50 gpm
7/24/2017
37
Black & Veatch37
$1.0M $0.8M
$3.6M
$5.9M
$2.4M
$0.6M $0.6M
$1.6M$1.2M $1.1M
ABMet Envirogen BC/Cryst Spray Dryer BC/Solid
Annual O&M Costs275 gpm50 gpm
7/24/2017
38
Other Cost Considerations
Each plant is unique and all aspects need to be taken into account for ELG compliance
ELG and CCR impacts
Segregation of wastes
Schedule
Existing Equipment
Pilot Costs
Black & Veatch38
7/24/2017
39
• Water Management Review
• Solutions Evaluation
• Treatment Approach
• Schedule and impact from other rules
• Piloting
Summary
Black & Veatch39
Austin Energy Generation Overview (Successes & Challenges)
Michael Enger Interim – Energy Market Manager
Austin Energy
Austin Energy Generation Overview –Success & Challenges
Michael EngerInterim – Energy Market Manager, Market Operations & Risk Management
www.austinenergy.com
ERCOT Service Territory
2
www.austinenergy.com
Overview of the Evolution of ERCOT
Around the start of WWII, several electric utilities in Texas agreed to operate together as the Texas Interconnected System (TIS) to support war effort
Members recognized reliability advantages of interconnection and continued to operate and develop interconnected gridERCOT formed in 1970 to comply with NERC requirements (not reliability)Control Areas managed reliability Generation served load within control area Production cost drove cost to serve load
1995 Legislation passed to deregulate wholesale electric marketsTexas still had 10 control areas, but generation could be bought or sold to help serve load or maximize generator revenueGeneration still served load in control areas but now augmented with some purchases and sales
3
www.austinenergy.com
Overview of the Evolution of ERCOT
1999 SB7 passed to lead to deregulation of retail load in TexasUnbundled investor-owned utilities Assigned ERCOT 4 primary responsibilities
− System reliability− Open access to transmission− Retail switching process for customer choice− Wholesale market settlement for electricity production and delivery
2001, the 10 existing control areas in Texas were consolidate into a single control area administered by ERCOT (ISO)
Zonal Market structureWholesale power sales now subject to centralized power schedulingCentralization of ancillary services to ensure reliability
In 2003, PUCT orders development of a wholesale nodal market designDecember 2010, ERCOT Nodal Market goes live
All load is purchased from ERCOTAll generation is sold to ERCOT 4
www.austinenergy.com
• Generation Dispatch • Security Constrained
Economic Dispatch (SCED)• Resource specific offers • Resource specific dispatch
• OTC (Over the Counter) Direct• REPs• Gen Cos• Energy Trading Companies• Banks• Speculators / Proprietary
Traders
Bilateral ERCOT Markets
9Timeframe can vary from next hour to next 30 years
www.austinenergy.com
$0
$200
$400
$600
$800
$1,000
$1,200
$1,400
Load Zone South ERCOT 15 minute RT SPP –June 18th through June 20th, 2017
10
$/MW
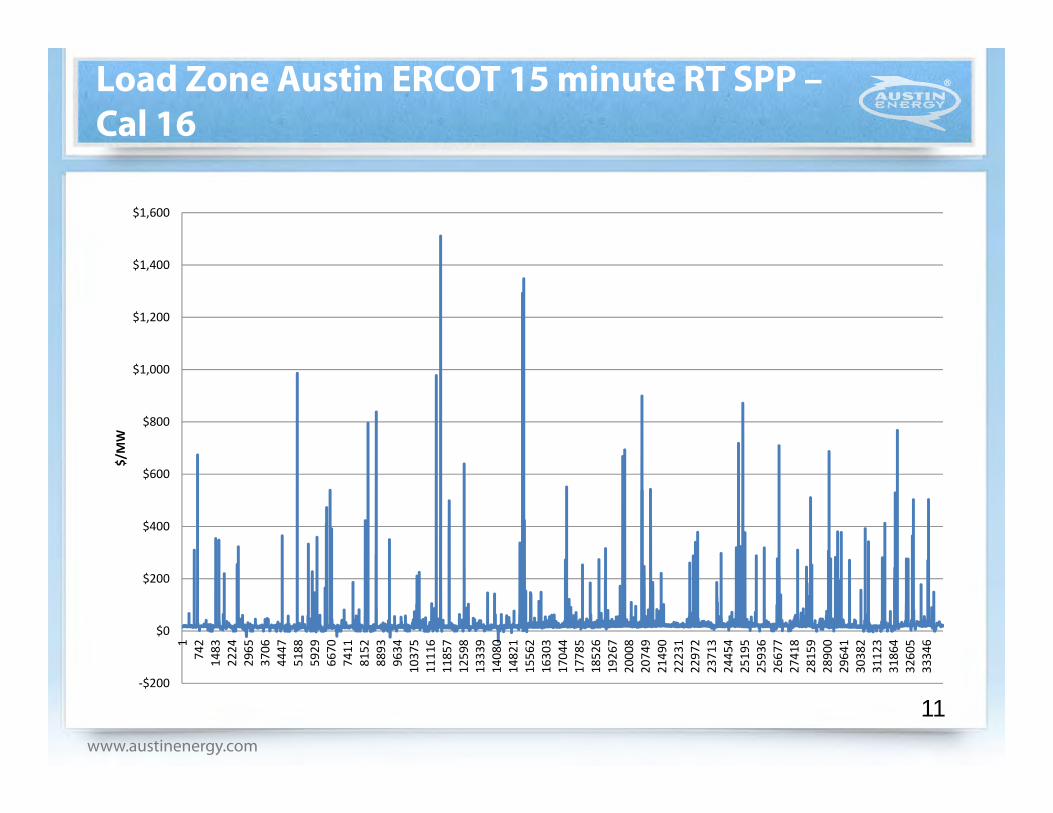
www.austinenergy.com
Load Zone Austin ERCOT 15 minute RT SPP –Cal 16
11-$200
$0
$200
$400
$600
$800
$1,000
$1,200
$1,400
$1,600
174
214
8322
2429
6537
0644
4751
8859
2966
7074
1181
5288
9396
3410
375
1111
611
857
1259
813
339
1408
014
821
1556
216
303
1704
417
785
1852
619
267
2000
820
749
2149
022
231
2297
223
713
2445
425
195
2593
626
677
2741
828
159
2890
029
641
3038
231
123
3186
432
605
3334
6
$/M
W
www.austinenergy.com
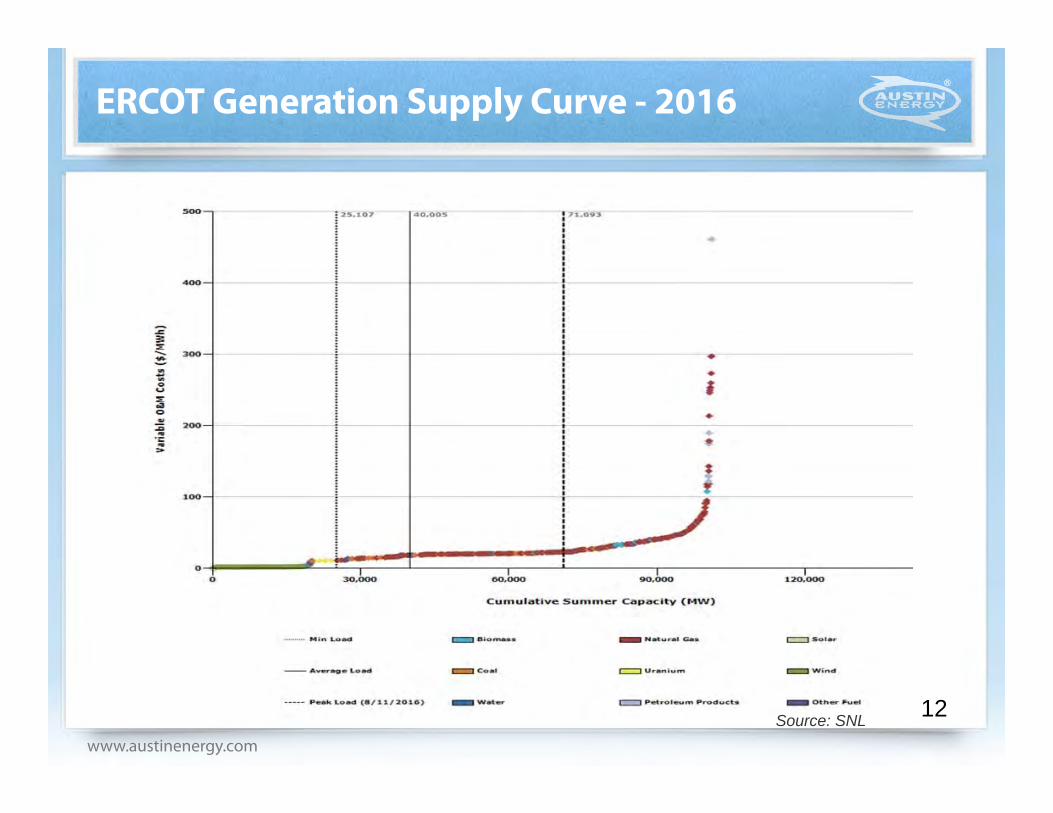
ERCOT Generation Supply Curve - 2016
12Source: SNL
www.austinenergy.com
Austin Energy
13
www.austinenergy.com
Austin Energy
14
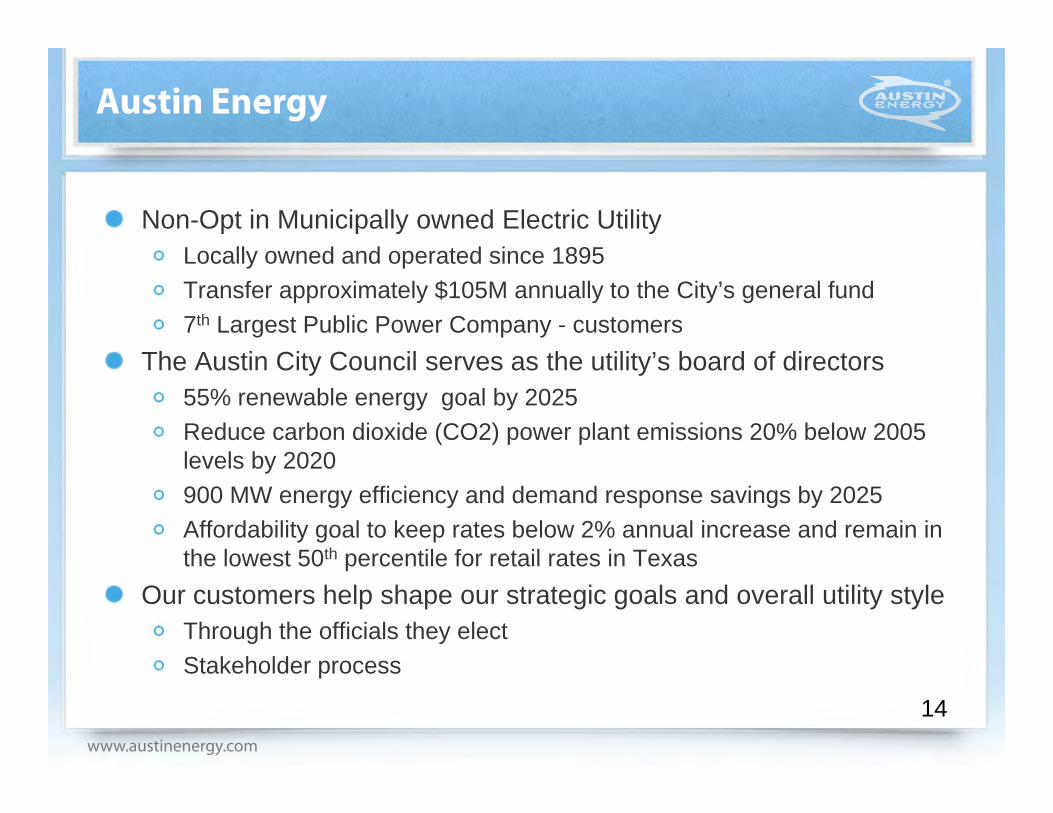
Non-Opt in Municipally owned Electric UtilityLocally owned and operated since 1895Transfer approximately $105M annually to the City’s general fund7th Largest Public Power Company - customers
The Austin City Council serves as the utility’s board of directors55% renewable energy goal by 2025Reduce carbon dioxide (CO2) power plant emissions 20% below 2005 levels by 2020900 MW energy efficiency and demand response savings by 2025Affordability goal to keep rates below 2% annual increase and remain in the lowest 50th percentile for retail rates in Texas
Our customers help shape our strategic goals and overall utility styleThrough the officials they electStakeholder process
www.austinenergy.com
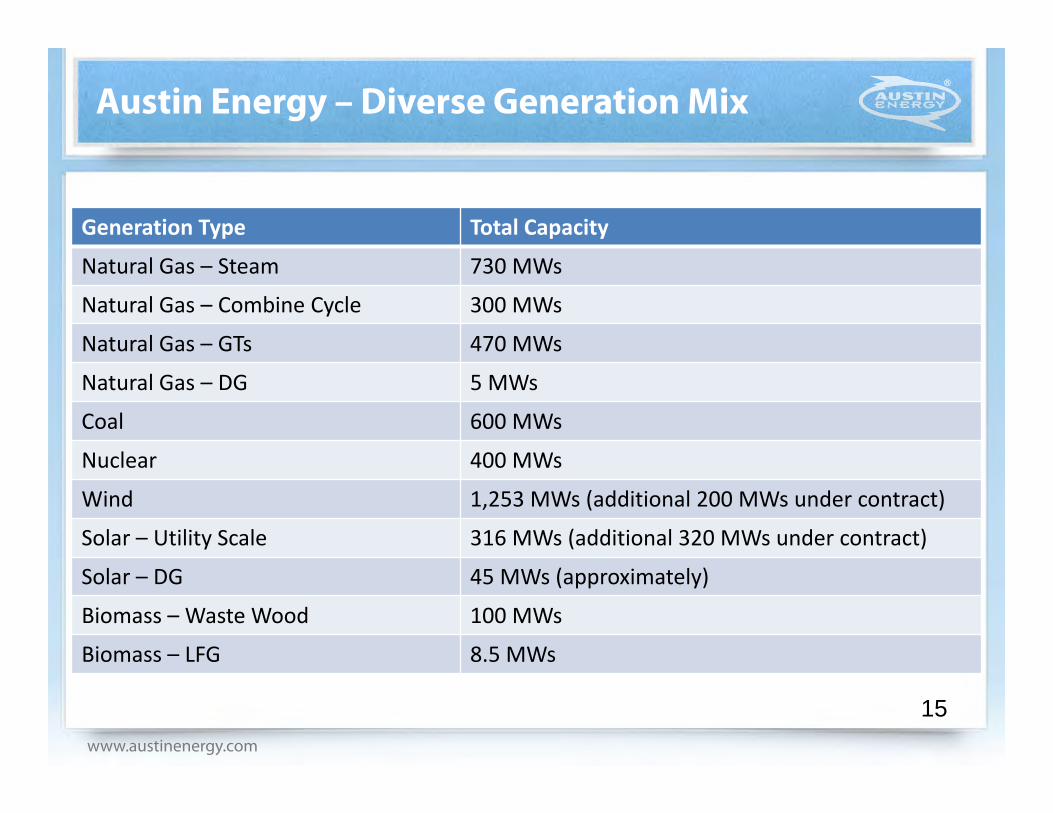
Austin Energy – Diverse Generation Mix
15
Generation Type Total Capacity
Natural Gas – Steam 730 MWs
Natural Gas – Combine Cycle 300 MWs
Natural Gas – GTs 470 MWs
Natural Gas – DG 5 MWs
Coal 600 MWs
Nuclear 400 MWs
Wind 1,253 MWs (additional 200 MWs under contract)
Solar – Utility Scale 316 MWs (additional 320 MWs under contract)
Solar – DG 45 MWs (approximately)
Biomass – Waste Wood 100 MWs
Biomass – LFG 8.5 MWs
www.austinenergy.com
Austin Energy – Generation Asset Map
16
Roserock Solar
www.austinenergy.com
Austin Energy - Challenges
17
ERCOT Nodal Market structure and generation mix currently rewards flexibility and can be unforgiving for baseload generation
Lack of the ability to cycle puts economic pressure less flexible generationDAM does not work well to economically dispatch units with longer start-up times
Austin Energy’s high renewable goal and climate goal is moving generation portfolio away from controllable resources and towards more intermittent resources
Increases the challenge in providing stable rates to our customersIncreases forecast risk when hedging further out in the futureIncreased congestion exposure due to location of assets relative to load
www.austinenergy.com
Austin Energy - Successes
18
Increased use of forward power markets to increase economic benefit for aging, less efficient assets
Increased net revenue by > 50% over the past 2 years on older natural gas steam assetsIncreased net revenue by hedging downside price risk for baseload units in OffPeak periods
Operational changes at plants to increase flexibilityLower LSLsAdditional cycling
www.austinenergy.com
Austin Energy - Successes
19
Successfully negotiated some of the lowest cost renewable PPAs to date
“World’s Cheapest Solar Power Lands in Austin, Texas” –cleantechnica.com (2015)“Austin Energy gets record low solar bids under 4 cents/kWh” –utilitydive.com (2015)“World’s Cheapest Solar Power Deal in Austin, Texas” – costofsolar.com (2014)
Continue to evaluate technologies viability in the evolving market
Quick start unitsBattery storage
www.austinenergy.com
Questions
20
?
Austin Energy’s System Control Center (SCC) Tour
Craig Schaub Control Engineering Manager
Austin Energy
PANEL: Operating Optimization of Plant
for Energy Market you are in
Richard Dillon Director, Market Policy Southwest Power Pool
Mike Ducker
Director, Market Analysis Mitsubishi Hitachi Power Systems Americas, Inc.
John Wester
Energy Market Manager Austin Energy
PANEL: Operating Optimization of Plant
for Energy Market you are in
Richard Dillon Director, Market Policy Southwest Power Pool
Market Dispatch and Plant Optimization can be CoordinatedRichard DillonSouthwest Power [email protected]
2
Many actions you do to “protect” yourself actually hurt!• What is a market offer?
• “Control my destiny”
• “Shoot myself in the foot”
• “Stop doing that!”
3
What is a market offer?• Operational Parameters Minimum/Maximum MW Ramp Rate Start-up/Minimum Run Time Available/Shutdown Minimum Time Between Startup
• Financial Parameters Energy Offer Operating Reserves Offer (Regulation &
Contingency) Startup & No-Load Offer
4
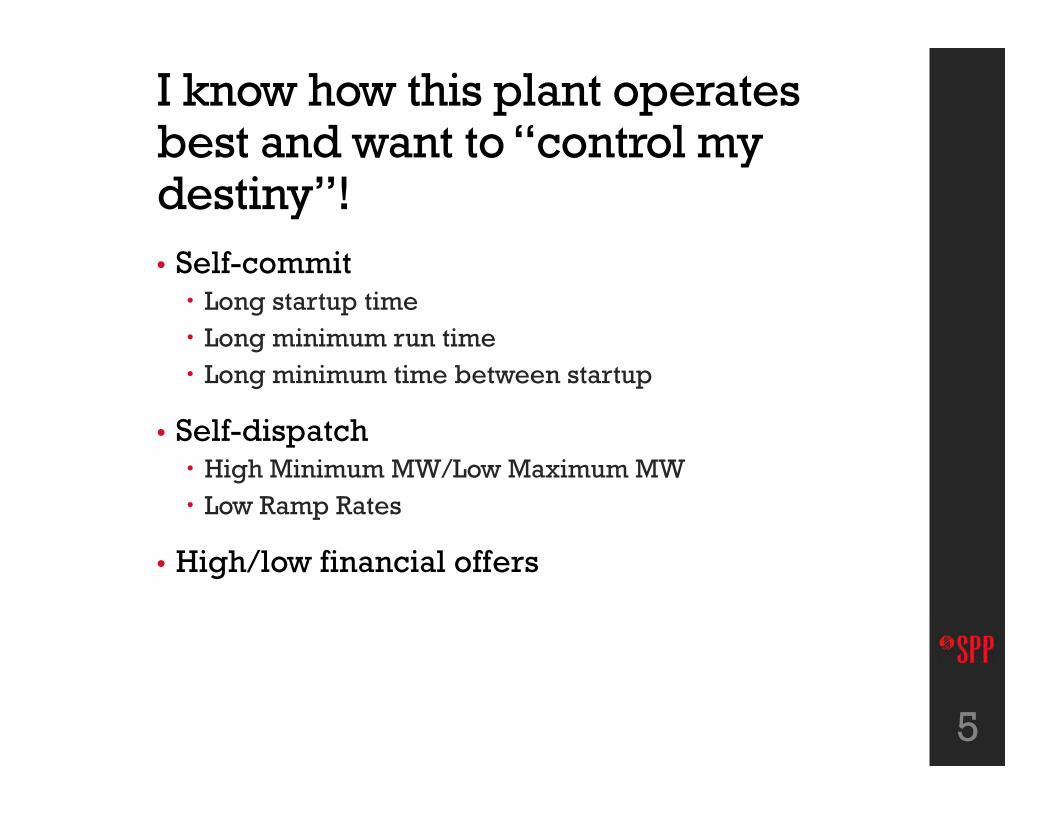
I know how this plant operates best and want to “control my destiny”!• Self-commit Long startup time Long minimum run time Long minimum time between startup
• Self-dispatch High Minimum MW/Low Maximum MW Low Ramp Rates
• High/low financial offers
5
Why am I being yelled at for “shooting myself in the foot”?• Unable to get revenue Long startup time or minimum run time May not get started at all, especially if the startup is
more than 24 hours Long minimum run time May not get started at all because the cost is too high May not get shutdown when the prices are below cost
High minimum, low maximum MW, or low ramp rate May have to pay the market to generate (negative
price) May lose out on additional revenue from not producing
more MW
• Load may have to pay more than the generator revenue
6
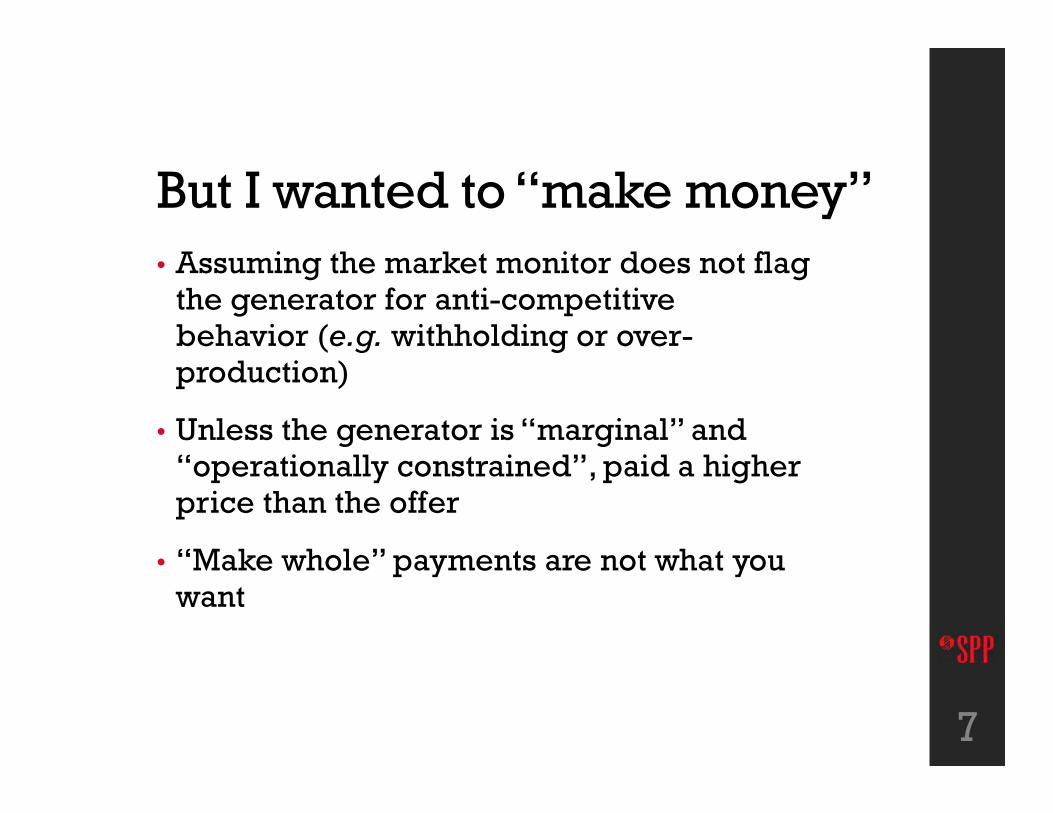
But I wanted to “make money”• Assuming the market monitor does not flag
the generator for anti-competitive behavior (e.g. withholding or over-production)
• Unless the generator is “marginal” and “operationally constrained”, paid a higher price than the offer
• “Make whole” payments are not what you want
7
“Stop doing that” and trying to control the result!• Submit the real operational values, rather
than those to force an outcome
• Submit financial offers consistent with your costs
• Communicate with corporate and the market operator Problems Improvements
8
PANEL: Operating Optimization of Plant
for Energy Market you are in
Mike Ducker Director, Market Analysis
Mitsubishi Hitachi Power Systems Americas, Inc.
Mitsubishi Hitachi Power Systems
Economic and Operational Benefitsof Improved CCGT Turndown
Coal 600 MWs Own 50% of two 600 MW Units with LCRA – Operated by LCRA for AE
Nuclear 400 MWs Own 16% of two 1250 MW Units with NRG and CPS – Operated by 3rd Party
www.austinenergy.com
Austin Energy – ERCOT Market Impact
3
Generation is Regulated and Deregulated at same timeAustin Energy regulated in retail (captive customers)ERCOT continues to be regulated for T&D (socialized costs across market)All Generation competes in Wholesale Deregulated MarketPrice pressure from low natural gas and “0” fuel renewablesCost of Generation is the key to maintaining regulated benefits
ERCOT Nodal Market structure and generation mix currently rewards flexibility and can be unforgiving for baseload generation
Lack of the ability to cycle puts economic pressure less flexible generationDAM does not work well to economically dispatch units with longer start-up timesBalance of reliability, cost, environmental aspirations across ERCOT
www.austinenergy.com
Austin Energy – Strategies/Concerns
4
Operational changes at plants to increase flexibilityLower LSLs− Sliding Pressure for conventional steam – must maintain Droop
requirements− Lower ramp rates at low loads – adjust ramp and notify ERCOT
Reduce Start up times – minimize fuel burn, faster air emissions complianceDaily Cycling Large Conventional Steam Operate SC GT’s as price responsive
ERCOT challenge for adequate inertia as we move generation portfolio away from large rotating machines toward more intermittent resources non-controllable resources
www.austinenergy.com
Questions
5
?
Turbophase Dry Air Injection – Fast Ramp Power for Peak Power and
Renewable Firming
Brian Foley Director, Sales PowerPhase
Flexible Solutions Today for the Low Carbon / Renewable Energy
Future
Brian Foley Director, Sales
July 27, 2017
Powerphase Proprietary & Confidential
Agenda
Market Dynamics
Turbophase Overview
2
Technology Evaluation
Summary
$1 Trillion+ in New Power Generation Will be Built by 2035 and a large &
growing share will come from Natural Gas Generation and
Renewables.
Pressure on Coal & Nuclear 1Accelerating Renewable
Deployment2Requires Synergies
between Renewables& Conventional Generation
3
Low Carbon / Renewable Energy
Future
3
www. p o w e r p h a s e l l c .com 4Page |
Powerphase Proprietary & Confidential
Renewable Generation Driving New Approach
4
New Market Need:
• Fast ramp• Flexible• Low Carbon• Low Cost
Current Solutions:
• Cycling CCGTs• Aeroderivative GTs• Recip Gen Sets• Turbophase
Characteristics for dispatchable power resources (i.e. Firming Energy) in order to balance renewable energy supply variations.
Must be capable of dispatching and load following the renewable energy supply such that a constant value of scheduled energy is delivered
RETURN ON INVESTMENT• Energy• Reserve Margin• Ancillary
FAST RESPONSE• Eliminates spinning reserve• Flexible Dispatch• Dynamic Signal Capable• Provides renewable firming
OUTPUT INCREASE• Increase Power• Temp, Humidity,
Elevation Independent
PARTS LIFE IMPROVMENT• No water, steam• No change to firing
temperature
ENVIRONMENTALLY FRIENDLY• No Water Consumption• SCR, CO Catalyst
IMPROVE EFFICIENCY• GT efficiency improvement
6
Powerphase Proprietary & Confidential
Modular, Flexible System
7
Powerphase Proprietary & Confidential
Standard Products Ensure Reliability
• Standard commercial off the shelf components
• Leading OEM Gas / Diesel Engine Manufacturers
• Worlds Top Performing “Oil Free” Intercooled Compressor MFGs
• Sound & Weather Enclosure
• Fully Assembled and Factory Acceptance Tested
8
Powerphase Proprietary & Confidential
9
Technology Evaluation -Methodology and Results
Powerphase Proprietary & Confidential
10
Firming Energy Technology Evaluation
Analysis Methodology/Inputs• Modeled a 50 MW on-peak Firming Energy product:
o Two (2) LM2500+G4o Three (3) W50SG recip gen setso Eight (8) Turbophase modules (installed on a F-class CC plant)
• Used 2016 ERCOT real time hourly data - energy prices, natural gas costs, generation asset dispatch profiles
• Factored in dispatch cost for each firming resource - aero/recip/TPM• Considered sale of surplus energy (above that required for firming)
Results/Output• Market based economics for each firming technology to include:
o Total Installed CAPEXo Total Annual Firm Costso Merchant Energy sale margino 20-year “All-In” Costs or Profit
Powerphase Proprietary & Confidential
11
Firming Technology Capital Costs
*In PJM, the LM and WRE technologies were not dispatched to provide firming service as the PJM market provides for the purchase of real time energy for balancing purposes at a lower cost
*
• CAPEX includes – EPC, Interconnect, Interest, Permits
• Turbophase provides lowest upfront costs for Firming Energy
Powerphase Proprietary & Confidential
12
ERCOT Summary
• Turbophase is available whenever the CCGT plant is running• Cost to run includes Firming Energy purchase when CC is offline (out of the money)• Turbophase generates MWs at CC Heatrate (so dispatches with CCGT)• Turbophase generates significant Merchant Energy sales
Turbophase Provides Positive Net Income vice Net Cost of Other Technologies
Powerphase Proprietary & Confidential
13
ERCOT 20-Year Cost/Margin Summary
• Costs include CAPEX O&M (fuel + variable), and real time energy purchases• All technologies are compared to 100% Real Time Buy Through
Turbophase Provides Significant Value Over Competing Technologies
Powerphase Proprietary & Confidential
14
Summary
• Renewable Generation Driving Need for Firming Energy Resources• Numerous options are available
o Cyclic CCGTo Aeroderivativeo Reciprocating Engine Gen-setso Turbophase
• Key Factors for Technology Selection: o CAPEXo Cost of Generationo Lifecycle revenue/margin
• Turbophase is a viable option• Low Cost• Flexible• Fast Ramp• Low Carbon
Powerphase Proprietary & Confidential
15
Turbophase – Generation Smart
Questions?
Brian FoleyDirector, SalesPowerphase [email protected]+1 (720) 288-3003
Powerphase Proprietary & Confidential
16
Turbophase – Generation Smart
Backup
Powerphase Proprietary & Confidential
17
PJM Summary
• Turbophase is available whenever the CC plant is running• Cost to run includes Firming Energy purchase when CC is offline (out of the money)• Turbophase generates MWs at CC Heatrate• Turbophase generates significant Merchant Energy sales
Turbophase provides for positive Net Income
Powerphase Proprietary & Confidential
18
20-Year Cost/Margin Summary
Powerphase Proprietary & Confidential
Energy Dense System - 54MWs
19
JK1
Slide 19
JK1 Josh Kraft, 11/28/2016
Powerphase Proprietary & Confidential
Turbophase Power Plant Integration
Site Utilities and Connections o Power – 4160VAC, 100 amps for TPS, 60 Hzo Control/Interface – TPM Onboard HMI and
Local HMI in Control Room (Fiber Optic)o Fuel – Natural Gas – 20.5 mmbtu/hr per TPM
o CT increases 24 mmbtu/hr Per TPMo Closed Loop Cooling – Consumes Zero o TPM Foundation – 18” Thick x 8’ x 40’ o Project Area Dimension – 100’ X 100’o Drainage - 8 GPM of condensate piped to
raw water forwarding sump
Installation / Integrationo TPM common air header to all CTs
• TPM air pipe to IBH o Turbophase Electronic Enclosure (TPEE)
receives 4160 power, distributes 480o TPEE Receives Fiber Optic and distributes to
modules (Mod Bus or TCP/IP)o Connect to fuel gas skid near SCCT before
Isolation Valve, TPS regulates Pressure and Flow
20
Powerphase Proprietary & Confidential
Tie into Gas turbine and borescope took less than one day
Balance of installation was complete 90 days after notice to proceed:• Air line• Gas line• Air pulse Pre-filter
Elevates the pressure of the feed gas and the returning flash to the optimal liquefaction pressure.
Compressor provides the main compression energy required by the efficient turbo-expansion process.• Proven D-R MOS™ reciprocating
compressor technology • Non-lubricated cylinders and
packing (no process contamination)
• VFD with induction motor for process turndown
Turbo-expansion with pre-cooling refrigeration loop. This closed loop natural gas concept means working fluid is integral and utility needs are minimized.• Cooling and product phase change
from gas to liquid• Mechanical chiller with stainless
cryogenic heat exchangers and evaporative cooling
• Turbo-expander and Joule-Thompson (J-T) valve (methane refrigerant)
Complete control of all modules of the LNGo LP and HP systems. Remote capable control logic with wireless instrumentation and transmitters used wherever advantageous and code compliant.
LNGo-LP N/A 4 Throw / 4 Stage Ammonia as cooling media Integrated into power module where applicable
LNGo-HP 4 throw / 2 stage 2 throw / 2 stage Propane as cooling media Separate module or in client control room
Micro-Liquefaction System Base Equipment
2015-07-30
Strictly Confidential
Page 9 Walhof / Distributed LNG Solutions
Gas Conditioning Module - GCM Power Module LNG Storage Balance of Plant
Gas cleanup system with drying in order to remove CO2 and water from the incoming feed gas stream. Clean, dry gas insures optimal liquefaction performance. Additional conditioning module available for laden gas depending on composition.• Removes CO2, H2O, and
heavy hydrocarbons (C3+)
Option to be grid-independent and a fully self-powered liquefaction system. This is achieved by leveraging the waste gas stream for power generation.• High tech, low emission rich burn
with NSCR catalyst • D-R Guascor natural gas
powered 1 MW power system• Purge flow from cleanup module
is blended into the fuel supply to power the Guascor engine
• D-R Enginuity® Control and Monitoring Systems
• No flaring required. Purge flow from gas conditioning is blended into the fuel supply to the Power Module.
Storage strategies provided to accommodate the client’s needs. From bullet to atmospheric tanks with vapor recovery, any storage need can be addressed through a network of approved vendors.
Project resources to provide procurement execution of all project details such as site preparation, cryogenic pumping, boil-off gas recovery etc.
Gas clean-up• NGL removal equipment as
required for NGL removal. This is dependent on gas composition provided by customer.
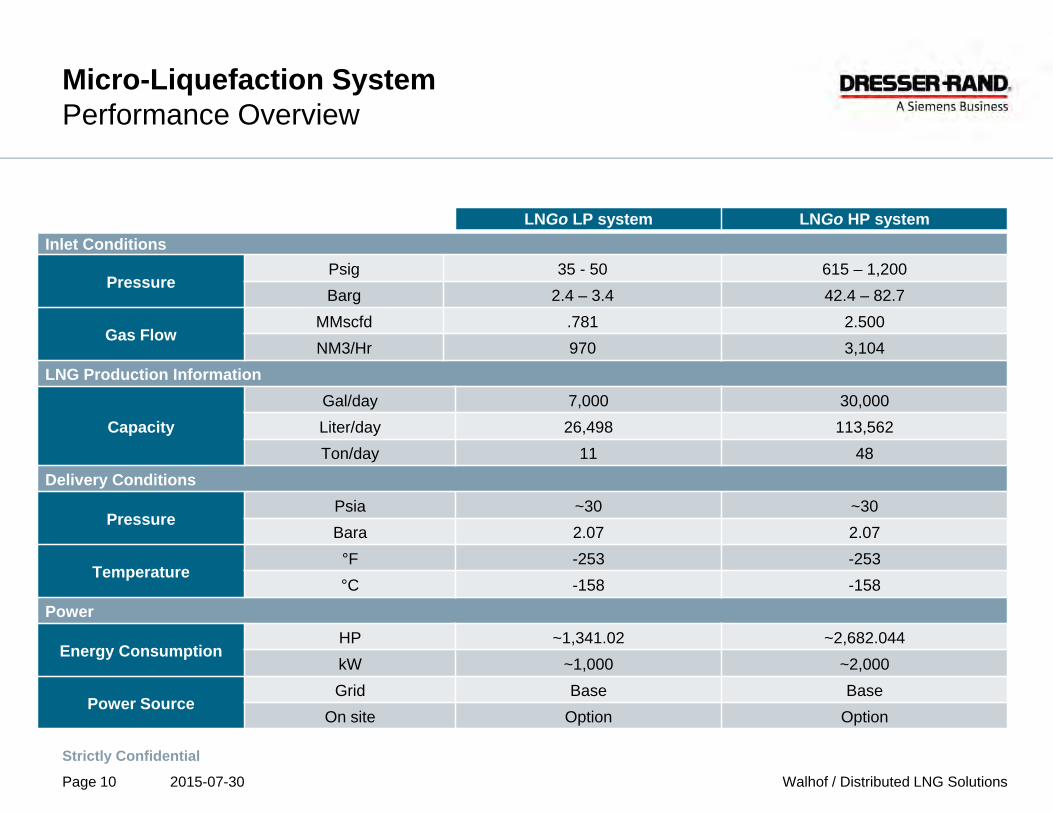
Energy ConsumptionHP ~1,341.02 ~2,682.044kW ~1,000 ~2,000
Power SourceGrid Base Base
On site Option Option
2015-07-30
Strictly Confidential
Page 11 Walhof / Distributed LNG Solutions
Configuration for markets with pipeline quality gas input at 50 psia shown
Power moduleGenset driven by Guascor 1MW engine consumes purge gas from mole sieve to power unit
Conditioning module Molecular sieve removes CO2and H2O. The purge flow, with C2 and above, is blended into the fuel supply to the Guascor engine
Compressor module MOS™ compressor drives efficient process
Process moduleDelivers 7,000 gpd (11 tpd) LNG
Enginuity® control and monitoring systems
Micro-Liquefaction SystemGeneral Arrangement
2015-07-30
Strictly Confidential
Page 12 Walhof / Distributed LNG Solutions
Micro-Liquefaction SystemFlow Diagram
LNGo ™ cycle uses methane as the fuel, refrigerant and liquefied product.
NG = Natural GasHX = Heat Exchanger (welded plate and frame)
Input – Processed natural gas
Flow .781 MMSCFD
Temperature 60° F 15.5° C
Pressure > 50 psia > 3.4 bara
Output – Liquefied Natural Gas (LNG)
Flow 7,000 GPD 11 TPD
Temperature -253° F -158° C
Pressure 30 psia 2.07 bara
* Dependent on gas composition and pressure
2015-07-30
Strictly Confidential
Page 13 Walhof / Distributed LNG Solutions
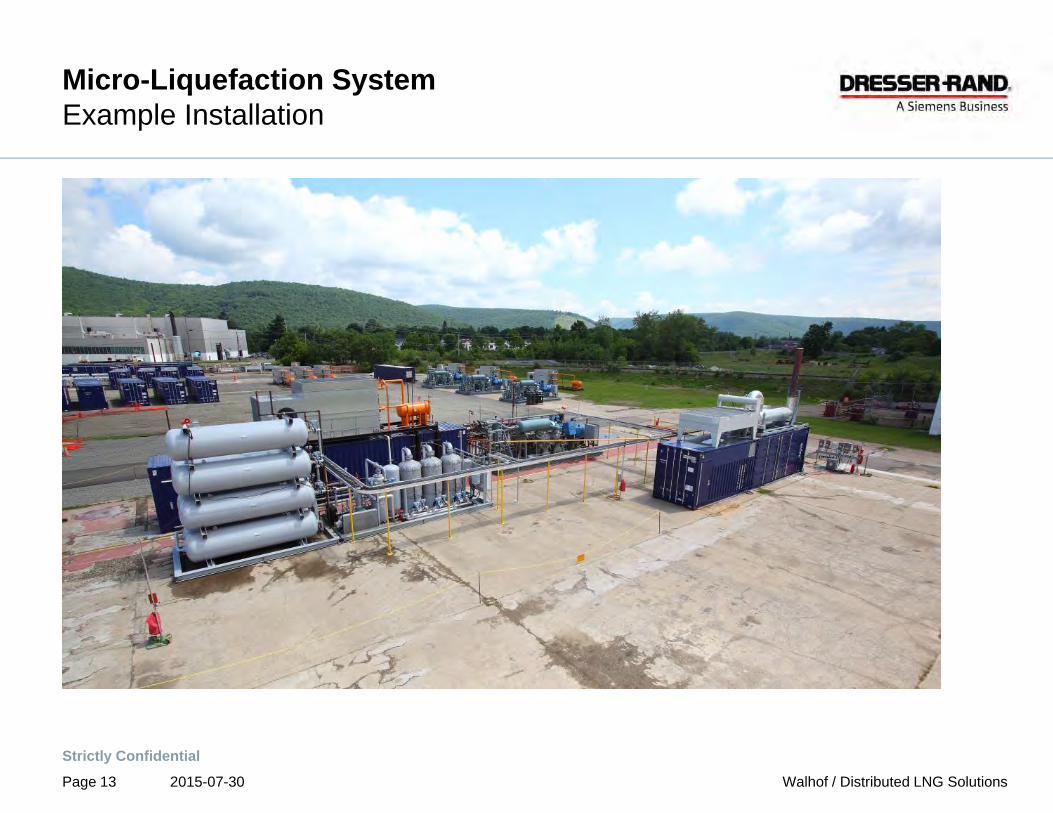
Micro-Liquefaction System Example Installation
2015-07-30
Strictly Confidential
Page 14 Walhof / Distributed LNG Solutions
Micro-Liquefaction SystemNorthern Canada
Commissioning October 2016
2015-07-30
Strictly Confidential
Page 15 Walhof / Distributed LNG Solutions
Micro-Liquefaction SystemFeatures and benefits
• 7,000 – 30,000 gpd (11 - 48 tpd) production - perfect size for local LNG production and demand
• Small footprint• Self-powered available - easy to permit• Large-scale LNG industry components utilized• Short cycle time order to operation• Multi-market applications• Worldwide service and support
2015-07-30
Strictly Confidential
Page 16 Walhof / Distributed LNG Solutions
Onsite Distributed LNG - Example ProjectsLongview Power - WV
• Gas used to start power plant / support high demand• Pipeline gas was not reliable when re-firing during critical times• Onsite LNG with vaporization• ‘Inside-the-fence’ startup capability• Meets PJM capacity performance requirements
2015-07-30
Strictly Confidential
Page 17 Walhof / Distributed LNG Solutions
Distributed LNG Solutions Contact
Edward WoodsTerritory SalesDresser-Rand / Global Solutions / Distributed LNG Solutions