Population Investigation Committee The Changing Relation between Mortality and Level of Economic Development Author(s): Samuel H. Preston Reviewed work(s): Source: Population Studies, Vol. 29, No. 2 (Jul., 1975), pp. 231-248 Published by: Population Investigation Committee Stable URL: http://www.jstor.org/stable/2173509 . Accessed: 08/02/2012 11:55 Your use of the JSTOR archive indicates your acceptance of the Terms & Conditions of Use, available at . http://www.jstor.org/page/info/about/policies/terms.jsp JSTOR is a not-for-profit service that helps scholars, researchers, and students discover, use, and build upon a wide range of content in a trusted digital archive. We use information technology and tools to increase productivity and facilitate new forms of scholarship. For more information about JSTOR, please contact [email protected]. Population Investigation Committee is collaborating with JSTOR to digitize, preserve and extend access to Population Studies. http://www.jstor.org
Transcript
Population Investigation Committee
The Changing Relation between Mortality and Level of Economic DevelopmentAuthor(s): Samuel H. PrestonReviewed work(s):Source: Population Studies, Vol. 29, No. 2 (Jul., 1975), pp. 231-248Published by: Population Investigation CommitteeStable URL: http://www.jstor.org/stable/2173509 .Accessed: 08/02/2012 11:55
Your use of the JSTOR archive indicates your acceptance of the Terms & Conditions of Use, available at .http://www.jstor.org/page/info/about/policies/terms.jsp
JSTOR is a not-for-profit service that helps scholars, researchers, and students discover, use, and build upon a wide range ofcontent in a trusted digital archive. We use information technology and tools to increase productivity and facilitate new formsof scholarship. For more information about JSTOR, please contact [email protected].
Population Investigation Committee is collaborating with JSTOR to digitize, preserve and extend access toPopulation Studies.
The Changing Relation between Mortality and Level of Economic Development
SAMUEL H. PRESTON*
The influence of economic conditions on mortality has been recognized at least since biblical times. Empiricism of the most casual sort was sufficient to establish the link between food supply and mortality. Other components of living standards, such as shelter and living space, awaited a revolution in scientific method before their influence was finally acknowledged. But recent years have witnessed a movement away from economic determinism in mortality analysis. It is widely believed that mortality has become increasingly dissociated from economic level because of a diffusion of medical and health technologies, facilities and personnel that occurred, in large part, independently of economic level, yet this position has its critics who have gained a sympathetic audience!1 This paper utilizes readily available evidence in a new but obvious way to estimate the relative contribution of economic factors to increases in life expectancy during the twentieth century. The evidence consists of cross-sectional relationships between national life expectancies and national income per head evaluated during three different decades of the twentieth century. These relationships are further used to assess the realism of certain economic-demographic models and to re-examine what have become classical distinctions regarding sources of mortality declines in Western and non-Western areas.
There are several reasons for focusing on national income rather than on another socio- economic variable. First, national income is probably the best single indicator of living standards in a country, since it comprises the value of all final products (goods and services) produced in a certain period. A wide range of these products can be expected to influence mortality, and expendi- tures on all of them are represented, with varying weights, in national income. It is the indicator most comprehensive of these multiple factors. Secondly, as the leading index of level of economic development, income per head is the focus of growth models from which policy measures are derived. Several of these models incorporate a relationship between mortality and level of economic development. For example, Leibenstein and Nelson argue that a small gain in income per head in low-income countries will tend to produce a decline in mortality and hence a more rapid rate of population growth that will push the population back to its initial level of income.2 Partly on this basis they argue for the necessity of a 'big push' in economic development in order to project the economy past the point where increments in income can be dissipated in this fashion. Hagen3 and Demeny,4 on the other hand, attack this type of 'big push' theory on the grounds that mort- ality has not been responsive to income but rather to public health factors. Which view prevails, obviously should have a decided impact on the policies pursued. Indeed, Taylor and Hall assert5
* The author would like to thank Avery Guest and James McCann for very useful comments on an earlier draft and John McDonald and James Weed for comments, and computational assistance. This research was supported by National Science Foundation grant 33864.
1 Harald Frederiksen, 'Determinants and Consequences of Mortality Trends in Ceylon', Public Health Reports, 76 (August 1961), pp. 659-663; 'Determinants and Consequences of Mortality and Fertility Trends', Public Health Reports, 81 (August 1966), pp. 715-727; 'Dynamic Equilibrium of Economic and Demographic Transition', Economic Development and Cultural Change, 14 (April 1966), pp. 316-322; David M. Heer, Readings on Population. Prentice-Hall, Englewood Cliffs, N.J., 1968.
2 Harvey Leibenstein, A Theory of Economic-Demographic Development. Princeton University Press, Princeton, 1954. Richard R. Nelson, 'A Theory of the Low Level Equilibrium Trap in Underdeveloped Economies', American Economic Review, 46 (December 1956), pp. 894-908.
3 Everett E. Hagen, On the Theory of Social Change. Dorsey Press, Homewood, Illinois, 1962. 4 Paul Demeny, 'Investment Allocation and Population Growth', Demography, 2 (1965), pp. 203-232. Carl E. Taylor and Marie-Franqoise Hall, 'Health, Population, and Economic Development', Science, 157
(3789) (1967), pp. 651-657.
23I
Population Studies 29, 2. Printed in Great Britain
232 SAMUEL H. PRESTON
that, because of a fear that public health programmes would be reduced in scope because they were being blamed for large increases in rates of population growth during the post-war period, international health specialists undertook to discredit their own role in mortality decline and to emphasize that of economic development.
Models attempting to simulate the future course of demographic and economic development must also address themselves to the question of the responsiveness of mortality to economic change. The International Labour Office,' in its simulation model of world employment/population relationships, plans to incorporate an assumption that life expectancy increases gradually with average household incomes. The Limits to Growth already includes a similar feature, although the parameter values appear to have been chosen in a somewhat arbitrary fashion.7
TYPES OF RELATIONSHIPS
National income per head in constant dollars is an index of the total value of final products produced per inhabitant during a defined period, exclusive of goods which merely replace losses from depreciation of capital equipment. There is no reason to expect a direct influence of national income per head on mortality; it measures simply the rate of entry of new goods and services into the household and business sectors. Its influence is indirect; a higher income implies and facili- tates, though it does not necessarily entail, larger real consumption of items affecting health, such as food, housing, medical and public health services, education, leisure, health-related research and, on the negative side, automobiles, cigarettes, animal fats and physical inertia.
Levels of mortality and economic development can be related to one another conceptually and substantively in a variety of ways. It is useful at the outset to distinguish among at least three different types of relationships that have been proposed by various analysts, although the exact formulation is often only implicit in their work. We disregard here the few works8 which deal with the relatively minor effect of mortality on economic processes and concentrate instead on income as it causally affects mortality level. In order to simplify the task, we confine the review to inter- national studies.
1. Level of Income Influences Level of Mortality at a Moment in Time
Attempts at empirical estimation have focused on the cross-sectional relationship between mortality and economic level. Most commonly, the relationship between national infant mortality rates and levels of income has been examined.9 Coefficients of correlation between the variables have been found to be consistently high, of the order of -0 8. The relationship is sufficiently strong for infant mortality rates on occasion to have been used as indicators of income levels when the requisite data for computing the latter are missing.'0 Gordon et al. have suggested that the death rate of children in their second year of life may be a better indicator of general health levels than
6 International Labour Office, Economic Demographic Modelling Activities of the World Employment Programme. Geneva. Mimeographed, 1973.
7 John P. Bongaarts, 'A Review of the Population Sector in The Limits to Growth', Studies in Family Planning, 4 (December 1973), pp. 327-334.
8 Robin Barlow, The Economic Effects of Malaria Eradication. Research Series No. 15, Bureau of Public Health Economics, School of Public Health. University of Michigan, 1968.
9 Irma Adelman, 'An Econometric Analysis of Population Growth', American Economic Review, 53 (1963), pp. 314-339; Leslie Corsa and Deborah Oakley, 'Consequences of Population Growth for Health Services in Less Developed Countries-An Initial Appraisal', Rapid Population Growth: Consequences and Policy Implications. National Academy of Sciences, Johns Hopkins Press, Baltimore, 1971; United Nations, Department of Economic and Social Affairs, Report on the World Social Situation. New York, 1961.
10 United Nations, Economic Commission for Europe, Economic Survey of Europe in 1969. Part I. Structural Trends and Prospects in the European Economy. New York, 1970.
RELATION BETWEEN MORTALITY AND LEVEL OF ECONOMIC DEVELOPMENT 233
infant mortality, which responds to a number of influences not present at other ages." Frederiksen provides partial support by showing that death rates at ages 1-4 are more closely correlated with gross national product per head in 15 countries than are death rates at ages 0-1, 20-24, or 65-69.12
One study, confined to less developed countries, has demonstrated a close cross-national relationship between an index of mortality at all ages and from all causes, life expectancy at birth, and the level of national income. Vallin suggests that no country can attain a life expectancy of more than 60 years without having made very substantial progress out of the category, 'less developed'.'3 At the same time, he stresses that the relationship is not deterministic and that a nation can, within limits, modify its life expectancy independently of its level of income. We shall re-examine the type of relationship studied by Vallin in a subsequent section.
On several occasions the United Nations Population Division has expressed the opinion that the cross-sectional relationship between mortality and level of economic development has become progressively weaker over time.'4 Others have echoed this claim and referred to a 'dissociation' of the two types of variables. However, data to support the claim have not been presented, and the present analysis fails to support the contention.
2. Level of Income Influences Rate of Change in Mortality
Arriaga and Davis suggest that the rate of improvement of mortality can be expected to be direct function of the existing level of mortality in a country.t5 They make it clear that they intend the existing level of mortality to be a proxy variable for a nation's level of income, so that the rate of change of mortality is considered to be a function of level of income. Their path-breaking analysis of developments in Latin America shows that the expected relationship applied prior to 1920 or 1930 but that thereafter the rate of change in life expectancy became independent of levels of income. A lack of relationship was also suggested by Stolnitz in his review of post-war mortality trends in less developed regions.'6
It is difficult to devise a plausible model in which the rate of change of mortality is a direct function of the level of income. One mechanism that conceivably could produce such a relationship occurs when a positive fraction of additions to current income is invested in various enterprises (such as housing, hospitals and training programme for medical personnel) that exert an effect on subsequent mortality. When the assumption is made that these investments continue to cumu- late at a given level of income (rather than simply to replace depreciating facilities and withdraw- ing personnel), it becomes plausible that higher incomes will produce larger gains in life expectancy. The assumption is treacherous, however, and lacks an empirical basis. It implies that a country at a constant level of income will experience continuous increments in its stock of health-related capital, which it can do in reality only if the proportion of income invested in such capital is constantly rising or if the rate of depreciation of such capital is constantly falling.
A second mechanism that could produce a relationship between the level of income and the rate of change of mortality is dependent upon an association between the level of income and the rate of change of income. If low-income countries typically have slowly growing economies, and if the growth of income is positively associated with the gain in life expectancy, then one would
" John E. Gordon, John B. Wyon and Werner Ascoli, 'The Second Year Death Rate in Less Developed Coun- tries', American Journal of Medical Science, 254 # 3 (September 1967), pp. 357-380.
12 Loc. cit., in footnote 1 (Determinants and Consequences of Fertility Trends). '3 Jacques Vallin, 'La mortalite dans les pays du Tiers Monde: evolution et perspectives', Population (Sept.-
Oct. 1968), pp. 845-868. '4 United Nations, Population Bulletin of the United Nations, No. 6. ('With special reference to the situation and
recent trends of mortality in the world'.) New York, 1963; Report on the World Social Situation. New York, 1965. '5 Eduardo E. Arriaga, and Kingsley Davis, 'The Pattern of Mortality Change in Latin America', Demography,
6 (August 1969), pp. 223-242. 16 George Stolnitz, 'Recent Mortality Trends in Latin America, Asia, anid Africa', Poplulation Studies 19
(November 1965), pp. 117-138.
234 SAMUEL H. PRESTON
observe larger gains in richer countries. This is probably the mechanism that Arriaga and Davis have in mind. However, the resulting relationship between level of income and change in mortality is clearly dependent upon the more fundamental (and logically separable) relationship between changes in income and changes in mortality.
We could continue to list possible reasons for expecting a relationship between level of income and change in mortality: for example, by assuming that a particular level of income is associated with a particular time-sequence of 'tastes' for health-related services or of health technology. But these mechanisms become increasingly speculative and groundless. There is no persuasive reason for expecting an association between income level and mortality change to exist independently of their joint association with other variables such as income change.
3. Rate of Change of Income Influences Rate of Change of Mortality A cross-sectional relationship between income and mortality, firmly established in the references cited above, also implies a dynamic relationship between the two. If the relationship is indeed causal, then a certain change in income should be associated with a particular change in mortality, with relative magnitudes of change determined by coefficients of the relationship. Additional elements may figure in the dynamic relationship, however. In particular, the cross-sectional relationship between mortality and income may itself be changing in response to new influences.
Malthus, of course, postulated a negative dynamic relationship between mortality and income level as a central tenet of his dismal theory. Those who have recently examined the relationship fail to uncover support for the postulated relationship. Stolnitz17 states that recent mortality trends in Asia, Latin America and Africa have been 'remarkably neutral' with respect to economic events. Demeny18 states that 'the large amount of statistical material on underdeveloped countries which is available for the past two or three decades reveals the almost complete absence of such a relationship.... There is a high degree of uniformity between mortality trends through time and in different countries - a uniformity not existent as far as trends in per capita income are con- cerned.' Although perhaps obvious, it may be worth emphasizing that such a pattern is not inconsistent with a tight cross-sectional relationship between mortality and economic level throughout the period under consideration, providing that the structure of the cross-sectional relationship is changing.
THE RELATIONS RE-EXAMINED
It is a straightforward matter to indicate what has happened to the cross-sectional relationship between income and mortality during the twentieth century. The accompanying figure presents a scatter diagram of the relationship between level of life expectancy (average, male and female) and national income per head (1963 U.S. dollars) in the 1900s, 1930s, and 1960s. The criterion for inclusion was simply the availability of measures of the two variables; however, in the 1960s countries with populations of less than two million were excluded in order to reduce sampling variability. The data on which the figure is based are presented in Appendix A. Life expectancy is computed by standard, direct methods with a few exceptions noted in the Appendix. Income figures are derived from Kuznets for the 1900s, from Kuznets and the United Nations Statistical Yearbook for the 1930s, and primarily from the United Nations Statistical Yearbook for the 1960s.19 A country's income in a particular year is first converted to U.S. dollars in that year by official exchange rates, and then converted to 1963 U.S. dollars by the series of official U.S. consumer price indexes. This is only one possible way of proceeding, and it is well known that any
17 Loc. cit., in footnote 16, p. 117. 18 Loc. cit., in footnote 4, p. 210. 19 Simon Kuznets, 'Quantitative Aspects of the Economic Growth of Nations. I. Levels and Variability of Rates
of Growth', Economic Development and Cultural Change, 5 (October 1956), pp. 5-94.
RELATION BETWEEN MORTALITY AND LEVEL OF ECONOMIC DEVELOPMENT 235
choice of prices for weighting output in time or space is arbitrary. The present procedure is the only one capable of yielding as much information as is utilized here. As noted below, it seems virtually certain that different procedure would not change the fundamental conclusions.
Attention is focused on the relationships in the 1930s and 1960s, for which most data are available. A logistic curve, plotted on the figure, was fitted to each set of data. The equations of the curves are.:20 80
0 1 +exp{-1 6251 +2 0768 (0 9317)Y'}
80 1960s:eoo =
8 1 + exp{-2 1354 + 2 ]697 (0.7672) Y'}
Scatter-diagram of relations between life expectancy at birth (e?) and national income per head for nations in the 1900s, 1930s, and 1960s.
1960's 0 O ? - ?u uu 70 _ O o os
65 - / D ? o ?
/ o> ~~~~~~~~~~~~~~~~~o 1 960's 35 1930's o 1930's
0 0 1900's
60 -o
e o 45 -
20 200 400 600 800 1000 1 200 1400 1600 1800
National income per head, 1963 U.S. dollars.
Placing all three sets of data on the same graph may obscure the fact that a curve fits the data for a particular period quite well throughout their range. The simple correlation between life expectancy and the logarithm of income per head is 0885 in the 1930s and 0880 in the 1960s; however, the simple logarithmic curves consistently overestimated life expectancy at lower levels of income, hence a more flexible curve was adopted. Despite the simplicity of approach, the following points can be made with some degree of assurance:
20 Y' is a linear transformation of national income per head in 1963 U.S. dollars (Y). Income is transformed to a scale ranging from 0 to 100: Ys:37
1930s: Y'=-1012- 37
1960s: Y = Y-39 81 2995- 3981
The value of 80 in the numerator was specified a priori; other parameters are derived by least-squares techniques. We experimented with values other than 80 in the numerator, but the highest amount of variance was explained when 80 was used, although differences were small. Data for Soviet-bloc countries in the 1960s are not represented on the graph or used to compute the coefficients of the line because of the high degree of uncertainty attached to their income estimates. This bloc will be considered in greater detail below. Incomes for Canada, Sweden, Switzer- land and the USA fell above the defined plotting range for the 1960's, although the data for these countries were used in computing the equation.
236 SAMUEL H. PRESTON
1. The relationship between life expectancy and national income per head has shifted upwards during the twentieth century
The point can be made with greatest certainty for the period from the 1930s to 1960s. There are relatively few data points at incomes less than $ 100 but such information as exists is broadly consistent with the conclusion. At higher income levels the shift is unmistakable. It amounts to some 10-12 years of life expectancy at incomes between $ 100 and $500 and progressively less thereafter. The upper asymptotes differ by 4-7 years, suggesting that the maximum average length of life to be attained by gains in income alone was some 66-8 years in the 1930s and 71 5 years in the 1960s. The upper asymptote of 73 9 years assumed by the official UN projections can be attained on a broad scale only if the curve continues to shift upwards.21
The curves can be compared horizontally as well as vertically. Such a comparison suggests that, in order to attain a particular value of life expectancy between 40 and 60, a range that in- cludes a large majority of the current world population, a nation required an income level approximately 2 6 times higher in the 1930s than in the 1960s (the constancy of this factor is one of the more intriguing features of the curves). No error in inter-temporal income comparisons seems capable of accounting for a change of anywhere near this magnitude.
There are too few observations in the 1 900s to make curve fitting worth while. But evidence that a shift occurred during the earlier period as well is persuasive. Of the ten observations for the decade of the 1900s, nine lie below the line computed for the 1930s.22 There is some suggestion that the shift during the earlier period as compared with the later may have been somewhat smaller at low levels of income and somewhat larger at higher levels, but firm conclusions are not warranted. In any case, there is little reason to think that factors exogenous to a country's level of economic development began to affect mortality levels significantly only after the 1930s, OI operated with significantly greater impact thereafter. While post-war anti-malarial campaigns are perhaps the most dramatic example of non-economic factors influencing mortality, they were often preceded by small, more persistent campaigns against specific diseases. For example, Bal- four, et al.23 report that colonial administrations achieved through specific public health measures the elimination of mortality from smallpox and cholera in Indonesia during the 1920s and major reductions from smallpox and plague in the Philippines by 1922. Mandle24 cites similar develop- ments in British Guiana during the 1920s with respect to malaria and respiratory and diarrhoeal diseases. In these instances, the mortality reductions were not accompanied by substantial economic progress and Mandle indicates that the 1920s were a period of economic stagnation in British Guiana. Petersen25 demonstrates that by 1920 Japanese colonial administrators in Taiwan had succeeded in bringing plague, cholera and smallpox under effective control through a variety of public health activities. Similar developments were unquestionably occurring in Western countries, as indicated below.
21 Cf. U.N. World Population Prospects As Assessed in 1963. Population Study No. 41. New York, 1966. There is mounting evidence that the UN mortality projections are overoptimistic, at least for countries at higher levels of life expectancy. For example, the projection assumed that the United States would achieve a life expectancy of 73 9 years by 1970. However, the actual life expectancy for the total population of the United States in 1970 was only 70 9 years (U.S. National Center for Health Statistics Vital Statistics of the United States, 1970, Vol. 2). The rate of improvement in Canada, Australia and New Zealand is also behind schedule.
22 The only exception is Japan. The unusually high life expectancy in Japan relative to income per head has also been noted by Taeuber (Irene B. Taeuber, The Population of Japan. Princeton University Press, Princeton, 1958 p. 284). She cites personal cleanliness and the assumption of health responsibility by government organizations as important factors in counteracting the adverse effects of poverty in Japan.
23 Marchall C. Balfour, Roger F. Evans, Frank W. Notestein and Irene B. Taeuber, Public Health and Demo- graphy in the Far East. Rockefeller Foundation, 1950.
24 Jay R. Mandle, 'The Decline of Mortality in British Guiana, 1911-1960', Demography, 7 (August 1970), pp. 301-316.
25 William Petersen, 'Taiwan's Population Problem' in S. Chandrasekhar, Asia's Population Problem. Allen & Unwin, London, 1967.
RELATION BETWEEN MORTALITY AND LEVEL OF ECONOMIC DEVELOPMENT 237
Since a country has attained a certain life expectancy in the 1960s at what is generally a much lower level of income than a country achieving that mortality level earlier, one would expect to observe certain differences in the structure of mortality by cause of death in the two populations. In particular, diseases most closely associated with standards of living, and least amenable to attack by specific medical and public health measures, ought to be relatively more prominent in the later population. Diarrhoeal diseases, highly influenced by nutritional adequacy and level of personal sanitation, represent such a group. Records of age-standardized death rates leave little doubt that countries achieving a certain level of mortality at a later point in time typically do so with a higher incidence of death from diarrhoeal diseases (and a lower incidence of death from respiratory tuberculosis) than countries achieving that level earlier. Thus, data on causes of death tend to confirm the shift in the income/mortality relationship that has been described.26
2. Factors exogenous to a country's current level of income probably account for 75-90 per cent of the growth in life expectancy for the world as a whole between the 1930s and the 1960s. Income growth per se accounts for only 10-25 per cent.
Evidence for this assertion is developed in the following way: We first assume that the curves fitted to data in the 1930s and 1960s accurately represent the relationship for all countries in those years, including those for which data are not available. We then substitute estimates of national income per head for each region of the world in the 1930s, use the 1930 curve to predict regional life expectancy, and weight the resulting predictions by population to estimate life expectancy for the world in the 1930s. Repeating the process but with income data for the 1960s, we produce an estimate of what life expectancy would have been in the 1960s with current income, but with the 1930 relationship between income and life expectancy still in effect. The difference between the two estimates indicates the gain in life expectancy attributable to income growth per se between the 1930s and the 1960s. We repeat the procedure once again, this time using the 1930 income data but the 1960 relationship; the difference between this estimate and the first indicates the gain in life expectancy attributable to shifts in the curve, or to factors exogenous to a country's contemporary level of economic development. The two differences, when added to the initial estimate, should come close to reproducing actual life expectancy in the 1960s.
Regional income data used in this procedure are presented in Appendix B. They are, of course, even less reliable than national figures and can be used to give no more than a crude esti- mate of the relative importance of different factors.
Results are presented in Table 1. If the 1930 relationship had remained in effect, the observed increases in income would have produced a gain in world life expectancy of 2 5 years between 1938 and 1963; the observed income changes combined with the 1960 relationship produce a gain of 1 3 years. These are estimates of the increase in life expectancy due to rising income during the period. The shift in the curve, on the other hand, produces a gain of 10 9 years when combined with the 1938 income distribution, and a gain of 9 7 years in combination with the 1963 distribu- tion. The total increase estimated through the use of this procedure is 12 2 years during the quarter- century. The predicted life expectancy of 56 4 years for the 1960s can be compared with the recent estimate by the United Nations Population Division27 of 53 for the period 1965-70 (no compar- able estimate is available for the 1930s). The comparison shows reasonable agreement considering the faulty but different data on which both estimates are based. Aggregation of individual countries into regional blocs would tend to produce overestimates of life expectancy, as noted below in Section 3, and could account for the excess in our estimate. However, the need to aggre- gate should not significantly bias the trends or the relative weighting of factors responsible.
26 Samuel H. Preston and Verne E. Nelson. 'Structure and Change in Causes of Death: An International Sum- mary', Population Studies, 28(1) (March 1974), pp. 19-51.
27 United Nations Population Division, The WorldPopulation Situation in 1970. Population Study No. 49. p. 32.
238 SAMUEL H. PRESTON
This analysis implies that around 16 per cent of the increase in life expectancy between 1938 and 1963 for the world as a whole is attributable to increases in average national income per se. A large but unspecifiable margin of error should be attached to this estimate because of faulty data and the simplicity of assumptions. The uncertainty is increased because the estimates are least reliable (based on fewest observations and on observations most susceptible to error) at lowest levels of income where a substantial proportion of the world's population was and is located. Nevertheless, it is almost inconceivable that income could be a factor of no consequence in the trends, in view of the tight cross-sectional relationship between income and mortality and the major improvements in income experienced by most regions during the period; on the other hand, it is implausible that income changes could account for more than one-third of the growth
TABLE 1. Life expectancy for the world implied by combinations of income distributions and relationships between income and life expectancy
Relationship between income and Regional income in Estimated change due life expectancy as observed in 1938 1963 to increase in income
1930s 44-2 46-7 2-5 Average 1960s 55-1 56-4 1-3 1-9
Estimated change due to shift in relationship 10-9 9 7 Total change Average 12-2
10-3
in life expectancy during the period, in view of the massive shift that occurred in the relation between income and life expectancy. The amount of change attributable to income growth varies, of course, from region to region and country to country; our calculations indicate that in Japan, for example, a majority of the expected increase in life expectancy was caused by rapid income growth. But it is doubtful whether a sufficient number of rigorous studies of mortality decline in different countries will soon be available to permit estimates based on a cumulation of state-level examinations. The more aggregative approach pursued here may serve to provide interim estimates of the magnitude of broad international developments.
Analysis of the 30 countries for which data on both income and life expectancy are available during both periods confirms that income changes were of minor importance in mortality trends. The zero-order correlation between the absolute change in life expectancy and the absolute change in income was strongly negative at -0 497; between the absolute change in life expectancy and the percentage change in income, it was weakly positive at 0 164. Both figures are highly influenced by the tendency noted above for life expectancy gains to be largest for countries starting at low- income levels, irrespective of income trends. The additive multiple regression equation containing all three terms (which are logically present when the underlying relation is logistic) is
Z = 21 364-0 01883 X1 +0 00128 X2 +0-38756 X3
(0.00990) (0 00588) (1 68985) R2 = 0441
where Z = Absolute change in life expectancy, 1930s to 1960s XI = Level of income per head, 1930s X2 = Absolute change in income per head, 1930s to 1960s X3 = Ratio, income per head, 1930s
(All income figures in 1963 U.S. dollars)
According to this equation, higher absolute and percentage growth in incomes contributed to a larger increase in life expectancy during the period, but both coefficients are insignificant (a =
RELATION BETWEEN MORTALITY AND LEVEL OF ECONOMIC DEVELOPMENT 239
0 10). Only the initial level of income is significant (with a sign that is opposite to that postulated by Arriaga and Davis).
This equation can also be used to estimate the contribution of income change to trends in life expectancy for this sample of countries. In particular, assume that no income growth occurs, i.e. that X2 and X3 had mean values of zero and one for the period, rather than their actual mean values of $631 and 1 678. According to the equation, zero economic growth would have reduced the mean gain in life expectancy by 1 07 years during the period. This represents 7-0 per cent of the actual mean growth. These figures are in reasonable agreement with those presented earlier. The earlier estimate is more reliable and useful because the relationship at any moment of time is less influenced by measurement error, is based on larger sample sizes, and is specifically aimed at world-wide coverage incorporating information on the relative size of different regions.
'Factors exogenous to a country's current level of income' are identified as being responsible for some 84 per cent of the increase in life expectancy during the period. The phrase is cumbersome, because the analysis does not account for the possibility that the shift in the curve itself may be partly a product of growth in income. If medical research in country A is facilitated by a larger national income and leads to mortality reductions in country B, income has influenced mortality. But neither country's mortality has been directly affected by its own income; the effect shows up as a shift in the curve. Even if country A were to enjoy the fruits of its own research, as long as those fruits were rapidly diffused to others, the originating country would be impossible to identify cross-sectionally; the situation would also find expression as a shift in the curve. In this case, in the vast majority of countries the change in mortality would also have been independent, of individual levels of current income. The curves do not adequately reflect factors associated with income in a small sub-set of countries that operate on mortality in a larger set. The major factors likely to operate in this fashion are a diffusion of technological advances and, to a lesser extent, of international transfer payments that distort the proportion of national income spent on health- related services or that affect the efficiency of those services. What the curves do reflect is the influence of a country's own level of income on mortality as it works endogenously through such factors as nutrition, medical and public health services, and literacy.
We have 'explained' only some 16 per cent of the rise in life expectancy during the period. Modest as this achievement is, it might be viewed in the context of statements appearing in numerous places that disentangling the separate effects of economic and social progress, as opposed to those of specific health measures, is impossible.28 Moreover, the figure is in sharp contrast to that promoted by certain other analysts. Harald Frederiksen has been the leading advocate of the importance of economic factors in mortality decline during the period. He argues that a rise in standards of living was responsible for virtually all of the spectacular post-war mortality decline in Ceylon.29 In later papers he implies that this conclusion extends to Mauritius and British Guiana and then to 21 nations.30 His arguments regarding Ceylon and British Guiana have been convincingly refuted by Newman3' and their international applicability is highly questionable in view of present findings.
Although we cannot account for the remaining increase in life expectancy, we can essentially rule out nutrition and literacy as major contributors. A graph has been prepared showing the relations between national levels of adult literacy and life expectancy around 1940 and in the 1960s. The same has been done for the relation between calorie consumption per head and life expectancy. There is no question that a vertical shift in the relationship, of a magnitude compar- able to that pertaining to income, occurs in both of these cases. If anything, the shift appears
28 U.N. Op. cit., in footnote 14, p. 15. 29 Loc. cit., in footnote 1 (1961). 30 Loc. cit., in footnote 1 (1966). 31 Peter Newman, Malaria Eradication and Population Growth: with special reference to Ceylon and British Guiana.
Research Series No. 10, Bureau of Public Health Economics, School of Public Health, University of Michigan, 1965; 'Malaria Control and Population Growth', Journal of Development Studies (January 1970), pp. 133-158.
240 SAMUEL H. PRESTON
larger in the relation between calories and life expectancy than in the relation presently under investigation. Income, food, and literacy were unquestionably placing limits on levels of life expectancy attained in the 1930s, as they do to-day. But they are not the only factors operating, and one must look elsewhere to account for the majority of recent trends.
3. Mortality has not become progressively dissociated from standards of living at a moment in time
This conclusion follows directly from our equal success in predicting life expectancy on the basis of national income in the 1930s and 1960s, as measured by the correlation coefficients presented earlier. There is virtually no difference between the log-linear correlation coefficients; the logistic form actually fits the points in the 1960s somewhat better than it did in the 1930s.32
More interesting than the correlations is the suggestion that the shape of the relation has changed. The later curve appears to be steeper at incomes under $400 and flatter at incomes over $ 600. In other words, for low-income countries, a given increment in income tends to be associated with a larger gain in life expectancy in the 1960s than in the 1930s. Far from becoming dissociated from income, mortality may have become more responsive to it in low-income countries where economic-demographic interrelations are most critical for economic prospects. Two interpreta- tions are consistent with such a change. First, new health measures may have evolved that are exploitable only by countries in which the lowest levels of income are past. Vaccination against tuberculosis and treatment of infectious diseases by antibiotics and by sulpha drugs are two im- portant examples of technical improvements during the post-war period the potential of which can be realized only by fairly costly expenditure. A second interpretation is that international health programmes, more vigorous during the post-war period, have focused their efforts on those underdeveloped countries with the greatest potential for mortality reduction; in general, these would be the more advanced of the group. There may be nothing callous or sinister about such a procedure. It is easy to demonstrate, for example, that in two countries with identical age schedules of death rates from malaria, eradication results in more years of life gained in the population with lower death rates from other causes. Unfortunately, documentation of the amount and effectiveness of international aid received for health proved to be a task far beyond the scope of this paper.
To claim on the one hand that income has been a trivial factor in recent mortality trends and, on the other, that it is still a critical determinant of mortality levels is not inconsistent. The point is simply that mortality is subject to multiple influences. The demonstration that income has not been important for recent trends is absolutely no justification for removing the relationship from growth models that aspire to realism. If anything, the data suggest that mortality has become more responsive to income in the range of greatest interest.
The justification for ignoring the mortality effects of income growth is not the absence of a relationship but rather its quantitative weakness in dynamic systems. Although the model of the low-level equilibrium trap associated with Nelson and Leibenstein is necessarily dynamic, no attempt has been made to identify the time frame within which it operates. In order to do this, we assume that the logistic curve estimated for the 1960s represents what life expectancy would be at all possible levels of income for a hypothetical country. We further assume that the country experiences a sudden growth of income of 20 per cent, calculate the expected increment in life expectancy associated with that increase, translate the increase into an increase in growth rates, and calculate how long it takes before the incremental growth results in a 20 per cent larger population. That is, how long will it take before the income-induced growth of population erases
32 The proportion of variance in loge (80/e? -1) explained by income is 0-800 in the 1930s and 0 847 in the 1960s.
RELATION BETWEEN MORTALITY AND LEVEL OF ECONOMIC DEVELOPMENT 241
the initial growth in income? One fundamental assumption underlying the calculation is that the additional survivors produced by the mortality decline will make no contribution to total product. If they do contribute, the actual amount of time required to regain the initial equilibrium will be even longer than estimated here. A second assumption is that the initial population is stable in the demographic sense and that a new stability is immediately established following the mortality change. Results are shown in Table 2.
TABLE 2. Estimated number of years required before an increase in income is erased by the larger population resulting from the induced decline in mortality
Minimum number of years required Initial level Expected gain in life expectancy Increase in intrinsic before increase in growth of income from 20 per cent increase in growth rate associated rate results in 20 per cent
income (years)* with mortality declinet larger populationl
* Estimated from logistic relation between national levels of life expectancy and income per head in the 1960s.
1 Estimated from Coale-Demeny 'West' female model life tables by relation derived in S. M. Preston, 'Effect of Mortality Change on Stable Population Parameters' Demography 11 (1). February, 1974, pp. 119-130. Assumes average age at childbearing of 30 years.
+ Estimated by assuming that incremental growth rate prevails throughout the period until the population has grown by 20 per cent.
For countries at every initial income level, more than a century is required for the population to grow sufficiently large for the initial gain in income to be totally dissipated. Experimentation with income growth of five per cent and 40 per cent, using the same set of initial incomes, demon- strates that population growth does not match income growth until more than a century has passed in any case. Moreover, these calculations are likely to be underestimates of the length of time required for two reasons: the incremental growth rate is assumed to apply over the entire period, rather than to attenuate as the population reapproaches its initial income level; and added persons almost certainly make some contribution to total product in the country. While the Malthusian mechanism should probably not be disregarded altogether, there is convincing evidence that it plays a minor role in contemporary economic-demographic processes. The low-level equilibrium trap shuts so slowly that escape seems inevitable.
3a. Some of the observed scatter in cross-sectional relations is almost certainly caused by differences in national income distributions
The obvious explanation for the non-linearity of the mortality/income relationship is that it reflects diminishing returns to increases in income. It reflects on a broad scale a wide variety of dose- response relationships at the individual level that themselves exhibit diminishing returns: diarrhoeal disease and nutrition; respiratory pneumonia and antibiotics; tuberculosis and living space, and so on. Moreover, it reflects aggregate-level relationships between national income and the success of programmes of sanitation, insect control, disease surveillance, and so on.
When individual-level factors are pertinent in mortality and when the individual-level dose- response relations are non-linear, as they almost certainly are in this case, then the distribution of income will affect the aggregate life expectancy. If the dose-response relations were all linear,
242 SAMUEL H. PRESTON
and identical from individual to individual and nation to nation, it is easy to show that a nation with a particular average income would have the same life expectancy regardless of how incomes were distributed. Suppose that in a particular country personal incomes followed some frequency distribution F( Y). With each Yis associated some life expectancy, e0( Y), such that e0( Y) = a + b Y. Then mean life expectancy for the population as a whole is
eo = JF(Y) eo(Y)dY = afF( Y)dY+ bJFF( Y) YdY = a+b?
Life expectancy for a population would be a linear function of average income in this case. Now suppose, on the other hand, that life expectancy is an increasing function of personal
income but subject to diminishing returns. A simple function of this type is
eo(Y) = a+bY-cY2 (o< Y< )
Then eo = JF(Y) [a+b Y-C Y2] dY = a+b Y-C f2 _ Ca2
At a certain level of average national income, life expectancy is lower the higher is the variance in the distribution of incomes (a2). The reason for this outcome is obvious: people with incomes below the average lose more years of life than are gained by people at the equivalent distance above the average. The greater the spread, the larger the net loss. The distribution of incomes is clearly a likely source of variance in the basic relation between national life expectancy and average national income and accounts for some of the scatter in the observed relationship. Unfortunately, the basic data on income distribution are inadequate to incorporate this factor explicitly in the analysis. Nevertheless, it is instructive to note that a country widely cited for large income in- equalities, Venezuela, has one of the largest negative deviations of any population. Actual life expectancy in 1965 fell short of that predicted on the basis of its average income by 4 8 years. Kuznets provides figures on the percentage of income earned by the top five per cent of families in 18 selected countries.33 Mexico and Colombia have the most uneven distributions of income on this index of any countries considered here, ranking 14th and 15th. These countries have life expectancies which are 6 7 and 2 1 years respectively below the levels predicted on the basis of average incomes. On the other hand, the Soviet-bloc countries, where income inequalities are expected to be smaller than those in other countries at equivalent average income levels, do not have exceptionally high life expectancies. Using the lower income figures for these countries in Appendix A, thereby producing lower estimates of expected life expectancy, one finds that the deviations of actual from predicted life expectancy in the 1960s are as follows: Bulgaria, + 2 1 years; Czechoslavakia, -05; East Germany, -08; Hungary, -2-4; Poland, -1 3; U.S.S.R., -0-2; Yugoslavia, - 16. Actual life expectancy falls short of that predicted in every case but one. These deviations of actual from expected life expectancy may be artificially depressed by virtue of the fact that they refer to the period 1960-61, whereas the curve was computed on the basis of points observed throughout the 1960s; if the curve had continued to shift upwards during the period, the earlier points would have fallen increasingly short of the line. On the other hand, the deviations are probably artificially raised by the use of income figures that are almost certainly too low for comparative purposes. Net material product excludes the monetary value of the greater part of general administrative and social services and falls some 10-20 per cent short of GNP.34 In general, there is no compelling evidence that greater income equality (or better health
33 'Quantitative Aspects of the Economic Growth of Nations', Economic Development and Cultural Change, 11 (January 1963).
34 World Health Organization, Third Report on the World Health Situation, 1961-1964. Official Records of the World Health Organization. No. 155, 1967.
RELATION BETWEEN MORTALITY AND LEVEL OF ECONOMIC DEVELOPMENT 243
services) have raised the life expectancy in Soviet-bloc countries above the level to be expected on the basis of their average incomes.
4. Factors exogenous to a nation's level of income per head have had a major effect on mortality trends in more developed as well as in less developed countries
It is traditional wisdom that the mortality decline in more developed areas was intimately depend- ent upon advances in standards of living, and hence proceeded slowly; in less developed areas, it was a result of the importation of medical techniques and personnel and hence was rapid.35 As a statement of general tendencies this assertion is probably correct, but it requires important qualifications. It is based on a comparison of rates of mortality decline between two equivalent levels rather than between two equivalent points in time and has focused on the most spectacular declines in less developed areas. But the period-specific influences that operated on mortality in less developed areas after the 1930s also operated on mortality in more developed areas. It is clear from the graph that factors exogenous to a nation's level of economic development have affected the level of mortality in both groups. The result is that, during the period, the distributions of mortality declines for the two groups, while favouring the lower income group, overlap. France gained 13 7 years of life expectancy between 1928-38 and 1965, while Indonesia gained 13 3 between 1930-35 and 1961. Austria gained 13 7 years between 1930-33 and 1966; the Philippines, according to official figures subject to considerable error, gained 108 between 1938 and 1960, representing about the same annual rate. Spain, an intermediate case, showed a higher rate of improvement than any of these countries, with a gain of 21 6 years between 1930-31 and 1967. It is implausible that the tropical African countries with life expectancies in the high 30s or lower 40s during the 1960S36 could have gained at a rate as rapid as that in France, Austria, or Spain during the preceding 30 years.
Similarly, the emphasis on the uniqueness of specifically imported health technology in less developed countries appears misdirected when equivalent periods rather than stages are considered. To be sure, the nature of imported technologies differed. It seems to have been predominantly broad-gauged public health programmes of insect control, environmental sanitation, health education, and maternal and child health services that transformed the mortality picture in less developed areas, while it was primarily specific vaccines, antibiotics, and sulphonamides in more developed areas. But the technologies were not, for the most part, indigenously developed by countries in either group. Universal values assured that health breakthroughs in any country would spread rapidly to all others where the means for implementation existed.
The importance of exogenous, largely imported, health technology in the now-developed countries may have been underestimated for earlier periods as well. The disappearance of the plague during the seventeenth and eighteenth centuries was probably the first major event in three centuries to transform Western mortality patterns systematically. The reasons for the disappearance are obscure, but it does not appear to have been closely related to a nation's rate or level of economic development. Shrewsbury suggests that a change in housing patterns may have been responsible in England,37 but Cipolla points out that the plague essentially disappeared from Italy during a period when housing patterns were stable and in the face of an economic decline.38 The decline of the plague was followed by major reductions in mortality from smallpox in many countries, unquestionablv a product of inoculation in the latter half of the eighteenth
3 Kingsley Davis, 'The Amazing Decline of Mortality in Underdeveloped Areas', American Economic Review, 46 (May 1956), pp. 305-318; Abdel R. Omran, 'The Epidemiologic Transition', Milbank Memorial Fund Quarterly, 49, 1 (October 1971), pp. 509-538.
36 William Brass et al., The Demography of Tropical Africa. Princeton University Press, Princeton, 1968. 3 J. F. D. Shrewsbury, A History of Bubonic Plague in the British Isles. Cambridge University Press, 1970. 38 Carlo M. Cipolla, 'Four Centuries of Italian Demographic Development', in Population in History, D. V. Glass
and D. E. C. Eversley (eds), pp. 570-587. Edward Arnold, London, 1965.
244 SAMUEL H. PRESTON
century and vaccination throughout the nineteenth.39 The techniques, once proved effective, spread rapidly from country to country. Inoculation itself appears to have been introduced from China, providing an ironic variation on the theme of transferring health technologies from Western to non-Western areas.
For the period after 1850, the emphasis on endogenous factors appears even less appropriate. As Stolnitz suggests,40 it is difficult to account for the simultaneity of unprecedentedly rapid mortality declines after 1880 in many Western countries except by reference to factors that cut across national boundaries. The most obvious such set of factors was a result of the empirical validation of the germ theory of disease during this time. Thomas McKeown has been the most outspoken advocate of improved living standards as the motivating factor in Western mortality declines. He argues that a rising standard of living was the principal cause of increased life expect- ancy in England between 1838 and the present.4' But his arguments are based principally upon a consideration of the period 1851-60 to 1891-1900, during which time life expectancy increased by only about six to seven years. The increase of 24-25 years during the twentieth century is essentially unaccounted for.42 He may be correct that specific drugs were not a factor until after 1935, but such a result does not require that most of the remaining explanation be based on advances in living standards. The germ theory of disease stimulated many innovations other than drugs and vaccines, such as improved antiseptic practices, quarantines, and segregation of infectious patients, and it gave impetus to the movements for cleaner food and water, better personal sani- tation, and improved infant feeding. The logistic curve for the 1960s suggests that, even if England and Wales had experienced no improvement in living standards between 1901-10 and the present, its life expectancy could be expected to have increased from 50 4 years to 69 6 years. This is the figure achieved by Hong Kong in 1966, at a lower national income than that of England in the first decade of the century, and is considerably exceeded by Greece in 1966-68, at a slightly higher level. The expected increase in life expectancy on the assumption of no growth accounts for 88 per cent of that which actually occurred. There is no guarantee that such an increase would have taken place, of course, and the estimate merely says that economic advance was not an essential prerequisite to a major increase in life expectancy, rather than assigns weight to the factors actually operative. But it surely adds credibility to the view that economic advance was not a major factor in that increase.
39Michael Drake, Population and Society in Norway, 1735-1865, pp. 41-54. Cambridge University Press, Cambridge, 1969. P. E. Razzell, 'Population Change in Eighteenth Century England: A Re-Appraisal', Economic History Review, 18, 1965, pp. 312-332. Reprinted in Population in Industrialization, Michael Drake (ed.). Methuen & Co., London, 1969.
40 G. Stolnitz, 'A Century of International Mortality Trends: I' Population Studies 9, 1955, pp. 24-55. 41 Thomas McKeown, 'Medicine and World Population', in Public Health and Population Change, Mindel C.
Sheps and Jeanne Clare Ridley (eds), p. 38. University of Pittsburgh, Pittsburgh, 1965. 42 Life expectancy (average, male and female) is estimated to be 41-76 in 1861 and 47 40 in 1901; in 1838-54
40-8 (Coale and Demeny collection of national life tables); and in 1967, 72-12; Nathan Keyfitz, and Wilhelm Flieger, World Population: An Analysis of Vital Data. University of Chicago, Chicago, 1968; Population: Facts and Method, of Demography. W. H. Freeman, San Francisco, 1971.
RELATION BETWEEN MORTALITY AND LEVEL OF ECONOMIC DEVELOPMENT 245
APPENDIX A TABLE A-1. Estimates of life expectancy and income per headfor various
countries in the 1900s
National income Country Year Life expectancy Year per head in 1963
at birth U.S. dollars
M F Denmark 1901-05 52-9 54-5 1899-1908 428 France 1898-1903 45-31 47 00 1901-10 383 Germany 1901-10 44-82 46-57 1900-09 776 Hungary 1900-01 37-1 37-5 1899-1901 267 Italy 1901-11 44-24 44-53 1899-1908 226 Japan 1899-1903 43 97 44-41 1898-1907 68 Netherlands 1900-09 51P0 52-2 1900-08 504 Spain 1910 40-92 41-74 1906-13 225 United Kingdom 1910-10 48-53 5045 1900-09 551 United States 1909-11 49-86 51 55 1904-13 892
Sources: (1) Life expectancy from United Nations, Demographic Yearbook, 1967, (2) Income per head compiled from Simon Kuznets, 'Quantitative Aspects of the Economic
Growth of Nations. I', Economic Development and Cultural Change. 5, 1 (Oct. 1956), pp. 5-94. Exchange rates from United Nations Statistical Yearbook, 1949-50, U.S. consumer price indexes from U.S. Bureau of Census, Statistical Abstract of the United States, 1965.
TABLE A-2. Estimates of life expectancy and income per headfor various countries in the 1930s
Life National income Country Year expectancy Source Year per head in 1963 Source
1929 and 1933 Puerto Rico 1939-41 45 07 47-11 (1) 1940 325 (7) Spain 1930-31 48-74 51-94 (1) 1929-35 272 (8) Sweden 1928-32 62-02 64-11 (5) 1930 651 (7) Switzerland 1929-32 59-17 63-05 (1) 1931 826 (7) United Arab Rep. 1936-38 35-65 41-48 (1) 1939 60 (10) United Kingdom 1930-32 58-74 62-88 (1) 1925-34 624 (8) United States 1929-38 59 2 62-8 (6) 1929-38 1,012 (8) Venezuela 1936 33-29 34-47 (9) 1940 105 (10)
Sources: (1) United Nations, Demographic Yearbook, 1967. (2) Samuel H. Preston, Nathan Keyfitz, and Robert Schoen, Causes of Death: Life Tables for
National Populations. Seminar Press, New York, 1972. (3) K. Dandekar, 'Mortality and Longevity in India, 1901-61' in K. E. Vaidyanathan (ed.), Studies
on Mortality in India. Grandhigram Institute of Rural Health, 1972. (4) Widjojo Nitisastro, Population Trends in Indonesia. Cornell University Press, 1970. (5) Nathan Keyfitz and Wilhelm Flieger, World Population. University of Chicago, 1968. (6) Annual average for 1929-38 from United States Department of Health, Education, and Welfare,
Vital Statistics of the United States, 1960, Volume II, Section 2. (7) Compiled from figures on national income and exchange rates in United Nations, Statistical
Yearbook, 1949-50, and on population in United Nations Demographic Yearbook, 1948 and on U.S. Consumer Price Indexes in U.S. Bureau of Census, Statistical Abstract of the United States, 1965.
(8) Compiled from Simon Kuznets, 'Quantitative Aspects of the Economic Growth of Nations. I', Econonmic Development and Cultural Change, 5, 1 (1956), pp. 5-94. Exchange rates, population, and price indexes from same sources as in (7).
(9) Eduardo E. Arriaga, New Life Tables for Latin American Populations in the Nineteenth and Twentieth Centuries. Population Monograph #3. Institute of International Studies. University of California, Berkeley, 1968. Indirect stable population techniques are employed.
(10) U.S. Bureau of the Budget figures cited in 'Food, Income, and Mortality', Population Index, 13, 2 (April 1947), pp. 96-103. Price indexes from same source as in (7).
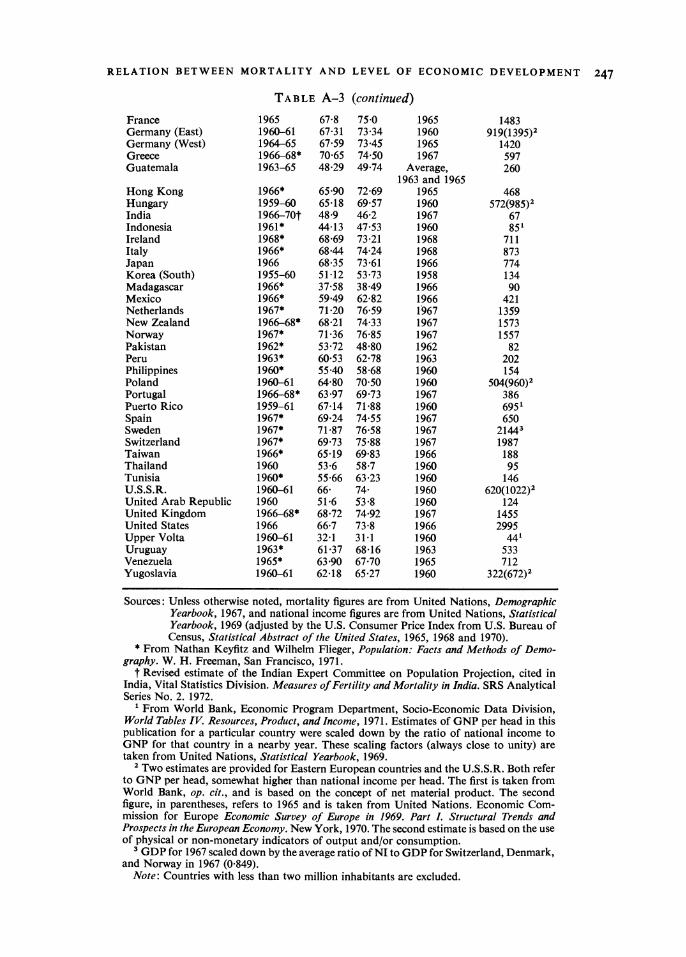
TABLE A-3. Estimates of life expectancy and national income per headfor various countries in the 1960s
Year of Life Year of National income Country mortality expectancy income per head in 1963
Sources: Unless otherwise noted, mortality figures are from United Nations, Demographic Yearbook, 1967, and national income figures are from United Nations, Statistical Yearbook, 1969 (adjusted by the U.S. Consumer Price Index from U.S. Bureau of Census, Statistical Abstract of the United States, 1965, 1968 and 1970).
* From Nathan Keyfitz and Wilhelm Flieger, Population: Facts and Methods of Demo- graphy. W. H. Freeman, San Francisco, 1971.
t Revised estimate of the Indian Expert Committee on Population Projection, cited in India, Vital Statistics Division. Measures of Fertility and Mortality in India. SRS Analytical Series No. 2. 1972.
' From World Bank, Economic Program Department, Socio-Economic Data Division, World Tables IV. Resources, Product, and Income, 1971. Estimates of GNP per head in this publication for a particular country were scaled down by the ratio of national income to GNP for that country in a nearby year. These scaling factors (always close to unity) are taken from United Nations, Statistical Yearbook, 1969.
2 Two estimates are provided for Eastern European countries and the U.S.S.R. Both refer to GNP per head, somewhat higher than national income per head. The first is taken from World Bank, op. cit., and is based on the concept of net material product. The second figure, in parentheses, refers to 1965 and is taken from United Nations. Economic Com- mission for Europe Economic Survey of Europe in 1969. Part L Structural Trends and Prospects in the European Economy. New York, 1970. The second estimate is based on the use of physical or non-monetary indicators of output and/or consumption.
3 GDP for 1967 scaled down by the average ratio of NI to GDP for Switzerland, Denmark, and Norway in 1967 (0 849).
Note: Countries with less than two million inhabitants are excluded.
248 SAMUEL H. PRESTON
APPENDIX B
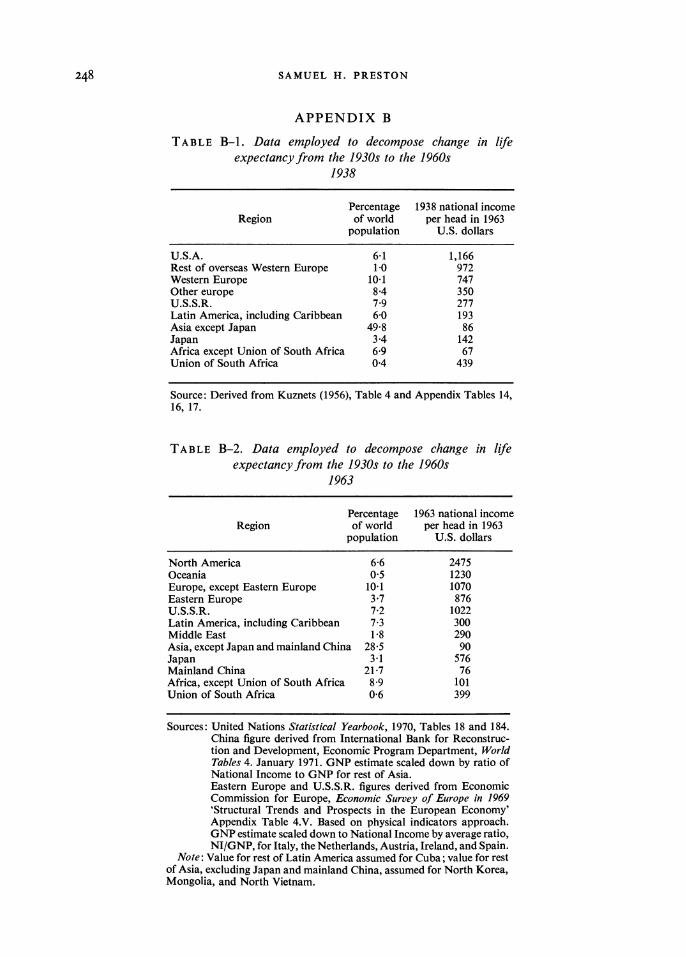
TABLE B-1. Data employed to decompose change in life expectancy from the 1930s to the 1960s
1938
Percentage 1938 national income Region of world per head in 1963
population U.S. dollars
U.S.A. 6-1 1,166 Rest of overseas Western Europe 1-0 972 Western Europe 10-1 747 Other europe 8-4 350 U.S.S.R. 7 9 277 Latin America, including Caribbean 6-0 193 Asia except Japan 49-8 86 Japan 3-4 142 Africa except Union of South Africa 6-9 67 Union of South Africa 0-4 439
Source: Derived from Kuznets (1956), Table 4 and Appendix Tables 14, 16, 17.
TABLE B-2. Data employed to decompose change in life expectancy from the 1930s to the 1960s
1963
Percentage 1963 national income Region of world per head in 1963
population U.S. dollars
North America 6-6 2475 Oceania 0.5 1230 Europe, except Eastern Europe 10-1 1070 Eastern Europe 3*7 876 U.S.S.R. 7-2 1022 Latin America, including Caribbean 7-3 300 Middle East 1 8 290 Asia, except Japan and mainland China 28-5 90 Japan 3-1 576 Mainland China 21-7 76 Africa, except Union of South Africa 8-9 101 Union of South Africa 0-6 399
Sources: United Nations Statistical Yearbook, 1970, Tables 18 and 184. China figure derived from International Bank for Reconstruc- tion and Development, Economic Program Department, World Tables 4. January 1971. GNP estimate scaled down by ratio of National Income to GNP for rest of Asia. Eastern Europe and U.S.S.R. figures derived from Economic Commission for Europe, Economic Survey of Europe in 1969 'Structural Trends and Prospects in the European Economy' Appendix Table 4.V. Based on physical indicators approach. GNP estimate scaled down to National Income by average ratio, NI/GNP, for Italy, the Netherlands, Austria, Ireland, and Spain.
Note: Value for rest of Latin America assumed for Cuba; value for rest of Asia, excluding Japan and mainland China, assumed for North Korea, Mongolia, and North Vietnam.