Page 1
Power-law performance ranking relationship in exponentially growing populations
Chunhui Cai1, Da-Liang Li2, Qi Ouyang2, Lei-Han Tang1,3, Yuhai Tu2,4
1Hong Kong Baptist University
2CQB-Peking University
3Beijing Computational Science Research Center
4IBM TJ Watson Research Center
6th KIAS Conference on StatPhys: NCPCS 2014, 8-11 July, 2014, Seoul Korea
Page 2
Outline
•TOP500: just another power-law?
•Phenomenology: The constant growth and insertion hypothesis
•A possible microscopic mechanism
-The pick-and-improve-retire (PAIR) model
-Mapping to randomly branching tree and extremal value statistics
-Velocity selection
-Front profile and power-law distribution
-Rank-performance fluctuations
•Analysis of the SC500 data: comparison with theory
Push or pull fronts?
•Summary and conclusions
Page 3
Hong Kong is currently not on the list!
November 2007 releaseCountries Count Share % Rmax Sum (GF) Rpeak Sum (GF) Processor Sum
United States 283 56.60% 4164312 6213939 1024339
United Kingdom 48 9.60% 512400 818366 115244
Germany 31 6.20% 536464 753361 143392
Japan 20 4.00% 291118 405634 64218
France 17 3.40% 222555 342988 54548
Taiwan 11 2.20% 102966 162821 14024
China 10 2.00% 87176 155856 22836
India 9 1.80% 194524 303651 34932
Spain 9 1.80% 137452 212225 24332
Russia 7 1.40% 82615 122756 11796
Sweden 7 1.40% 186176 278733 27720
Switzerland 7 1.40% 74568 102418 20368
Page 4
Proposed configuration
Slope = 0.75
Doubles each year
Page 7
Seen in many big engineering projects, economic and social data (known as Pareto distribution or Zipf’s law)
Exponents vary over a broad range
Are there common mechanisms?
Page 8
Phenomenology:
The constant growth and insertion hypothesis
Li Daliangln(RMax)
ln(rank)
ln(b)
ln(1+a)insertion
growth
Page 9
Li Daliang
Phenomenology:
The constant growth and insertion hypothesis
ln(RMax)
ln(rank)
ln(b)
ln(1+a)
X 1+a( )R,t+1( ) =X(R,t) insertion
X(1,t+1)=bX(1,t) growth
ln[X(R,t+1)]
ln[X(R,t)]X(R,t)=X0e
gtR−γ
growth rate: g=lnb
exponent: γ =lnb
ln(1+a)
Solution:
Page 10
Outline
•TOP500: just another power-law?
•Phenomenology: The constant growth and insertion hypothesis
•A possible microscopic mechanism
-The pick-and-improve-retire (PAIR) model
-Mapping to randomly branching tree and extremal value statistics
-Velocity selection
-Front profile and power-law distribution
-Rank-performance fluctuations
•Analysis of the SC500 data: comparison with theory
Push or pull fronts?
•Summary and conclusions
Page 11
The punch line
When embarking on an expensive project, decisions are
made by following a local leader in the sector.
Performance of the newly introduced node is a certain
percentage better than the existing one.
Page 12
The pick-and-improve-retire (PAIR) model
s = rate a given node acquires a follower.
r = rate a given node retires (< s).
Performance X of nodes measured on logarithmic scale x = log X.
ρ(y) = distribution of the increment in performance (log scale) for the follower, taken here to be a Gaussian function,
ρ(y) = 1
2πσ 2exp −
y−μ( )2
2σ 2
⎛
⎝⎜⎜
⎞
⎠⎟⎟
simulation
Page 13
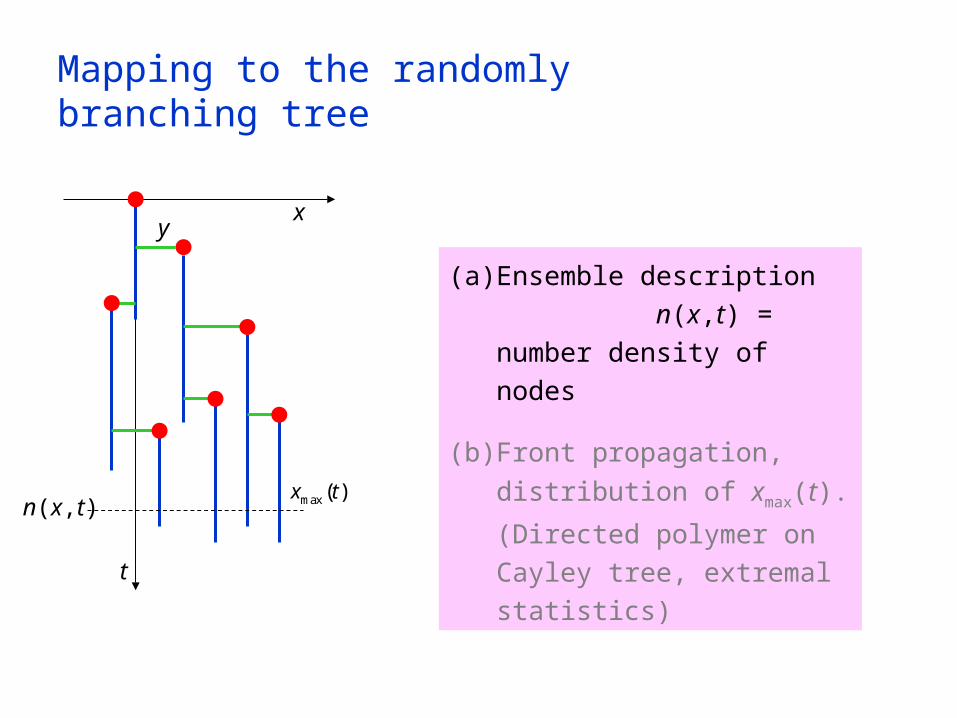
Mapping to the randomly branching tree
(a) Ensemble description
n(x,t) = number density of nodes
(b) Front propagation, distribution
of xmax(t). (Directed polymer on
Cayley tree, extremal
statistics)
t
x
max ( )x t
y
n(x,t)
Page 14
Ensemble description
t
xy
n(x,t +dt) =(1−rdt)n(x,t) + sdt dyρ(y)n(x−y,t)
−∞
∞
∫
dt
∂n∂t
=−rn+ s dyρ(y)n(x−y,t)−∞
∞
∫
Look for traveling wave with exponential front,
n(x,t) =n0 exp −λ x−vt( )⎡⎣ ⎤⎦
vλ =−r + sexp λμ +
12λ 2σ 2⎛
⎝⎜⎞
⎠⎟
Page 15
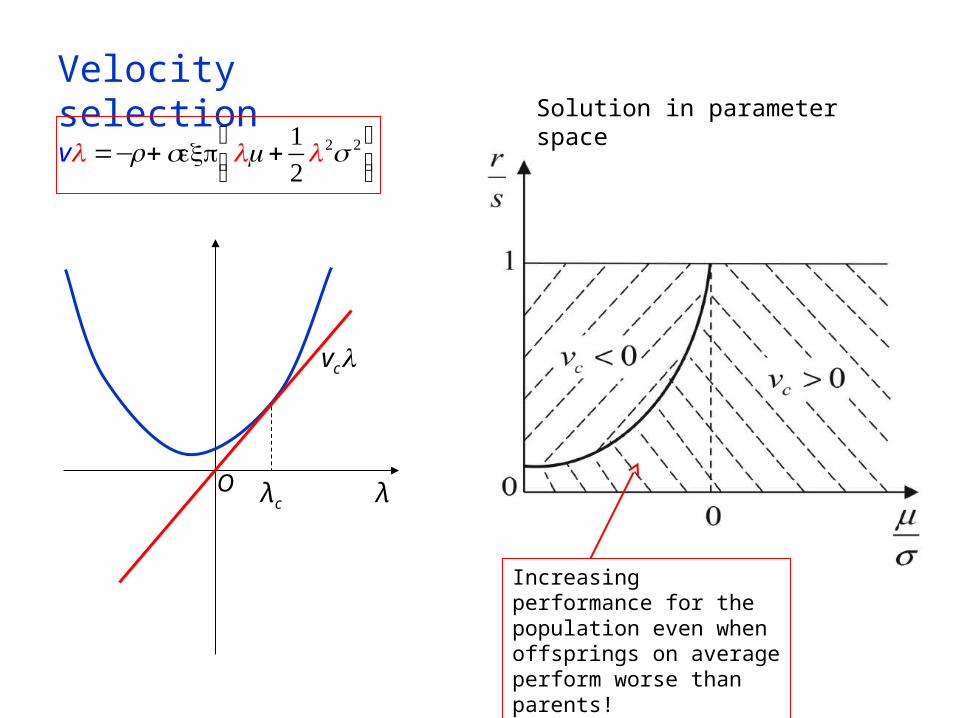
Velocity selection
vλ =−r + sexp λμ +
12λ 2σ 2⎛
⎝⎜⎞⎠⎟
λO
cv λ
Solution in parameter space
Increasing performance for the population even when offsprings on average perform worse than parents!
λc
Page 16
Performance-rank distribution
R(x,t) = n(x,t)dx=
n0
λcx
∞
∫ e−λc(x−vct) =n0
λc
X−λce(λcvc)t
lnx X=
Number of nodes with performance better than x
X (R,t) =X0evctR−γ Exponential growth
with power-law rank distribution
γ =λc−1
Agrees perfectly with simulations!
n(x,t) =n0 exp −λ x−vt( )⎡⎣ ⎤⎦
Page 17
Rank-performance fluctuations
xi =ln(RMaxi )
δx2 : R−ζ
ζ =?
Page 18
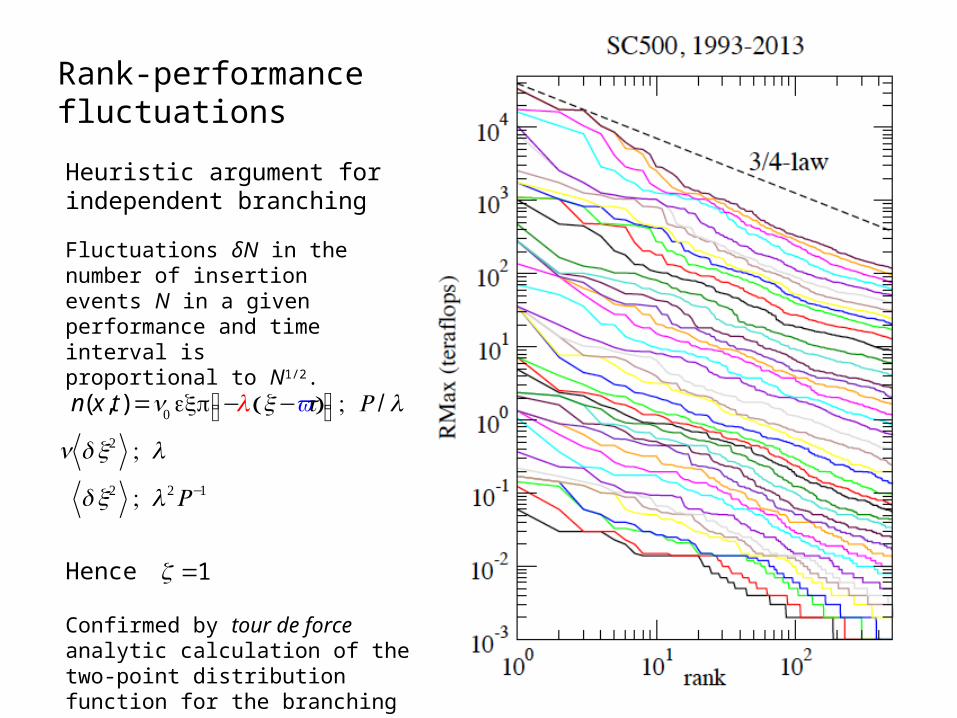
Rank-performance fluctuations
Heuristic argument for independent branching
Fluctuations δN in the number of insertion events N in a given performance and time interval is proportional to N1/2.
n(x,t) =n0 exp −λ x−vt( )⎡⎣ ⎤⎦ ; R / λ
n δx2 ; λ
δx2 ; λ 2R−1
Hence ζ =1
Confirmed by tour de force analytic calculation of the two-point distribution function for the branching process
Page 19
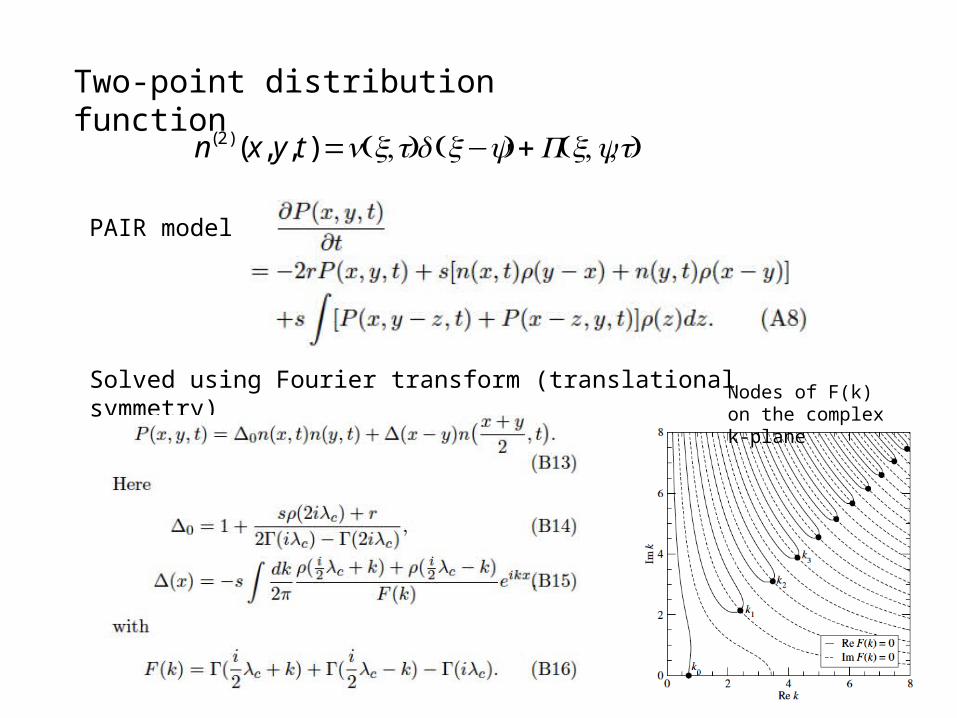
Two-point distribution function
n(2)(x, y,t)=n(x,t)δ (x−y)+P(x,y,t)
PAIR model:
Solved using Fourier transform (translational symmetry)Nodes of F(k) on the complex k-plane
Page 20
Outline
•TOP500: just another power-law?
•Phenomenology: The constant growth and insertion hypothesis
•A possible microscopic mechanism
-The pick-and-improve-retire (PAIR) model
-Mapping to randomly branching tree and extremal value statistics
-Velocity selection
-Front profile and power-law distribution
-Rank-performance fluctuations
•Analysis of the SC500 data: comparison with theory
Push or pull fronts?
•Summary and conclusions
Page 22
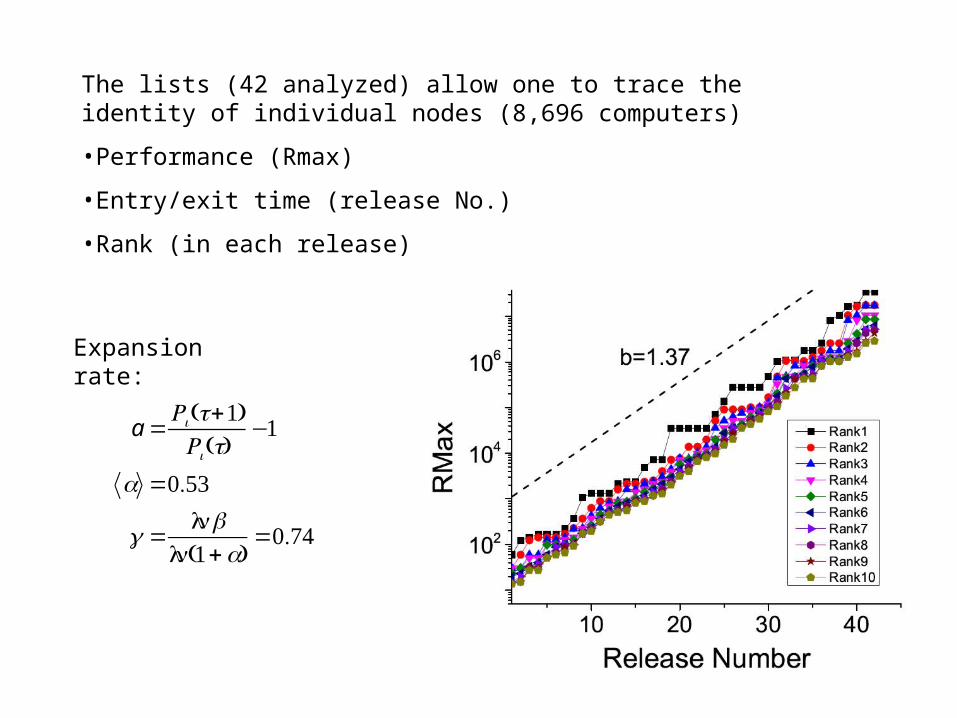
The lists (42 analyzed) allow one to trace the identity of individual nodes (8,696 computers)
•Performance (Rmax)
•Entry/exit time (release No.)
•Rank (in each release)
Expansion rate:
a =Ri (t+1)Ri (t)
−1
a =0.53
γ =lnb
ln(1+a)=0.74
Page 23
Rank-resolved insertion and retirement rates
s =0.5
r =0.2
Weak dependence on rank
Page 24
The parent-offspring association
Each new node in a new release belongs to one of the following 4 categories:
1.Same location and same computer (2596 cases) “copier”
2.Same location but a new computer (3781 cases) “upgrader”
3.New location and same computer (1826 cases) “copier”
4.New location and new computer (1931 cases) “intruder”, about 19%
Used in the simulation of the PAIR model
Page 25
Comparison between SC500 data and simulations
SC500 data shows stronger fluctuation with ζ=0.8.
Page 26
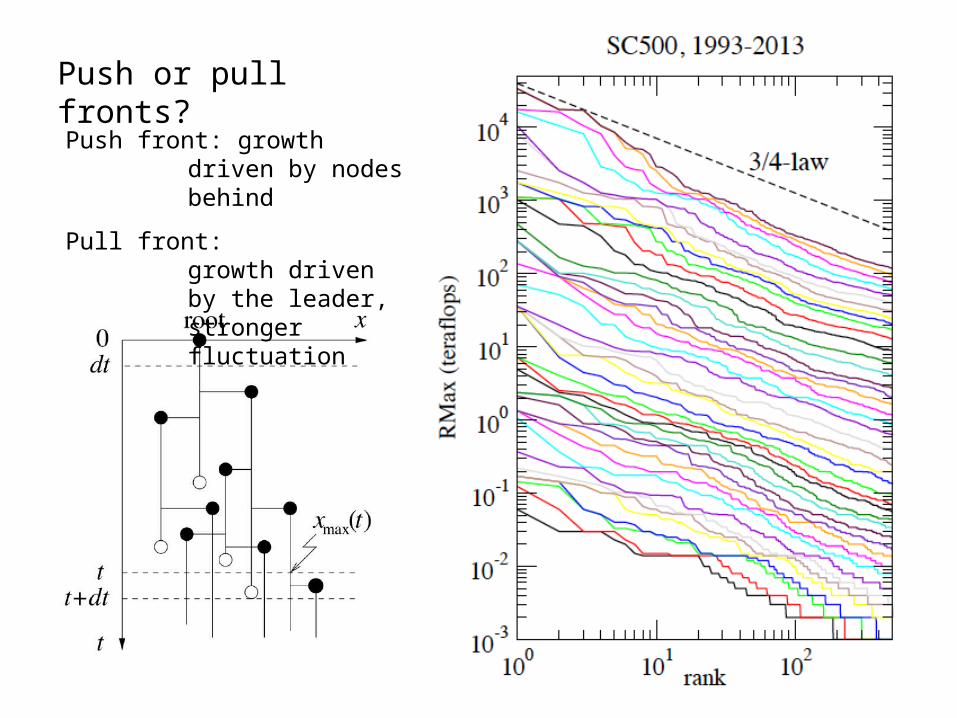
Push or pull fronts?
Push front: growth driven by nodes behind
Pull front: growth driven by the leader, stronger fluctuation
Page 27
Summary
•Pareto distribution and Zipf’s law arises under the “constant growth and expansion rate” hypothesis
•A microscopic PAIR model is mapped to the randomly branching tree problem
•The microscopic model not only yields the observed power-law rank-size distribution, but also exhibits a fluctuation phenomenon with 1/R scaling.
•Detailed analysis of the SC500 data confirms hypothesis and allows determination of the model parameters.
•Somewhat stronger fluctuations observed in the real data. Alternation of push and pull fronts?
Page 28
Thank you for your attention!