1 Preparation of single-phase C–S–H specimens from hydrated tricalcium silicate pastes Jeffrey J. Chen a , Jeffrey J. Thomas b , and Hamlin M. Jennings ab* a Northwestern University, Department of Materials Science and Engineering, Evanston, IL 60208 b Northwestern University, Department of Civil and Environmental Engineering, Evanston, IL 60208 * Corresponding author: Tel: +1–847–491–4858, Fax: +1–847–491–4011 Email addresses : [email protected] (J.J. Chen), [email protected] (H.M. Jennings) Keywords: Calcium silicate hydrate (C–S–H), characterization, leaching, degradation Abstract. Although the preparation of single-phase C–S–H specimens is usually from the reaction of CaO and SiO 2 or from the double decomposition of a Ca-salt and an alkali silicate in aqueous solution, recent evidence in the literature shows that these ‘synthetic’ preparations (especially double decomposition) produce nanostructures at high Ca/Si ratios quite different than that of C–S–H gel formed in mature C 3 S or cement paste. These differences are most clearly evident from the fact that C–S–H gel has a maximum Ca/Si ratio of 1.7–1.8 while that of synthetic C–S–H is generally near 1.5. In this study, a methodology for preparing homogeneous, single-phase specimens of C–S–H gel from fully-hydrated C 3 S paste is presented. The Ca/Si ratio of these specimens, which can vary between approximately 0.7–1.8, can be decreased and increased by careful decalcification (in concentrated NH 4 NO 3 solution) and recalcification (in Ca(OH) 2 solution), respectively; the latter process is also shown to remove the compositional gradients in a leached solid, thereby enhancing the homogeneity of the specimen. This preparation technique is therefore valuable for structural studies of C–S–H gel at low Ca/Si ratios (which are prevalent in chemically degraded or blended cement pastes) and especially at high Ca/Si ratio, where the structure of C–S–H gel is most controversial. 1. Introduction 1.1. C–S–H gel versus ‘synthetic’ C–S–H. The principal product at room temperature in the paste hydration of tricalcium silicate (C 3 S), the major constituent phase of portland cement, is a particular calcium silicate hydrate known as C–S–H gel. Determination of the structure of this compound is complicated by the lack of long-range order, by variation in composition at a submicron scale, and by the potential admixture with portlandite and unreacted C 3 S. To obtain more homogeneous specimens, the majority of structural studies (e.g., [1-7]) have used single-phase or ‘synthetic’ C–S–H prepared by combining CaO and SiO 2 or by reacting an alkali silicate with a Ca-salt (i.e., double decomposition) in aqueous solution. In both preparations, the Ca/Si ratio of C–S–H is easily controlled by altering the initial molar ratio of CaO to SiO 2 from 0.7 to a maximum near 1.5. This method is useful and widely exploited, since arguably the most effective strategy for understanding the structural variations in C–S–H is to analyze the systematic changes in C–S–H with varying Ca/Si ratio. Our recent studies [8-10] represent some of the first efforts to directly examine the variations in structure at different Ca/Si ratios of C–S–H gel formed in a fully-hydrated C 3 S paste. Phase equilibrium results [8] illustrate important structural differences at high Ca/Si ratios between mature C–S–H gel and
Transcript
1
Preparation of single-phase C–S–H specimens from hydrated tricalciumsilicate pastes
Jeffrey J. Chena, Jeffrey J. Thomasb, and Hamlin M. Jenningsab*
aNorthwestern University, Department of Materials Science and Engineering, Evanston, IL 60208bNorthwestern University, Department of Civil and Environmental Engineering, Evanston, IL 60208
Abstract. Although the preparation of single-phase C–S–H specimens is usually from the reaction ofCaO and SiO2 or from the double decomposition of a Ca-salt and an alkali silicate in aqueous solution,recent evidence in the literature shows that these ‘synthetic’ preparations (especially doubledecomposition) produce nanostructures at high Ca/Si ratios quite different than that of C–S–H gel formedin mature C3S or cement paste. These differences are most clearly evident from the fact that C–S–H gelhas a maximum Ca/Si ratio of 1.7–1.8 while that of synthetic C–S–H is generally near 1.5. In this study, amethodology for preparing homogeneous, single-phase specimens of C–S–H gel from fully-hydrated C3Spaste is presented. The Ca/Si ratio of these specimens, which can vary between approximately 0.7–1.8,can be decreased and increased by careful decalcification (in concentrated NH4NO3 solution) andrecalcification (in Ca(OH)2 solution), respectively; the latter process is also shown to remove thecompositional gradients in a leached solid, thereby enhancing the homogeneity of the specimen. Thispreparation technique is therefore valuable for structural studies of C–S–H gel at low Ca/Si ratios (whichare prevalent in chemically degraded or blended cement pastes) and especially at high Ca/Si ratio, wherethe structure of C–S–H gel is most controversial.
1. Introduction
1.1. C–S–H gel versus ‘synthetic’ C–S–H. The principal product at room temperature in the pastehydration of tricalcium silicate (C3S), the major constituent phase of portland cement, is a particularcalcium silicate hydrate known as C–S–H gel. Determination of the structure of this compound iscomplicated by the lack of long-range order, by variation in composition at a submicron scale, and by thepotential admixture with portlandite and unreacted C3S. To obtain more homogeneous specimens, themajority of structural studies (e.g., [1-7]) have used single-phase or ‘synthetic’ C–S–H prepared bycombining CaO and SiO2 or by reacting an alkali silicate with a Ca-salt (i.e., double decomposition) inaqueous solution. In both preparations, the Ca/Si ratio of C–S–H is easily controlled by altering the initialmolar ratio of CaO to SiO2 from 0.7 to a maximum near 1.5. This method is useful and widely exploited,since arguably the most effective strategy for understanding the structural variations in C–S–H is toanalyze the systematic changes in C–S–H with varying Ca/Si ratio.
Our recent studies [8-10] represent some of the first efforts to directly examine the variations instructure at different Ca/Si ratios of C–S–H gel formed in a fully-hydrated C3S paste. Phase equilibriumresults [8] illustrate important structural differences at high Ca/Si ratios between mature C–S–H gel and
2
synthetic C–S–H (especially that from double decomposition): the former has a higher maximum Ca/Siratio of 1.8 (compared to 1.5), and, at a given Ca/Si ratio above 1.2, a higher mean silicate chain lengthand a higher Ca–OH content. From these results, it was concluded [8] that at high Ca/Si ratios, thestructures of mature C–S–H gel and synthetic C–S–H more closely resemble degenerate forms of theminerals jennite [11] and tobermorite [12], respectively. It thus appears that synthetic preparations ofC–S–H are inappropriate structural models for mature C–S–H gel at high Ca/Si ratios. Consequently,further insight into the nanostructure of C–S–H gel should be obtained from studies on single-phaseC–S–H gel specimens that are derived from C3S pastes and prepared at different Ca/Si ratios.
1.2 Decalcification of C3S pastes. The hydration of a C3S paste produces Ca(OH)2 (CH) and a C–S–Hgel with a mean Ca/Si ratio of 1.7–1.8, which is approximately invariant with age [13]. Several methodsare available to prepare single-phase C–S–H specimens of varying Ca/Si ratio from C3S: (1) C3S can behydrated in dilute suspensions at Ca concentrations below the saturation concentration of CH [14]; thissuppresses the precipitation of CH and shifts the equilibrium Ca/Si ratio of C–S–H to lower values. (2)C3S pastes can be hydrated with a sufficiently high content of silica fume (or other silica rich reactivecomponent) [15-18], which will ultimately consume CH (via the pozzolanic reaction) and form C–S–Hwith lower Ca/Si ratios. (3) C3S pastes can be hydrated to maturity then carefully leached to remove CHand, if desired, to decalcify C–S–H gel. Only the last of these three options allows for a C3S pastehydration with normal kinetics and solution chemistry; this option is thus investigated here.
The simplest way to leach a cement paste is through continuous exposure to deionized water. However,the kinetics of this reaction are inconveniently slow: based on the findings of Carde et al. [19], a leachingfront induced by flowing water will propagate only 1 mm through a cement paste of water:cement ratio =0.50 in the span of 70 d and ~ 2.3 mm in 1 year. Organic solvents such as ethyl acetoacetate or glycerol-alcohol mixtures are also known to leach CH and C–S–H [20-25], but the possible contamination ofC–S–H by these solvents has not been fully addressed, and the leaching of C–S–H below Ca/Si ~ 1.25 issometimes difficult [25]
Accelerated alternatives to leaching in flowing water have been explored [19, 26, 27]. A particularlyeffective method is the use of concentrated NH4NO3 solutions [19, 28, 29]. The dissolution of CH by thismethod proceeds as,
where the reaction is driven to the right by the elimination of ammonium from the system as gaseousammonia [29]. The resulting solubility of Ca in a 6 M NH4NO3 solution (2.9 M) is 2 orders of magnitudegreater than that in water (20.6 mM). This ensures a high concentration gradient at the solid-liquidinterface, thereby increasing the rate of leaching by a factor of approximately 100 [19] to 300 [29]. Atequal degrees of leaching, Carde et al. [19] showed no significant differences in NH4NO3- or water-leached solids in terms of porosity, strength, microprobe analysis of major and minor elements, and XRDpatterns. The absence of undesirable side reactions associated with NH4NO3 solutions is further confirmedby phase equilibrium and 29Si NMR results on C–S–H [8], which show agreement between samplesleached in water and NH4NO3 solution.
In the same phase equilibrium study [8], it was also shown that, as long as compositional gradients areminimized, decalcification and recalcification (i.e., the process of chemically incorporating Ca into adecalcified solid) are reversible processes; that is, the same structure of C–S–H is obtained whether
3
approaching equilibrium through the decalcification of a high Ca/Si ratio solid or through therecalcification of a low Ca/Si ratio solid. Consequently, if high Ca/Si ratio solids, originally prepared bytwo distinctly different methods such as the paste hydration of C3S and the double decomposition ofcalcium nitrate and sodium silicate, are decalcified and then recalcified, the differences in structure thatwere initially detectable at high Ca/Si ratio (but too small to distinguish at low Ca/Si ratios) will clearlyreemerge after recalcification. This ‘memory’ in the structure of C–S–H will be exploited here whenpreparing C–S–H gel specimens at Ca/Si ratios exceeding 1.5.
In this study, it is shown that single-phase C–S–H specimens can be prepared with varying Ca/Si ratioby decalcifying thin (0.8 mm) discs of fully-hydrated C3S paste (water:cement = 0.5) in 6 M NH4NO3
solution. A procedure for enhancing the homogeneity of these samples and for preparing specimens athigh Ca/Si ratio is also reported.
2. Experimental
2.1. Samples. C3S pastes, prepared at a water:cement ratio of 0.5, were hydrated for 8 months, at whichpoint the samples were nearly completely reacted; see Ref. [8] for further details. Immediately prior toleaching (Section 2.2), pastes were cut with a diamond saw into discs, approximately 0.8 mm thick and 25mm in diameter.
2.2. Decalcification in 6 M NH4NO3 solution. A C3S paste was decalcified by immersing onesaturated 0.8-mm thick disc in a stirred 100-mL solution of 6 M NH4NO3. Based on the weight of drysolid, the solution:solid weight ratio was ~ 200. The weight of the sample (measured in the saturatedsurface dry state) was monitored during leaching; at the desired weight loss, the sample was removedfrom the NH4NO3 solution and immediately immersed in ~ 50 mL of deionized water to remove theresidual NH4NO3 solution residing in the pores of the paste. A series of decalcified C3S pastes wereprepared in this way. As confirmed by pore fluid exchange calculations [30], approximately 10–15 min ofgentle stirring in deionized water was sufficient for complete replacement of the heavier NH4NO3 solution(r ~ 1.13 g cm-3) by water.
Bulk Ca/Si ratios of the leached pastes were measured by ICP after decomposition of the solid withLiBO3 at 1000 ºC [31]. For several samples, the Ca and Si concentrations in the NH4NO3 solutions weremeasured by ICP after leaching.
2.3 Recalcification of leached samples. The process of chemically incorporating Ca into a leachedsolid is referred to here as recalcification. In this study, a recalcified sample was examined by SEM-EDX(Section 2.5). This sample, initially a fragment (~ 0.2 g, saturated) of a C3S paste leached in NH4NO3
solution to a Ca/Si ratio of 0.83, was shaken for three weeks with 30 mL of a solution initially containing24 mM Ca; the solution:solid weight ratio was ~ 300. At the end of this period, the Ca/Si ratio of therecalcified solid was 1.31, and the composition of the solution was equilibrated on solubility curve C ofFigure 10 in Ref. [8] at [Ca] = 7.06 mM Ca, [Si] = 71.3 mM. The CH solution was prepared withdeionized water, and CaO was obtained from freshly decomposed CaCO3.
2.3. Quantitative X-ray diffraction analysis (QXDA). To determine the bulk Ca/Si ratio at which CHwas fully extracted from the paste, the content of CH in a series of decalcified C3S pastes was measured
4
by QXDA using corundum (a-Al2O3) as an internal standard (a-Al2O3:sample = 2:5). Scans wereacquired with a Rigaku X-ray diffractometer with CuKa radiation operating at 40 kV and 20 mA,stepping 0.75º 2q·min-1 over the range 5°–60° 2q. The analysis used the area intensities of 3–5 peaks ofCH and of 5 peaks for a-Al2O3. Each sample was thus associated with up to 25 ratios of these intensities,from which an average CH content was computed. Assuming complete hydration and negligiblecarbonation (no CaCO3 was detected by XRD), this CH content was used to compute the Ca/Si ratio ofC–S–H in the paste.
2.4. SEM X-ray microanalysis (EDX). To determine the compositional homogeneity of a sample, theCa/Si ratios were measured by SEM-EDX across the thickness of a leached and recalcified disc; the latter(Ca/Si = 1.31) was initially a fragment of a leached disc (Ca/Si = 0.83) (see Section 2.3).
A Hitachi-3500 SEM equipped with a W hairpin filament and PGT energy dispersive X-ray analyzerwas used. Microanalyses were made at an accelerating voltage of 10 keV, a counting time of 60 s, and aprobe current, measured by a Faraday cup, of 1.30 ± 0.01 nA. Pseudo-wollastonite (a-CaSiO3) was usedas a reference standard, and matrix corrections were made by the Phi-Rho-Z method.
Results are reported as a function of the distance from the surface. In each sample, 2–3 randomtraverses were made, each with incremental steps of 30 mm; 2 of the 3 traverses were staggered by 15 mmto sample more distances.
2.5. Porosity and density. The bulk wet density (rb) of the 0.8-mm thick sample discs were determinedby measuring the external dimensions of the disc with digital calipers and by carefully weighing thesaturated, surface-dried sample to the nearest 0.0001 g.
The porosity (F) of the sample was determined by dividing the volume of water evaporated after D-drying [32] for 5–7 days by the volume of the sample disc. The density of the evaporated liquid isassumed to be 1 g cm–3. This value may be slightly underestimated, as some of the water lost on D-dryingwill remove more firmly condensed water such as that found in the interlayer spaces of C–S–H [33, 34].Nevertheless, the inaccuracies attributed to the assumption will not alter the observed trends.
3. Results
3.1. Leaching in NH4NO3 solution: general observations and kinetics. Except for a slighttransparency at high degrees of leaching, the C3S pastes did not show any visible signs of deteriorationduring leaching in NH4NO3 solution. This was true even after a sample disc lost 38% of its originalsaturated mass (or nearly 70% of its solid mass†), by which time the Ca/Si ratio of the C3S paste haddecreased to 0.17 and the porosity had exceeded 80% (Section 3.6). At these high degrees of leaching,samples were fragile but still strong enough to have its external dimensions measured with calipers asreported elsewhere [35].
Due to the high solubility of Ca, the rate of decalcification of cement pastes is greatly accelerated in 6M NH4NO3 when compared to that in water. Figure 1 shows the kinetics of leaching a C3S paste in 6 MNH4NO3 and a Type I white portland cement (WPC) paste (water:cement = 0.5) in flowing deionizedwater (described elsewhere [35]); plotted against time are the changes in the bulk Ca/Si ratio of the paste
† This discrepancy arises since the solid leached from the paste will be replaced by an equal volume of water;consequently, the measured weight loss of the saturated paste will be lower than the actual weight loss of the solid.
5
(measured from correlations with weight loss as described in Section 3.4). Although the comparisonbetween the leached C3S and WPC pastes is only qualitative (since the latter also contains aluminatephases such as ettringite), it is still illustrative since the specimen sizes are identical and the initial Ca/Siratio of both pastes is 3. Consistent with estimates derived from measured propagation rates of leachingfronts [19, 29], the results in Figure 1 show that exposure of hardened pastes to 6 M NH4NO3 solutionleads to an acceleration in leaching by over 2 orders of magnitude. For example, to leach a paste from aCa/Si of 3 to 1.25 requires 16.2 x 10³ min (11.3 days) of leaching in water while only 49 min in 6 MNH4NO3.
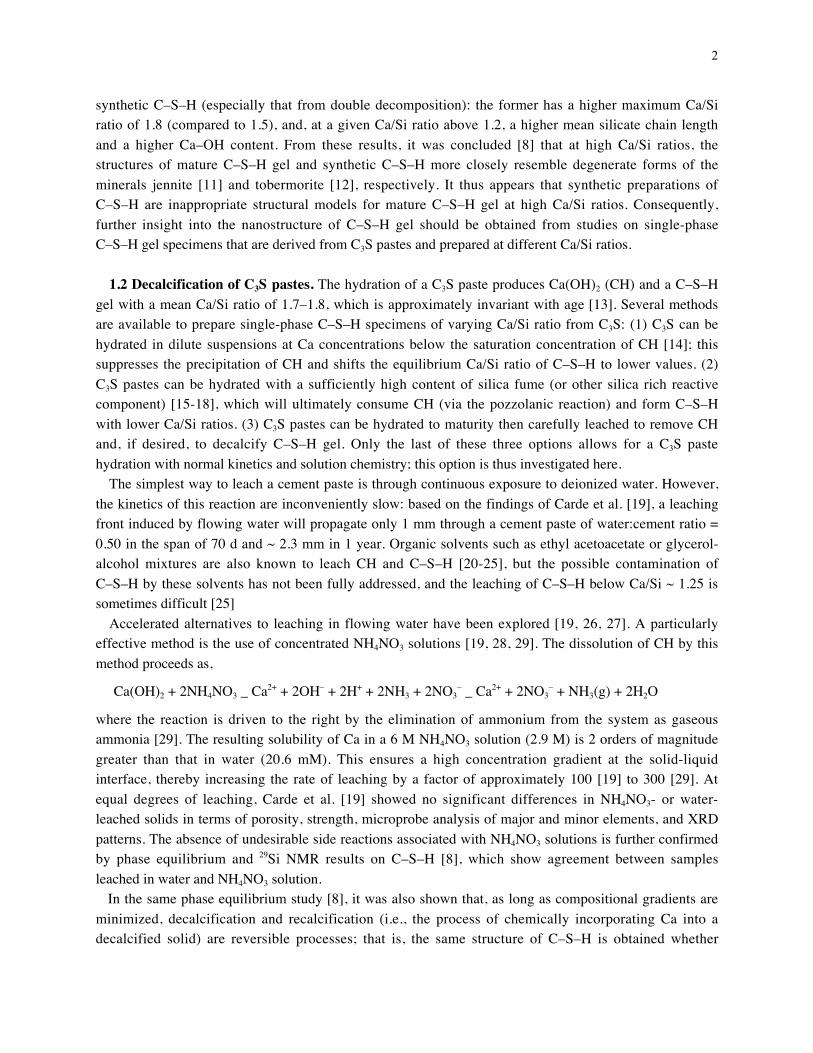
3.2. Ca and Si concentrations in NH4NO3 leaching solutions. Figure 2 shows the final Ca and Siconcentrations in NH4NO3 solutions after leaching a series of C3S pastes; each pair of points at a givenbulk Ca/Si ratio represents the concentrations in a different 100-mL solution after the leaching of a singlespecimen disc. The linearly increasing Ca concentration and the nearly zero Si concentration in solutionwith decreasing solid Ca/Si ratio indicates that the predominant element leached from the solid is Ca. Theloss in Si is negligible even below a solid Ca/Si ratio of 1, the approximate composition below which theequilibrium concentration of Si in water exceeds that of Ca [8]; thus, unlike in water, leaching in NH4NO3
solution is nearly a pure decalcification. This conclusion is further supported by the agreement betweenthe measured Ca concentrations and the computed curve in Figure 2, which assumes the decrease in thesolid Ca/Si ratio is solely from the loss of Ca.
The significance of a pure decalcification in NH4NO3 solution is twofold. (1) It allows decalcificationof C3S or cement pastes below Ca/Si ~ 1–1.2, compositions that would otherwise be difficult or slow toachieve by leaching in pure water. Although C–S–H gel phases with these low Ca/Si ratios are generallyabsent in normal cement pastes, the study of them is important since they could be present in water-,sulfate-, or carbonation-attacked pastes and in pastes blended with a high content of mineral additions;moreover, below a Ca/Si ratio of 1.2, C–S–H gel begins to show important changes in nanostructure, themost prominent being increases in silicate polymerization and silanol content [8] and decreases in specificsurface area [10]. (2) A pure decalcification process also minimizes the loss of Si from the solid,indicating that entire regions of the paste are not lost to solution as would occur by dissolution anderosion during a flowing water experiment; this conclusion is consistent with the lack of visibly erodededges in the NH4NO3-leached samples. The minimization of erosion is important when measuring thedimensional changes caused by intrinsic structural changes in the paste induced by decalcification [35].
3.3 Removal of CH and decalcification of C–S–H. Figure 3 shows the distribution of phases and theCa/Si ratio of C–S–H as a function of the bulk Ca/Si ratio of the paste decalcified in NH4NO3 solution.The dashed line (with a slope of 1) represents the Ca/Si ratio of the paste; the solid line is a best-fit curvefor the Ca/Si ratios of C–S–H computed from CH contents measured by QXDA. The intersection of thetwo lines at a Ca/Si ratio of approximately 1.4 marks the composition of the paste (and of C–S–H) atwhich CH (represented by the vertically-hatched area) is initially removed from the paste bydecalcification. The slight decrease in the Ca/Si ratio from about 1.7 to 1.4 before this intersectionindicates that the initial stages of decalcification of C–S–H gel occurred simultaneously with thedissolution of CH. This overlap (which is strictly absent under ideal equilibrium conditions) is thought tobe primarily due to compositional gradients across the 0.8-mm thickness of the specimen (see Section
6
3.5). As illustrated in Section 3.5, these compositional gradients can be eliminated by recalcifying theleached specimen in CH solution.
XRD shows that amorphous silica gel is only present at very low Ca/Si ratios and that C–S–H is thesole phase present in our NH4NO3-leached samples between Ca/Si ratios of 0.7–1.4 [8].
3.4. Correlations between weight loss and Ca/Si ratio of C3S pastes. When preparing single-phaseC–S–H specimens through the decalcification of C3S pastes, it is useful to know the Ca/Si ratio of thesolid during the leaching process. This can be accomplished directly by analyzing the composition of thesolid or indirectly by analyzing the concentrations in the leaching solution at various times, but analternative and somewhat simpler method is to use predetermined relationships between the solid Ca/Siratio and the weight loss during leaching. Figure 4 shows such relationships for a C3S paste leached in 6M NH4NO3. The weight loss values associated with the solid curve in Figure 4 were determined from thepercentage difference between the mass of the initial paste saturated with pore solution and the mass ofthe decalcified paste saturated with 6 M NH4NO3; the Ca/Si ratios were determined analytically onindividual samples. The solid trendlines in Figure 4 were used in this study to compute the Ca/Si ratios inFigure 1 and in a related study [35] to correlate the Ca/Si ratio with the shrinkage strains in a C3S pasteduring decalcification. Note that these trendlines are only valid for C3S pastes prepared at a water:cementratio of 0.5 and leached in 6 M NH4NO3 solution.
After a C3S paste has reached its target Ca/Si ratio, it should be rinsed in deionized water (10–15minutes is sufficient) to remove the residual NH4NO3 solution from the pores of the paste. This rinsingstep results in an additional loss in weight since the 6 M NH4NO3 solution (r ~ 1.13 g cm–3) is appreciablydenser than that of water; the resulting weight loss-Ca/Si ratio curve for water-saturated leached samples(dashed lines in Figure 4) thus shifts to the right. Moreover, since the density of the pore solution of theinitial, unleached C3S paste is approximately that of water, this shifted curve more accurately representsthe true weight loss of the saturated C3S paste required to achieve a given Ca/Si ratio.
Both curves in Figure 4 show two linear regions that intersect at a bulk Ca/Si ratio of ~ 1.4. Since thiscomposition was determined from QXDA (Section 3.3) to be that at which CH is completely removedfrom the C3S paste, the first linear region (at lower weight loss) is associated primarily with the extractionof CH and the second with the decalcification of C–S–H. The assignment of the first linear region issupported by the initial slope of the water-saturated (dotted) line, –0.093, which is close to the theoreticalvalue, –0.086, expected if the changes in weight and Ca/Si ratio were only due to the replacement of CHwith an equal volume of water [30]. The assignment of the second linear region (with a more gradualslope of –0.065) to the decalcification of C–S–H is supported indirectly by the fact that blended cementpastes that lack CH exhibit only a single linear region of relatively gradual slope [35].
3.5. EDX-SEM. Previous studies [19, 29] have shown in samples larger than those studied here that,like leaching in water, decalcification in concentrated NH4NO3 solution produces compositional gradientsin cement pastes. With the goal of preparing homogenous, single-phase C–S–H samples derived from C3Spaste, it was thus important to analyze and minimize the extent of inhomogeneity in the decalcifiedsamples.
Figure 5 shows the variation in solid Ca/Si ratio across the thickness (0.8 mm) of a leached and arecalcified C3S paste disc. The leached paste had a bulk Ca/Si ratio of 0.83; the recalcified sample was afragment of the leached specimen equilibrated for three weeks in CH solution (using a solution:solid ratio
7
of ~ 300), after which time the solid had a bulk Ca/Si ratio of 1.31 and the Ca and Si concentrations insolution equilibrated on solubility curve C of Figure 10 in Ref. [8] at 7.06 mM Ca and 71.3 mM Si.
The leached paste showed a slight gradient in Ca/Si ratio, possessing a value of 0.4 at the surface and ~0.8 for a majority of the sample; a few points with Ca/Si ratio of 1.3–1.4 were found near the midline ofthe sample. Ignoring these high points, the fitted curve for the leached paste suggests that nearly 75% ofthe volume of the disc possessed compositions within 5% of the measured bulk Ca/Si ratio of 0.83. Thislevel of homogeneity may be adequate in certain studies but not so in cases where precision of the Ca/Siratio is important.
In contrast to the results of the leached paste, the Ca/Si ratios across the thickness of the recalcifiedsolid were fairly constant, with an average value of 1.22 ± 0.10, close to the measured bulk value of 1.31.Thus, recalcification not only increases the Ca/Si ratio of the solid, but also improves the homogeneity ofthe sample by removing the compositional gradients induced by leaching. Note that, as illustrated in aprevious study [8], the Ca/Si ratio of this recalcified sample could have been lower or higher (within therange of about 0.7–1.8) by adjusting the concentration of the CH solution to which the leached solid wasexposed.
As discussed in Section 4, these results demonstrate that homogenous, single-phase specimens withvarying Ca/Si ratio can be successfully prepared from C3S pastes through a combined decalcification andrecalcification procedure.
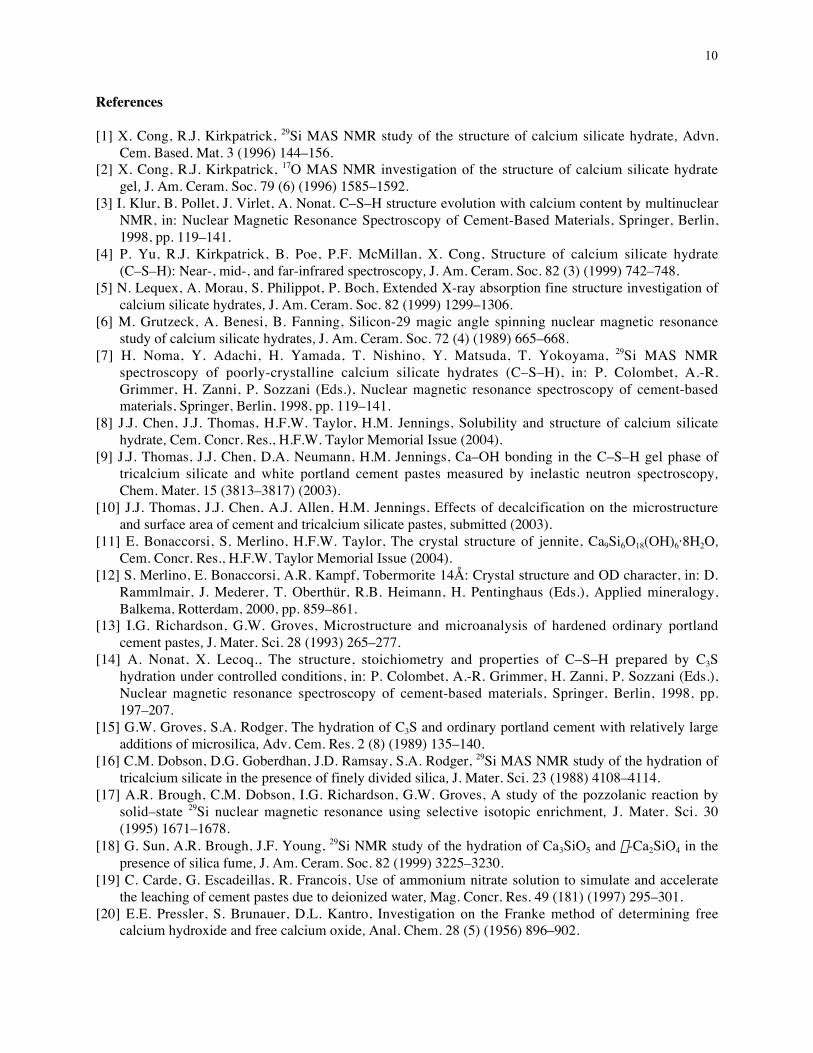
3.6. Changes in porosity and bulk density during decalcification in NH4NO3 solution. Figure 6shows that the porosity (F ) and the bulk wet density (rbulk) of decalcified C3S paste increases anddecreases, respectively, with decalcification (i.e., with decreasing Ca/Si ratio). The trendlines are valid forC3S pastes with a water:cement ratio of 0.5.
It is important to note that by the time CH has been fully extracted from the paste at a Ca/Si of 1.4, theporosity is approximately 60%; based on the NIST hydration model [36], this porosity value suggests thatthe capillary pores of the decalcified paste are completely percolated (or continuous) in 3-dimensions.This percolated pore structure increases the diffusivity of the leached solid by 2 or more orders ofmagnitude, thus facilitating the exchange of the NH4NO3 solution with water and the recalcification of theleached solid in CH solution.
4. Discussion
4.1. Procedure for preparing single-phase C–S–H specimens from C3S pastes. The results of thisstudy suggest a strategy based on a decalcification/recalcification procedure for preparing homogeneous,single-phase C–S–H specimens from C3S pastes with varying Ca/Si ratio. This method is outlined here:
1. Prepare thin specimens of a fully-hydrated C3S paste to reduce leaching times and to minimizecompositional gradients during decalcification. A thickness of 0.8 mm produced adequate results inthis study. Although decreasing this thickness could possibly produce more homogenousspecimens, handling the fragile leached specimens becomes more difficult.
2. Decalcify the paste in concentrated NH4NO3 solution at a fairly high solution:solid ratio. Aconcentration of 6M and a solution:solid ratio of ~ 200 by weight were used here; both of thesevalues, however, can be safely reduced as long as the pH of the leaching solution remains below9.25, the pH above which decalcification in NH4NO3 solution should cease [29].
8
3. Continue decalcification at least until CH is completely extracted from the C3S paste; C–S–H willinevitably begin to decalcify before this occurs, and for our sample size, CH was removed at aCa/Si ratio of approximately 1.4. If preparing specimens at higher Ca/Si ratios, go to step 4; ifpreparing specimens at lower Ca/Si ratios, continue leaching until the target composition isachieved using as guidelines either the aqueous solution composition or the predeterminedrelationships between weight loss and Ca/Si ratio such as those shown in Figure 4. The lower limitfor the Ca/Si ratio of C–S–H is theoretically 0.67 (when all Si–O– sites are protonated); below thisvalue, silica gel is present.
4. Remove the NH4NO3 solution from the pores of the decalcified sample by immersing the solid indeionized water; due to the percolated pore structure (Section 3.6), only 10–15 minutes werenecessary for the sample sizes used here. If small gradients in composition are tolerable, stop here;the bulk Ca/Si ratio of this sample adequately represents the composition of the leached solid. If,however, homogeneity or a higher Ca/Si ratio is desired, proceed with recalcification in step 5.
5. Recalcify the sample through continuous shaking for several weeks in CH solution, theconcentration of which depends on the target Ca/Si ratio of the sample. Use as guidelines therelationships shown in Figure 3 of Ref. [8] between the Ca/Si ratio of C–S–H gel derived from C3Sand the Ca concentration in aqueous solution with which the solid is in equilibrium. The final Ca/Siratio of C–S–H, which can vary between approximately 0.7–1.8, will depend on the initialcompositions of the solid and solution as well as the solution:solid ratio (a value of ~ 300 was usedhere); higher Ca/Si ratio solids could require multiple exposures to saturated or supersaturatedsolutions of CH. The final composition of the aqueous solution should also be measured for Ca andSi to ensure that the concentrations fall on curve C of Figure 10 in Ref. [8]; this is a good indicationthat equilibrium has been reached.
4.2. Implications for C–S–H research. The procedure outlined above has important implications forC–S–H research, particularly pertaining to the high Ca/Si ratio C–S–H gel found in cement pastes, whosestructure is perhaps the most controversial topic on C–S–H.
The most apparent advantage of the present technique is the ability to produce homogeneous, single-phase C–S–H specimens from C3S pastes with Ca/Si ratios exceeding 1.5, the apparent limit for mostsynthetic preparations of C–S–H. Moreover, phase equilibrium results [8] show that the nanostructures ofC–S–H derived from C3S pastes are generally quite different from those of synthetic preparations: at agiven Ca/Si ratio above 1.2, for example, C–S–H gel from mature C3S paste has a higher mean chainlengths and a higher Ca–OH content. Both of these attributes, especially the high Ca–OH content, whichwas confirmed directly from inelastic neutron scattering (INS) spectroscopy [9], support the conclusion[8, 37] that the nanostructure of mature C–S–H gel in C3S or cement paste is more closely related tojennite than 1.4-nm tobermorite (i.e., C–S–H(I)). On the other hand, synthetic preparations, especiallydouble decomposition, appear to produce structures more tobermorite-like than jennite-like. Therefore, inorder to make progress on understanding the nanostructure of C–S–H gel in cements, it appears thatcharacterization should be performed not on synthetic C–S–H preparations (as the majority of studieshave done) but on single-phase samples prepared from C3S pastes as described here.
Investigations concerned with the interaction of high Ca/Si ratio C–S–H gel in cements with speciessuch as chloride ions, metallic and radioactive waste ions, alkali ions, and polymeric dispersants couldalso potentially benefit from the preparation technique outlined above. For example, if any of these
9
species bind to or strongly interact with Ca–OH sites in C–S–H (such as chloride ions [38]), sorptionstudies on single-phase C–S–H specimens will only accurately reflect the situation in mature cementpastes if the specimen has a correspondingly high content of Ca–OH groups (as is naturally present in thepaste). Since synthetic C–S–H preparations generally have low Ca–OH contents [8], it would be moreappropriate to conduct sorption studies on high Ca/Si ratio C–S–H preparations derived from C3S pastes.
Another important aspect of the procedure outlined in Section 4.1 is the ability to prepare homogenousC–S–H specimens with low Ca/Si ratios. This is useful for studying the structure and properties ofdecalcified C–S–H gel present in water- [26], carbonation- [39], or sulfate-attacked [40, 41] cementpastes. In a recent leaching study [35], for example, it was shown that C3S and cement pastes shrink dueto the in situ silicate polymerization in C–S–H induced by decalcification below Ca/Si ratios of 1.2.
5. Summary
A technique for preparing homogeneous, single-phase C–S–H gel specimens of variable Ca/Si ratiofrom mature, hardened C3S pastes is presented (see summary in Section 4.1).
An important advantage of this technique is the ability to prepare single-phase C–S–H specimens withCa/Si ratios as high as 1.8, thus exceeding the apparent limit of 1.5 for most synthetic preparations ofC–S–H and thereby forming specimens whose nanostructures more closely resemble that of C–S–H gel incement paste. The preparation of these high Ca/Si ratio samples involves two steps: first, thin C3Sspecimens are decalcified in concentrated NH4NO3 solution to extract CH; second, decalcified (andrinsed) solids are equilibrated in CH solution to increase the Ca/Si ratio of C–S–H and also to remove thecompositional gradients induced by leaching. Characterization of these high Ca/Si ratio samples shouldyield new insight into the nanostructure of C–S–H gel in cement pastes.
Studies on the sorption of species such as chloride ions, waste ions, alkali ions, and polymers onto thesehigh Ca/Si ratio preparations could also yield new insight into the specific interactions between thesespecies and C–S–H gel in cement pastes.
A further advantage of the technique described here is the ability to prepare homogeneous, single-phaseC–S–H specimens with low Ca/Si ratios (i.e., below ~ 1.2). This could be useful for durability studiesconcerned with the structure and properties of C–S–H gel decalcified by water leaching, carbonation, orsulfate-attack.
Acknowledgment. The work was supported by the National Science Foundation under Grant No. CMS-0070922/001.
10
References
[1] X. Cong, R.J. Kirkpatrick, 29Si MAS NMR study of the structure of calcium silicate hydrate, Advn.Cem. Based. Mat. 3 (1996) 144–156.
[2] X. Cong, R.J. Kirkpatrick, 17O MAS NMR investigation of the structure of calcium silicate hydrategel, J. Am. Ceram. Soc. 79 (6) (1996) 1585–1592.
[3] I. Klur, B. Pollet, J. Virlet, A. Nonat. C–S–H structure evolution with calcium content by multinuclearNMR, in: Nuclear Magnetic Resonance Spectroscopy of Cement-Based Materials, Springer, Berlin,1998, pp. 119–141.
[4] P. Yu, R.J. Kirkpatrick, B. Poe, P.F. McMillan, X. Cong, Structure of calcium silicate hydrate(C–S–H): Near-, mid-, and far-infrared spectroscopy, J. Am. Ceram. Soc. 82 (3) (1999) 742–748.
[5] N. Lequex, A. Morau, S. Philippot, P. Boch, Extended X-ray absorption fine structure investigation ofcalcium silicate hydrates, J. Am. Ceram. Soc. 82 (1999) 1299–1306.
[6] M. Grutzeck, A. Benesi, B. Fanning, Silicon-29 magic angle spinning nuclear magnetic resonancestudy of calcium silicate hydrates, J. Am. Ceram. Soc. 72 (4) (1989) 665–668.
[7] H. Noma, Y. Adachi, H. Yamada, T. Nishino, Y. Matsuda, T. Yokoyama, 29Si MAS NMRspectroscopy of poorly-crystalline calcium silicate hydrates (C–S–H), in: P. Colombet, A.-R.Grimmer, H. Zanni, P. Sozzani (Eds.), Nuclear magnetic resonance spectroscopy of cement-basedmaterials, Springer, Berlin, 1998, pp. 119–141.
[8] J.J. Chen, J.J. Thomas, H.F.W. Taylor, H.M. Jennings, Solubility and structure of calcium silicatehydrate, Cem. Concr. Res., H.F.W. Taylor Memorial Issue (2004).
[9] J.J. Thomas, J.J. Chen, D.A. Neumann, H.M. Jennings, Ca–OH bonding in the C–S–H gel phase oftricalcium silicate and white portland cement pastes measured by inelastic neutron spectroscopy,Chem. Mater. 15 (3813–3817) (2003).
[10] J.J. Thomas, J.J. Chen, A.J. Allen, H.M. Jennings, Effects of decalcification on the microstructureand surface area of cement and tricalcium silicate pastes, submitted (2003).
[11] E. Bonaccorsi, S. Merlino, H.F.W. Taylor, The crystal structure of jennite, Ca9Si6O18(OH)6·8H2O,Cem. Concr. Res., H.F.W. Taylor Memorial Issue (2004).
[12] S. Merlino, E. Bonaccorsi, A.R. Kampf, Tobermorite 14Å: Crystal structure and OD character, in: D.Rammlmair, J. Mederer, T. Oberthür, R.B. Heimann, H. Pentinghaus (Eds.), Applied mineralogy,Balkema, Rotterdam, 2000, pp. 859–861.
[13] I.G. Richardson, G.W. Groves, Microstructure and microanalysis of hardened ordinary portlandcement pastes, J. Mater. Sci. 28 (1993) 265–277.
[14] A. Nonat, X. Lecoq., The structure, stoichiometry and properties of C–S–H prepared by C3Shydration under controlled conditions, in: P. Colombet, A.-R. Grimmer, H. Zanni, P. Sozzani (Eds.),Nuclear magnetic resonance spectroscopy of cement-based materials, Springer, Berlin, 1998, pp.197–207.
[15] G.W. Groves, S.A. Rodger, The hydration of C3S and ordinary portland cement with relatively largeadditions of microsilica, Adv. Cem. Res. 2 (8) (1989) 135–140.
[16] C.M. Dobson, D.G. Goberdhan, J.D. Ramsay, S.A. Rodger, 29Si MAS NMR study of the hydration oftricalcium silicate in the presence of finely divided silica, J. Mater. Sci. 23 (1988) 4108–4114.
[17] A.R. Brough, C.M. Dobson, I.G. Richardson, G.W. Groves, A study of the pozzolanic reaction bysolid–state 29Si nuclear magnetic resonance using selective isotopic enrichment, J. Mater. Sci. 30(1995) 1671–1678.
[18] G. Sun, A.R. Brough, J.F. Young, 29Si NMR study of the hydration of Ca3SiO5 and b-Ca2SiO4 in thepresence of silica fume, J. Am. Ceram. Soc. 82 (1999) 3225–3230.
[19] C. Carde, G. Escadeillas, R. Francois, Use of ammonium nitrate solution to simulate and acceleratethe leaching of cement pastes due to deionized water, Mag. Concr. Res. 49 (181) (1997) 295–301.
[20] E.E. Pressler, S. Brunauer, D.L. Kantro, Investigation on the Franke method of determining freecalcium hydroxide and free calcium oxide, Anal. Chem. 28 (5) (1956) 896–902.
11
[21] G.L. Kalousek. Application of differential thermal analysis in a study of the system lime-silica-water,in: Proc. 3rd Int. Symp. Chem. Cem., Cement and Concrete Association, London, 1952, pp. 296–311.
[22] F.W. Locher. Stoichiometry of tricalcium silicate hydration, in: Symposium on Structure of PortlandCement Paste and Concrete, Washington, D.C., 1966, pp. 300–308.
[24] H.G. Midgley, The determination of calcium hydroxide in set portland cements, Cem. Concr. Res. 9(1979) 77–82.
[25] H. Stade, W. Wieker, On the structure of ill-crystallized calcium hydrogen silicates. I. Formation andproperties on an ill-crystallized calcium hydrogen disilicate phase (in German), Z. Anorg. Allg.Chem. 466 (1980) 55–70.
[26] P. Faucon, B. Gerard, J.F. Jacquinot, J. Marchand, Water attack of a cement paste: Towards animproved accelerated test?, Adv. Cem. Res. 10 (2) (1998) 67–73.
[27] H. Saito, S. Nakane, Comparison between diffusion test and electrochemical acceleration test forleaching degredation of cement hydration products, ACI Mater. J. 96 (1999) 208–211.
[28] F.M. Lea, The action of ammonium salts on concrete, Mag. Concr. Res. 17 (52) (1965) 115–116.[29] F.H. Heukamp, F.J. Ulm, J.T. Germaine, Mechanical properties of calcium-leached cement pastes:
Triaxial stress states and the influence of the pore pressures, Cem. Concr. Res. 31 (2001) 767–774.[30] J.J. Chen, The nanostructure of calcium silicate hydrate (Ph.D. thesis), Dept. Materials Science and
Engineering, Northwestern University, Evanston, IL, 2003.[31] J.C. Farinas, P. Ortega, Chemical analysis of portland cement by inductively-coupled plasma atomic
emission spectrometry, Analusis 20 (1992) 221–228.[32] L.E. Copeland, J.C. Hayes, Determination of non-evaporable water in hardened portland-cement
paste, ASTM Bull. 194 (1953) 70–74.[33] R.F. Feldman, V.S. Ramachandran, Differentiation of interlayer and adsorbed water in hydrated
portland cement by thermal analysis, Cem. Concr. Res. 1 (1971) 607–620.[34] R.F. Feldman, Helium flow and density measurement of the hydrated tricalcium silicate-water
system, Cem. Concr. Res. 2 (1972) 123–136.[35] J.J. Chen, J.J. Thomas, H.M. Jennings, Polymerization shrinkage of calcium silicate hydrates during
decalcification of cement pastes, in preparation.[36] D.P. Bentz, E.J. Garboczi, Percolation of phases in a three-dimensional cement paste microstructure
464–467.[38] A.G. Kalinichev, R.J. Kirkpatrick, Molecular dynamics modeling of chloride binding to the surfaces
of calcium hydroxide, hydrated calcium aluminate, and calcium silicate phases, Chem. Mater. 14(2002) 3539–3549.
[39] G.W. Groves, A.R. Brough, I.G. Richardson, C.M. Dobson, Progressive changes in the structure ofhardened C3S cement pastes due to carbonation, J. Am. Ceram. Soc. 74 (11) (1991) 2891–2896.
[40] A.K. Crumbie, K. Scrivener, P.L. Pratt. The relationship between the porosity and permeability ofthe surface layer of concrete and the ingress of aggressive ions, in: Proc. Mater. Res. Soc. Symp.,Materials Research Society, Pittsburgh, 1989, pp. 279–284.
[41] R.S. Gollop, H.F.W. Taylor, Microstructural and microanalytical studies of sulfate attack. I. Ordinaryportland cement paste, Cem. Concr. Res. 22 (1992) 1027–1038.
12
Figure captions
Figure 1. Leaching kinetics of a C3S paste decalcified in 6 M NH4NO3 solution (_) and of a WPC pasteleached in flowing deionized water (_).
Figure 2. Ca (_) and Si (_) concentrations in NH4NO3 solutions measured after leaching a series of C3Spastes. Each pair of points at a given Ca/Si ratio represents concentrations in a different 100-mL solutionafter the leaching of a single specimen disc. The line represents the theoretical Ca concentration insolution assuming a pure decalcification of the solid (i.e., zero loss of Si).
Figure 3. Removal of CH and the decalcification of C–S–H during the decalcification of a C3S paste. Thebulk Ca/Si ratio of the paste (– –) and the Ca/Si ratio of C–S–H (_, —) are shown. CH, represented by thevertically-hatched area, is removed from the paste at a Ca/Si ratio of approximately 1.4.
Figure 4. Relationship between weight loss, w, and Ca/Si ratio for C3S pastes leached in solutions of 6 MNH4NO3. The weight loss is determined from specimens saturated with 6 M NH4NO3 solution (solid) orfrom rinsed specimens saturated with water (dashed).
Figure 5. SEM-EDX results measuring the Ca/Si ratio across the thickness (0.8 mm) of a decalcified (_,_, _) and recalcified (_, _) C3S paste. The symbols in each series represent different, random traverses.
Figure 6. Changes in (a) porosity and (b) bulk wet density as a function of the Ca/Si ratio of C3S pastesdecalcified in solutions of NH4NO3.