17
MICROSOFT ADVERTISING INSIGHTS Preparing for Holiday 2021: Technology edition Hardware & Software Microsoft Advertising. Great relationships start here.

MICROSOFT ADVERTISING INSIGHTS
Preparing for Holiday 2021:
Technology editionHardware & Software
Microsoft Advertising. Great relationships start here.

How will Holiday 2021 be different?

It’s going to be a digital-first holiday season globally, and the trend is
expected to accelerate
Total global share of consumers who
shopped online in 2020, by region
85%
78%
86%83%
86%
79%85%
Global
average
North
America
Asia Europe South
America
Australia Rest of the
world
1 in 5
people are expecting to
increase their online
shopping behavior over
the next year
Source:: Statista, Total global share of consumers who shopped online in 2020, by region, 2021.
Source: IMI Next Wave, eCommerce: Winning in 2020 & Beyond, 2020.

E-commerce is expected to sustain double digit growth
Retail Ecommerce predictions
US Ecommerce Forecast 2021 - Insider Intelligence Trends, Forecasts & Statistics (emarketer.com)
Note: includes products or services ordered using the internet, regardless
of the method of payment or fulfillment; excludes travel and event tickets,
payments such as bill pay, taxes, or money transfers, food services, and
drinking place sales, and gambling and other vice good sales; brick and
mortar sales exclude products or services ordered using the internet.
Source: eMarketer, May 2021

For some, holiday shopping is already underway % of respondents when asked in May, “When do you intend to start your holiday shopping?”
already started
20%
this spring
23%
over the summer
25%
in Oct. or Nov.
22%
Black Friday/ Cyber Monday
7%
in mid-December
3%68% of respondents have
already started shopping
for Holiday
Microsoft Holiday Gifting Survey May 2021, n=1030

The Technology space is trending toward a competitive Holiday season Snapshot of US Technology (Hardware + Software) market trends with year-to-date metrics (1/1-7/31)
1 3 5 7 9 11 13 15 17 19 21 23 25 27 29 31 33 35 37 39 41 43 45 47 49 51
Searches
2019 2020 2021
Search volume is trending to be somewhere in-
between 2020 and 2019, experiencing year-over-
year growth, but less volume than last year.
Search behavior is shifting, so prepare to be agile
this Holiday season.
CPCs in the space continue to be elevated. This is
due to more clicks on highly competitive queries.
Stay on top of new trends with Search Query
Reports and manage efficiency by maximizing
exact match and reducing phrase match.
1 3 5 7 9 11 13 15 17 19 21 23 25 27 29 31 33 35 37 39 41 43 45 47 49 51
Cost per click (CPC)
2019 2020 2021
Proprietary Microsoft Advertising Internal Data of 2019 – 2021
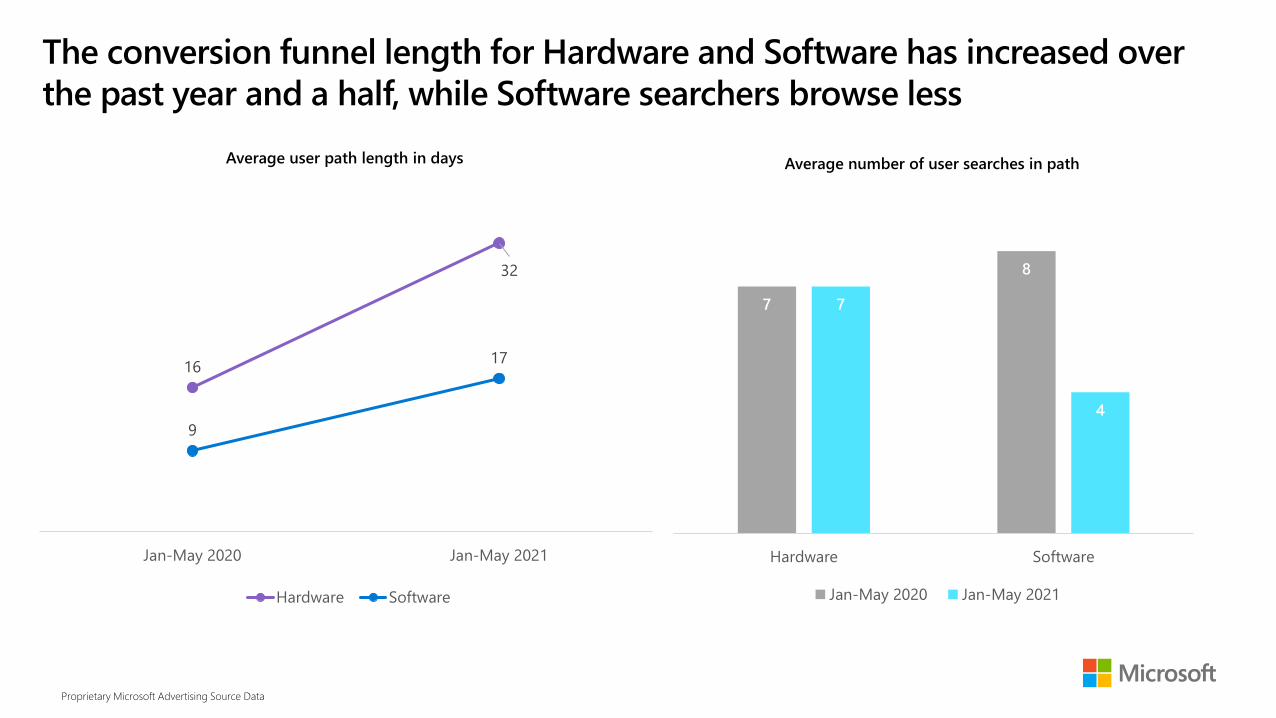
The conversion funnel length for Hardware and Software has increased over
the past year and a half, while Software searchers browse less
Average user path length in days
16
32
9
17
Jan-May 2020 Jan-May 2021
Hardware Software
Average number of user searches in path
7
8
7
4
Hardware Software
Jan-May 2020 Jan-May 2021
Proprietary Microsoft Advertising Source Data

Product ad clicks are up substantially year over year, with Hardware up 155%
and Software up 209%Product ad clicks: Hardware and Software
Software
2.38%
97.62%
2020
Product Ad Clicks
All Other Ad Clicks
7.37%
92.63%
2021
Product Ad Clicks
All Other Ad Clicks
Hardware
9.67%
90.33%
2020
Product Ad Clicks
All Other Ad Clicks
24.69%
75.31%
2021
Product Ad Clicks
All Other Ad Clicks
Proprietary Microsoft Advertising Source Data

Reaching users across search and native during seasonal periods leads to an
incremental lift in site visits and conversion rates
BothSearch
andNative
+3.6xvisitation rate
+5.4xconversion rate
Search
Native
Source: Microsoft internal data; results may vary for each advertiser based on campaign settings, targeted audiences, and other factors. Lift metrics represent an average of all advertisers with lift studies
done during peak seasonal periods (thru May 2021). These advertisers may be a non-representative sample of all advertisers on the marketplace. Lift measured between exposed users and a control group
of eligible unexposed users, with lift represented on a per-user basis. Average user count per advertiser study = 3.5M

Premium vs. budget device trends

Average disposable income for US consumers is at its highest in ten years
Monthly percent change in disposable personal income in the US from June 2020 – June 2021
Personal income in the United
States was 19.68 trillion U.S.
dollars in 2020, the highest value
in over ten years.
Statista, August 2021

Interest in budget devices has declined in 2021, while appetite for premium
devices increasedSearch volume over time: premium vs. budget devices
Low Cost Premium
Shelter-in-
place begins
New phone
launches Holiday season
2021
Proprietary Microsoft Advertising Source Data
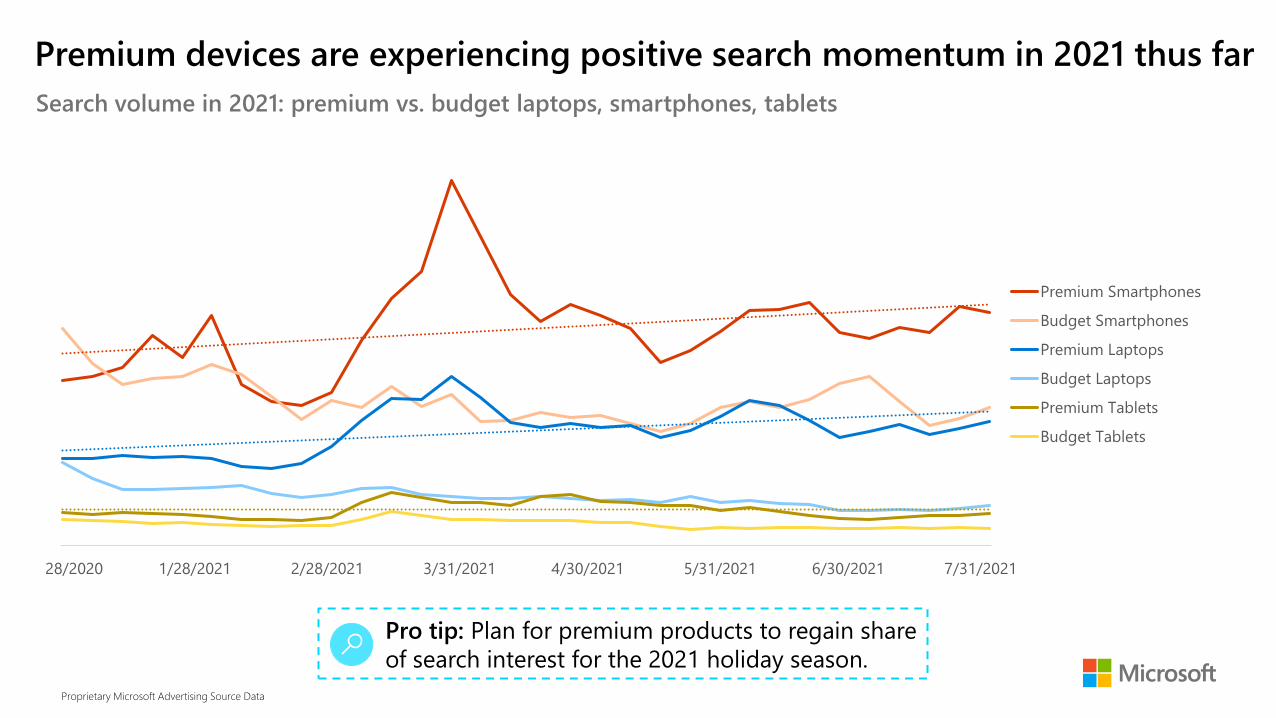
Premium devices are experiencing positive search momentum in 2021 thus far
Search volume in 2021: premium vs. budget laptops, smartphones, tablets
12/28/2020 1/28/2021 2/28/2021 3/31/2021 4/30/2021 5/31/2021 6/30/2021 7/31/2021
Premium Smartphones
Budget Smartphones
Premium Laptops
Budget Laptops
Premium Tablets
Budget Tablets
Pro tip: Plan for premium products to regain share
of search interest for the 2021 holiday season.
Proprietary Microsoft Advertising Source Data

Searchers in market for budget smartphones are less likely to search for
premium devicesCorrelation matrix: search volume
Budget laptops Budget smartphones Budget tablets Premium laptopsPremium
smartphonesPremium tablets
Budget laptops
Budgetsmartphones 0.51
Budget tablets 0.50 0.67
Premium laptops 0.36 0.15 0.36
Premium
smartphones 0.42 0.21 0.35 0.90
Premium tablets 0.33 0.46 0.74 0.66 0.59
Pro tip: those in the market for budget laptops and
tablets may also be likely to jump to premium options.
Proprietary Microsoft Advertising Source Data

Key takeaways
shopping earlier this holiday season
multi-channel strategy longer conversion windows
around or slightly lower than last year
premium devices
also be interested in premium options

To get actionable data, insights and best practices to
help make decisions and grow your business, visit
MicrosoftAdvertising.com/Insights


