Modeling pyrolysis of a LLDPE through a coupled DSC/TGA analysis gidai.unican.es Workshop on mathematical modelling of combustion 5th Meeting of the Spanish Section of the Institute of Combustion
Transcript
Modeling pyrolysis of a LLDPE through a coupled DSC/TGA analysis
gidai.unican.es
Workshop on mathematical modelling of combustion5th Meeting of the Spanish Section of the Institute of Combustion
GIDAI Group
GIDAI is a Research and Development Group at the Universityof Cantabria, oriented for more than 15 years studying thephenomena associated with the Fire Science and HumanResponse in Emergency Conditions and transferring them toimprove levels of fire safety in the society.
GIDAI Fire Science Lab
STA (Simultaneous Thermal Analysis)
Features: - Temperature range: ambient to 1500ºC - Inert and oxidative atmosphere analysis - DSC/TGA simultaneous analysis Applications:- Melting/Crystallization performance - Solid - solid transitions - Polymorphic structures detection - Degree of crystallinity determination - Glass transitions characterization - Oxidative stability analysis - Thermal stability analysis - Mass changes - Specific Heat determination - Thermokinetic analysis
LFA (Laser Flash Analysis)
Features: - Temperature range: ambient to 300ºC - Thermal conductivity range: 0.1 to 2000W/mKApplications: - Thermal diffusivity determination - Thermal conductivity analysis from solids and composites (until three layers) - Specific heat analysis (accuracy 5%)
Features: - Accuracy mass up to 5 micrograms Applications: - Density of solids by Arquimedesprincipium
GIDAI Fire Science Lab
Dual Cone Calorimeter
Features: - Load mass cell (accuracy 0.1g) - FTIR measure - Corrosimeter attachment - Radiative heat flux range: up to 100 kW/m2 Applications: - Mass loss rate determination - Heat release rate by oxygen depletion - Smoke release rate - Effective Heat of combustion - Released gases by FTIR analysis - Corrosive potential of combustion products (ASTM D5485) - Critical flux to ignition
Mass Loss Calorimeter
Features: - Load mass cell (accuracy 0.1g) - Radiative heat flux range: up to 100 kW/m2 - Controlled atmosphere Applications: - Mass loss rate determination - Heat release rate determination -Effective heat of combustion
Fire Propagation Apparatus
Features: - Load mass cell (accuracy 0.1g) - Infrared heaters heat flux range: up to 65 kW/m2 - Air distribution chamber Applications: - Fire propagation index - Chemical and convective heat release rate determination - Effective heat of combustion - Thermal response parameter -Critical flux to ignition - Released gases by FTIR analysis
GIDAI Fire Science Lab
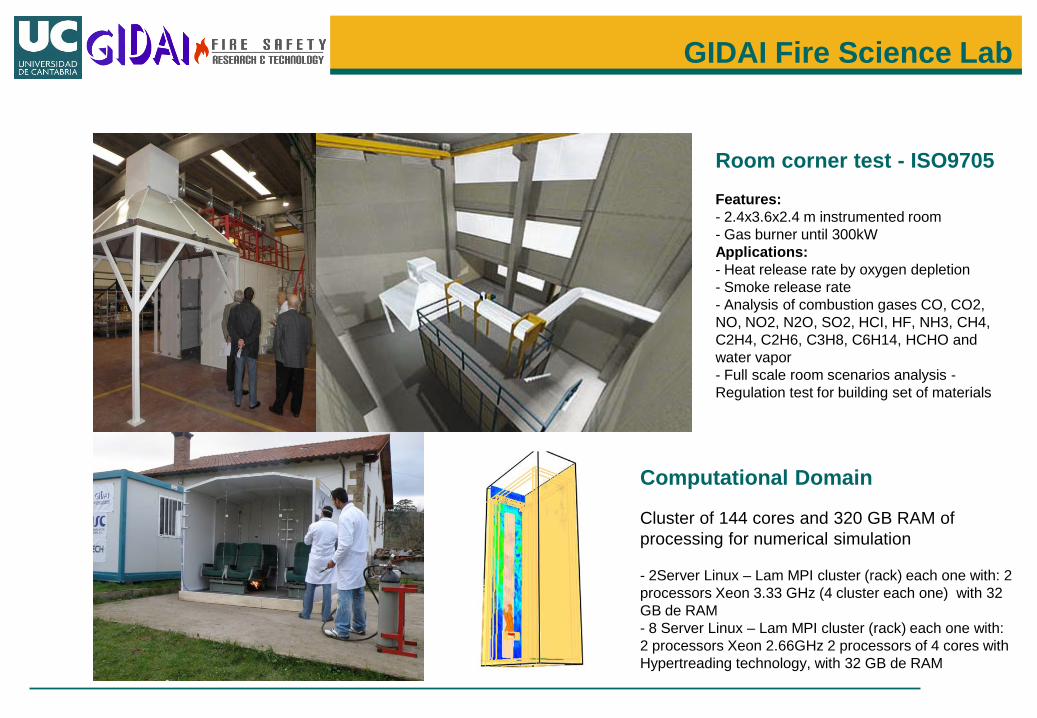
Room corner test - ISO9705 Features: - 2.4x3.6x2.4 m instrumented room - Gas burner until 300kW Applications: - Heat release rate by oxygen depletion - Smoke release rate - Analysis of combustion gases CO, CO2, NO, NO2, N2O, SO2, HCI, HF, NH3, CH4, C2H4, C2H6, C3H8, C6H14, HCHO and water vapor - Full scale room scenarios analysis -Regulation test for building set of materials
Computational Domain
Cluster of 144 cores and 320 GB RAM of processing for numerical simulation
- 2Server Linux – Lam MPI cluster (rack) each one with: 2 processors Xeon 3.33 GHz (4 cluster each one) with 32 GB de RAM- 8 Server Linux – Lam MPI cluster (rack) each one with: 2 processors Xeon 2.66GHz 2 processors of 4 cores with Hypertreading technology, with 32 GB de RAM
Introduction
Interest in tools for modeling the material performanceunder fire conditions
Regulation requirements in Fire Safety isbased on large-scale and small-scale tests
This study is focused on pyrolysis models which represent one of the major bottlenecks
We need comprehensive modelswhich need to be scale-independent
prEN 50399-2-1 test for Low Voltage cables
“n—process of simultaneous phase and chemicalspecies change caused by heat” -- ASTM-E176Standard Terminology of Fire Standards
Mathematical Model
Ω’
ΩΣ
- Pyrolysis is the only heat source or sink within the solid
tTc
th
zTk
zyTk
yxTk
x pp ∂∂
=∂
∂∆+
∂∂
∂∂
+
∂∂
∂∂
+
∂∂
∂∂ Ω
ΩΩΩ
ΩΩΩΩ
ρρ
- Density, ρ (kg/m3)- Specific heat capacity, cp (J/kg∙K)- Heat of pyrolysis, ∆hp (J/kg)- Thermal conductivity, k (W/m∙K)
To perform heat conduction and thus to obtain the temperature profile
- Conversional factor, α- Reaction mechanism, f(α)- Pre-exponential factor, Z (s-1)- Apparent Energy of activation, E (j/mol)
Computational Model
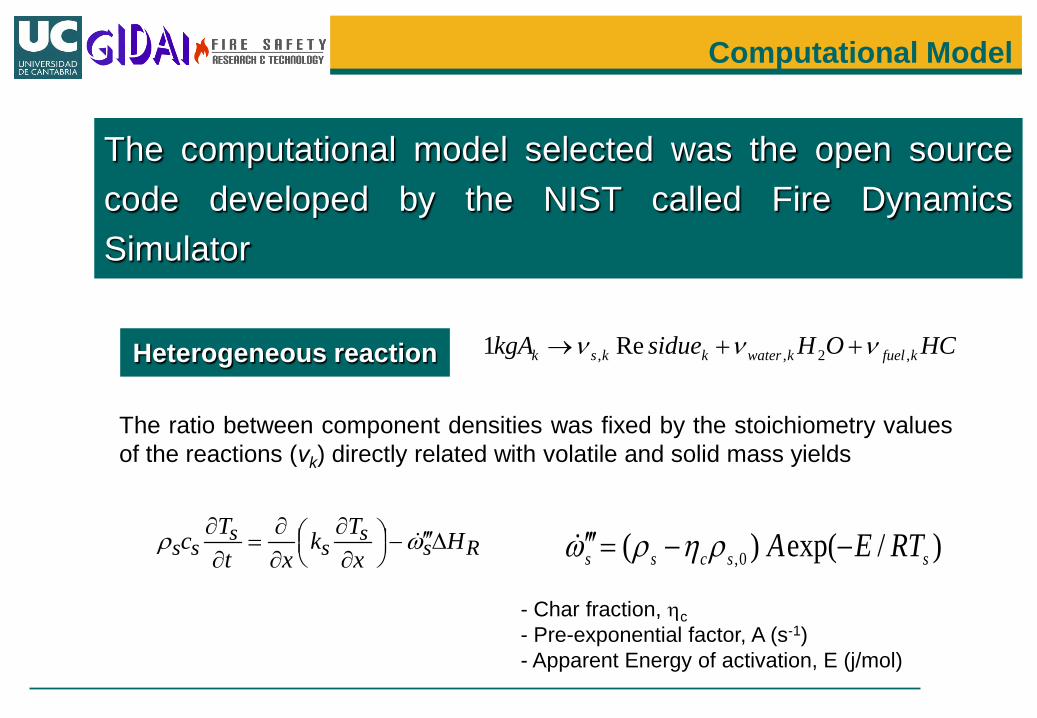
The computational model selected was the open sourcecode developed by the NIST called Fire DynamicsSimulator
The ratio between component densities was fixed by the stoichiometry valuesof the reactions (νk) directly related with volatile and solid mass yields
Heterogeneous reaction
Rss
ss
ss HxTk
xtTc ∆′′′−
∂∂
∂∂
=∂
∂ ωρ )/exp( )( 0, sscss RTEA −−=′′′ ρηρω
- Char fraction, ηc- Pre-exponential factor, A (s-1)- Apparent Energy of activation, E (j/mol)
HCOHsiduekgA kfuelkwaterkksk ,2,, Re1 ννν ++→
Computational Model
Homogenous gas reaction
All the species mass fractions are only functions of the mixture fraction, Z (Burke-Schumann flame structure)
Damköhler number >> 1 (Chemical equilibrium YF.YO2=0)
- Species yield, Yi (kg/kg)- Enthalpy of combustion of Oxygen, ∆HO- Scale length of Large Eddy filtering, DLES- Molecular mass, Mi- Mixture fraction on flame sheet, Zf
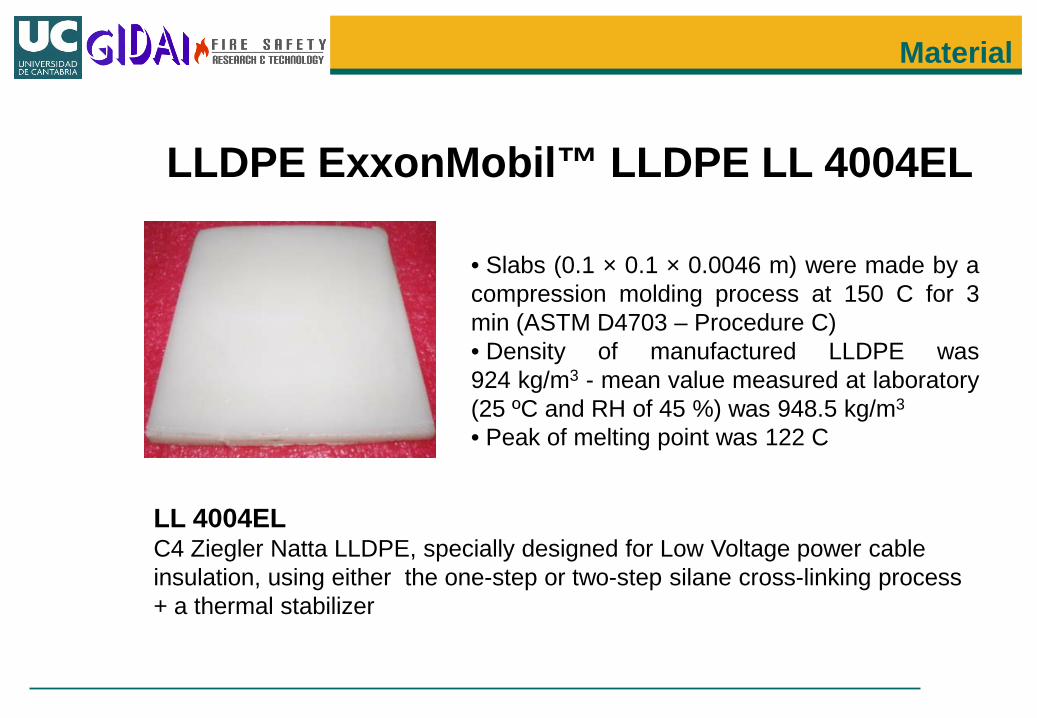
• Slabs (0.1 × 0.1 × 0.0046 m) were made by acompression molding process at 150 C for 3min (ASTM D4703 – Procedure C)• Density of manufactured LLDPE was924 kg/m3 - mean value measured at laboratory(25 ºC and RH of 45 %) was 948.5 kg/m3
• Peak of melting point was 122 C
LL 4004ELC4 Ziegler Natta LLDPE, specially designed for Low Voltage power cable insulation, using either the one-step or two-step silane cross-linking process + a thermal stabilizer
LLDPE ExxonMobil™ LLDPE LL 4004EL
Simultaneous Thermal Analysis
• Sample mass in the range of 7–10 mg• Heating process was from 30 C to 600 C at rates (β) of 2, 5 and 10 C·min-1
• Test were conducted in nitrogen and air (80/20) atmospheres• Sample holder within the platinum oven was purged with a continuous flow of 10-6 m3·s-1
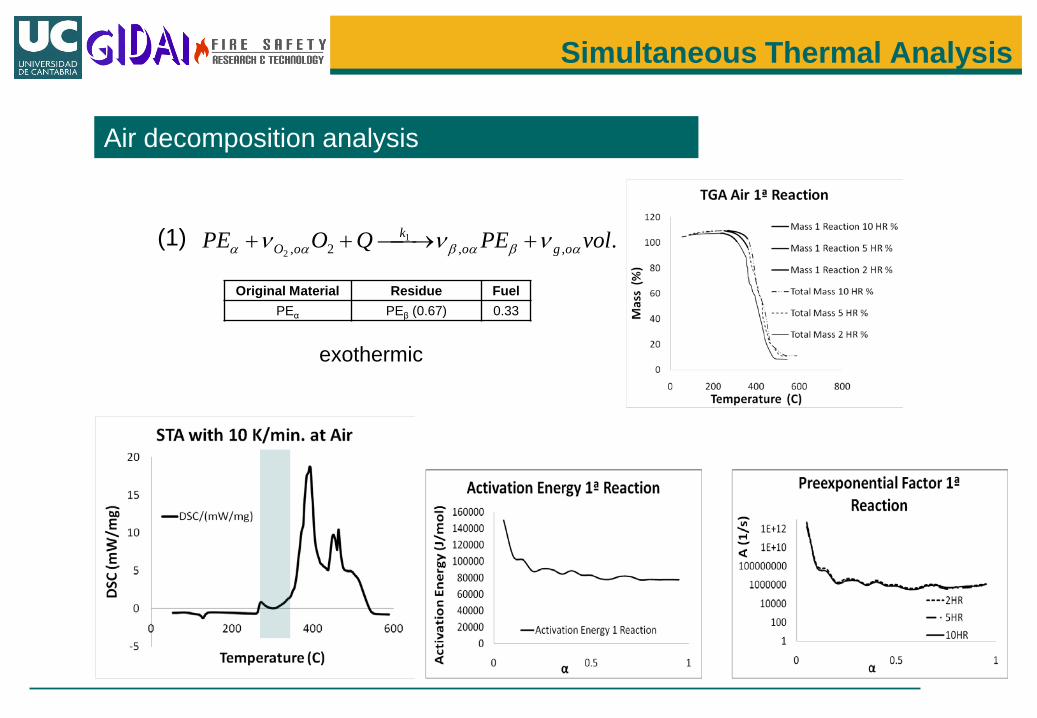
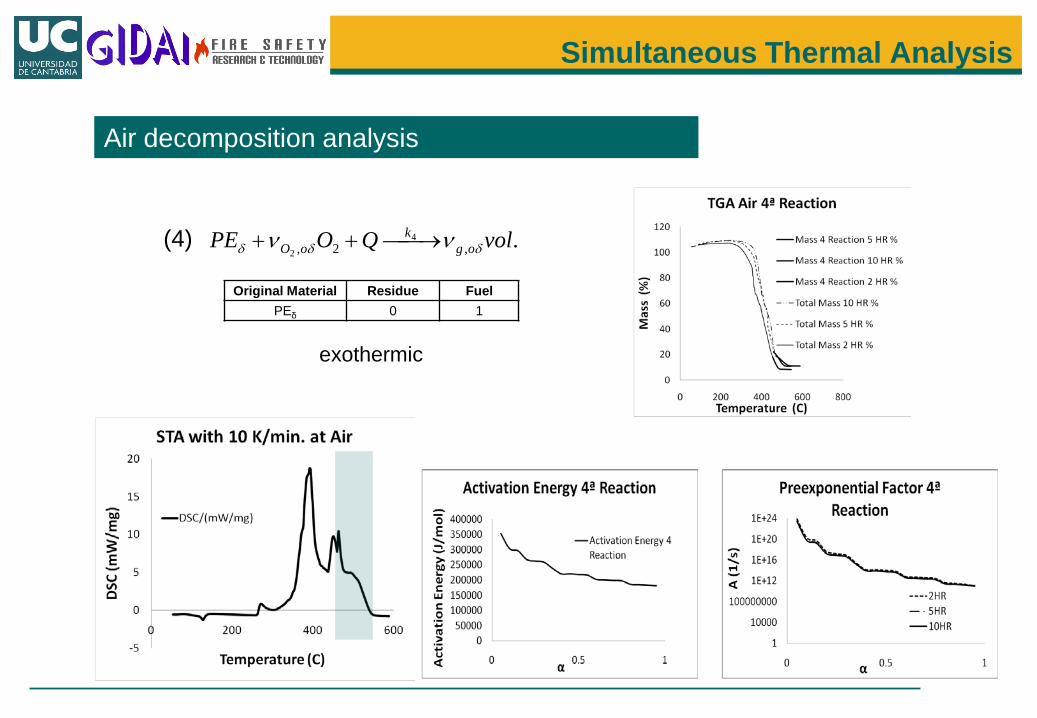
The mass loss process was one step process (there was not changes in the slope tendency), so the global reaction scheme supposed was:
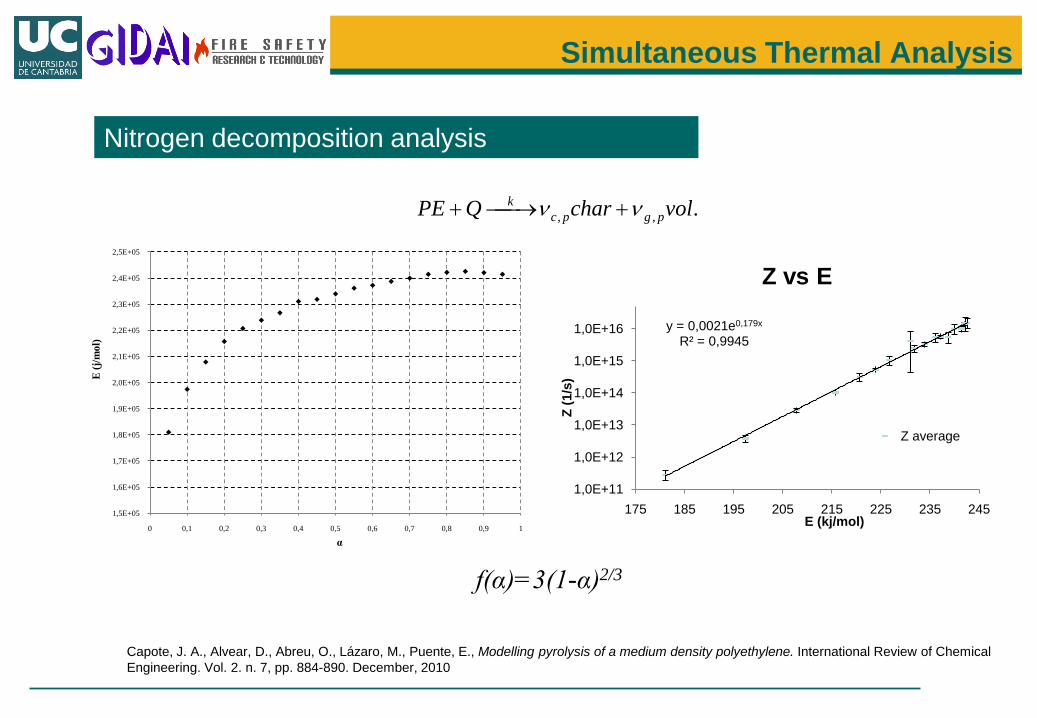
.,, volcharQPE pgpck νν +→+
Simultaneous Thermal Analysis
Nitrogen decomposition analysis
Capote, J. A., Alvear, D., Abreu, O., Lázaro, M., Puente, E., Modelling pyrolysis of a medium density polyethylene. International Review of Chemical Engineering. Vol. 2. n. 7, pp. 884-890. December, 2010
1,5E+05
1,6E+05
1,7E+05
1,8E+05
1,9E+05
2,0E+05
2,1E+05
2,2E+05
2,3E+05
2,4E+05
2,5E+05
0 0,1 0,2 0,3 0,4 0,5 0,6 0,7 0,8 0,9 1
E (j
/mol
)
α
y = 0,0021e0,179x
R² = 0,9945
1,0E+11
1,0E+12
1,0E+13
1,0E+14
1,0E+15
1,0E+16
175 185 195 205 215 225 235 245
Z (1
/s)
E (kj/mol)
Z vs E
Z average
f(α)=3(1-α)2/3
.,, volcharQPE pgpck νν +→+
Simultaneous Thermal Analysis
Nitrogen decomposition analysis
Capote, J. A., Alvear, D., Abreu, O., Lázaro, M., Puente, E., Modelling pyrolysis of a medium density polyethylene. International Review of Chemical Engineering. Vol. 2. n. 7, pp. 884-890. December, 2010
*L´vov interpretation of activation energyvariation (one – step reaction)B. V. L’vov, The Physical approach to theinterpretation of the kinetics mechanisms ofthermal decomposition of solids: the state of theart. Thermochimica Acta 373, 97-124, (2001)
Original Material Residue FuelLLDPE Char (0.01) 0.99
Activation Energy j/mol 250000 175000 230000 180000Reaction Order 0.8 0.6 1.0 0.5Heat Reaction kj/kg 800 600 -2500 -2000
CHARUnits Max Min
Specific Heat J/kgK 1.5 0.5Conductivity W/mK 0.2 0.05
Emissivity 0.95 0.8
Range of LLDPE pyrolysis parameters in air atmosphere
Cone Calorimeter - FTIR
Cone calorimeter – FTIR
Resolution: 3.86 cm-1
Scan frequency: 10 spectra/s Aperture: 1’’ Detector: Thermo-electrically cooled DTGS IR-source: Ceramic, SiC, 1550 K temperature Beam splitter: ZnSeWindow material: ZnSeWave number range:700 – 4200 cm-1 with ZnSe/DTGS
GASMET CX spectrometer
The FTIR device was coupled to the duct at the same point that the coneobtains your inputs, the gas was sustained at 180 C during the transport to thespectrometer
Cone Calorimeter - FTIR
Cone calorimeter analysis
-100
0
100
200
300
400
500
600
700
800
900
1000
-10
0
10
20
30
40
50
60
0 50 100 150 200 250 300 350H
eat
re
leas
e r
ate
(kW
/m2)
Mas
s lo
ss r
ate
(g/
m2s)
tiempo (s)
Specific MLR (g/s·m²)HRR (kW/m²)6 per. media móvil (Specific MLR (g/s·m²))
-100
0
100
200
300
400
500
600
700
800
-10
0
10
20
30
40
50
0 50 100 150 200 250 300 350
He
at r
ele
ase
rat
e (
kW/m
2)
Mas
s lo
ss r
ate
(g/
m2s)
tiempo (s)
Specific MLR (g/s·m²)HRR (kW/m²)6 per. media móvil (Specific MLR (g/s·m²))
The results were in accord with the results obtained by Shaulov AS, Shchegolikhin AS, Glushenko PG, Koverzanova EK, Rakhimkulov AR, Shilkina NS,Lomakin, S. High-Temperature Thermal Degradation of Polyethylene in an Inorganic Polyoxide Matrix Doklady Physical Chemistry 2005 Jan; 398 Vol.398 part. 1, 231-235, January 2005.
The spectra shows the characteristic peaksof H2O and CO2 around 3600 cm-1 and 2400cm-1 due to stretching of the O-H and C=Ogroups
A direct comparison between the two testshows that the ethylene, the methane andthe species with C6 were the most abundantin the mixture fuel
-0.2
0
0.2
0.4
0.6
0.8
1
1.2
1.4
1.6
1.8
50010001500200025003000350040004500
R
K (cm-1)
Cone Calorimeter - FTIR
Combustion Fuel
Ethylene was selected as the first try to characterize the combustion of LLDPE, because theproduction of this one seems to be logical, as consequence of the heating up of the linealchains of polyethylene
We can see the stoichiometry of the reaction on mixture fraction based when the CO yieldwas prescribed to 0.3% as the mean value of the FTIR results, Z=Z1+Z2
Finally the heat of combustion was into the range of [30000 – 35000] kJ/kg from the conecalorimeter results
COOHCOOOHC COOHCOO νννν ++→+ 222142 222
01F
F
YYZ = 02
2
2]2[ F
CO
COCO
F
YY
MMZ
ν−=
47.0== COCO
FCO Y
MMν 2
2=OHν 53.12
2=−= COCO νν 26.2
21
2
22=
−++= OHCO
COO
νννν
Computational Model
The idea was obtain the difference of temperature between the sample and the samesample (same density, specific heat, emissivity and conductivity) without reaction (nokinetic parameters) when the temperature increase at 10 C/min
The computational domain was a 9x4x3 mmoven, and cell size were 1x1 mm and0.2x0.2 mm for the gas phase and 0.0045mm for the solid phase cell
The STA 449 F3 used was on heat flux based and then uses the temperaturedifference to obtain the flux
- k is the conductivity of the platinum. k platinum=71.6 W m-1 K-1
- A is the area. 0.1x2 mm2
- ∆x, is the length between the sample and the reference. 1.2 cm
Simultaneous Thermal Analysis
xTAk
xTAkq
∆∆
⋅⋅=∂∂
⋅⋅= TTmxTTKTq ∆⋅=∆⋅=
−
)(1019.1)()(
3
Computational Model
Optimization Algorithm
Determined by fitness (error estimator)
f1,j : relative squared error of the actual value obtained for DSC and TG signals (Xi)f2,j : relative squared error of the value obtained in simulation for the same criterion.θ1,δ1,θ2,δ2: optimization parameters of the process. They are used to weight thecontributions of real and simulated values. (default values: 1,1,0.1,1)
fj: error assigned to individual j
Keeps the 12.5% of the best results of each generation (Elitism)
The genetic processes of crossover and mutation
−=
−=
∑ ∑∑ ∑
k sim
i testsimj
k test
i testsimj
kxkixkix
f
kxkixkix
f
)()),(),((
)()),(),((
2
,2
2
,1
])()[( 212,21,1
δδ θθ ⋅+⋅= jjj fff
Computational Model
Optimization Process
Computational Model
Cone Calorimeter Model
One-dimensional configuration
z
heat flux
4.8x10⁻³ m
0.1 m
backing insulated
The computational domain was a 10x10x2 cm, and cell size were 0.25x0.25 mm for thegas phase and 5 µm for the solid phase cell
The 50 kW/m2 mass loss rate was selected as the validation data
- Complex process of decomposition and volatilization can be represented bysimple models in nitrogen and air atmospheres using the change of the tendencyof the mass loss curve as criterium
- Evolutionary algorithms helped with a complete experimental analysis of thematerial allows obtain computational parameters close to the real properties, butit is necessary obtaining a great ratio between complexity of the whole processand the simulation time
- The parameters values obtained by analysis of milligram scale seems to beaccurate enough to characterize process at bench scales
Future Work
- The combustion process should include the prediction of some species such ascarbon monoxide without a constant ratio CO/CO2 and also the production ofnitrogen oxides
- The real scale problems such as the EN50399-1chamber (8m3) couldn’t be represented by complexesmechanism like the thermoxidation of LLDPE becausethe simulation time exponentially increase and for thisfact we are working with neural networks to representmaterial behaviour
- The stoichiometry of fuel combustion is not accurate enough and we should beable to find a criteria that allows us including it to the optimization process
Thanks
Dpto. de Transportes y Tecnología de Proyectos y Procesos
UNIVERSIDAD DE CANTABRIA-Dirección:GIDAI – Seguridad contra Incendios – Investigación y Tecnología
E.T.S. Ingenieros Industriales y TelecomunicaciónAvda. Los Castros, s/n39005 SANTANDER (Cantabria). ESPAÑATelf. +34 942-20.1826 Fax: +34 942-20.1873