24
October | 2018 Roadshow Presentation
| Date post: | 05-Nov-2018 |
| Category: |
Documents |
| Upload: | trinhkhanh |
| View: | 215 times |
| Download: | 0 times |

O c t o b e r | 2 0 1 8
Roadshow
Presentation

This presentation is not an offer to sell or the solicitation of an offer to buy any securities of S.A.C.I. Falabella (“Falabella” or the “Company”), nor will there be any sales of securities of the Company in any jurisdiction in which the offer, solicitation or sale would be unlawful prior to
registration or qualification under the securities laws of any such jurisdiction. The shares have not been and will not be registered under the Securities Act of 1933, as amended (the “Act”), or under any state securities laws. Accordingly, the shares described herein will be offered in the U.S.
only to qualified institutional buyers as defined under Rule 144A under the Act and outside the U.S. to Non-U.S. persons as defined under Regulation S under the Act. Securities may not be offered or sold in the U.S. unless they are registered or exempt from registration under Act.
Recipients of this presentation should carefully review the offering memorandum relating to the offering of the shares described herein, including the risk factors in that offering memorandum, before making any investment decision.
This presentation has been prepared exclusively by Falabella. The Company has prepared this presentation solely for use in connection with the proposed offering of its shares and takes responsibility for its contents. No other person is responsible for its contents.
This presentation makes reference to certain non-IFRS measures. These non-IFRS measures are not recognized measures under IFRS, do not have a standardized meaning prescribed by IFRS and are therefore unlikely to be comparable to similar measures presented by other
companies. Rather, these measures are provided as additional information to complement IFRS measures by providing further understanding of Falabella’s results of operations from a management perspective. Accordingly, they should not be considered in iso lation nor as a substitute for
analysis of Falabella’s financial information reported under IFRS. A reconciliation of all non-IFRS measures used in this presentation to the most comparable IFRS metric is included at the end of this presentation.
This presentation is strictly confidential and is provided for informational purposes only. It is information in summary form and does not purport to be complete. Any opinion expressed herein is subject to change without notice, and neither the Company, the Selling Shareholder nor J.P.
Morgan Securities LLC , Merrill Lynch, Pierce, Fenner & Smith Incorporated (collectively, the “International Bookrunners”) is under an obligation to update or keep current the information herein. No representation or warranty, express or implied, is made concerning, and no reliance should
be placed on, the accuracy, fairness or completeness of this information. This presentation does not give and should not be construed as giving investment, legal, tax or other advice.
This presentation is not intended to be relied upon as advice to potential investors and does not form the basis of an informed decision. By participating in this presentation, each participant agrees to the terms hereof, including that it will, and wil l cause its directors, officers, employees,
affiliates, agents, advisors and representatives to, use the information contained in this presentation only to evaluate the proposed transaction. This presentation and its contents are confidential and proprietary to the Company, and no part of it or its subject matter may be reproduced,
redistributed, passed on, or the contents otherwise divulged, directly or indirectly, to any other person or published in whole or in part for any purpose without the prior written consent of the Company. If this presentation has been received in error, it must be returned immediately to the
Company.
This presentation includes forward-looking statements. All statements other than statements of historical fact included in this presentation, including, without limitation, those regarding certain prospective resources, contingent resources, financial position, business strategy, plans and
objectives or future operations are forward-looking statements. These statements are often characterized by the use of words such as “believes,” “expects,” “estimates,” “projects,” “may,” “will,” “intends,” “plans” or “anticipates,” and similar terms and phrases. These forward-looking
statements involve known and unknown risks, uncertainties and other factors, which may cause the certain actual resources, reserves, results, performance or achievements to be materially different from those expressed or implied by these forward-looking statements.
Estimates and forward-looking statements are not guarantees of future performance and actual results may differ as a result of various factors and assumptions. Participants are cautioned not to place undue reliance on forward-looking statements.
Any forward-looking statement contained in this presentation is based on the assumptions and beliefs of the Company in light of the information currently available to it. These assumptions and beliefs of the Company are based on information concerning the Company and the industry and
countries in which it operates. The Company assumes no obligation to publicly update or revise these forward-looking statements for any reason, or to update the reasons why actual results could differ materially from those anticipated in these forward-looking statements, even if new
information becomes available in the future, except as otherwise required by applicable law.
This presentation does not constitute or form part of any offer or invitation for sale or subscription of or solicitation or invitation of any offer to buy or subscribe for any securities, nor shall it or any part of it form the basis of or be relied on in connection with any contract or commitment
whatsoever.
An offer to sell or a solicitation of an offer to buy any securities of the Company will occur solely by means of (a) a confidential offering memorandum or (b) a Spanish-language prospectus registered with the local Comisión para el Mercado Financiero (the Chilean Financial Markets
Commission, or the “CMF”).
By participating in this presentation or by agreeing to view any of the materials presented, you agree to be bound by the foregoing limitations.
LA COMISIÓN PARA EL MERCADO FINANCIERO NO SE PRONUNCIA SOBRE LA CALIDAD DE LOS VALORES OFRECIDOS COMO INVERSIÓN. LA INFORMACIÓN CONTENIDA EN ESTA PRESENTACIÓN ES DE RESPONSABILIDAD EXCLUSIVA DEL EMISOR.
Señor inversionista:
Antes de efectuar su inversión usted deberá informarse cabalmente de la situación financiera de Falabella y deberá evaluar la conveniencia de la adquisición de estos valores.
El intermediario deberá proporcionar al inversionista la información contenida en el Prospecto presentado con motivo de la solicitud de inscripción al Registro de Valores, antes de que efectúe su inversión.
The information described in this presentation is a synthesis of the Spanish-language prospectus registered with the Comisión para el Mercado Financiero and the complete information that Falabella provides to the market about this transaction is in the aforementioned Spanish-language
prospectus registered with the Comisión para el Mercado Financiero.
“This presentation freely translates into Spanish the presentation made in English language for the international private placement of common shares by S.A.C.I. Falabella (“Falabella”), originated from a capital increase approved on August 20, 2018 by the extraordinary shareholders’
meeting of Falabella, and a concurrent and synchronized secondary offer of shares in Falabella owned by Inversiones Los Olivos S.A. It is intended to be made available to investors in Chile within a public offering of such securities. The issuance of the new shares has been registered in
the Securities Registry (Registro de Valores) of the Chilean Financial Markets Commission (Comisión para el Mercado Financiero, or “CMF”). As required by applicable law, this presentation has been sent to the CMF and is being published in the website of the issuer”.
Disclaimer

AGENDA
USE OF PROCEEDS01.
FALABELLA AT A
GLANCE02.
RETAIL MARKET
OPPORTUNITY03.
FALABELLA’S UNIQUE
POSITION TO
CAPTURE MARKET
OPPORTUNITY
05.
STRATEGY04.
APPENDIX: KEY
FINANCIALS06.

4USE OF PROCEEDS
S.A.C.I. Falabella (“Falabella”)Issuer
Santiago Stock Exchange registered offering with international distribution efforts through 144A/Reg S format
Distribution format
70.7 mm common sharesOffering size
49.7 mm primary shares (from a capital increase of 84.3 mm common shares)21.0 mm secondary shares from Inversiones Los Olivos S.A.
Offering composition
Subasta de Libro de Órdenes on the Santiago Stock ExchangeAuction mechanism
90 daysLock-Up
LatAm roadshowInternational roadshow in key money centers
Roadshow
Syndicate INTERNATIONALBOOKRUNNER
INTERNATIONALBOOKRUNNER
LATAMBOOKRUNNER
LATAMBOOKRUNNER

5USE OF PROCEEDS
INVEST IN THE COMPANY GROWTH STRATEGY
US$285M
US$138m fund the
acquisition of Linio
US$147m
strengthen its
operation
US$200M US$80M
Develop logistic
and e-payment
solutions
US$120M
Invest in data
analytics and
cybersecurity to
better know our
customers
Consolidate
Sodimac brand
operations in Brazil
+11% Free float
increase1
BALANCE SHEET
FLEXIBILITY
US$150M
Finance the IKEA
project
Source: Company Filings and Bloomberg as of September 23rd, 2018.1 Falabella´s free float increase from 26.5% to 29.3%
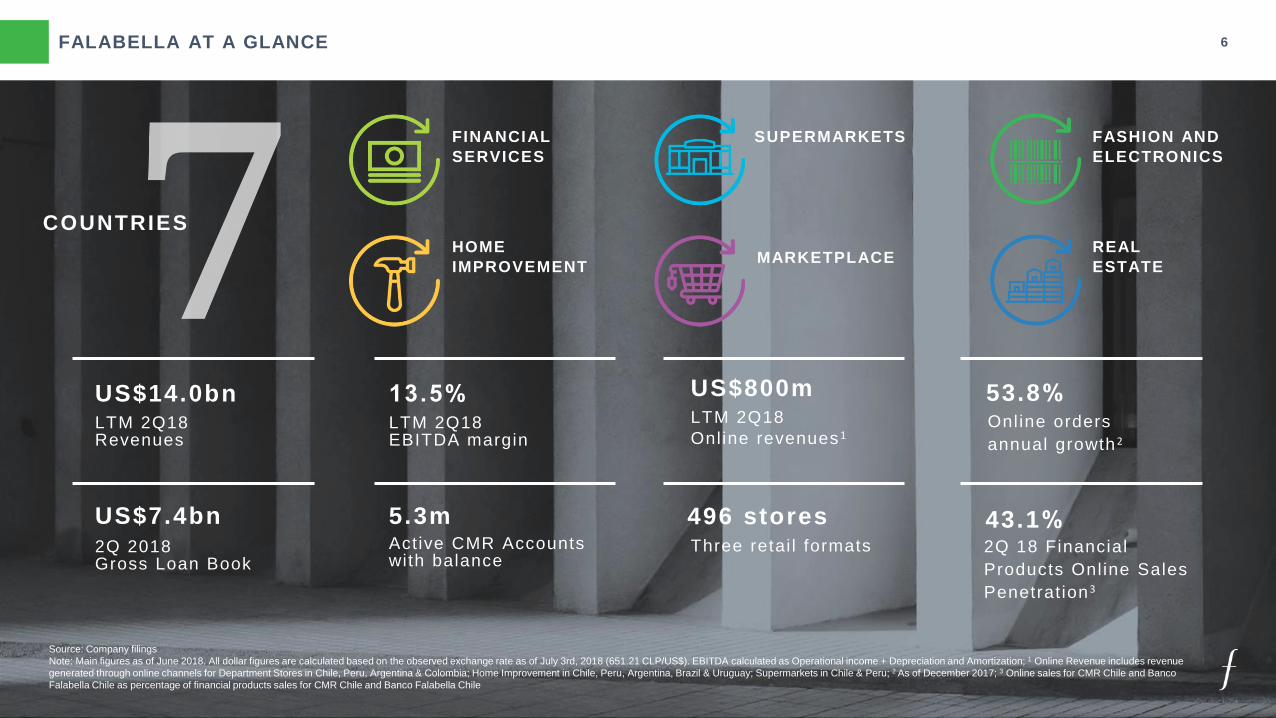
FALABELLA AT A GLANCE 6
COUNTRIES
FINANCIAL
SERVICES
HOME
IMPROVEMENT
SUPERMARKETS FASHION AND
ELECTRONICS
MARKETPLACEREAL
ESTATE
Source: Company filings
Note: Main figures as of June 2018. All dollar figures are calculated based on the observed exchange rate as of July 3rd, 2018 (651.21 CLP/US$). EBITDA calculated as Operational income + Depreciation and Amortization; 1 Online Revenue includes revenue
generated through online channels for Department Stores in Chile, Peru, Argentina & Colombia; Home Improvement in Chile, Peru, Argentina, Brazil & Uruguay; Supermarkets in Chile & Peru; 2 As of December 2017; 3 Online sales for CMR Chile and Banco
Falabella Chile as percentage of financial products sales for CMR Chile and Banco Falabella Chile
US$14.0bnLTM 2Q18Revenues
13.5%LTM 2Q18EBITDA margin
US$800mLTM 2Q18
Online revenues 1
53.8%
US$7.4bn
2Q 2018Gross Loan Book
5.3mActive CMR Accounts with balance
496 storesThree retai l formats
43.1%2Q 18 Financial
Products Onl ine Sales
Penetrat ion 3
Online orders
annual growth 2
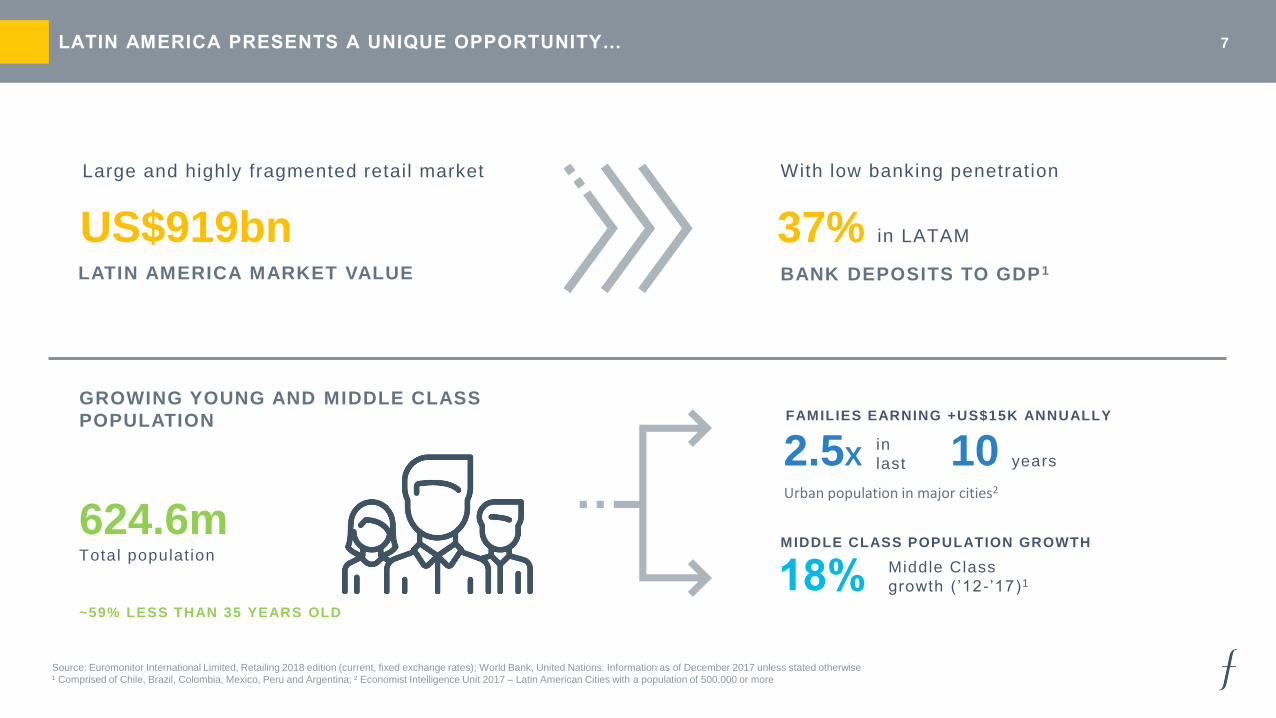
7LATIN AMERICA PRESENTS A UNIQUE OPPORTUNITY…
US$919bn
Large and highly fragmented retail market
LATIN AMERICA MARKET VALUE
37% in LATAM
BANK DEPOSITS TO GDP1
With low banking penetration
GROWING YOUNG AND MIDDLE CLASS
POPULATION
624.6mTotal populat ion
~59% LESS THAN 35 YEARS OLD
2.5X
FAMILIES EARNING +US$15K ANNUALLY
10in
last
Urban population in major cities2
18% MIDDLE CLASS POPULATION GROWTH
Middle Class
growth (’12 - ’17)1
Source: Euromonitor International Limited, Retailing 2018 edition (current, fixed exchange rates); World Bank, United Nations. Information as of December 2017 unless stated otherwise
¹ Comprised of Chile, Brazil, Colombia, Mexico, Peru and Argentina; ² Economist Intelligence Unit 2017 – Latin American Cities with a population of 500.000 or more
years

…WITH STRONG DIGITAL USAGE AND GROWING E -COMMERCE… 8
Sources: Euromonitor International Limited, Retailing 2018 edition (current, fixed exchange rates), Digital Consumer 2018 edition (current, fixed exchange rates), Information as of December 2017
1 Calculated as regional e-Commerce retail value / regional retail value; 2 Excludes LatAm
>65%
Visit social media almost every day, over 80% visit 1-2 times per month
357m
Active internet users
49%
Internet users growth between 2012-2017
5%
e-Commerce penetration1
vs 14.5% global average2
3.07x
e-Commerce market size growth between 2012-2017
US$38bn
Latin America’s e-Commerce Market Value

...WHERE RETAIL PHYSICAL PENETRATION IS RELATIVELY LOW 9
STORES ARE TYPICALLY SMALLER THAN IN THE US
3,500 sqmFalabella average store size
S U P E R M AR K E T S
D E P AR T M E N T S T O R E S
9,100 sqmUS benchmark average store size
6,500 sqmFalabella average store size
13,700 sqmUS benchmark average store size
754SQM OF RETAIL
FOR EVERY 1,000
PEOPLE
CONTINENTALEUROPE 1 1,065 sqm
US 2,431 sqm
UK 1,291 sqm
V
S
Sources: Euromonitor International Limited Retailing 2018 edition; Company Fillings1 Excludes UK

10FALABELLA: A FULLY OMNICHANNEL REGIONAL RETAILER
We simplify Latin American consumers’ life by transforming their
purchasing experiences
CUSTOMERS

11TRANSFORMING INTO A DIGITAL ECOSYSTEM LEVERAGING OUR UNMATCHED INFRASTRUCTURE…
Data AnalyticsBusiness intelligence
Payment solutions Open platform with tools for
our customers, merchants
LogisticLeverage on our
Distribution centres and
logistic network
Financial solutionsConsumer Loans to our
customers
Merchants financing
Market PlaceSellers integrate into our
platform
Longtail
Seller.com
LoyaltyCustomer knowledge
Novelty

…BASED ON FIVE PRIORITIES 12
Strategic
Priorities
01.OWN BRANDS
AND LONG TAIL PRODUCTS
02.SCALING UP LOGISTICS
AND FULFILLMENT
03.FINANCING AND
ELECTRONIC PAYMENTS
04.DATA ANALYTICS
AND BUSINESS INTELIGENCE
05.TECHNOLOGICAL PLATFORM
DEVELOPMENT

FOCUS ON ENHANCING OUR OWN BRANDS’ PROPOSITION... 13
An exclusive offer with strong positioning,DIFFERENTIATION
A.
High quality / price relationship, CONVENIENT PROPOSITIONB.
Stronger marginsPROFITABILITYC.
FASHION
HOME IMPROVEMENT
FOOD

Continuously adapting to meet emerging trends
Sustainability
IKEA
business
dimension
IKEA business dimension
Opportunity to partner with a well-known home furnishings retailer with a
strong private brand portfolio
Focused on providing a democratic design,
delivering quality products at affordable prices
Emphasis on the design, not the designer
…FURTHER STRENGTHENED BY OUR PARTNERSHIP WITH IKEA
PARTNERSHIP TO DEVELOP AND OPERATE STORES AND
ECOMMERCE IN CHILE, PERU & COLOMBIA
14

INCREASE SERVICE LEVELS BY SCALING UP LOGISTICS 15
Seller Reception
Storage & picking
X-Dock
Exit
Delivery
Falabella Warehouse
Customer
Supplier Delivery
Stores and
transfer centers
STRATEGIC FOCUS
SERVING
CUSTOMERS
AND THIRD PARTIES
FOCUSING ON
LAST MILE STRENGTHENING
INFRASTRUCTUREIn-house
tracking system

16INTRODUCTION OF E-PAYMENTS SOLUTIONS
We seek to build an open platform with tools for our customers, merchants
and marketplace
FRAUD
MANAGEMENT
MERCHANT
FINANCING
TRANSACTION
TRACKING
PAYMENT
RECONCILIATION
ONE-CLICK
PAYMENTS
FINANCIAL
PRODUCTS
LOYALTY
PROGRAMS
INSURANCE

17LEVERAGE ON OUR CUSTOMER KNOWLEDGE UNDERPINNED BY THE DEVELOPMENT OF BUSINESS
INTELLIGENCE
Customer Behaviour
+5 .3Mactive CMR
accountsw/balance
256Bank
branches
+27M Followers on social networks
MEANS
OF PAYMENT
HOW MUCH
DOES THE
CUSTOMER
SPEND
WHAT DOES
THE
CUSTOMER
LIKE
+324Mtransactions in the retail business
+390Mvisits to our shopping centersin the region
+500M
WHEN DOES
THE CUSTOMER
PURCHASE
WHERE DOES
THE CUSTOMER
PURCHASE
WHAT DOES
THE CUSTOMER
BUY
visits on our websites

FLEXIBLE AND SCALABLE TECHNOLOGICAL ARCHITECTURE 18
Supported by a cybersecurity framework that strives to meet the highest global
standards
CIAM
FRAUD
ORDER
SELLER CENTER
ANALYTICS
LOYALTY
B2C
CUSTOMER
BUSINESS
CAPABILITIES
SOLUTIONS
IT CAPABILITIES
CONTINUOUS
INTEGRATION
TEST ENVIRONMENT
MANAGEMENT
API DEVOPS
CORE
INFRASTRUCTURE
CLOUD, BIGDATA
STORAGE, NETWORK
ENABLERS

19OUR VALUES ARE AT THE CORE OF OUR STRATEGY
Exceed
customers’
expectations
Make things
happen
Meritocracy Purposeful
actions

20FALABELLA’S UNIQUE POSITION TO CAPTURE MARKET OPPORTUNITY
GREAT OPPORTUNITY IN LATIN
AM ERICA
UNIQUE ASSETS AND
CAPABILIT IES
PROVEN TRACK RECORD OF
EXECUTION
ATTRACTIVE AND CONSISTENT
BUSINESS PLAN
SUPPORTED BY A DETERM INED
AND COMMITTED TEAM

Appendix

22LEADING RETAILER IN THE REGION AND 2ND LARGEST BY MARKET CAPITALIZATION
Source: Bloomberg and Capital IQ as of September 11, 2018
Note: All dollar figures are calculated based on the observed exchange rate as of July 3, 2018 (651.21 CLP/US$, 19.46 MEX/US$, 3.89 BRL/US$)
N ET IN C OM E M AR GIN LTM 2Q18 (%)EBITDA M ARGIN LTM 2Q18 (%)
48,44518,401
9,729
6,229 5,468 5,204 4,929
Comp.1 Comp.2 Comp.3 Comp.4 Comp.5 Comp.6 Comp.1 Comp.2 Comp.3 Comp.4 Comp.5 Comp.6
14,032
6,652
4,5253,538
2,013
7.9% 10.3%0.8% 7.7% 13.3% 6.2% 14.2%
15.2% 25.9%10.0% 8.1% 7.8% 8.3% 0.1%
Comp.6 Comp.2 Comp.5 Comp.1 Comp.4 Comp.3 Comp.6 Comp.2 Comp.5 Comp.1 Comp.4 Comp.3
20.2%
14.3% 14.0% 13.5%
9.8%8.6%
25.9%
10.9%
8.4%
6.2%6.0%
4.0% 4.0%
2.0%
CARG 13’ – ‘17
CARG 13’ – ‘17
30,45715,657
6.2%
M ARKET CAPITAL IZAT ION (US$M ) R EVENU ES LTM 2Q18 (U S$M )
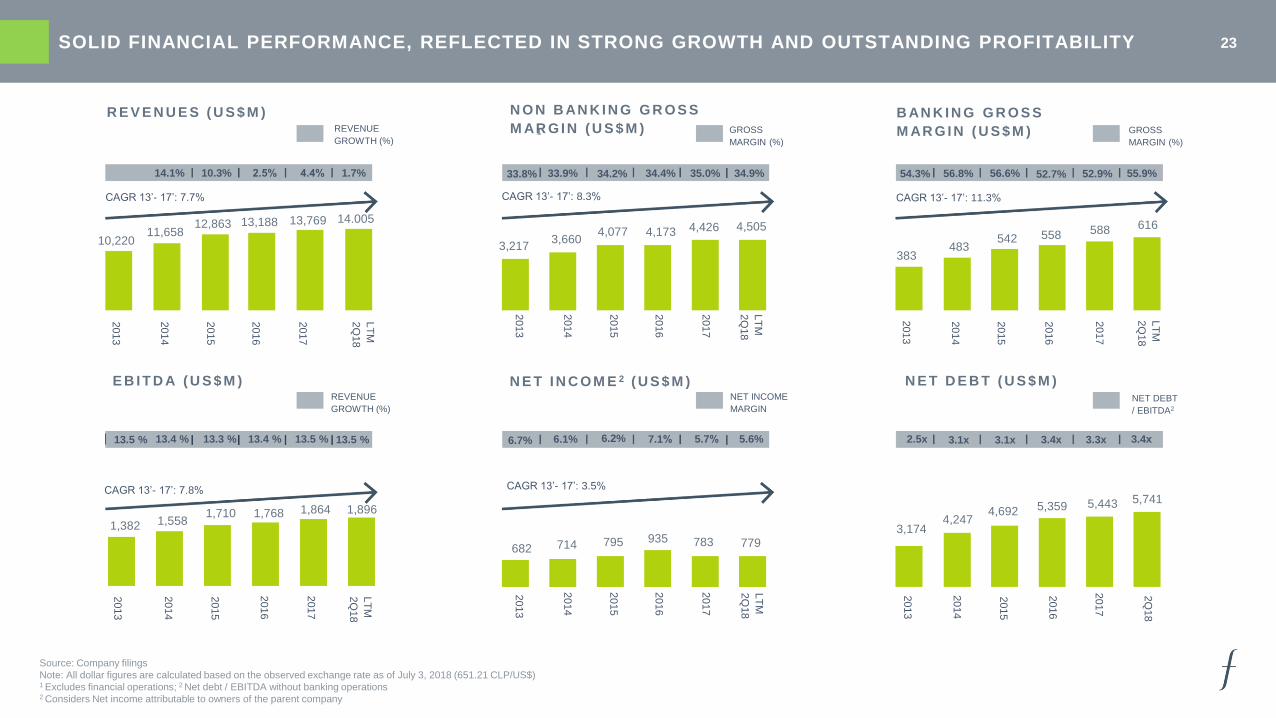
23SOLID FINANCIAL PERFORMANCE, REFLECTED IN STRONG GROWTH AND OUTSTANDING PROFITABILITY
R E V E N U E S ( U S $ M ) N O N B AN K I N G G R O S S
M AR G I N ( U S $ M ) 1
B AN K I N G G R O S S
M AR G I N ( U S $ M )
E B I T D A ( U S $ M ) N E T I N C O M E 2 ( U S $ M ) N E T D E B T ( U S $ M )
1.7%4.4%2.5%10.3%14.1%
REVENUE
GROWTH (%)
2014
2013
2015
2016
2017
LT
M
2Q
18
2014
2013
2015
2016
2017
LT
M
2Q
18
2014
2013
2015
2016
2017
LT
M
2Q
18
2014
2013
2015
2016
2017
LT
M
2Q
18
2014
2013
2015
2016
2017
LT
M
2Q
18
2014
2013
2015
2016
2017
2Q
18
REVENUE
GROWTH (%)
NET INCOME
MARGIN
GROSS
MARGIN (%)
GROSS
MARGIN (%)
5.6%5.7%7.1%6.1%13.4 % 13.3 % 13.4 % 13.5 %13.5 % 6.7% 6.2%
33.8% 33.9% 34.2% 34.4% 35.0% 34.9% 54.3% 52.9%56.8% 55.9%56.6% 52.7%
2.5x 3.1x 3.1x 3.4x 3.4x3.3x
CAGR 13’- 17’: 7.7%
CAGR 13’- 17’: 7.8%
CAGR 13’- 17’: 8.3%
CAGR 13’- 17’: 3.5%
CAGR 13’- 17’: 11.3%
10,22011,658
12,863 13,188 13,769 14.005
3,2173,660
4,077 4,173 4,426 4,505
383483
542 558 588 616
1,382 1,5581,710 1,768 1,864 1,896
682 714 795 935 783 7793,174
4,2474,692 5,359 5,443 5,741
Source: Company filings
Note: All dollar figures are calculated based on the observed exchange rate as of July 3, 2018 (651.21 CLP/US$)1 Excludes financial operations; 2 Net debt / EBITDA without banking operations2 Considers Net income attributable to owners of the parent company
13.5 %
NET DEBT
/ EBITDA2

24NON – IFRS FINANCIAL METRICS RECONCILIATION
Six months ended June 30, Year Ended December 31,
2018 2018 2017 2017 2017 2016 2015
(US$ in millions)(Ch$ in millions)
(US$ in millions) (Ch$ in millions)(unaudited)
Total net income (retail) 354 230,433 227,629 738 480,410 594,669 479,755
(-) Other gains (retail) (3) (1,794) 1,141 9 5,689 160,726 33,749
(-) Financial income (retail) 23 15,183 6,733 25 16,197 15,268 33,869
(-) Financial costs (retail) (145) (94,444) (94,546) (302) (196,455) (207,569) (174,033)
(-) Exchange differences (retail) (9) (5,827) (840) (1) (466) 3,637 (18,209)
(-) Income in indexation units (retail) (18) (11,645) (10,918) (27) (17,264) (26,088) (33,455)
(-) Depreciation and amortization (retail) (222) (144,546) (129,860) (410) (267,008) (245,379) (228,159)
(-) Equity interest in profits (losses) of associates and joint ventures accounted for using the equity method (retail)
6 4,036 7,104 23 15,279 21,248 25,272
(-) Income tax (retail) (98) (64,039) (69,582) (246) (159,921) (148,580) (134,096)
Retail EBITDA 819 533,509 518,397 1,665 1,084,359 1,021,405 974,815
The following table sets for the reconciliation of our total net income (retail) to our retail EBITDA for each of the periods presented:


