26
Corporate Presentation Falabella JAN 2014 Confidential

Corporate
Presentation
Falabella
JAN 2014
Confidential

FALABELLA
CONSOLIDATED STATEMENTS
BUSINESS UNITS
INVESTMENT PLAN

Note: Financial data and outlets information as of September 2013 (LTM). FX rates as of 09/30/2013 (504.2 CLP/US$). Includes Sodimac Colombia revenues, which do not consolidate.
DE
PAR
TM
EN
T S
TOR
ES
Revenues
US$ 4,417m
Stores
89
HO
ME
IMP
RO
VE
ME
NT
Revenues
US$ 5,538m
Stores
196
SU
PE
RM
AR
KE
TS
Revenues
US$ 1,923m
Stores
80
FIN
AN
CIA
L S
ER
VIC
ES
Gross Loans
US$ 5,851m
CMR Accounts
4.2+ million
RE
AL
ES
TAT
E
GLA
1,7m sqmMalls / Power & Shopping
Centers18 / 14
3
FALABELLA AT A GLANCE
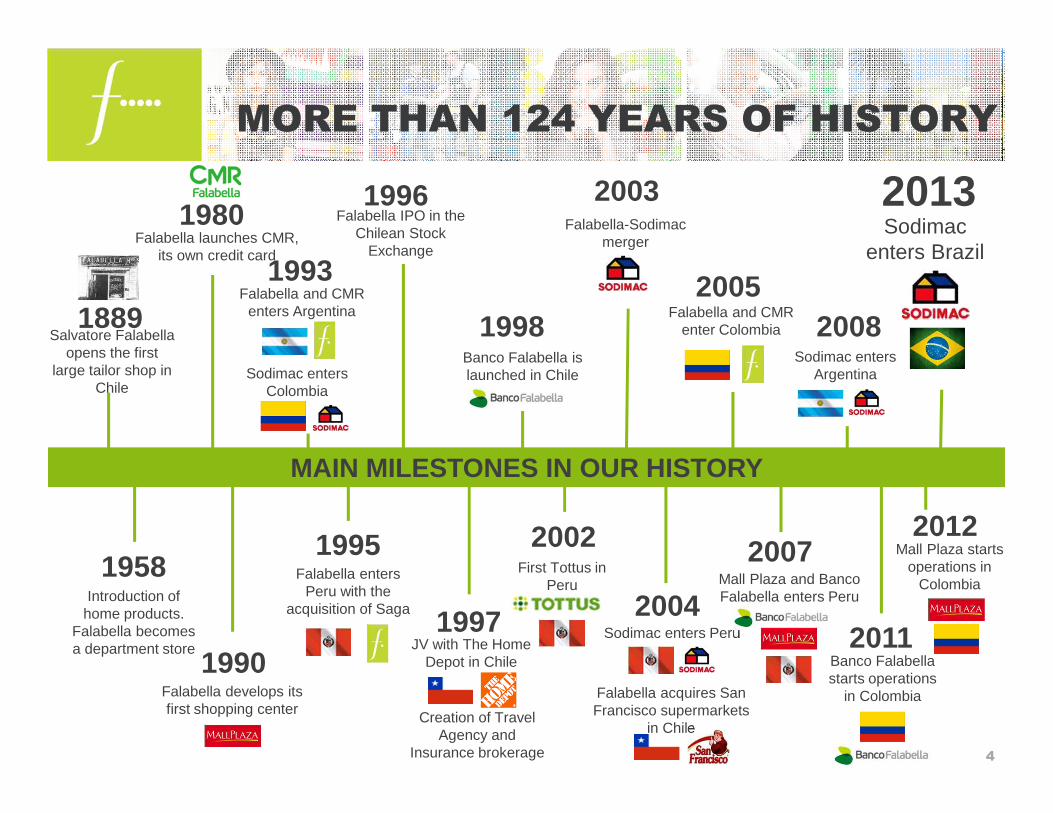
MORE THAN 124 YEARS OF HISTORY
Salvatore Falabella opens the first
large tailor shop in Chile
1889
Introduction of home products.
Falabella becomes a department store
1958
Falabella launches CMR, its own credit card
1980
Falabella develops its first shopping center
1990
Falabella and CMR enters Argentina
1993
Falabella enters Peru with the
acquisition of Saga
1995
Sodimac enters Colombia
Falabella IPO in the Chilean Stock
Exchange
1996
1997
Creation of Travel Agency and
Insurance brokerage
1998
JV with The Home Depot in Chile
Banco Falabella is launched in Chile
2002First Tottus in
Peru
Falabella-Sodimac merger
2004
Falabella acquires San Francisco supermarkets
in Chile
2005
Sodimac enters Peru
Falabella and CMR enter Colombia
2007Mall Plaza and Banco Falabella enters Peru
2008Sodimac enters
Argentina
2011Banco Falabella starts operations
in Colombia
2012Mall Plaza starts
operations in Colombia
20132003
MAIN MILESTONES IN OUR HISTORY
4
Sodimac enters Brazil

1 Through Falabella Perú S.A.A..
2 Not consolidated.
3 Consolidates from July 1st , 2013.
CORPORATE STRUCTURE
5
SACI FalabellaSACI Falabella
ChileChile Peru1Peru1 ArgentinaArgentina ColombiaColombia
Sodimac 100%
Imperial 60%
Tottus 88%
CMR 100%
Banco Falab. 100%
Rentas F. 100%
Mall Plaza 60%
Saga Falabella 95%
Sodimac 100%
Tottus 100%
Banco Falab. 100%
Open Plaza 100%
Avent. Plaza 40% 2
Falabella 100%
Sodimac 100%
CMR 100%
Falabella 65%
Banco Falab. 65%
Sodimac 49% 2
Mall Plaza
Falabella 100%
100%
94%
20%
BrazilBrazil
Construdecor 50.1% 3
6
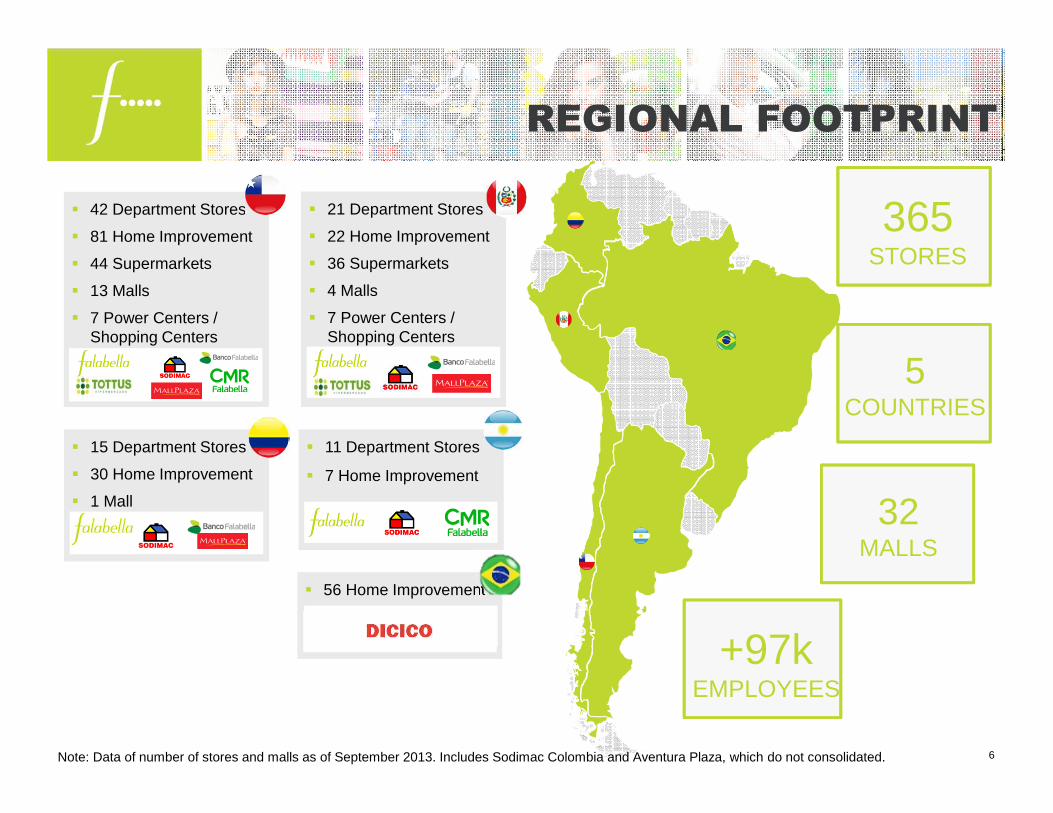
REGIONAL FOOTPRINT
365 STORES
32MALLS
+97kEMPLOYEES
5COUNTRIES
� 42 Department Stores
� 81 Home Improvement
� 44 Supermarkets
� 13 Malls
� 7 Power Centers / Shopping Centers
� 21 Department Stores
� 22 Home Improvement
� 36 Supermarkets
� 4 Malls
� 7 Power Centers / Shopping Centers
� 15 Department Stores
� 30 Home Improvement
� 1 Mall
� 11 Department Stores
� 7 Home Improvement
� 56 Home Improvement
Note: Data of number of stores and malls as of September 2013. Includes Sodimac Colombia and Aventura Plaza, which do not consolidated.

LATAM EXPOSURE
7
2006
9M 2013 (LTM)REVENUES
EBITDA9M 2013 (LTM)
2006
80%
17%
3%
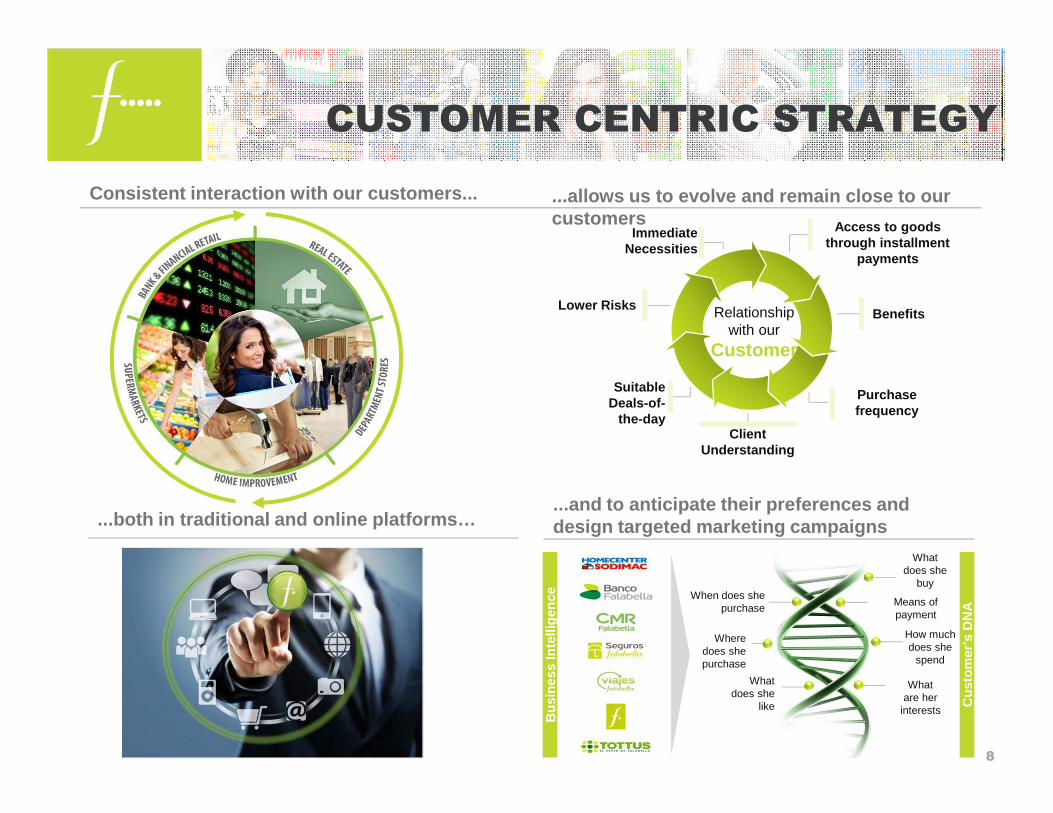
Consistent interaction with our customers...
...and to anticipate their preferences and design targeted marketing campaigns
Relationship with our
Customer
Immediate Necessities
Access to goods through installment
payments
Benefits
Purchase frequency
Client Understanding
Suitable Deals-of-
the-day
Lower Risks
Bus
ines
s In
telli
genc
e
Cus
tom
er’s
DN
A
When does she purchase
Where does she purchase
What does she
like
What are her
interests
How much does she
spend
Means of payment
What does she
buy
...allows us to evolve and remain close to our customers
8
CUSTOMER CENTRIC STRATEGY
...both in traditional and online platforms…

9
CORPORATE GOVERNANCE
�Most Convincing and Coherent Strategy in Latam
�Highest standard of corporate governance in Latam
MARKET RECOGNITION Highly experienced leadership team, with more than 13 years in average in the Group
Independent director at holding level and in relevant subsidiaries
Controlling group consisting of 7 families
10
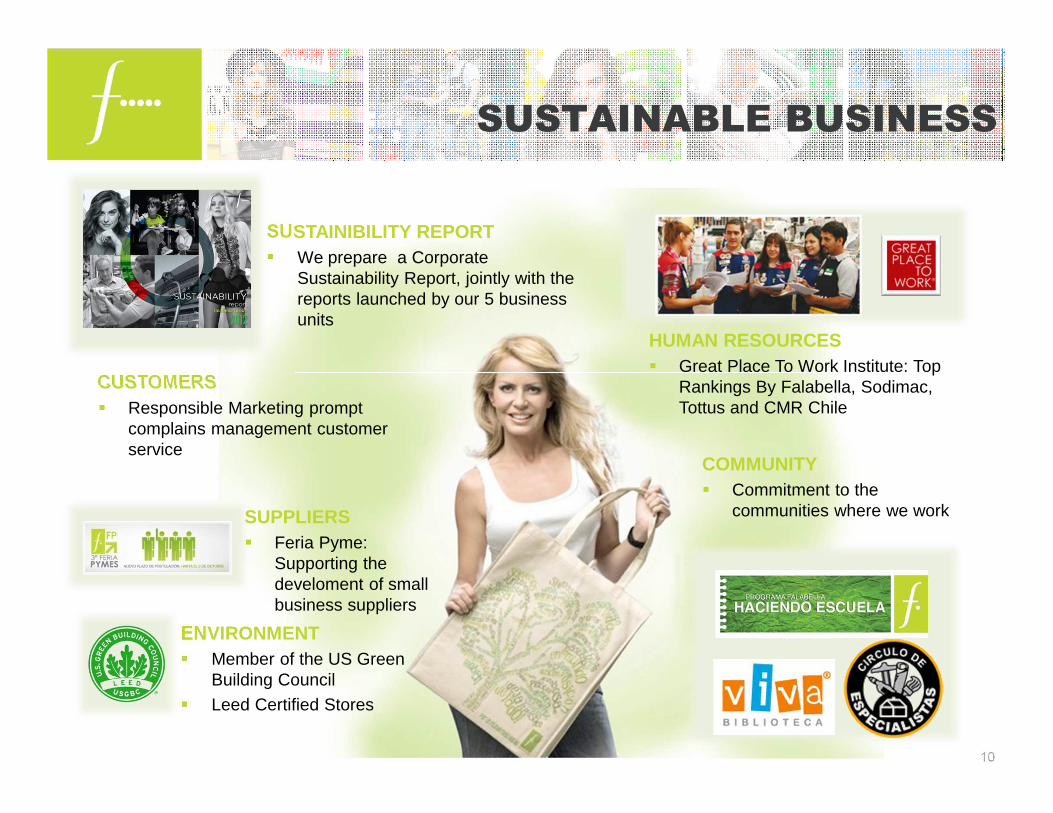
SUSTAINABLE BUSINESS
COMMUNITY� Commitment to the
communities where we work
CUSTOMERS� Responsible Marketing prompt
complains management customer service
HUMAN RESOURCES� Great Place To Work Institute: Top
Rankings By Falabella, Sodimac, Tottus and CMR Chile
SUSTAINIBILITY REPORT� We prepare a Corporate
Sustainability Report, jointly with the reports launched by our 5 business units
SUPPLIERS� Feria Pyme:
Supporting the develoment of small business suppliers
ENVIRONMENT� Member of the US Green
Building Council� Leed Certified Stores

FALABELLA
CONSOLIDATED STATEMENTS
BUSINESS UNITS
INVESTMENT PLAN

3Q & 9M 2013 INCOME STATEMENT
12Note: Financial Statements in CLP translated at FX as of 09/30/2013 (504.2 CLP/US$)
Mill. of USD 3Q '12 % Rev. 3Q '13 % Rev. Var. 13/12 9M '12 % Rev. 9M '13 % Rev. Var. 13/12
Revenues of Non-Banking Operations 2,603 2,936 12.8% 7,762 8,582 10.6%
Revenues of Banking Operations 202 236 16.6% 594 663 11.6%
TOTAL REVENUES 2,805 3,172 13.1% 8,356 9,245 10.6%
COGS of Non-Banking operations (1,767) -67.9% (1,972) -67.2% 11.6% (5,267) -67.9% (5,716) -66.6% 8.5%
COST of Banking Operations (104) -51.4% (104) -44.1% 0.2% (311) -52.3% (307) -46.3% -1.2%
GROSS PROFIT 934 33.3% 1,096 34.5% 17.3% 2,779 33.3% 3,221 34.8% 15.9%
SG&A Expenses (677) -24.1% (808) -25.5% 19.3% (1,993) -23.8% (2,293) -24.8% 15.1%
Operational Income 257 9.2% 287 9.1% 11.9% 786 9.4% 928 10.0% 18.1%
Depreciation+Amortization 71 2.5% 84 2.7% 19.7% 207 2.5% 243 2.6% 17.4%
EBITDA 327 11.7% 372 11.7% 13.6% 992 11.9% 1,171 12.7% 18.0%
Non- Operating Profit (27) -1.0% (59) -1.9% 119.6% (100) -1.2% (137) -1.5% 36.7%
Profit Before Tax Expenses 230 8.2% 228 7.2% -0.8% 685 8.2% 791 8.6% 15.4%
Income Tax (112) (53) -52.6% (196) (176) -10.2%
Minority Interest 1 (23) -2993.1% (42) (68) 60.2%
NET PROFIT / (LOSS) 118 4.2% 152 4.8% 28.2% 447 5.4% 547 5.9% 22.3%

BALANCE SHEET as of SEP. 2013
13
US$ million Sep-2013ASSETSNon-Banking OperationsCurrent AssetsCash & cash equivalents 290Current trade & other receivables 8Inventories 1,690Others 2,638
Total Current Assets 4,627
Non-Current AssetsNon-Current trade & other receivables 309Goodwill 614PP&E 3,274Others 4,407
Total Non-Current Assets 8,603Total Non-Banking Operations Assets 13,230
Loans and accounts receivable from clients 3,514
Others 1,414
Total Assets from Banking Operations 4,928
TOTAL ASSETS 18,157
US$ million Sep-2013EQUITY & TOTAL LIABILITIESNon-Banking OperationsCurrent LiabilitiesOther current financial liabilities 879Current trade & otherpayables 1,341Others 350
Total Current Liabilities 2,570
Non-Current LiabilitiesOther non-current financial laibilities 4Others 3,971
Total Non-Current Liabilities 3,975Total Non-Banking Oper. Liabilties 6,545
Total Liabilities from Banking Oper. 4,128
TOTAL LIABILITIES 10,673
Shareholders' Equity 7,485
TOTAL EQUITY & LIABILITIES 18,157
Note: Financial Statements in CLP translated at FX as of 09/30/2013 (504.2 CLP/US$)

FINANCIAL SITUATION
14
LEVERAGE (w/o Banking Operations) (times)
DEBT BY TYPE
(w/o Banking Oper.)
NET FINANCIAL DEBT/EBITDA (w/o Banking Oper.)
(times)
DEBT BY MATURITY
(w/o Banking Oper.)
Financial Debt (w/o Banks):
US$ 4,256 MM
Duration:5.53years

15
2013 OPENINGS
Chile Peru
Mall Plaza Iquique Open Plaza Pucallpa
Mall Plaza Egaña
Open Plaza Rancagua
Open Plaza Ovalle
� In 2013, the Falabella Group reached 382 stores in the region, adding 86 new stores to its operation during the year:
� 30 new stores in Chile, Peru and Colombia� 56 stores through the acquisition of Construdecor in Brazil
� Moreover, the Group added 5 shopping centers in 2013, reaching to a total of 36 malls in the region.
New Stores: New Malls:
Chile Peru Colombia Brazil
Ovalle Lima Norte Bucaramanga
Egaña Cañete
Ica
Pucallpa
Santa Cruz Ate Armenia
Ovalle SJ Lurigancho Rionegro
Cañete Chia
Huacho
Sullana
Pucallpa
Vitacura Cañete
Egaña Canta Callao
El Trébol Chiclayo
Ovalle Pacasmayo
Quilpué Arequipa Parra
Pucallpa
Sullana
Falabella
Sodimac
Tottus
+ 56
Dicico
stores

FALABELLA
CONSOLIDATED STATEMENTS
BUSINESS UNITS
INVESTMENT PLAN
Regional Footprint
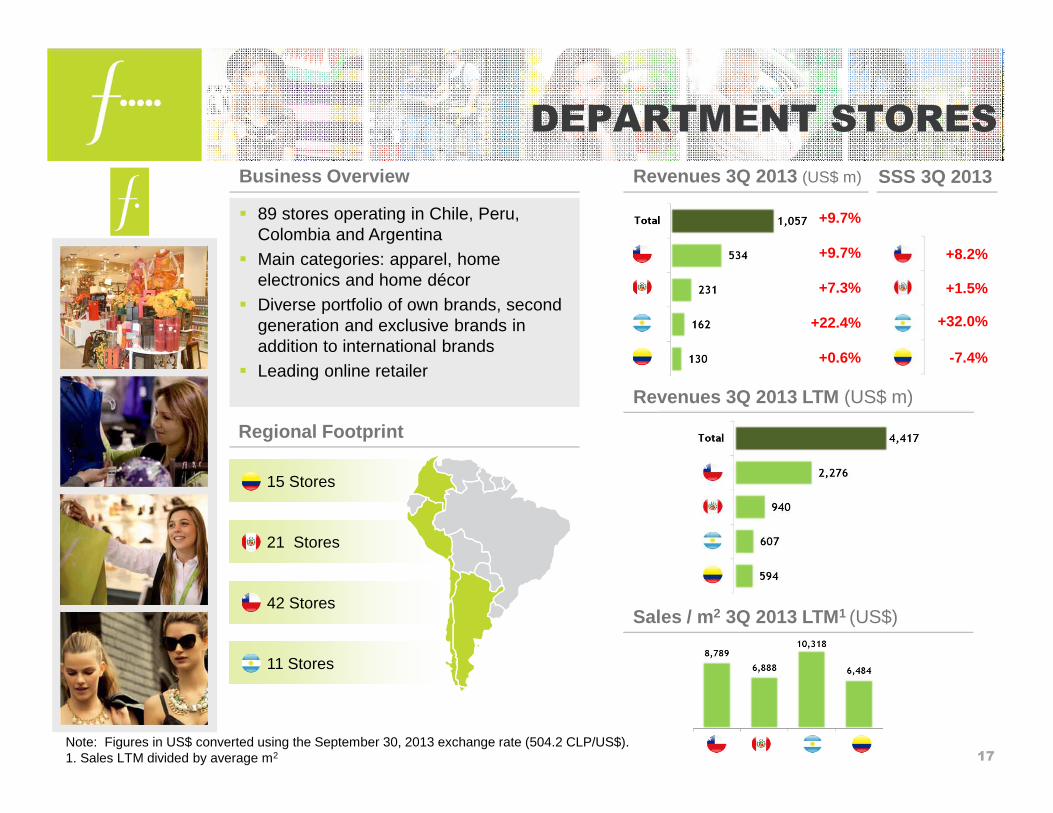
� 89 stores operating in Chile, Peru, Colombia and Argentina
� Main categories: apparel, home electronics and home décor
� Diverse portfolio of own brands, second generation and exclusive brands in addition to international brands
� Leading online retailer
Business Overview
21 Stores
42 Stores
15 Stores
11 Stores
Note: Figures in US$ converted using the September 30, 2013 exchange rate (504.2 CLP/US$).1. Sales LTM divided by average m2
DEPARTMENT STORES
17
Revenues 3Q 2013 (US$ m)
Revenues 3Q 2013 LTM (US$ m)
+9.7%
+9.7%
+7.3%
+22.4%
+0.6%
SSS 3Q 2013
+8.2%
+1.5%
+32.0%
-7.4%
Sales / m 2 3Q 2013 LTM1 (US$)
+6.4%
+8.7%
+21.8%
+2.2%
+8.5%
Note: Figures in US$ converted using the September 30, 2013 exchange rate (504.2 CLP/US$).1. Sales LTM divided by average m2. Does not include Brazil as information for 2012 is not available.
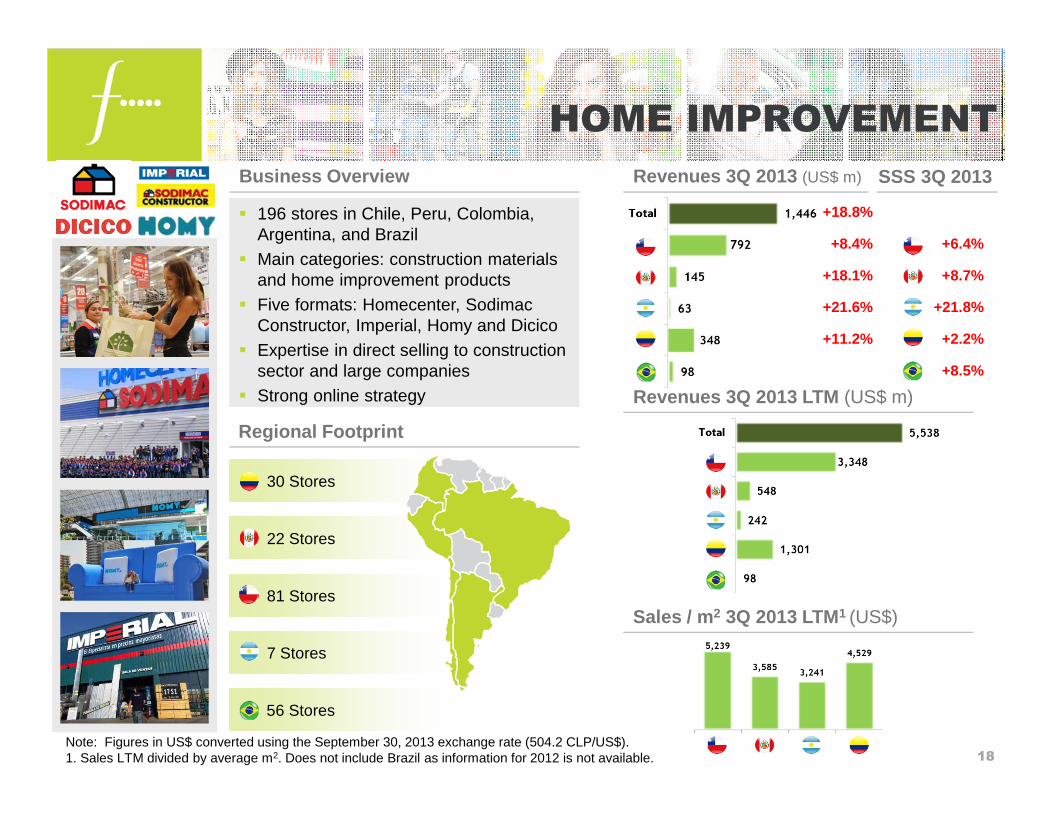
� 196 stores in Chile, Peru, Colombia, Argentina, and Brazil
� Main categories: construction materials and home improvement products
� Five formats: Homecenter, Sodimac Constructor, Imperial, Homy and Dicico
� Expertise in direct selling to construction sector and large companies
� Strong online strategy
22 Stores
81 Stores
30 Stores
7 Stores
HOME IMPROVEMENT
18
Business Overview
Regional Footprint
+18.8%
+8.4%
+18.1%
+21.6%
+11.2%
SSS 3Q 2013Revenues 3Q 2013 (US$ m)
Revenues 3Q 2013 LTM (US$ m)
Sales / m 2 3Q 2013 LTM1 (US$)
56 Stores

Note: Figures in US$ converted using the September 30, 2013 exchange rate (504.2 CLP/US$).1. Sales LTM divided by average m2
� Started operations in 2002 in Peru under Tottus brand and entered Chilean market in 2004 with the acquisition of San Francisco
� Operates 80 stores in Chile and Peru, with two main formats: hypermarkets and supermarkets
� Increased penetration of private labels� Developed online platform
19
36 Stores
44 Stores
Business Overview
Regional Footprint
+11.7%
+14.2%
+8.8%
SSS 3Q 2013
+6.7%
+2.7%
SUPERMARKET
Revenues 3Q 2013 (US$ m)
Revenues 3Q 2013 LTM (US$ m)
Sales / m 2 3Q 2013 LTM1 (US$)
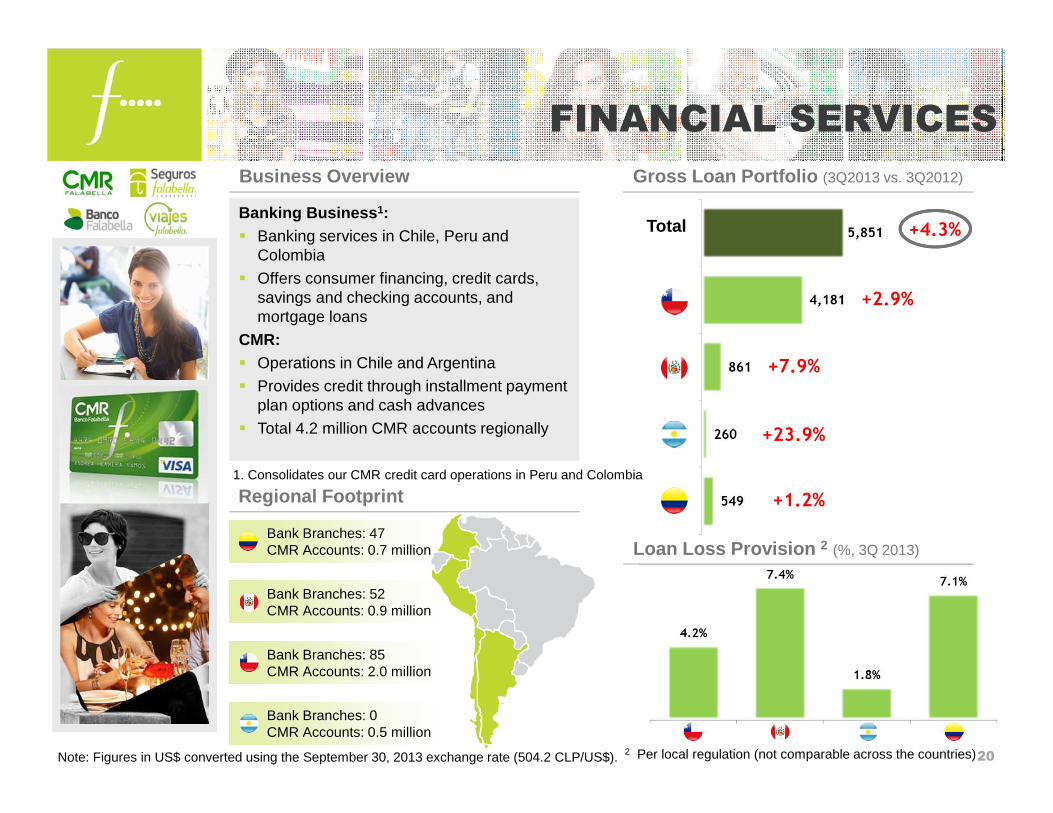
Bank Branches: 52 CMR Accounts: 0.9 million
Bank Branches: 85CMR Accounts: 2.0 million
Bank Branches: 47 CMR Accounts: 0.7 million
Bank Branches: 0CMR Accounts: 0.5 million
Note: Figures in US$ converted using the September 30, 2013 exchange rate (504.2 CLP/US$).
Banking Business 1:� Banking services in Chile, Peru and
Colombia
� Offers consumer financing, credit cards, savings and checking accounts, and mortgage loans
CMR: � Operations in Chile and Argentina
� Provides credit through installment payment plan options and cash advances
� Total 4.2 million CMR accounts regionally
2 Per local regulation (not comparable across the countries)
1. Consolidates our CMR credit card operations in Peru and Colombia
FINANCIAL SERVICES
20
Gross Loan Portfolio (3Q2013 vs. 3Q2012)
Total +4.3%
+2.9%
+7.9%
+23.9%
+1.2%
Business Overview
Regional Footprint
Loan Loss Provision 2 (%, 3Q 2013)

REAL ESTATE
21
� Largest operator in Chile and Peru, and one of the leaders in Latin America:� Mall Plaza : Operates large shopping malls in Chile , Peru (through Aventura Plaza)
and Colombia.� Rentas Falabella and Open Plaza : Operates small shopping centers with 2 or 3 of our
retail formats as anchor stores, as well as other third-party minor stores.
� Stores revenues of Mall Plaza shopping malls grew by 13.1% in the quarter.
� Opening of Mall Plaza Egaña by the end of 2013, being the first sustainable mall in Chile.
Main Highlights
1 Owned by the company.
Business Overview
Free Standing Stores (Falabella, Sodimac, Tottus) 1
666 684

FALABELLA
CONSOLIDATED STATEMENTS
BUSINESS UNITS
INVESTMENT PLAN

INVESTMENT PLAN 2014-2017
23
157STORES
15MALLS
US$4.1bnInvestment (US$ mm)
# Stores & Malls
63%14%
23%
24
CONTACT INFORMATION
Jordi Gaju N.
Chief Development Officer
Phone: +56 2 2380 2012
Alejandro González D.
Chief Financial Officer
Phone: +56 2 2380 2205
Lucrecia Fittipaldi
Corporate Development Manager / Head of IR
Phone: +56 2 2380 2012
Catalina Escaffi
IR / Development Associate
Phone: +56 2 2380 2012

25
This presentation contains forward-looking statements, includingstatements regarding the intent, belief or current expectations of theCompany and its management. Investors are cautioned that any suchforward-looking statements are not guarantee of future performance andinvolve a number of risks and uncertainties including, but not limited to, therisks detailed in the company’s financial statements, and the fact that actualresults could differ materially from those indicated by such forward-lookingstatements.
IMPORTANT DISCLAIMER

JAN 2014
Confidential
Corporate
Presentation
Falabella


