18
PREV ’AIR : An operational system for air quality monitoring and forecasting www.prevair.org Laurence ROUÏL
| Date post: | 21-Dec-2015 |
| Category: |
Documents |
| View: | 224 times |
| Download: | 1 times |

PREV ’AIR :An operational system for air quality monitoring and forecastingwww.prevair.org
Laurence ROUÏL

Built for operational purposes:
In France public information related to pollution episodes (threshold exceedances) can be driven by observations but also by forecasts since 2004
The system : a cooperative system for air quality monitoring, forecasting and mapping over Western Europe and France ;
set up in 2003 by:
Model development : MOCAGE
Meteorological forecastsNational Meteorological servicesMétéo France
Model development : CHIMERENational Research CentreCNRS
Builds up and hosts the NRT database
AQ expertise for the MinistryNational Agency of EnvironmentADEME
Builds up and hosts the prev ’air system
Model development : CHIMERE
AQ expertise for the Ministry
Public organization under the
supervision of the Ministry of EcologyINERIS
PREV’AIR : www.prevair.org
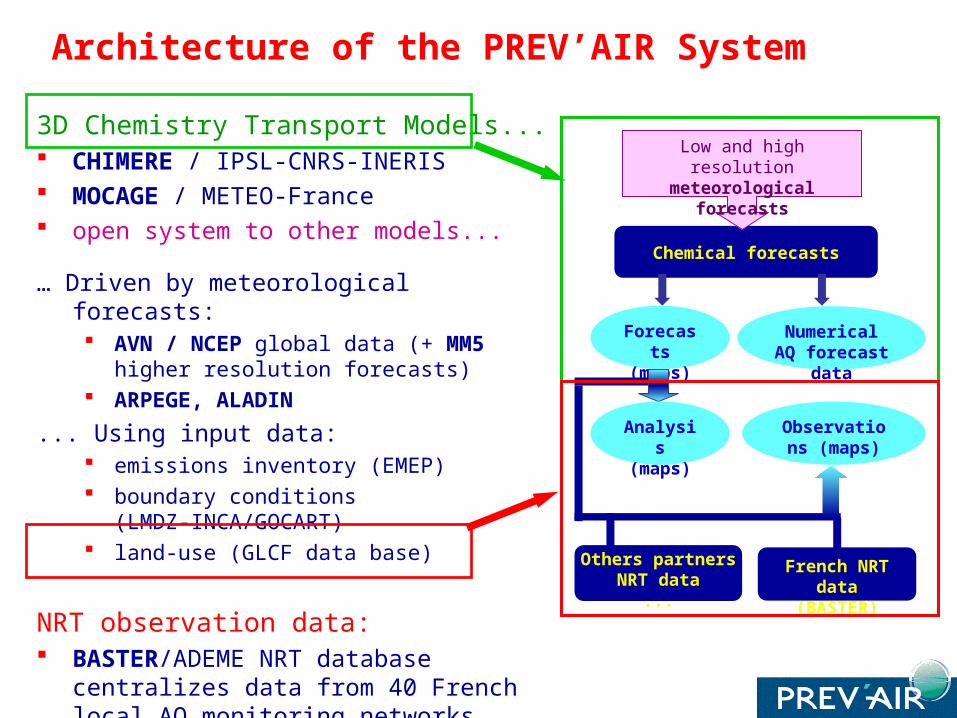
Architecture of the PREV’AIR System
3D Chemistry Transport Models... CHIMERE / IPSL-CNRS-INERIS MOCAGE / METEO-France open system to other models...
… Driven by meteorological forecasts: AVN / NCEP global data (+ MM5 higher
resolution forecasts) ARPEGE, ALADIN
... Using input data: emissions inventory (EMEP) boundary conditions (LMDZ-INCA/GOCART) land-use (GLCF data base)
NRT observation data: BASTER/ADEME NRT database centralizes
data from 40 French local AQ monitoring networks
bilateral cooperation with other partners
Chemical forecasts
Low and high resolution meteorological forecasts
Numerical AQ forecast data
Forecasts (maps)
French NRT data (BASTER)
Analysis (maps)
Observations (maps)
Others partners NRT data
...

available at D+0, 00 h LT on the web site
daily peak and averaged concentration maps
for D+0, D+1, D+2
pollutants: O3, NO2 (France and Europe) and PM (Europe)
O3, peak forecast (µg/m3)
20040729 D+0
O3, peak forecast (µg/m3)
20040729 D+2
O3, peak forecast (µg/m3)
20040729 D+1
PREV’AIR outputs: daily forecasts

PREV’AIR numerical data
extraction over user-defined domains
available through the Internet for AQ related
institutions (user accounts)
http://www.prevair.org/en/donneesnumeriques.php
Applications
AQ information on public French channels (TV)
direct use for a local information (GIS)
input data for local modelling purposes :
ESMERALDA (Paris + 6 regions)
AERES (Marseille region), etc …
PREV’AIR outputs: numerical forecast data
http://www.esmeralda-web.fr
http://www.airmaraix.com/html/emimod_acri_frm.htm

PREV’AIR NRT observation data
National web site PREV ’AIR
39 French AQ related organisms (AASQA)
"real time" national database BASTER
AASQA web sites
Local servers
680 monitoring stations
hour
LOCAL NATIONAL
O3
NO2
SO2
PM10
PM2.5

Daily mean concentrations of PM10 at surface measured on the 12 of September 2004
Maps of daily max and mean measured concentrations :
for O3, NO2, PM2.5 and PM10
using observations made
between 0h and T time
hour by hour updating if data
available (pollution events)
for D day and the 6 previous days
PREV’AIR outputs: maps of French NRT data

Modelled concentrations corrected with observations:
Observations collected in real-time for 150 stations (ozone)
Statistical adaptation using a kriging method
Available at J+0 with updates if near real time observations available
Operational for ozone since 2004 and for PM10 in 2006
For the day before and the current day
July 31, 2004
PREV’AIR outputs: analyzed maps immediately available for information (web sites, media…)
=
O3 simulation corrected by observations (µg/m3)
O3 simulation (µg/m3)
+
observations

PREV’AIR outputs: scores (forecast quality)
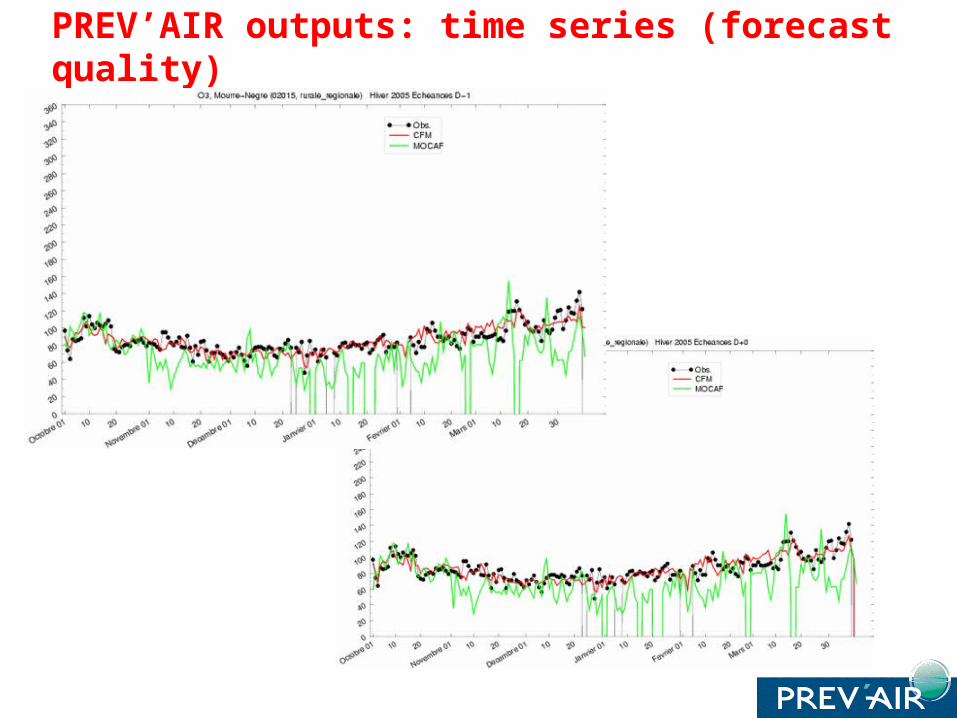
PREV’AIR outputs: time series (forecast quality)

PREV’AIR outputs: time series (forecast quality)
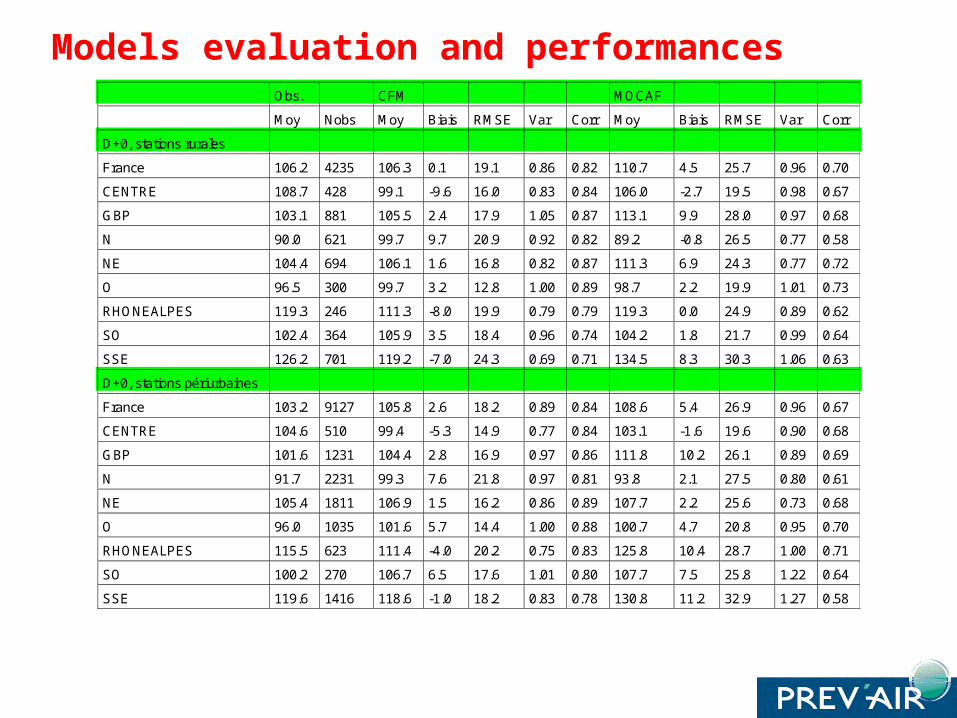
Obs. CFM MOCAF
Moy Nobs Moy Biais RMSE Var Corr Moy Biais RMSE Var Corr
D+0, stations rurales
France 106.2 4235 106.3 0.1 19.1 0.86 0.82 110.7 4.5 25.7 0.96 0.70
CENTRE 108.7 428 99.1 -9.6 16.0 0.83 0.84 106.0 -2.7 19.5 0.98 0.67
GBP 103.1 881 105.5 2.4 17.9 1.05 0.87 113.1 9.9 28.0 0.97 0.68
N 90.0 621 99.7 9.7 20.9 0.92 0.82 89.2 -0.8 26.5 0.77 0.58
NE 104.4 694 106.1 1.6 16.8 0.82 0.87 111.3 6.9 24.3 0.77 0.72
O 96.5 300 99.7 3.2 12.8 1.00 0.89 98.7 2.2 19.9 1.01 0.73
RHONEALPES 119.3 246 111.3 -8.0 19.9 0.79 0.79 119.3 0.0 24.9 0.89 0.62
SO 102.4 364 105.9 3.5 18.4 0.96 0.74 104.2 1.8 21.7 0.99 0.64
SSE 126.2 701 119.2 -7.0 24.3 0.69 0.71 134.5 8.3 30.3 1.06 0.63
D+0, stations périurbaines
France 103.2 9127 105.8 2.6 18.2 0.89 0.84 108.6 5.4 26.9 0.96 0.67
CENTRE 104.6 510 99.4 -5.3 14.9 0.77 0.84 103.1 -1.6 19.6 0.90 0.68
GBP 101.6 1231 104.4 2.8 16.9 0.97 0.86 111.8 10.2 26.1 0.89 0.69
N 91.7 2231 99.3 7.6 21.8 0.97 0.81 93.8 2.1 27.5 0.80 0.61
NE 105.4 1811 106.9 1.5 16.2 0.86 0.89 107.7 2.2 25.6 0.73 0.68
O 96.0 1035 101.6 5.7 14.4 1.00 0.88 100.7 4.7 20.8 0.95 0.70
RHONEALPES 115.5 623 111.4 -4.0 20.2 0.75 0.83 125.8 10.4 28.7 1.00 0.71
SO 100.2 270 106.7 6.5 17.6 1.01 0.80 107.7 7.5 25.8 1.22 0.64
SSE 119.6 1416 118.6 -1.0 18.2 0.83 0.78 130.8 11.2 32.9 1.27 0.58
Models evaluation and performances

PREV’AIR outputs: archives and budgetslong term analysis
Ozone, averaged peak (µg/m3) during summer 2003

Involvement in the GMES program (Global Monitoring for Environment and Security) :
PROMOTE (ESA) = PROtocole MOniToring for the GMES service Element on
atmospheric composition
phase 1: demonstrator
phase 2: definition of air quality services related to forecasting and mapping;
definition of a cooperative framework (with other European AQ teams)
GEMS (EU) = Global and regional Earth-system (atmosphere) Monitoring using
satellite and in-situ data
contribution to the Air Quality part for the development of data assimilation methods and
ensemble forecasts
Towards an European framework...

=> Looking for bilateral cooperation with other European partners :
for NRT data exchange : necessary to build analyzed maps and to evaluate
the simulated results (Italy, Germany, Belgium)
(contact: [email protected])
for forecasts or analyzed maps: users accounts could be available to
download over specific areas
(contacts: [email protected] ; [email protected])
Towards a European framework...
www.prevair.org

END…. THANK YOU FOR YOUR ATTENTION!END…. THANK YOU FOR YOUR ATTENTION!
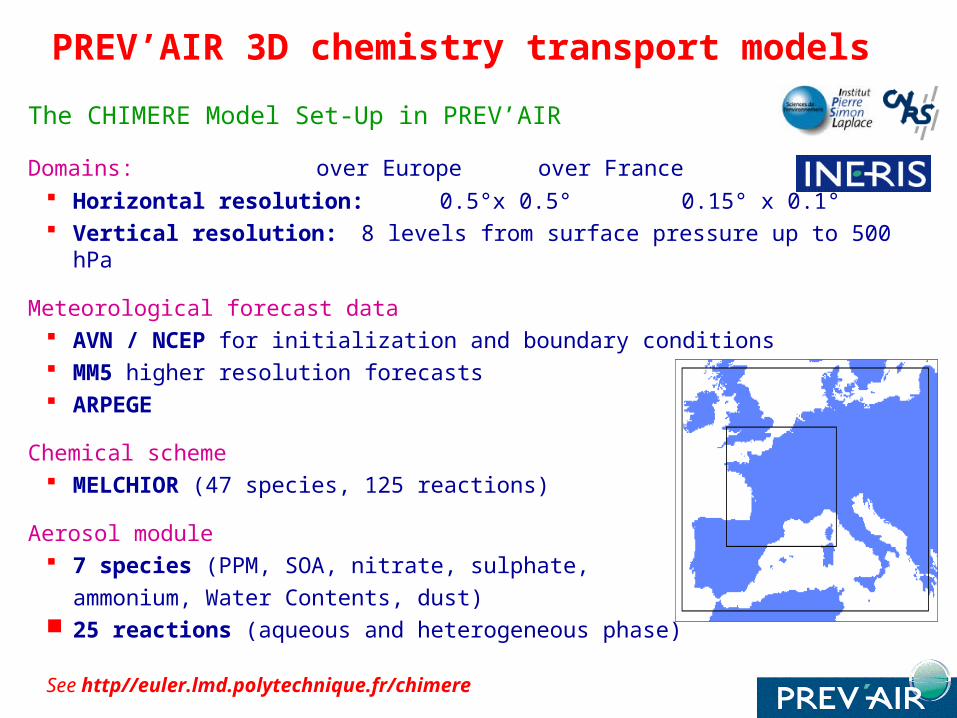
The CHIMERE Model Set-Up in PREV’AIR
Domains: over Europe over France Horizontal resolution: 0.5°x 0.5° 0.15° x 0.1° Vertical resolution: 8 levels from surface pressure up to 500 hPa
Meteorological forecast data AVN / NCEP for initialization and boundary conditions MM5 higher resolution forecasts ARPEGE
Chemical scheme MELCHIOR (47 species, 125 reactions)
Aerosol module 7 species (PPM, SOA, nitrate, sulphate, ammonium, Water Contents, dust) 25 reactions (aqueous and heterogeneous phase)
See http//euler.lmd.polytechnique.fr/chimere
PREV’AIR 3D chemistry transport models

The CHIMERE Model Set-Up in PREV’AIR
Domains Global Model / Over Europe / Over France Horizontal resolution: 4°x 4° 0.5° x 0.5° 0.1° x 0.1° Vertical resolution: 47 levels from surface pressure up to 5hPa
Meteorological forecast data ARPEGE and ALADIN
Chemical scheme RACMOBUS (118 species, 381 reactions)
No aerosol module
PREV’AIR 3D chemistry transport models


