Probabilistic Study of the Resistance of a Simply-Supported Reinforced Concrete Slab According to Eurocode Parametric Fire Mohammad Heidari, Fire Testing Centre, CERIB, 28230 Epernon Cedex, France; Department of Mechanical Engineering, Imperial College London, London SW 2AZ, UK Fabienne Robert, Fire Testing Centre, CERIB, 28230 Epernon Cedex, France David Lange, RISE Research Institutes of Sweden, Bora ˚s, Sweden Guillermo Rein*, Department of Mechanical Engineering, Imperial College London, London SW 2AZ, UK Received: 31 October 2016/Accepted: 12 January 2018 Abstract. We present the application of a simple probabilistic methodology to deter- mine the reliability of a structural element exposed to fire when designed following Eurocode 1-1-2 (EC1). Eurocodes are being used extensively within the European Union in the design of many buildings and structures. Here, the methodology is applied to a simply-supported, reinforced concrete slab 180 mm thick, with a stan- dard load bearing fire resistance of 90 min. The slab is subjected to a fire in an office compartment of 420 m 2 floor area and 4 m height. Temperature time curves are pro- duced using the EC1 parametric fire curve, which assumes uniform temperature and a uniform burning condition for the fire. Heat transfer calculations identify the plausi- ble worst case scenarios in terms of maximum rebar temperature. We found that a ventilation-controlled fire with opening factor 0.02 m 1/2 results in a maximum rebar temperature of 448°C after 102 min of fire exposure. Sensitivity analyses to the main parameters in the EC1 fire curves and in the EC1 heat transfer calculations are per- formed using a one-at-a-time (OAT) method. The failure probability is then calcu- lated for a series of input parameters using the Monte Carlo method. The results show that this slab has a 0.3% probability of failure when the compartment is designed with all layers of safety in place (detection and sprinkler systems, safe access route, and fire fighting devices are available). Unavailability of sprinkler systems results in a 1% probability of failure. When both sprinkler system and detection are not available in the building, the probability of failure is 8%. This novel study con- ducts for the first time a probabilistic calculation using the EC1 parametric curve, helping engineers to identify the most critical design fires and the probabilistic resis- tance assumed in EC1. Keywords: Structural fire resistance, Concrete, Parametric temperature–time curve, OAT method, Monte Carlo, Sensitivity analysis, Probabilistic analysis, Structural reliability * Correspondence should be addressed to: Guillermo Rein, E-mail: [email protected]Fire Technology Ó 2018 The Author(s). This article is an open access publication Manufactured in The United States https://doi.org/10.1007/s10694-018-0704-4 1
Transcript
Probabilistic Study of the Resistanceof a Simply-Supported Reinforced ConcreteSlab According to Eurocode Parametric Fire
Mohammad Heidari, Fire Testing Centre, CERIB, 28230 Epernon Cedex,France; Department of Mechanical Engineering, Imperial College London,London SW 2AZ, UK
Fabienne Robert, Fire Testing Centre, CERIB, 28230 Epernon Cedex, France
David Lange, RISE Research Institutes of Sweden, Boras, Sweden
Guillermo Rein*, Department of Mechanical Engineering, Imperial CollegeLondon, London SW 2AZ, UK
Received: 31 October 2016/Accepted: 12 January 2018
Abstract. We present the application of a simple probabilistic methodology to deter-mine the reliability of a structural element exposed to fire when designed followingEurocode 1-1-2 (EC1). Eurocodes are being used extensively within the European
Union in the design of many buildings and structures. Here, the methodology isapplied to a simply-supported, reinforced concrete slab 180 mm thick, with a stan-dard load bearing fire resistance of 90 min. The slab is subjected to a fire in an officecompartment of 420 m2 floor area and 4 m height. Temperature time curves are pro-
duced using the EC1 parametric fire curve, which assumes uniform temperature and auniform burning condition for the fire. Heat transfer calculations identify the plausi-ble worst case scenarios in terms of maximum rebar temperature. We found that a
ventilation-controlled fire with opening factor 0.02 m1/2 results in a maximum rebartemperature of 448�C after 102 min of fire exposure. Sensitivity analyses to the mainparameters in the EC1 fire curves and in the EC1 heat transfer calculations are per-
formed using a one-at-a-time (OAT) method. The failure probability is then calcu-lated for a series of input parameters using the Monte Carlo method. The resultsshow that this slab has a 0.3% probability of failure when the compartment isdesigned with all layers of safety in place (detection and sprinkler systems, safe access
route, and fire fighting devices are available). Unavailability of sprinkler systemsresults in a 1% probability of failure. When both sprinkler system and detection arenot available in the building, the probability of failure is 8%. This novel study con-
ducts for the first time a probabilistic calculation using the EC1 parametric curve,helping engineers to identify the most critical design fires and the probabilistic resis-tance assumed in EC1.
Keywords: Structural fire resistance, Concrete, Parametric temperature–time curve, OAT method,
Monte Carlo, Sensitivity analysis, Probabilistic analysis, Structural reliability
* Correspondence should be addressed to: Guillermo Rein, E-mail: [email protected]
Fire Technology
� 2018 The Author(s). This article is an open access publication
Performance based design for fire has been incorporated into legal frameworksaround the world [1] and allows designers to employ a rational engineeringapproach to the provision of fire safety in the built environment [2].
The fundamental principles of performance based fire engineering for structuresare outlined in multiple guidance codes [3, 4]. Performance based design codes laydown what safety standards need to be met by a designer, leaving scope for newmaterials, systems, and methods to be used in a building’s design, whereas pre-scriptive design codes simply describe how a building should be built. Perfor-mance-based design codes mainly discuss qualitatively, rather than quantitatively,the factors and input parameters that should be considered in the design process.Designers should define the input variables required for design using any numberof sources. This can lead to a significant variability in the design fires used, andthus inconsistent levels of safety for buildings [5].
Epistemic and Aleatory uncertainties exist in any engineering problem. The for-mer is connected to a lack of complete scientific knowledge, and limited datasources for the modelled scenario, while the latter is linked to the stochastic vari-ability in population [6]. These uncertainties lead to the need for assumptions andsimplifications to be made in analytical and numerical models, and withinmethodologies used by engineers for structural fire safety design [6, 7]. A sensitiv-ity analysis can be used to characterise the significance of uncertainties in order todetermine the impact of these on the results of any analysis.
Moving from a prescriptive approach to performance based design enablesdesigners to apply knowledge of real structural behaviour during fire, whileaccounting for uncertainties allows designers to quantify the reliability of the pro-posed solution, as well as the overall level of risk associated with the design, andto more confidently inform any further decision-making based on the results [8–10].
Reliability-based structural fire engineering has progressed in recent years.Examples in the literature include the application of the Monte Carlo method andvarious variable reduction techniques to determine the probability of failure and/or the reliability of both protected and unprotected elements [11], to evaluate thebehaviour of steel beams under fire, taking account of uncertainties in the fireload [12], to evaluate designs carried out according to EN 1992-1-2, and to studythe influence of the input variables for a slab the ISO 834 standard fire [13]. Anew set of fire resistance periods in the development of codes of practice DD9999were developed in [14], and a risk based methodology was defined, while the fun-damental design challenges in the context of time equivalence were addressed in[15]. Other examples could be mentioned, including identifying the most criticalfire scenarios for the structural response of car parks to fires [16], and the failureprobability of redundant cables in a cable tunnel fire [17]. An approach such asthis, based on the Monte Carlo method, can compensate for the lack of certaintyin modelling inputs in the case of real fires, as there is the opportunity to varyinput parameters within a defined range.
Fire Technology 2018
This paper presents a method to identify the most important parameters thatneed to be considered in a fire safety engineering design. It presents a structuredapproach that could help to justify some of the assumptions and simplificationswhich are made in fire safety engineering by identifying parameters for whichmore information is needed for different applications, thus allowing engineers toexclude variations in some of the other parameters in Monte Carlo analysis; inturn reducing the number of runs needed in Monte Carlo analysis to obtain aconverged answer.
2. Methodology
Several fire scenarios for a uniformly burning and fully developed fire were pro-duced based on a range of values for input parameters such as fuel load, ventila-tion size, contribution of fire protection systems, boundary material properties etc.to select a ‘‘reference case’’ fire scenario. A set of temperature time curves wereproduced in accordance with the EC1 parametric fire method [18], which assumesa uniformly burning fire and is valid for compartments with floor areas up to500 m2 and 4 m height [18]. Heat transfer analyses were then carried out so as toidentify the ‘‘reference case’’ scenario with the aim of sensitivity analyses. Theanalytical equation given in EC1 [18] to calculate the fire temperature is:
where b is the thermal inertia of the enclosure boundary, O is the opening factorof the fire compartment (m1/2), Av is the total vertical opening on all walls (m2),Heq is weighted average of window heights on the wall (m), and At is the totalarea of enclosure (walls, ceiling and floor, including openings) (m2).The maximumtemperature Tmax occurs at tmax
* as:
t�max ¼ tmax � C hð Þ ð5Þ
tmax ¼ max ½ð0:2 � 10�3 � qt;d=OÞ; tlim� hð Þ ð6Þ
Probabilistic Study of the Resistance
qt;d ¼ qf ;d � Af =At ð7Þ
where qt,d is the design value of the fire load density related to the total surfacearea At of the enclosure (walls, ceiling and floor, including openings) (MJ/m2),and qf,d is the design value of the fire load density related to the surface area Af
of the floor (MJ/m2).The limiting temperature tlim of 25 min is taken, assuming a medium fire
growth rate [18]. After tmax* the cooling phase begins and the temperature–time
curve during this phase is given by:
Tg ¼ Tmax� 625 t� � t�max � x� �
for t�max � 0:5 ð8Þ
Tg ¼ Tmax� 250 3 � t�max
� �� t � � t�max x� �
for 0:5 � t�max � 2 ð9Þ
Tg ¼ Tmax� 250 t� � t�max � x� �
for 2 � t�max ð10Þ
Once this fundamental part has been addressed, a detailed sensitivity analysis ofthe main parameters in the EC1 parametric curves and heat transfer model wereperformed for a wide range of values. The heat transfer was solved by means of aone-dimensional finite difference method for conductive heat transfer inside thematerial, and boundary conditions for both convective and radiant heating weretaken into account [19, 20]. As such, a range of input variables in EC1 parametricfire and heat transfer model were investigated (Tables 1 and 2). A sensitivity anal-ysis of the ‘‘reference case’’ scenario examined a large number of fire scenariosusing a one-at-a-time method (OAT).
OAT is a sensitivity analysis method, which simply varies one input at a time,keeping others at their baseline, and calculates the variation in the output. Allinput parameters are examined and results are compared to determine which ofthe input parameters have the highest impact on the final results. The OAT sensi-tivity analysis has been used in different examples, such as identifying the govern-ing parameters of a solid ignition model and global level of confidence associatedwith the model predictions [21], and determining the most sensitive parameters intravelling fire methodology for structural design [19]. The OAT sensitivity analysiswas useful in this study to determine which input data were important for furtherthe Monte Carlo analysis and required more information, and which were unim-portant, thus reducing the number of variables required to be considered as uncer-tain. In addition, it highlighted the range of possible fire scenarios for which thedesigned element is structurally safe.
A Monte Carlo analysis was then carried out to evaluate the reliability of theconcrete slab, in terms of the failure probability Pf, given uncertainty in keymodel parameters. Monte Carlo analysis is a method that performs numericalexperiments using a large number of randomly generated sample sets from theinput space, containing all possible values of the input variables according to their
Fire Technology 2018
probability distributions. It is suitable when it is impossible to compute an exactresult with a deterministic approach and also to understand the impact of uncer-tainty in forecast modelling [22].
3. Case Study
The methodology presented here was applied to a simply-supported reinforcedconcrete slab 180 mm thick with 44 mm axis-distance of the tension reinforce-ments to the soffit of the slab (fire exposed surface) and a concrete cover of36 mm. The compartment was an open-plan office building, 30.25 m long by14.25 m wide and 4 m high (Fig. 1). The simplified calculation method in Euro-code 2-1-2 [23] was used to measure the performance of the slab, as the simply-supported slab was subjected to a uniformly distributed load, and the design atambient temperature was based on linear analysis. There are different methods toevaluate the failure modes of concrete structures for different levels of assessmentin fires: maximum deflection (which is typically taken as a ratio of deflection), themaximum temperature of the tension reinforcement, the ultimate strain in the ten-sion reinforcement, and the shear capacity [23]. The slab is exposed to fire frombelow, so the strength of the structural element may be assumed to be a functionof the temperature of the rebar in the tension zone [2]. The critical temperature ofthe tension reinforcement in the slab was therefore selected as the limiting criteria.
The critical temperature of the reinforcement steel was calculated assuming areduction factor of 0.6 for the load combination (e.g. permanent and variableloads) in the fire situation [23]. The effects of actions on structural element (e.g.internal force, moment) for the fire situation, may be deduced from those deter-
Figure 1. Plan and elevation of the structure and slab cross section,dimensions in meter.
Probabilistic Study of the Resistance
mined in normal temperature design using the reduction factor for the load com-bination in the fire situation [23]. A partial safety factor of 1.15 for reinforcementsteel was selected in accordance with Eurocode 2-1-1 [24]. As such, failure in theselected structural member for the fire situation, occurred when reduction factorfor the strength of reinforcement steel was 0.52. In accordance with clause 4.2[23], for rebar (hot rolled) in concrete and for strain greater than 2% (which is thecase for slabs and beams without a high reinforcement ratio), the critical tempera-ture is 583�C. This temperature is normally considered as the limiting temperatureabove which steel loses strength such that the failure of a typical simply supportedslab could occur under the load assumed to be applied during a fire [25]. Themaximum temperature of the tension rebar was compared with the critical rebartemperature.
It was assumed that explosive spalling is unlikely to occur, as the XC1 class isconsidered with moisture content less than 3% and the concrete strength is below55 MPa in accordance with EC2-1-2 [23].
A concrete density of 2300 kg/m3, thermal conductivity of 1.33 W/m K, specificheat of 900 J/kg K, convective heat transfer coefficient of 35 W/m2 K for theexposed surface and 4 W/m2 K for the unexposed surface of the concrete element,and an emissivity of 0.7 were assumed [18, 24]. In this illustrative example, theconcrete properties were assumed to be constant. It is shown elsewhere that 1Dheat transfer with constant effective properties results in a 7–15% higher in-depthconcrete temperature than the case of temperature dependent concrete properties[19]. Therefore, we deemed the method in this paper to be appropriate, because itis simple but still accurate enough. To make the reference case scenario represen-tative of habitual practice for this type of building, it was assumed that suppres-sion and detection systems operated in the case of a fire, and safe access routesand fire fighting devices were fitted in the building. The design value of the fireload density qf,d related to the surface area Af of the floor in Annex E of EC1 isgiven by:
qf ; d ¼ qf ; k � dq1 � dq2 � dn � m MJ/m2� �
ð11Þ
The product of (1) characteristic fire load density for an office building (qf,k) equalto 511 MJ/m2 (80% fractile), (2) different active firefighting measures (dn) assumedto be 0.66 (in Table 1), (3) fire activation risk due to the size of the compartment(dq1) equal to 1.53, (4) fire activation risk due to the type of occupancy (dq2) equalto 1, and (5) a combustion factor of m = 0.8, were assumed to be 0.8 in accor-dance with EC1 [18]. As such the design value of the fire load density, qf, d is410 MJ/m2.
It should be noted that the Eurocodes are the required standards, providing acommon approach for the design of buildings within the European Union andbeing used extensively in the design of buildings and slabs. On the other hand,each country is expected to issue a National Annex to the Eurocodes and choosethose parameters which are left open in the Eurocode for national choice, knownas Nationally Determined Parameters, to be used in the design of buildings in the
Fire Technology 2018
country concerned [18]. For example there are national annexes of EC1 which donot use the factors in Eq. 11, which affects characteristic fire load density (qf,k)[26]. A number of slabs around Europe have been designed without applying theAnnex E of EC1, therefore, for comparison, these cases were also considered.
3.1. Design Fire
The fire duration and severity in a fully developed fire depends on the amount ofventilation and the nature, distribution, and quantity of fuel, which all have a sig-nificant effect on duration and severity [25].
In a modern building, a double or triple glazed system may not break as readilyas single panels of ordinary glass. Characteristics, orientation and dimensions ofthe glazed external openings are architectural variables. Due to all the uncertain-ties associated with glass breakage and fall-out of glass [27], both fuel-controlledand ventilation-controlled design fires were examined. To cover all possibilities ofventilation, a series of parametric temperature–time curves were produced, inwhich the opening factor varied from 0.02 to 0.2 m1/2, in accordance with the lim-itations imposed by EC1 [18]. The external walls were considered to be 100%glazed and ranges of the opening factor cover all possibilities of glass breakage.The thermal inertia of the concrete and glazing were assumed to be 1659 W s1/2/m2K and 1312 W s1/2/m2K respectively. The calculated average compartment tem-peratures for different opening factors are presented in Fig. 2. The results showthat opening factors lying between 0.097 m1/2 and 0.2 m1/2 produced a relativelyshort fuel-controlled fire. The decrease in opening factor to below 0.097 m1/2
resulted in a fire restricted by ventilation. Opening factors between 0.074 m1/2 and
Figure 2. Gas temperature in a compartment for different openingfactors using the EC1 parametric approach and resulting rebartemperatures in the concrete slab. The reference case with themaximum rebar temperature is obtained from ventilation-controlledfires without using Annex E of EC1 and was used for sensitivityanalysis.
Probabilistic Study of the Resistance
0.02 m1/2, due to the facade glass breakage, resulted in a ventilation-controlled firewith peak gas temperatures between 750�C and 850�C.
The calculated temperature fields were used as an input to a one dimensionalheat transfer model to calculate the resulting temperature in the concrete slab atthe location of the rebar. The rebar was assumed to have the same temperature asthe adjacent concrete, as it has a much higher thermal diffusivity than concrete.
A comparison of the rebar temperatures in Fig. 2 clearly shows that the highesttemperatures were caused by a ventilation-controlled fire, obtained from an open-ing factor of 0.02 m1/2. The maximum rebar temperature was 408�C after 95 minof fire exposure. This scenario is named the ‘‘reference case’’ scenario and wasused for further analysis.
Without considering the Annex E of EC1, Fig. 2 shows that the maximumrebar temperature obtained from an opening factor of 0.02 m1/2 was 448�C after102 min of fire exposure which is 9% higher than the case in accordance withAnnex E of EC1.
4. Parametric Sensitivity Study Using OAT Method
As the most challenging scenario was the one with an opening factor of 0.097 m1/2,it was examined as the ‘‘reference case’’ for all the sensitivity studies performed inthis section. The OAT (one-at-a-time) method was used to observe how varying oneinput variable affects the output results, particularly the maximum rebar tempera-ture (RMT) and time to reach the maximum rebar temperature (tRMT). In OAT sen-sitivity analysis, the input parameters were incremented across the rangesinvestigated.
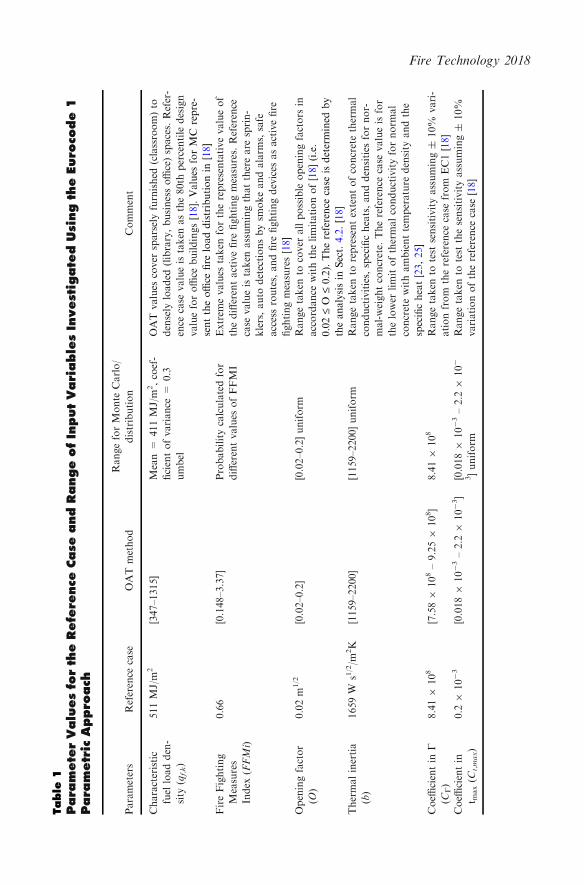
The parameter values for the reference case scenario and the ranges investigatedare given in Tables 1 and 2. The study includes all the input variables in the EC1parametric fire and the heat transfer models.
The following sections present the sensitivity analysis of the parameters inTables 1 and 2.
4.1. Characteristic Fire Load Density
The amount of fuel in a building significantly alters the dynamics of a fire. Theavailable guidance provides the characteristic ranges of the fire load, which shouldinclude temporary and permanent fire loads, and the fire loads from constructionelements, linings, and finishes [18]. Some national annexes of EC1 provide differ-ent values of fire load density for an individual occupancy and recommend usingthe 80% or 90% fractile [26]. On the other hand, comparison of the office fireload density in EC1 with recent surveys shows that the fire load given in EC1 maybe nonconservative compared to the data in survey. Results of the survey areapproximately 40% higher [28] than EC1, and therefore, the 95% fractile is a rea-sonable fire load density for an office building [29].
The range of fire load density was therefore selected to cover everything fromsparsely furnished (classroom, 347 MJ/m2) [18] to densely loaded (business office,1315 MJ/m2) spaces [2].
Fire Technology 2018
Figure 3 shows the variations of the maximum rebar temperature and the corre-sponding time, relative to the reference case, with a characteristic fire load densityranging from 347 MJ/m2 to 1315 MJ/m2.
The results show that the critical rebar temperature (critical case) occurredwhen the characteristic fire load density was above 1140 MJ/m2 after 140 min offire exposure, using the Annex E of EC1. Without considering the Annex E ofEC1, the critical case occurred for a characteristic fire load density of 912 MJ/m2
after 120 min of fire exposure. It should be noted that, when Annex E of EC1 wasused, the characteristic fire load density (qf, k) of 1140 MJ/m2 was multiplied bythe product of factors in Eq. 11 equal to 0.8 (obtained in Sect. 3), and thus thedesign fire load density (qf, d) was equal to 912 MJ/m2 (using Eq. 11). Withoutusing Annex E of EC1, the characteristic fire load density and the design fire loaddensities were both 912 MJ/m2. This shows that using the factors in Annex E ofEC1 (i.e. dq1, dq2, dn, m) could highly decrease the characteristic fire load densityused to calculate the gas temperature. Figure 3 indicates that without using AnnexE of EC1 the critical temperature was reached for a lower characteristic fire loaddensity (in this case study 20% less than using Annex E of EC1). The fuel loaddensities which lead to the critical cases are representative value for densely loa-ded (i.e. library, business office) spaces.
4.2. Fire Fighting Measures Index
The presence of active fire protection systems influences the severity of the fireenvironment and fire duration in an enclosure. This index takes into account dif-ferent active firefighting measures and ranges from 0.148 (full fire protection) to3.37 (no active fire protections and intervention of fire fighters) in accordance withAnnex E of EC1 [18]. Cases with and without the firefighting measures index were
0
50
100
150
200
250
0
200
400
600
800
200 400 600 800 1000 1200 1400
t RM
T(m
in)
RM
T (°
C)
qf, k (MJ/m2)
Rebar Max. Temp.- without Annex E of EC1Rebar Max. Temp.- with Annex E of EC1Time for Rebar Max. Temp.
Critical Case Critical CaseRef. Case
Figure 3. Maximum rebar temperature and corresponding timesversus characteristic fuel load density with and without factors inAnnex E of EC1.
Probabilistic Study of the Resistance
studied here and serve to illustrate the effect of this method on the resulting levelof safety.
Figure 4 shows how rebar maximum temperatures and associated times varywith the firefighting measure index.
The results indicate that cases where the firefighting measures index has a valuegreater than 1.46 (i.e. the case when either sprinkler systems or detection andalarm systems are not installed [18]) resulted in a temperature greater than therebar critical temperature (i.e. 583�C) after 150 min of fire exposure. Withoutusing Annex E of EC1, the maximum rebar temperature was 408�C after 95 minof fire exposure. This demonstrates that using Annex E of EC1 prolongs the fail-ure time of the structural element.
4.3. Axis Distance of Reinforcement
Axis distance of the reinforcement is a fundamental design variable in any con-crete structure and is likely to be a fixed value early in the design of a building.Typical concrete covers a range from 20 mm to 60 mm [19]. It is worth under-standing the impact of axis distances on peak rebar temperatures, as it couldmake a significant difference to the performance of the structure.
Figure 5 indicates that the peak rebar temperatures were lower than the rebarcritical temperature for all axis distances. A concrete cover of 36 mm was used forthe reference case; in addition, the range selected implicitly included the possibleloss of 24 mm concrete cover due to spalling. For each rebar depth in Table 2, wealso checked that the bending strengths with different lever arms were above theapplied bending moment.
4.4. Opening Factor
Figure 6 shows the variation of the maximum rebar temperature and the timetaken to reach the maximum temperature with a ventilation size of 0.02 m1/2 to
0
50
100
150
200
250
300
0
200
400
600
800
0 0.7 1.4 2.1 2.8 3.5
t RM
T(m
in)
RM
T (°
C)
Fire Fighting Measures Index
Rebar Max. Temperature
Time for RMT
Ref. Case Critical Case
Figure 4. Maximum rebar temperature and corresponding timeversus active fire fighting measures index in accordance to EC1.
Fire Technology 2018
0.2 m1/2. Figure 6 illustrates that the maximum rebar temperature value corre-sponds to opening factor 0.02 m1/2. It is notable that the sharp gradient changesin the maximum rebar temperature were due to a change in fire environment,from fuel-controlled to ventilation-controlled. Therefore, the predicted structuralelement temperature from parametric fire is highly sensitive to small variation ofthe size of opening.
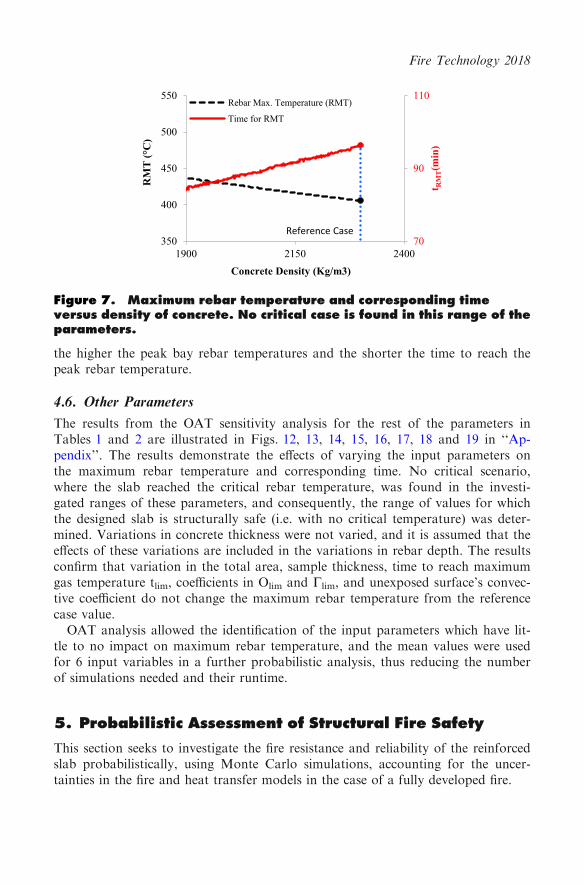
4.5. Concrete Density
Density varies greatly for concrete types, and guidance exists which provides typi-cal ranges. The reference case density was taken as the density of normal weightconcrete, equal to 2300 kg/m3 [23]. Figure 7 shows the maximum rebar tempera-ture and the time to reach the maximum temperature against concrete densitiesfrom 1900 kg/m3 to 2300 kg/m3 [25]. Results show that concrete density affectsthe maximum rebar temperature. The results indicate that the lower the density,
50
60
70
80
90
100
110
350
400
450
500
550
600
10 20 30 40 50 60
t RM
T(m
in)
RM
T (°
C)
Axis distance of reinforcement (mm)
Rebar Max. Temperature (RMT)Time for RMT
Reference Case
Figure 5. Maximum rebar temperature and corresponding timeversus rebar axis distance. No critical case is found in this range ofthe parameters.
0
40
80
120
0
150
300
450
0 0.04 0.08 0.12 0.16 0.2
t RM
T(m
in)
RM
T (°
C)
Opening factor (m1/2)
Rebar Max.Temperature (RMT)Time for RMT
Reference Case
Figure 6. Maximum rebar temperature and corresponding timeversus opening factor. No critical case is found in this range of theparameters.
Probabilistic Study of the Resistance
the higher the peak bay rebar temperatures and the shorter the time to reach thepeak rebar temperature.
4.6. Other Parameters
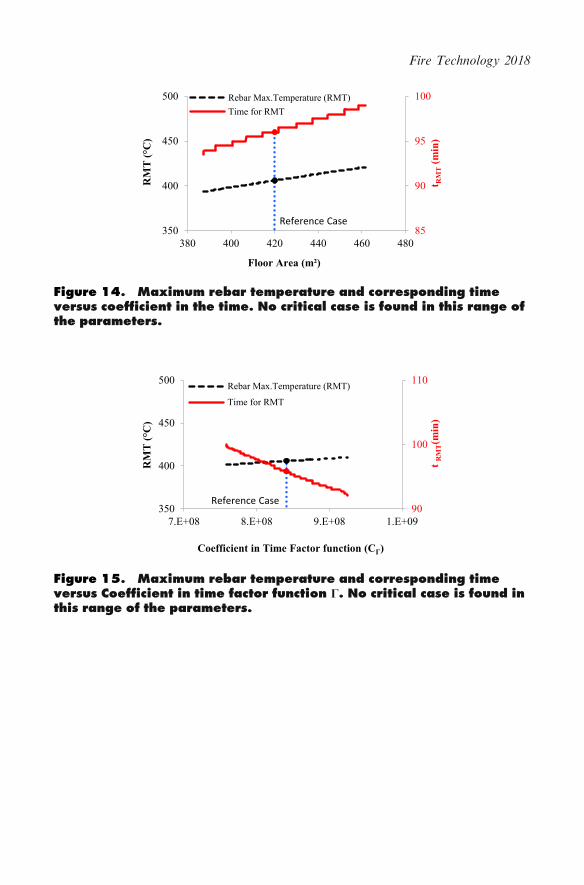
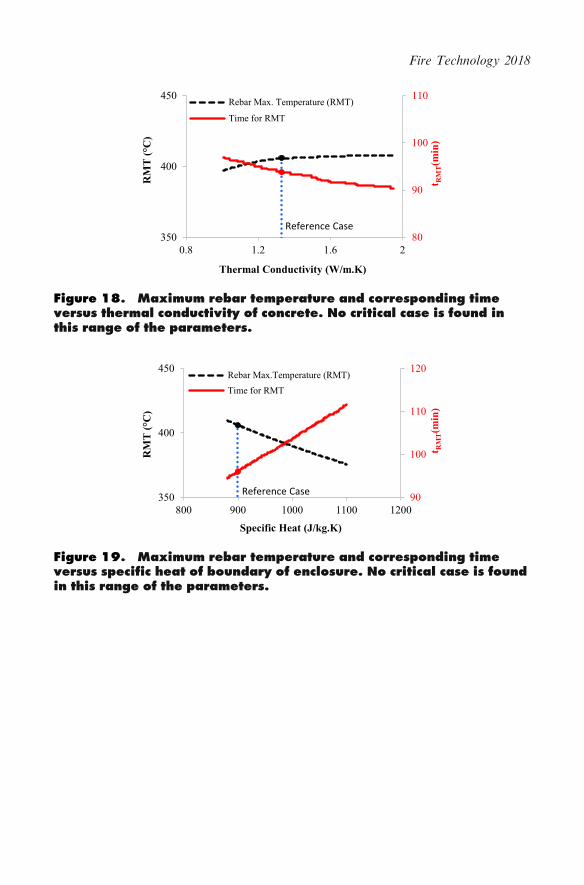
The results from the OAT sensitivity analysis for the rest of the parameters inTables 1 and 2 are illustrated in Figs. 12, 13, 14, 15, 16, 17, 18 and 19 in ‘‘Ap-pendix’’. The results demonstrate the effects of varying the input parameters onthe maximum rebar temperature and corresponding time. No critical scenario,where the slab reached the critical rebar temperature, was found in the investi-gated ranges of these parameters, and consequently, the range of values for whichthe designed slab is structurally safe (i.e. with no critical temperature) was deter-mined. Variations in concrete thickness were not varied, and it is assumed that theeffects of these variations are included in the variations in rebar depth. The resultsconfirm that variation in the total area, sample thickness, time to reach maximumgas temperature tlim, coefficients in Olim and Clim, and unexposed surface’s convec-tive coefficient do not change the maximum rebar temperature from the referencecase value.
OAT analysis allowed the identification of the input parameters which have lit-tle to no impact on maximum rebar temperature, and the mean values were usedfor 6 input variables in a further probabilistic analysis, thus reducing the numberof simulations needed and their runtime.
5. Probabilistic Assessment of Structural Fire Safety
This section seeks to investigate the fire resistance and reliability of the reinforcedslab probabilistically, using Monte Carlo simulations, accounting for the uncer-tainties in the fire and heat transfer models in the case of a fully developed fire.
70
90
110
350
400
450
500
550
1900 2150 2400
t RM
T(m
in)
RM
T (°
C)
Concrete Density (Kg/m3)
Rebar Max. Temperature (RMT)
Time for RMT
Reference Case
Figure 7. Maximum rebar temperature and corresponding timeversus density of concrete. No critical case is found in this range of theparameters.
Fire Technology 2018
The OAT sensitivity analysis (Sect. 4) identified the key input parameters whichhad the greatest effect on the maximum rebar temperature for the purpose of theMonte Carlo simulation. The parameter ranges found in the literature and theirexpected values are given in Tables 1 and 2. Probabilistic distributions were thendefined for the selected parameters. A Gumbel distribution was assumed for thefire load density in accordance with EC1 [18], with a mean value of 411 MJ/m2
and a variance of 0.3. Since little is known about the probability distribution ofthe other input parameters [30], for the purpose of this study a uniform distribu-tion was conservatively assumed. Consequently, any value has the same probabil-ity of being selected over the set range. This assumption is conservative, since it isthe shape of the tail of each distribution that is important; in this case, if the highend (or the low end if this is critical) is artificially ‘fattened’ then the likelihood ofrandomly sampling from the tail is increased.
In Monte Carlo simulation, a value was selected at random for each of theinput variables based on the given distributions, and the maximum rebar tempera-ture in the concrete slab was calculated as before. The results for the model wererecorded and the process was repeated. The Monte Carlo analysis comprised 1500individual runs. One way to select the number of trials in a Monte Carlo simula-tion is to run the model repeatedly until the mean value of the outputs converges[31]. In this case, convergence was satisfied based on a tolerance of 5% change inthe mean and standard deviation in the output. It should be noted that the proba-bilities of failure were small, so less than 5% change in the mean value of the out-puts did not significantly affect the probabilities of failure. Therefore, it wasconcluded that 1500 runs were enough.
The probability of failure Pf was calculated by evaluating the ratio between thenumber of simulations in which the structure failed and the number of times thesimulation was performed, given by:
Pf ¼ nf =n ð12Þ
where nf is the number of failed simulations, and n is the total number of simula-tions.
The reliability of a system (R) was defined as the probability that it will per-form successfully [32], which is given by:
R ¼ 1� Pf ð13Þ
The effect of the different variables on the maximum rebar temperature was com-pared from the results of the OAT, which let us exclude some of the lower impactvariables, and in turn reduce the number of runs needed to obtain a convergedanswer. The relationship between two variables can be ranked using the Spear-man’s correlation coefficient [17], which shows the strength and direction of amonotonic relationship between paired data. In this study, all graphs from theOAT analysis showed a linear and monotonic relationship, with very strongstrength between the input and output data.
Probabilistic Study of the Resistance
Instead, the strength of relationship between maximum rebar temperature anddifferent variables (i.e. sensitivity of the probability of failure to different inputdata) was obtained from the results of the OAT. The resulting percentage changein the maximum rebar temperature, against a 10% variation of each parameterfrom the corresponding reference case, was plotted in Fig. 8.
Figure 8 shows that conductivity, emissivity, and convective coefficient are thelower impact variables. These parameters were excluded from the Monte Carlosimulation. The calculated reliability was thus slightly increased, and the numberof simulations needed to achieve convergence of solution decreased to 750, wherethe probability of failure varied by less than 3.5% in 100 iterations compare to1500 trials (3.5% variation of probability of failure was too small). The simulationtime also decreased to 2 h for 750 runs, compared with 3.30 h for 1500 runs, per-formed on a 2.1 GHz Intel Core i7 processor.
We found that the maximum rebar temperature is sensitive to the active firefighting measure index. Analyses were therefore conducted for the system withspecified values for this sensitive parameter, where the probability of failure wascalculated for different set up of active fire protection measures.
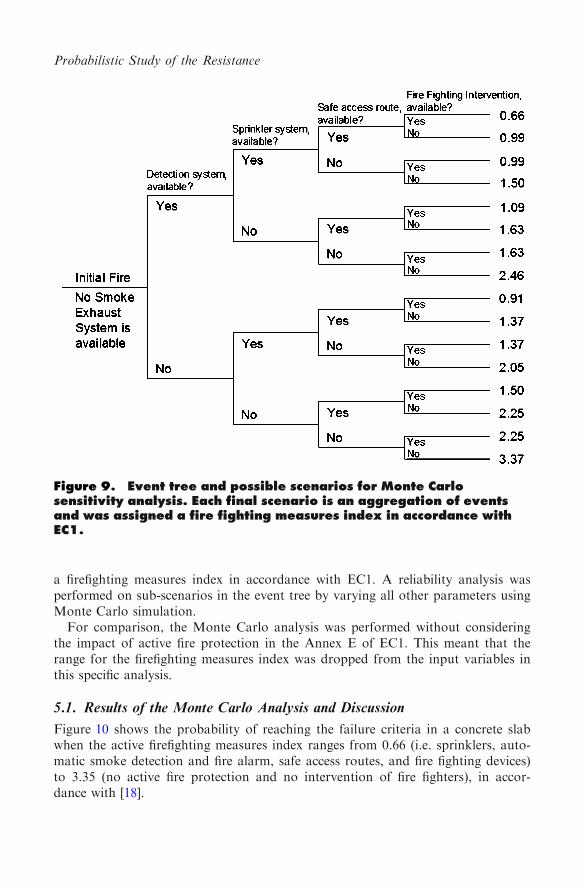
To examine a number of scenarios with different chains of events, an event treeapproach was used. An event tree is a logical model expressing the possible out-comes of an event. The construction of event trees start with specifying an event,and then various events following the initial event are modelled as branches of thetree. Each branch represents a specific risk scenario. The possible event sequencearising from the lack of active fire protections was structured, and the event tree isshown in Fig. 9. Each final scenario is an aggregation of events and was assigned
0% 1% 2% 3% 4% 5%
Fuel load density
FFMi
Coefficient in tmax
Axis distance of reinfrocing
Concrete density
Conductivity
Specific heat
Convective Coeff.
Emissivity
Ventilation Size
Floor Area
Relative Change in Maximum RebarTemperature (%)
Figure 8. The resulting percentage change of the maximum rebartemperature to 10% variation of the reference case values of themost important input variables which were identified by the OATsensitivity analysis.
Fire Technology 2018
a firefighting measures index in accordance with EC1. A reliability analysis wasperformed on sub-scenarios in the event tree by varying all other parameters usingMonte Carlo simulation.
For comparison, the Monte Carlo analysis was performed without consideringthe impact of active fire protection in the Annex E of EC1. This meant that therange for the firefighting measures index was dropped from the input variables inthis specific analysis.
5.1. Results of the Monte Carlo Analysis and Discussion
Figure 10 shows the probability of reaching the failure criteria in a concrete slabwhen the active firefighting measures index ranges from 0.66 (i.e. sprinklers, auto-matic smoke detection and fire alarm, safe access routes, and fire fighting devices)to 3.35 (no active fire protection and no intervention of fire fighters), in accor-dance with [18].
Figure 9. Event tree and possible scenarios for Monte Carlosensitivity analysis. Each final scenario is an aggregation of eventsand was assigned a fire fighting measures index in accordance withEC1.
Probabilistic Study of the Resistance
Figure 10 illustrates that, for the reference scenario where detection and sprin-kler systems, safe access route, and fire fighting devices were available in thebuilding, the probability of failure of slab was 0.3%, therefore the reliability, R,was 99.7%, using Eq. (10). Unavailability of sprinkler systems, which also coversthe case of ‘‘no detection system’’, resulted in a 1% probability of failure. Thereliability of the structure for this case was then R = 99%. When both sprinklersystem and detection and alarm systems were not available in the building, theprobability of failure was 8%, which corresponds to 92% reliability. The higherthe firefighting measure index, the higher the design fire load density and, conse-quently, the higher the probability of failure. The highest probability of failurecorresponded to an extreme case when no active fire protection measures, and nofire fighting intervention were available, and therefore the randomly generated fuelload density was always multiplied by 3.37 in accordance with the methodology inEC1 [18], which is indicated in the event tree in Fig. 9. For this extreme case, themean characteristic fuel load density of 411 MJ/m2 (in Table 1) was multiplied by3.37, and thus the mean value of 1385 MJ/m2 was taken for the Monte Carloanalysis. As such a high probability of failure is expected.
Figure 10 also shows that, for the case without considering Annex E of EC1where the fire fighting measures index was taken 1, the probability of failure ofthe slab was 0.6%, which implies a reliability of R = 99.4%.
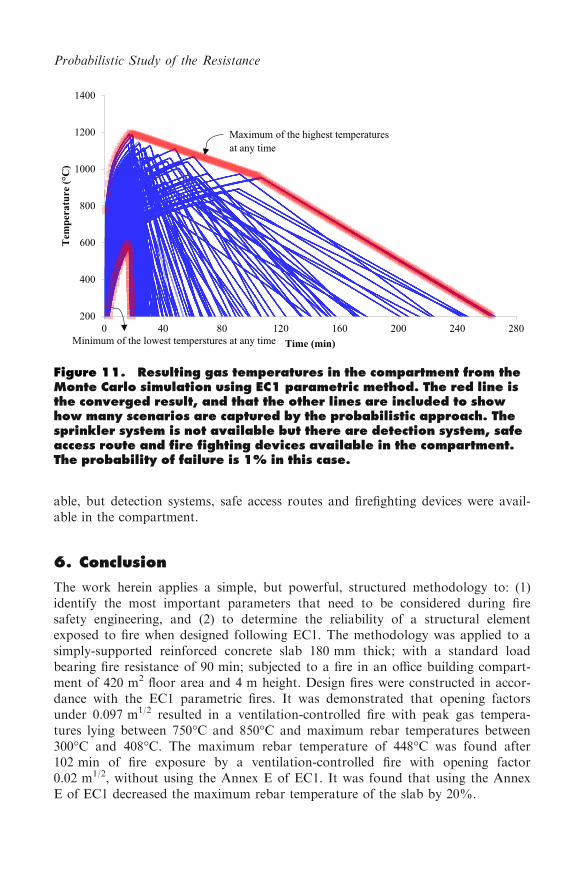
For illustrative purposes all of the possible temperature curves in the compart-ment, from the Monte Carlo simulation using EC1 parametric fire, are demon-strated in Fig. 11. The red line in Fig. 11, is the converged result, and that theother lines are included to show how many scenarios are captured by the proba-bilistic approach. These gas temperatures were applied to calculate the probabilityof failure of the slab. In this case (Fig. 11), the sprinkler system was not unavail-
0%
10%
20%
30%
40%
50%
60%
0.6 1 1.4 1.8 2.2 2.6 3 3.4
% P
roba
bilit
y of
Fai
lure
Fire Fighting Measures Index
No detection system
No sprinkler
No sprinkler and no detection system
No sprinkler, no detection system, and no safe acess route
No fire fighter intervention
Refernce Case
Figure 10. Probability of failure for a range of active fire fightingmeasures of EC1 from a Monte Carlo simulation based on 750 trials.
Fire Technology 2018
able, but detection systems, safe access routes and firefighting devices were avail-able in the compartment.
6. Conclusion
The work herein applies a simple, but powerful, structured methodology to: (1)identify the most important parameters that need to be considered during firesafety engineering, and (2) to determine the reliability of a structural elementexposed to fire when designed following EC1. The methodology was applied to asimply-supported reinforced concrete slab 180 mm thick; with a standard loadbearing fire resistance of 90 min; subjected to a fire in an office building compart-ment of 420 m2 floor area and 4 m height. Design fires were constructed in accor-dance with the EC1 parametric fires. It was demonstrated that opening factorsunder 0.097 m1/2 resulted in a ventilation-controlled fire with peak gas tempera-tures lying between 750�C and 850�C and maximum rebar temperatures between300�C and 408�C. The maximum rebar temperature of 448�C was found after102 min of fire exposure by a ventilation-controlled fire with opening factor0.02 m1/2, without using the Annex E of EC1. It was found that using the AnnexE of EC1 decreased the maximum rebar temperature of the slab by 20%.
200
400
600
800
1000
1200
1400
0 40 80 120 160 200 240 280
Tem
pera
ture
(°C
)
Time (min)Minimum of the lowest tempersture
Maximum of the highest temperatures
s at any time
at any time
Figure 11. Resulting gas temperatures in the compartment from theMonte Carlo simulation using EC1 parametric method. The red line isthe converged result, and that the other lines are included to showhow many scenarios are captured by the probabilistic approach. Thesprinkler system is not available but there are detection system, safeaccess route and fire fighting devices available in the compartment.The probability of failure is 1% in this case.
Probabilistic Study of the Resistance
Analyses of the main input parameters in the EC1 curves and heat transfermodel were performed, in order to assess the sensitivity of the main results toparameter uncertainty, and also to define the safe and critical design fires using anOAT method. The critical design fires were found when the characteristic fire loaddensity was above 1140 MJ/m2 (densely loaded spaces) and 912 MJ/m2, for caseswith and without using Annex E of EC1 respectively. It was concluded that usingthe factors in Annex E of EC1 (i.e. dq1, dq2, dn, m) could highly affect the charac-teristic fire load density used to calculate the gas temperature.
The safe ranges of design fire scenarios were identified for the firefighting mea-sures indices lower than 1.46 (i.e. sprinkler and detection systems were not avail-able, however safe access route and fire fighting devices were available) in thebuilding. The axis distance of reinforcement-the most sensitive parameter- has afixed value early in the design. The range selected for sensitivity analysis of axisdistance of rebar implicitly included the possible loss of 24 mm concrete cover dueto spalling, which does not have any impact on the resistance of the slab. Themaximum gas temperature and corresponding rebar temperature from the para-metric fire in EC1 is highly sensitive to small variation of the size of opening (i.e.ventilation), due to the change of fire environment from fuel–controlled to venti-lated-controlled. The concrete density was found to have a large effect on therebar maximum temperature. The study shows that OAT sensitivity analysis pro-vides an insight into the range of fire parameters for which the design is struc-turally safe.
The OAT analysis determined that 8 out of 17 input parameters were the mostsensitive in regard to changes in the maximum rebar temperature: axis distance ofreinforcement, ventilation sizes, concrete density, coefficient in tmax, fuel load den-sity, fire protection measures, specific heat, and floor area.
Such a structured approach could help to justify some of the assumptions andsimplifications which are made in fire safety engineering, by identifying parametersfor which more information is needed for different applications, thus allowingengineers to ignore some of the other parameters in Monte Carlo analysis, thusreducing the number of runs needed to have a converged answer. In this study,the number of simulations were decreased from 1500 to 750.
It was found that unavailability of fire protection measures, as indicated in theEC1 method, leads to an increased probability of failure (lower reliability of struc-ture). It was found that probability of failure of the concrete slab was 0.3% (i.e.99.7% structural element reliability) where detection and sprinkler systems, safeaccess route, and fire fighting devices were available in the building. Unavailabilityof either sprinkler systems or detection systems resulted in 1% probability of fail-ure of the slab (i.e. 99% reliability), and unavailability of sprinkler and detectionsystems resulted in 8% probability of failure of the slab (i.e. 92% reliability).Probability of failure of the slab was equal to 0.6% (i.e. 99.4% reliability) withoutconsidering Annex E of EC1.
The methodology presented in this paper quantifies the reliability of a structuralelement in terms of collapse probabilities, using the Monte Carlo method. Thismethodology could be applied to define the reliability of a fire-affected structure.In that case, more performance criteria and detailed structural analysis should be
Fire Technology 2018
used to assess the failure modes of structures. This study demonstrates that sensi-tivity and probabilistic analyses can provide a comprehensive understanding of thefactors affecting the structural fire resistance and inform further fire developmentand detailed structural analysis.
This novel study which conducted for the first time the OAT analysis and theMonte Carlo simulation of a slab exposed to the EC1 parametric fire, was consid-ered by the International Organization for Standardization (ISO) for inclusion inan ISO technical report [33].
Acknowledgements
This work has been supported by the European Concrete Platform and the associ-ations of French concrete sector. The authors appreciate Mathew Bonner (Impe-rial College London) for proof reading the text. This work is part of the ISO/TR24679-6 example of fire safety engineering design in the application of ISO 24679-1 to an office building [33].
Open Access
This article is distributed under the terms of the Creative Commons Attribution4.0 International License (http://creativecommons.org/licenses/by/4.0/), which per-mits unrestricted use, distribution, and reproduction in any medium, provided yougive appropriate credit to the original author(s) and the source, provide a link tothe Creative Commons license, and indicate if changes were made.
Appendix: Results from OAT Sensitivity Analyses
The results from the OAT sensitivity analysis for the some of the parameters inTables 1 and 2 are illustrated in Figs. 12, 13, 14, 15, 16, 17, 18 and 19. The resultsdemonstrate the effects of varying the input parameters on the maximum rebartemperature and corresponding time.
Figure 12. Maximum rebar temperature and corresponding timeversus the convective heat transfer Coefficient of exposed surface. Nocritical case is found in this range of the parameters.
40
80
120
350
450
550
700 950 1200 1450 1700 1950 2200
t RM
T(m
in)
RM
T (°
C)
Thermal Inertia (W.s1/2/m².K)
Rebar Max. Temperature (RMT)Time for RMT
Reference Case
Figure 13. Maximum rebar temperature and corresponding timeversus concrete thermal inertial characteristic. No critical case isfound in this range of the parameters.
Probabilistic Study of the Resistance
85
90
95
100
350
400
450
500
380 400 420 440 460 480
t RM
T(m
in)
RM
T ( °
C)
Floor Area (m²)
Rebar Max.Temperature (RMT)Time for RMT
Reference Case
Figure 14. Maximum rebar temperature and corresponding timeversus coefficient in the time. No critical case is found in this range ofthe parameters.
90
100
110
350
400
450
500
7.E+08 8.E+08 9.E+08 1.E+09
t RM
T(m
in)
RM
T (°
C)
Coefficient in Time Factor function (CΓ)
Rebar Max.Temperature (RMT)
Time for RMT
Reference Case
Figure 15. Maximum rebar temperature and corresponding timeversus Coefficient in time factor function C. No critical case is found inthis range of the parameters.
Fire Technology 2018
90
92
94
96
98
100
350
400
450
1.E-04 2.E-04 2.E-04 3.E-04 3.E-04
t RM
T(m
in)
RM
T (°
C)
Ct,max
Rebar Max.Temperature (RMT)Time for RMT
Reference Case
Figure 16. Peak bay temperature and corresponds time versuscoefficient in the time tmax. No critical case is found in this range ofthe parameters.
80
100
120
300
350
400
450
0.6 0.65 0.7 0.75 0.8
t RM
T(m
in)
RM
T (°
C)
Rebar Max.Temperature (RMT)Time for RMT
Reference Case
Emissivity
Figure 17. Maximum rebar temperature and corresponding timeversus the emissivity of concrete. No critical case is found in thisrange of the parameters.
Probabilistic Study of the Resistance
80
90
100
110
350
400
450
0.8 1.2 1.6 2
t RM
T(m
in)
RM
T ( °
C)
Thermal Conductivity (W/m.K)
Rebar Max. Temperature (RMT)
Time for RMT
Reference Case
Figure 18. Maximum rebar temperature and corresponding timeversus thermal conductivity of concrete. No critical case is found inthis range of the parameters.
90
100
110
120
350
400
450
800 900 1000 1100 1200
t RM
T(m
in)
RM
T (°
C)
Specific Heat (J/kg.K)
Rebar Max.Temperature (RMT)Time for RMT
Reference Case
Figure 19. Maximum rebar temperature and corresponding timeversus specific heat of boundary of enclosure. No critical case is foundin this range of the parameters.
Fire Technology 2018
References
1. Meacham BJ (1998) The evolution of performance based codes and fire safety design
methods, Report NIST GCR 98–761. National Institute of Standards and Technology,Gaithersburg, MD
2. Buchanan AH (2002) Structural design for fire safety. Wiley, Chichester
3. SFPE Engineering Guide to Performance-Based Fire Protection (2007) 2nd edn.National Fire Protection Association, Quincy, MA. ISBN 0877657890
4. ISO/TS 24679-1—Fire safety engineering—Performance of structures in fire. Interna-tional organization for standardization (2011)
5. Fleischmann C (2011) Is prescription the future of performance based design?. Fire SafSci 10:77–94
6. Notarianni G, Kathey A, Parry S (2015) SFPE handbook of fire protection eng. In:
Uncertainty: SFPE handbook of fire protection engineering, 5th edn, pp 2992–30477. Torero JL, Jowsey A, Usmani A, Lane B, Lamont S (2004) Structures in fire: an over-
view of the boundary condition. In: Fire and structures conference, The Royal Society
of Edinburgh, pp 13–148. Johann MA, Albano LD, Fitzgerald RW, Meacham BJ (2006) Performance-based
structural fire safety. J Perform Constr Facil 20(1):45–539. Lange DJ (2009) Risk and performance based fire safety design of steel and composite
structures. Ph.D thesis, School of Engineering-The University of Edinburgh10. Al-Remal AM (2012) Risk-based design of structures for fire, School of Engineering-
The University of Edinburgh
11. Lange D, Usmani A, Torero JL (2008) The reliability of structure in fire. In: Singapore:proceeding of the fifth international conference on structure in fire (SiF08)
12. Guo Q, Shi K, Jia Z, Jeffers AE (2013) Probabilistic evaluation of structural fire resis-
tance. Fire Technol 49(3):793–81113. Van Coile R, Caspeele R, Taerwe L (2014) Reliability-based evaluation of the inherent
safety presumptions in common fire safety design. Eng Struct 77:181–19214. Kirby BR, Newman GM, Butterworth N, Pagan J, English C (2004) A new approach
to specifying fire resistance periods. Struct Eng 82:34–3715. Law A, Stern-Gottfried J, Butterworth N (2015) A risk based framework for time
equivalence and fire resistance. Fire Technol 51(4):771–784. https://doi.org/10.1007/
s10694-014-0410-916. Nigro E, Bilotta A, Asprone D, Jalayer F, Prota A, Manfredi G (2014) Probabilistic
approach for failure assessment of steel structures in fire by means of plastic limit anal-
ysis. Fire Saf J 68:16–2917. Hostikka S, Keski-Rahkonen O (2003) Probabilistic simulation of fire scenarios. Nucl
Eng Des 224(3):301–31118. Eurocode 1 (2002) Actions on structures—p1-2: general actions—actions on structures
exposed to fire. European standard EN 1991-1-2, CEN, Brusseles19. Stern-Gottfried J, Rein G (2012) Travelling fires for structural design-part II: design
methodology. Fire Saf J 54:96–112
20. Incropera FP, DeWitt DP, Bergman TL, Lavine AS (2007) Fundamentals of heat andmass transfer, 6Wiley, Chichester
21. Bal N (2012) Uncertainty and complexity in pyrolysis modelling, PhD thesis-School of
Engineering, The University of Edinburgh22. Ulam S, Meteropolis N (1949) The Monte Carlo method. Am Stat Assoc 44(247):335–
23. Eurocode 2 (2004) Design of concrete structures-part 1–2: general rules—structural fire.European Standard EN 1992-1-2, CEN, Brussels
24. Eurocode 2 (2002) Design of concrete structures-part 1-1: general rules and rules for
buildings. European Standard EN 1992-1-1, CEN, Brussels25. Drysdale D (2011) An introduction to fire dynamics. Wiley, Chichester26. Eurocode1-Annexe nationale a la NF EN 1991-1-2 (2007) Eurocode 1—actions sur les
structures—partie 1-2: actions generales—actions sur les structures exposees au feu.
l’Association francaise de normalisation (AFNOR)27. Babrauskas V (2011) Glass breakage in fires. Fire Science and Technology Inc., Is-
saquah, pp. 1–7
28. Thauvoye C, Zhao B, Klein J, Fontana M (2008) Fire load survey and statistical analy-sis. Fire Saf Sci 9:991–1002
29. Khorasani NE, Garlock M, Gardoni P (2014) Fire load: survey data, recent standards,
and probabilistic models for office buildings. Eng Struct 58:152–16530. Haimes YY, Lambert JH (1999) When and How can you specify a probability distribu-
tion when you don’t know much? II. Risk Anal 19(1):43–4631. Byrne MD (2013) How many times should a stochastic model be run? An approach
based on confidence intervals. In: Proceedings of the 12th international conference oncognitive modeling, pp 445–450
32. Modarres M, Joglar F (2002) Reliability. In: Dinenno PJ (ed) SFPE handbook of fire
protection engineering National Fire Protection Association, Quincy, pp 5–2433. ISO/TR 24679-6 (2016) Fire safety engineering—performance of structures in fire—part
6: example of an eight-storey reinforced concrete building, Geneva
34. Biasioli F et al (2014) Eurocode 2: background and application, design of concretebuilding, worked examples, Publications Office of the European Union, Luxembourg