Page 1
Proceso ANAMMOX: experiencia presente y perspectivas de futuro
Anuska Mosquera CorralDepartment of Chemical Engineering, School of Engineering,
University of Santiago de Compostela, Spain
Valencia, 16 de Octubre de 2019Cátedra UPV FACSA‐FOVASA
Page 2
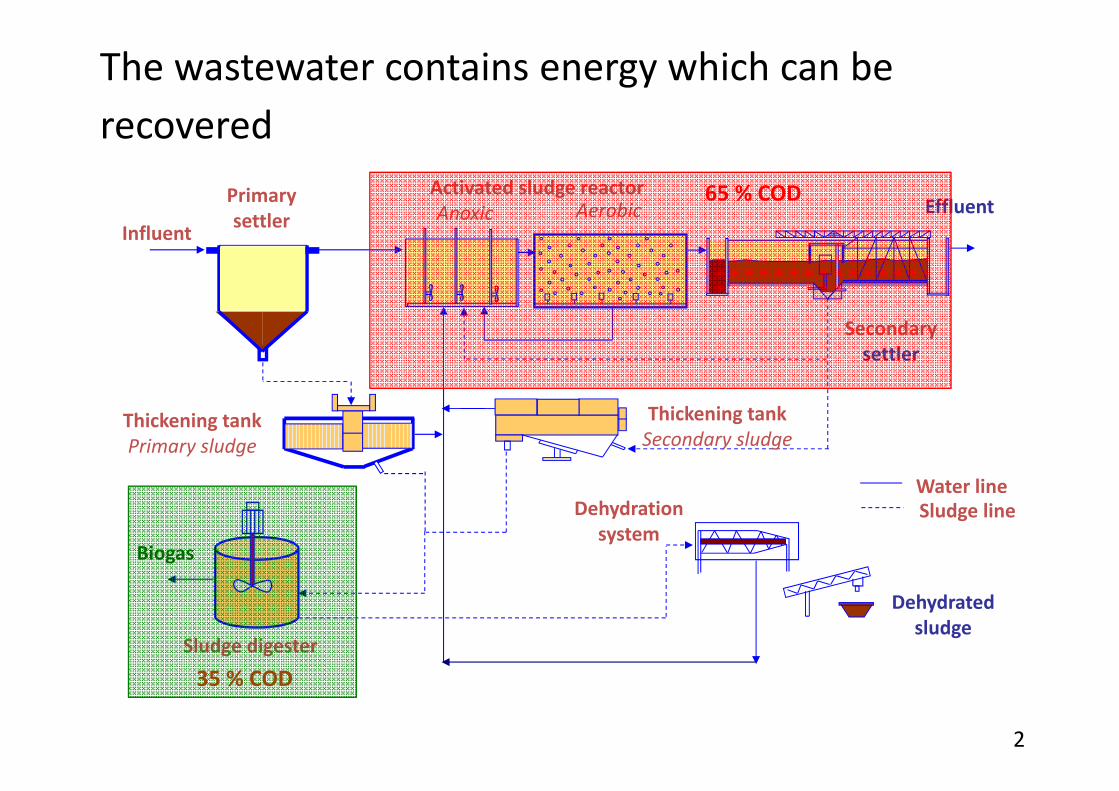
The wastewater contains energy which can be recovered
PrimarysettlerInfluent
Effluent
Thickening tankPrimary sludge
Sludge digester
Biogas
Thickening tankSecondary sludge
Anoxic AerobicActivated sludge reactor
Dehydrationsystem
Dehydratedsludge
Secondarysettler
Water lineSludge line
35 % COD
65 % COD
2
Page 3
Conventional nitrification‐denitrification
Nitrogen is removed from wastewater by biological processes
Partial nitritation‐Anammox process
50%
Anammox: Anaerobic AMMonium OXidation
3
NH4+ + 1,32 NO2
‐ + 0,066 HCO3‐ + 0,13 H+
1,02 N2 + 0,26 NO3‐ + 0,066 CH2O0,5N0,15 + 2,03 H2O
Page 4
Nitrificación parcial
Anammox
Two stages
ELAN (AQUALIA)
Single stage
Partial nitrification‐Anammox
A. Mosquera‐Corral, F. González, J.L. Campos, R. Méndez. (2005). Process Biochemistry, 40, 3109–3118.
Two alternatives are feasible to carry out the partial nitritation‐anammox (PN‐AMX) processes
4
Page 5
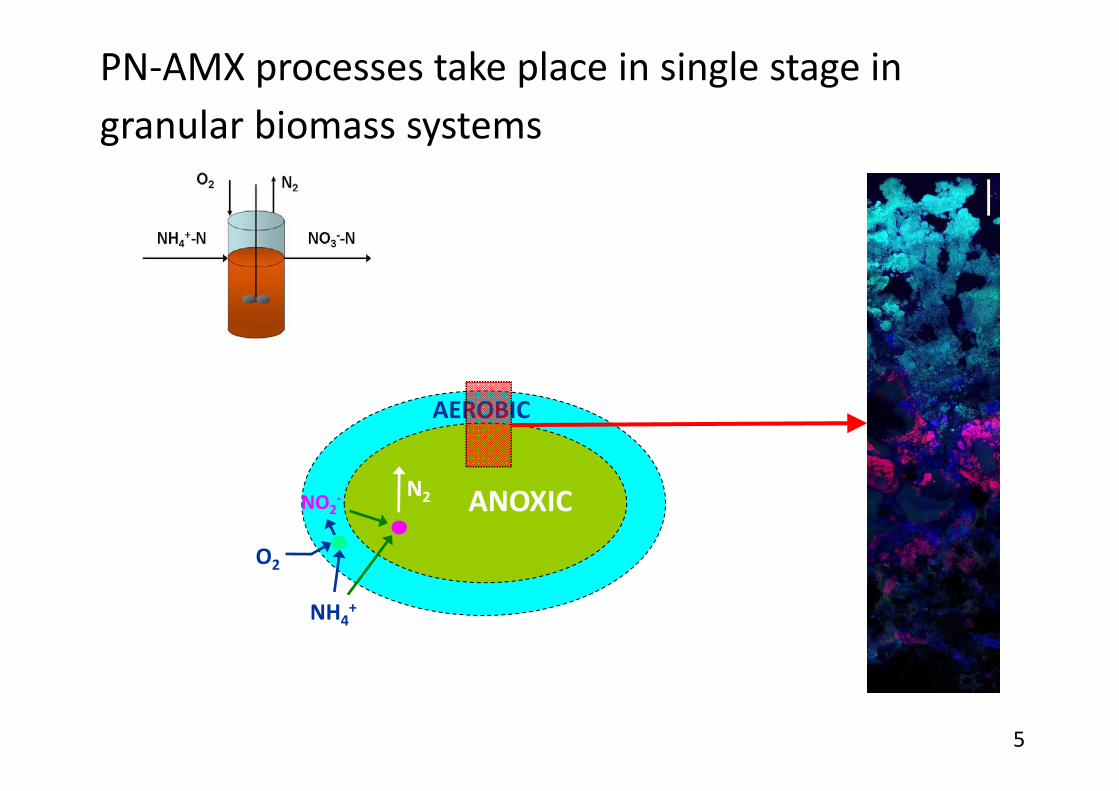
NH4+
N2 ANOXICNO2‐
O2
AEROBIC
PN‐AMX processes take place in single stage in granular biomass systems
5
Page 6
Normalized area0.0 0.2 0.4 0.6 0.8 1.0
Dep
th (m
m)
-1.2
-1.0
-0.8
-0.6
-0.4
-0.2
0.0
Bacteria (EUBmix)Anammox (Amx820)AOB (Neu653)
The structure of the granules allows for an external aerobic and an internal anoxic layer
AOB: Ammonium Oxidizing Bacteria
6Vázquez-Padín J.R. et al. (2010). Water Research, 44, 4359-4370.
Page 7
0.0
0.2
0.4
0.6
0.8
1.0
1.2
0 50 100 150 200 250 300 350 400
Time (d)
AO
R, N
OR
, AN
R (g
N L
-1 d
-1)
I II III IV V VI
AOR NRR NOR
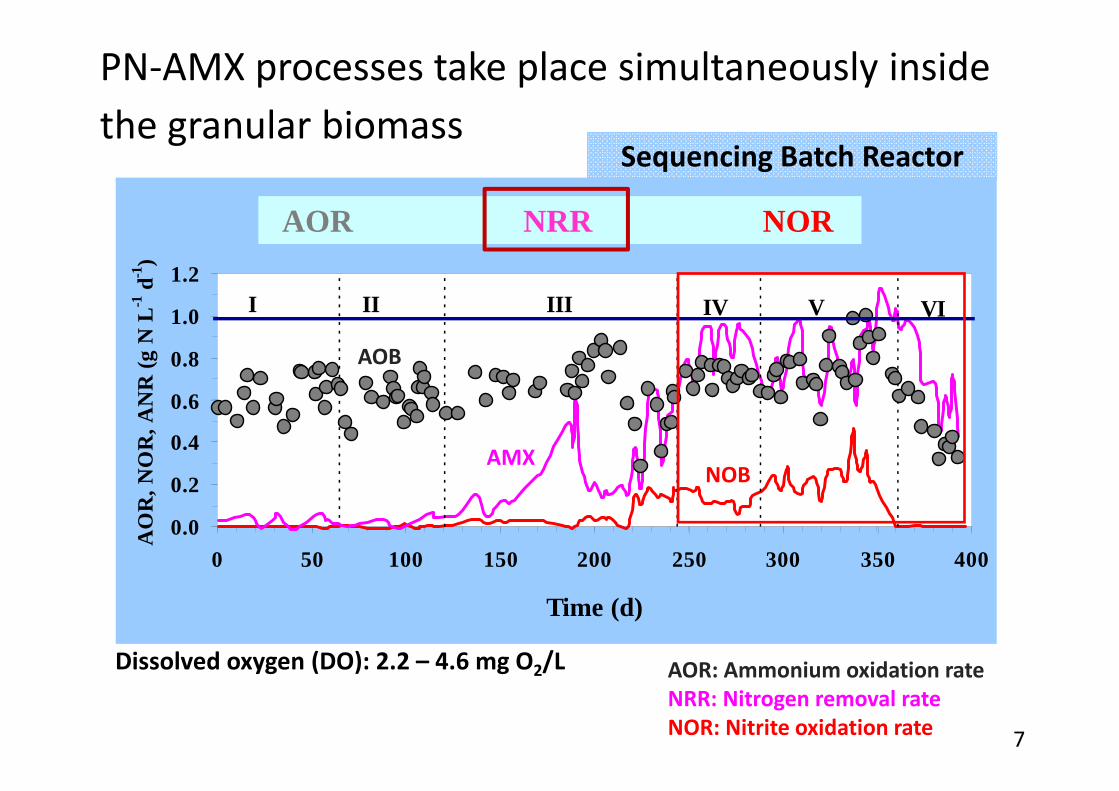
Sequencing Batch Reactor
AOR: Ammonium oxidation rateNRR: Nitrogen removal rateNOR: Nitrite oxidation rate
PN‐AMX processes take place simultaneously inside the granular biomass
Dissolved oxygen (DO): 2.2 – 4.6 mg O2/L
AOB
AMXNOB
7
Page 8
1.5 L200 L 1200 L
*ELAN® process (ELiminación Autótrofa de Nitrógeno): combination of partial nitrification andAnammox in a single reactor.
Research at pilot scale was performed to validate the process (2010‐2013)
8
Page 9
Vigo WWTP
Guillarei WWTP
Guillarei WWTP:ELAN® reactor
Vigo WWTPELAN® reactor
SBR granular reactors were evaluated by FCC Aqualia
9
Page 10
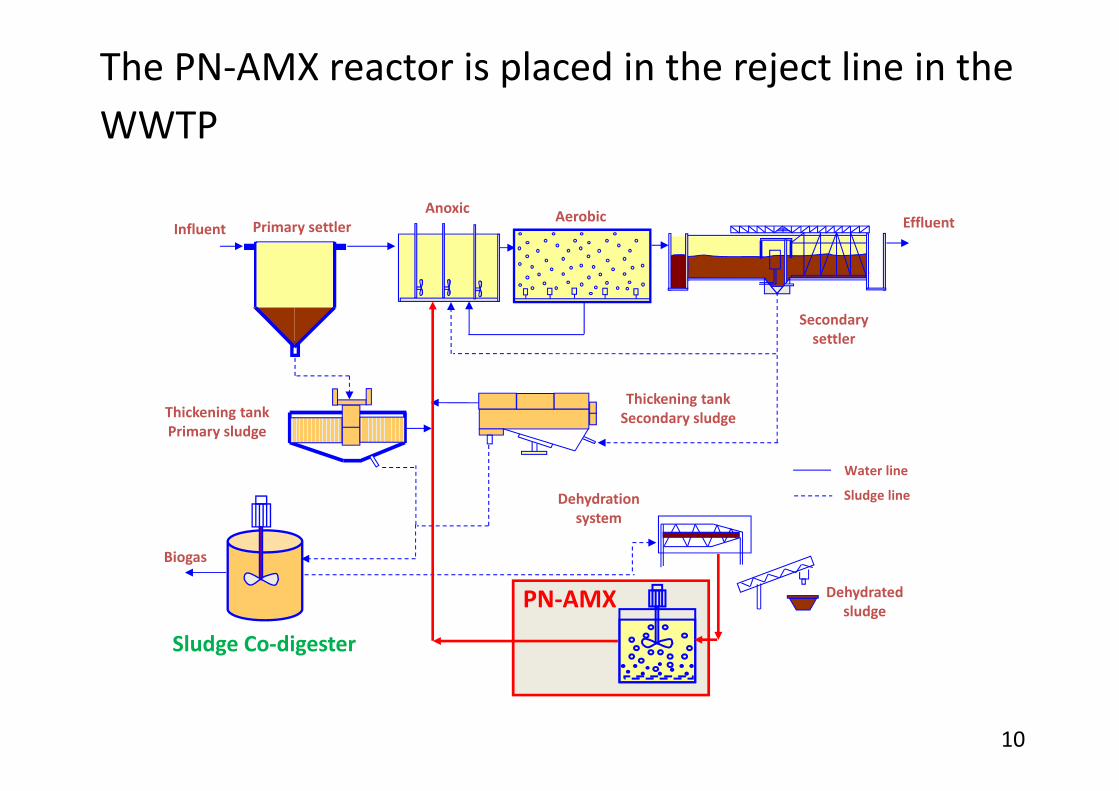
The PN‐AMX reactor is placed in the reject line in the WWTP
AnoxicPrimary settlerInfluent
Thickening tankPrimary sludge
Sludge Co‐digester
Biogas
Thickening tankSecondary sludge
Aerobic
Dehydrationsystem
Dehydratedsludge
Secondarysettler
Water line
Sludge line
PN‐AMX
Effluent
10
Page 11
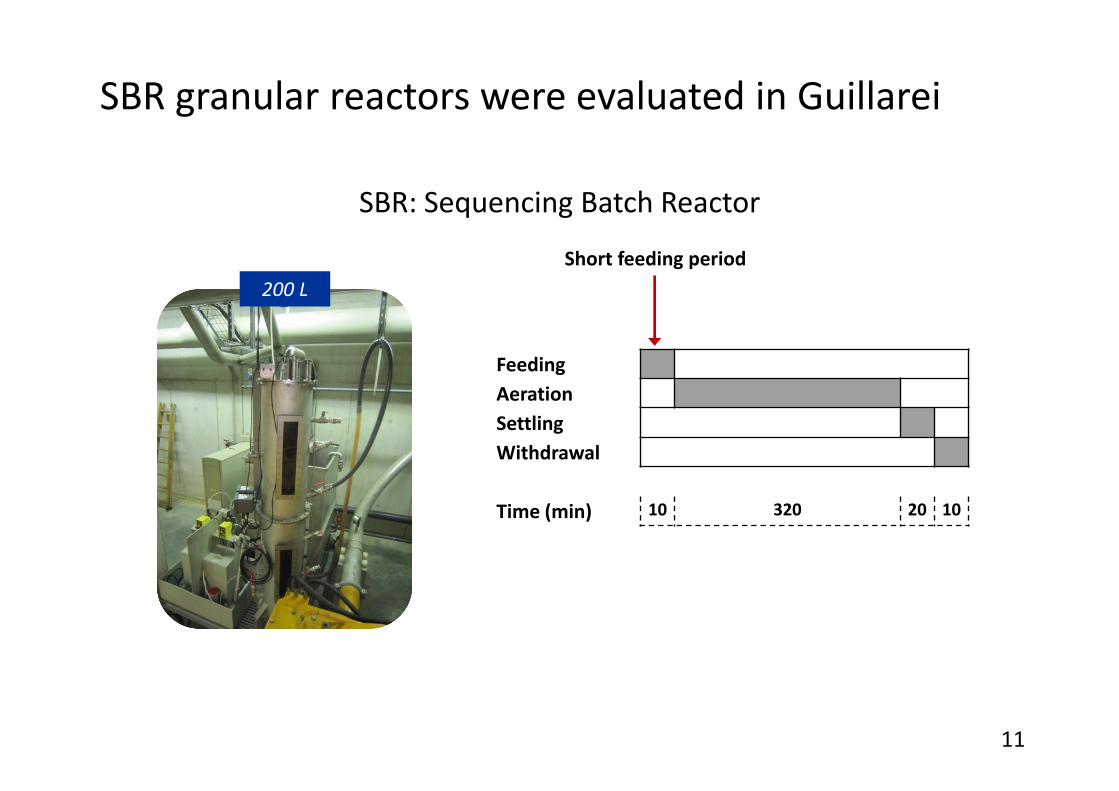
FeedingAerationSettlingWithdrawal
Time (min) 10 320 20 10
SBR granular reactors were evaluated in Guillarei
200 LShort feeding period
SBR: Sequencing Batch Reactor
11
Page 12
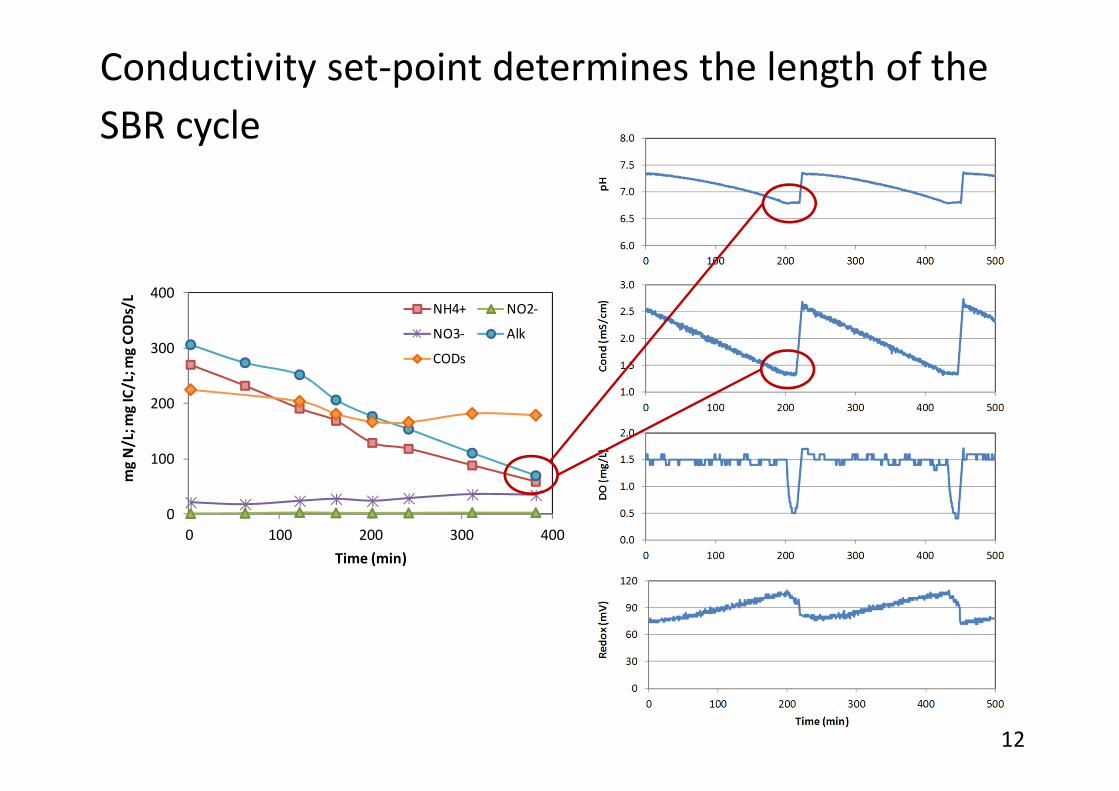
Conductivity set‐point determines the length of the SBR cycle
0
100
200
300
400
0 100 200 300 400
mg N/L; m
g IC/L; m
g CO
Ds/L
Time (min)
NH4+ NO2‐
NO3‐ Alk
CODs
12
Page 13
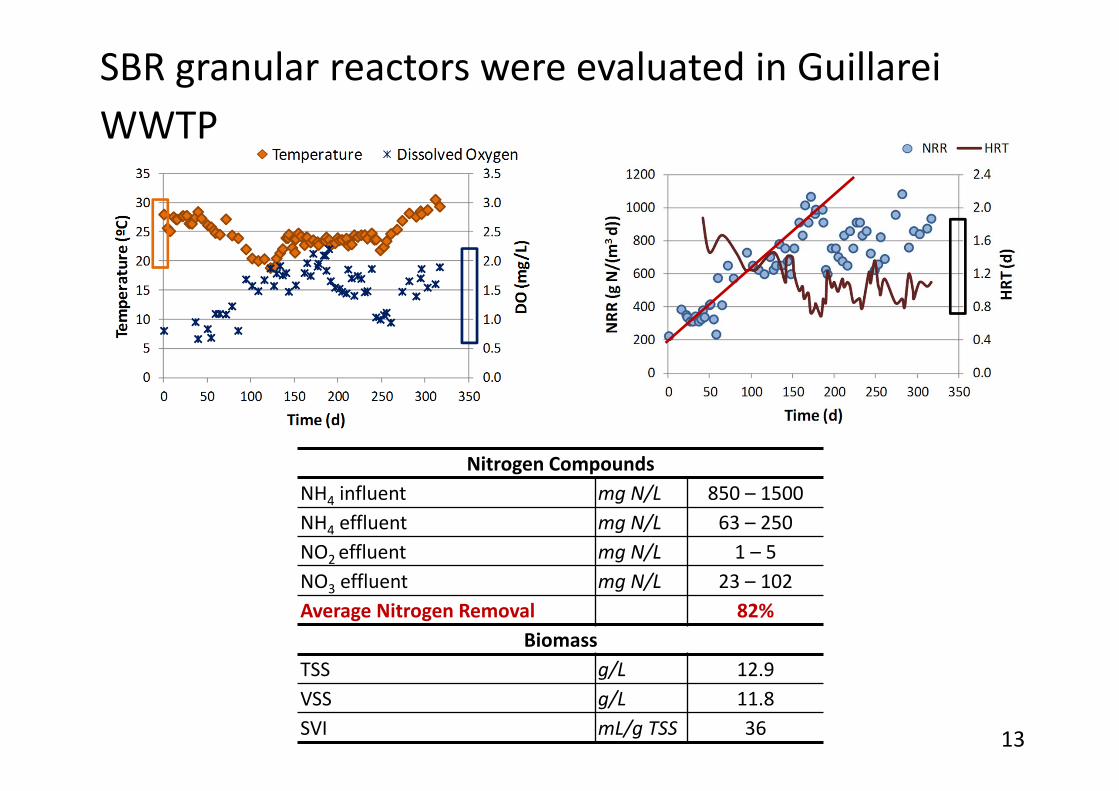
Nitrogen CompoundsNH4 influent mg N/L 850 – 1500NH4 effluent mg N/L 63 – 250NO2 effluent mg N/L 1 – 5NO3 effluent mg N/L 23 – 102Average Nitrogen Removal 82%
BiomassTSS g/L 12.9VSS g/L 11.8SVI mL/g TSS 36
SBR granular reactors were evaluated in GuillareiWWTP
13
Page 14
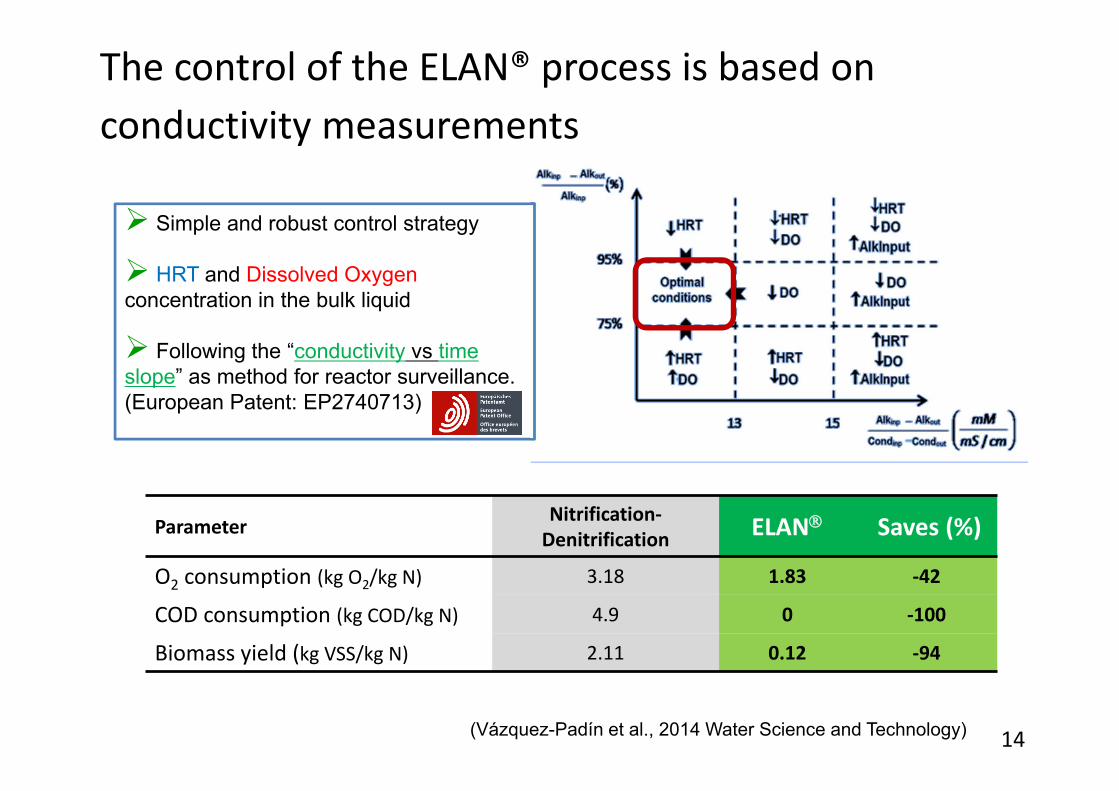
Parameter Nitrification‐Denitrification ELAN Saves (%)
O2 consumption (kg O2/kg N) 3.18 1.83 ‐42
COD consumption (kg COD/kg N) 4.9 0 ‐100
Biomass yield (kg VSS/kg N) 2.11 0.12 ‐94
(Vázquez-Padín et al., 2014 Water Science and Technology)
Simple and robust control strategy
HRT and Dissolved Oxygenconcentration in the bulk liquid
Following the “conductivity vs time slope” as method for reactor surveillance. (European Patent: EP2740713)
The control of the ELAN® process is based on conductivity measurements
14
Page 15
2015
In operation/start up
Sidestream municipal WWTP
The ELAN® process is scaled up at full scale
250 m3
Mainstream industrial WWTP
Design/under construction
15
Page 16
Biological R.(water line)
ELAN®(sludge line)
Reactor Volume (m3) 9562 115
N denitrified (kg N/d) 226 67
Ammonium oxidized (kg N/d) 630 (to NO3‐) 43 (to NO2
‐)
O2 consumption for nitrification (kg O2/d) 2879 148
N removal rate (kg N/(m3 d)) 0.02 0.60
N oxidation rate (kg N/(m3 d)) 0.06 0.37
Water line 83 times bigger than sludge line unit
Water line treates 3.4 times the load of the sludge line
Comparison: Secondary treatment vs. ELAN® design
16
Page 17
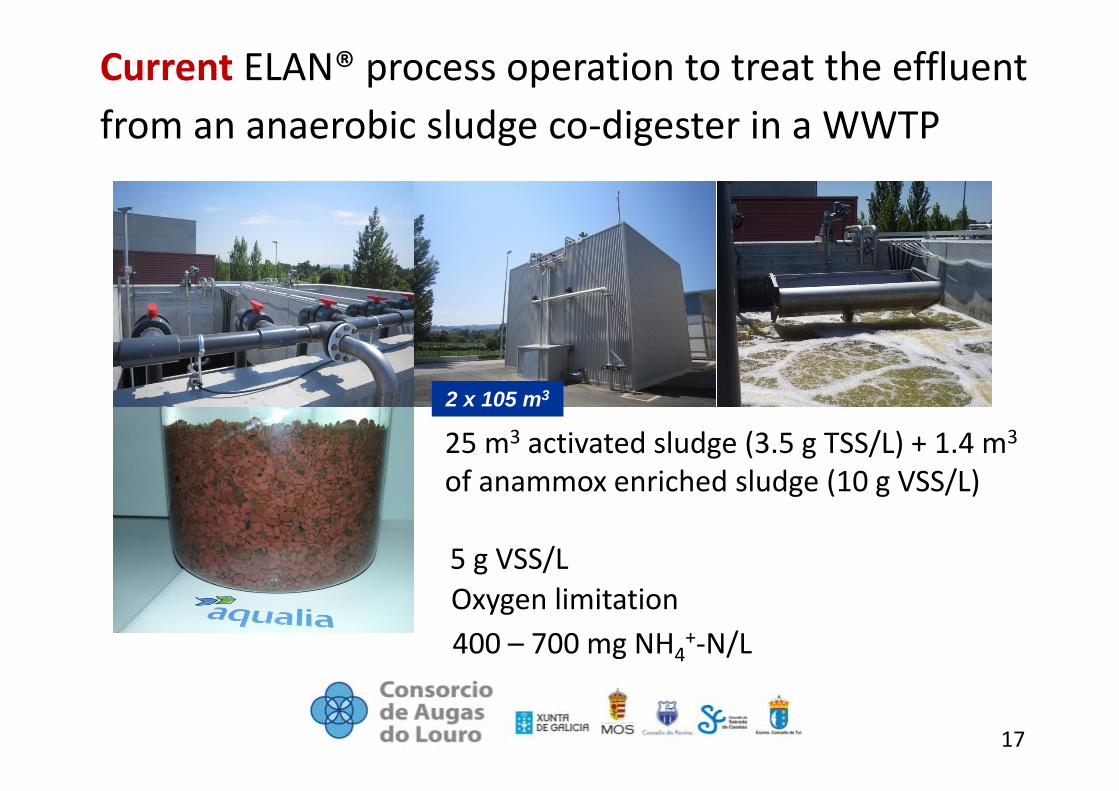
Current ELAN® process operation to treat the effluent from an anaerobic sludge co‐digester in a WWTP
25 m3 activated sludge (3.5 g TSS/L) + 1.4 m3
of anammox enriched sludge (10 g VSS/L)
Oxygen limitation400 – 700 mg NH4
+‐N/L
5 g VSS/L
2 x 10⁵ m3
17
Page 18
0
100
200
300
400
500
600
Janu
ary
February
March
April
May
June
July
August
Septem
ber
Octob
er
Novem
ber
Decembe
r
Janu
ary
February
March
April
May
June
mg N/(L∙d)
Nitrogen Removal rate
Nitrogen removal rates over 350 mg N/(L∙d) are achieved
18
Page 19
Biomass granulation
Day 222
Day 25
Day 63
Biomass accumulation
Granular biomass is accumulated in the SBR
19
Page 20
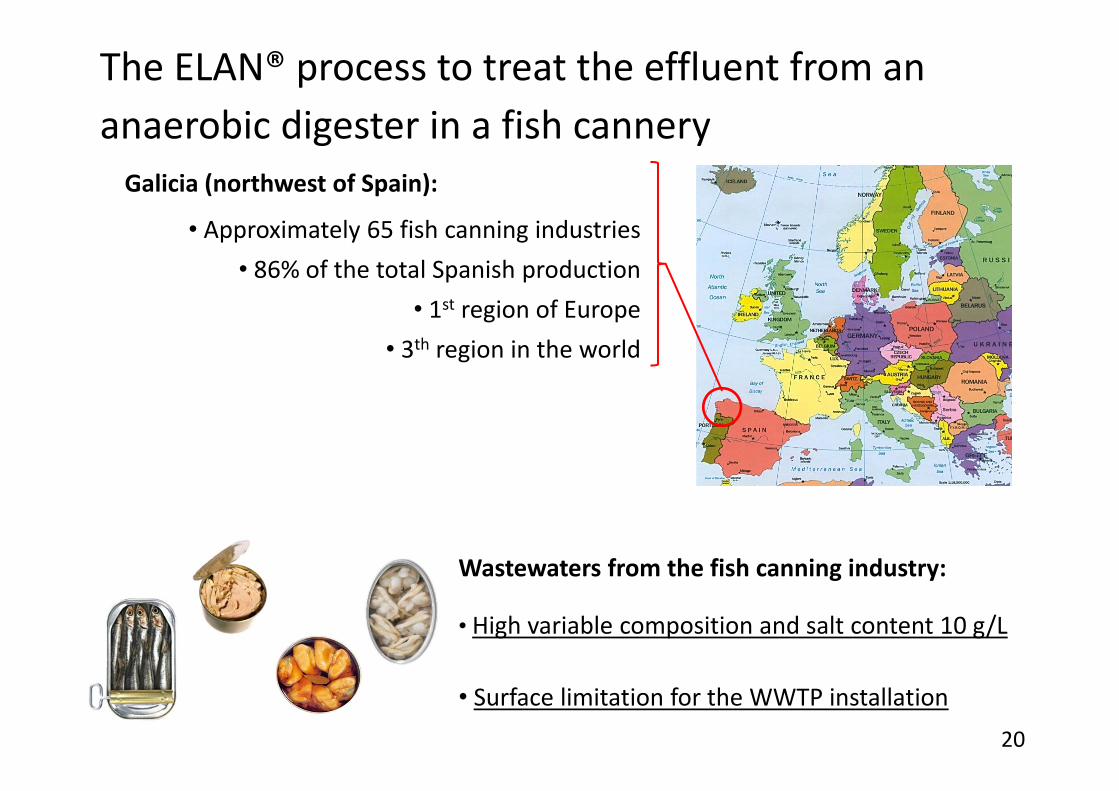
Galicia (northwest of Spain):
• Approximately 65 fish canning industries• 86% of the total Spanish production
• 1st region of Europe• 3th region in the world
Wastewaters from the fish canning industry:
• High variable composition and salt content 10 g/L
• Surface limitation for the WWTP installation
The ELAN® process to treat the effluent from an anaerobic digester in a fish cannery
20
Page 21
The ELAN® process will be used to upgrade the fish cannery
Influent
Anaerobicdigester
Homogeneizationtank
250 m3
2000 m3
2500 m3
Conventional SBR
Biogas
Effluent
Physico‐chemical process (DAF)
Sludge Sludge
N2
270 m3/d
135 m3/d
135 m3/d
270 m3/d
21
Page 22
• Variable composition• Salt content
Moving from lab to Full Scale
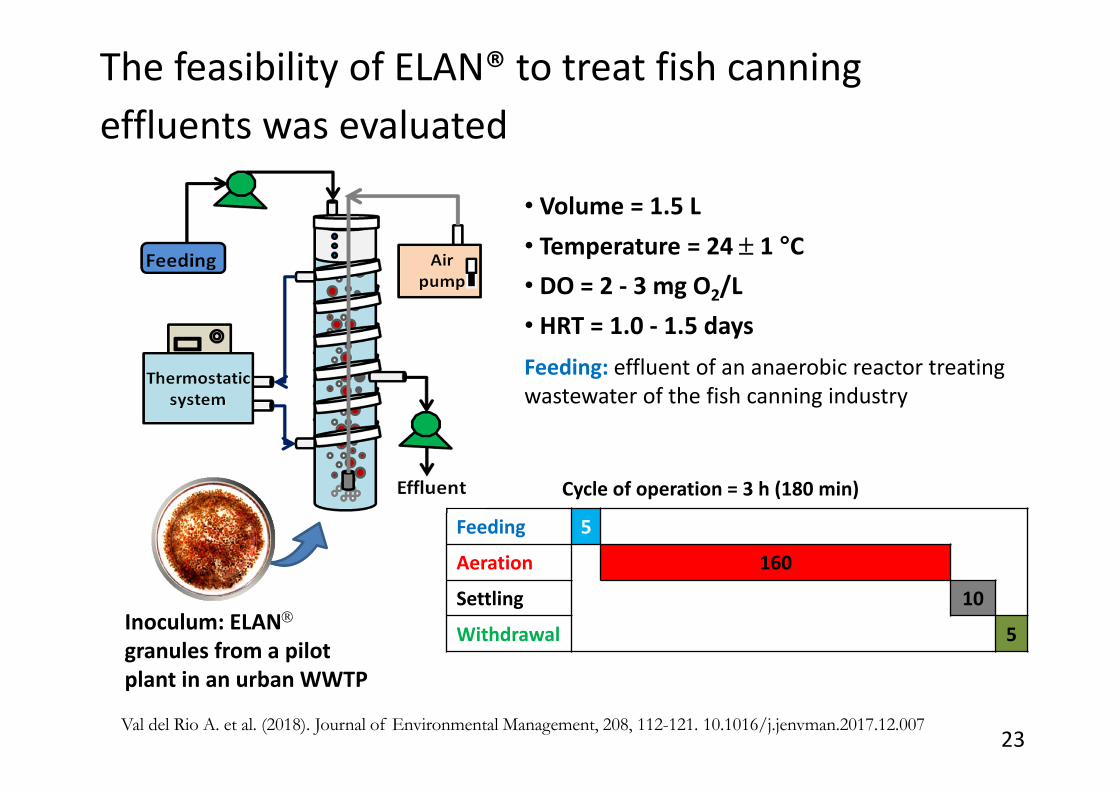
The feasibility of ELAN® to treat fish canning effluents was evaluated
22
Page 23
• Volume = 1.5 L• Temperature = 24 1 °C• DO = 2 ‐ 3 mg O2/L• HRT = 1.0 ‐ 1.5 days
Feeding 5
Aeration 160
Settling 10
Withdrawal 5
Cycle of operation = 3 h (180 min)
Inoculum: ELAN
granules from a pilot plant in an urban WWTP
Feeding: effluent of an anaerobic reactor treating wastewater of the fish canning industry
The feasibility of ELAN® to treat fish canning effluents was evaluated
23Val del Rio A. et al. (2018). Journal of Environmental Management, 208, 112-121. 10.1016/j.jenvman.2017.12.007
Page 24
0
100
200
300
400
0 20 40 60 80 100 120 140 160
mg N/L
Time (d)NH4+ inf NH4+ ef NO2‐ ef NO3‐ ef
NO3‐ due to anammoxNO2
‐ did not accumulate
ELAN stoichiometry:NH4
+ + 0.85 O2 + 1.11 HCO3‐
0.44 N2 + 0.11 NO3‐ + 2.56 H2O + 1.11 CO2
Good performance of the anammox process
Fulfilled the industrial limit of N discharge < 115 mg N/L
Nitrogen removal successfully achieved in the SBR
24
Page 25
≈ 100% NH4+ oxidation
≈ 80% total nitrogen removal
Sharp increase of salinity from 4 to 16 g NaCl/L: 40% AOB inhibition 100% anammox inhibition
Reversible Reversible inhibition
Sudden increase of salt concentration reduced the N removal in the SBR
25
Page 26
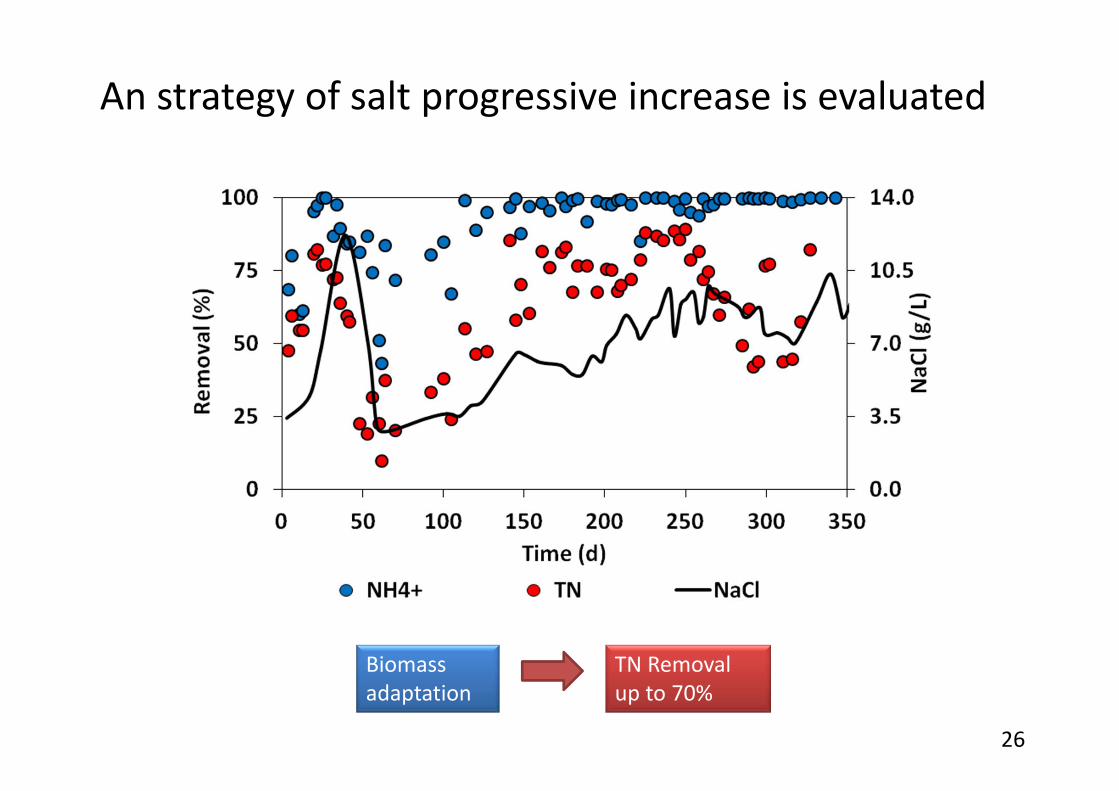
TN Removal up to 70%
Biomass adaptation
An strategy of salt progressive increase is evaluated
26
Page 27
Reduce the nitrogen load applied to compensate for the inhibition.
Use a homogenization tank, helping to mitigate the sharp salt increases.
Promote biomass progressive adaptation to increasing salt concentrations.
9 g NaCl/L100% NH4
+ oxidation70% total nitrogen removal
Operational conditions need to be defined to minimize salinity effects
27
Page 28
The implementation of the ELAN® process in the fish cannery involves several changes
Influent
Anaerobicdigester
Homogeneizationtank
250 m3
2000 m3
2500 m3
Conventional SBR
Biogas
Effluent
Physico‐chemical process (DAF)
Sludge Sludge
N2
270 m3/d
135 m3/d
135 m3/d
270 m3/d
Future WWTP with the inclusion of ELAN® process
ELAN2000 m3
Effluent
Sludge
InfluentBiogas
Sludge
N2
250 m3
270 m3/d
270 m3/d
270 m3/d
Physico‐chemical process (DAF) Anaerobic
digester
28
Page 29
Influent Effluentg/m3 kg/d g/m3 kg/d
COD 6700 1 818 250 67TN 300 94 40 10
AD Effluent Without ELAN®
With ELAN®
Water Flow m3/d 135 270CH4 m3/d 245 490
g/m3 kg/d kg/dCOD 670 90 181TN 312 42 84N removal SBR (N‐DN) ELAN®
Volume (m3) 2 500 250Sludgewaste (kg DS/d) 264 3N removal (kg N/d) 74.5 74.5Energy (kWh/d) 1 340 198N removal ratekg N/(m3 d) 0.03 0.30
Achieving the same removal
Double methane production
100 % of the flowanaerobically treated
Only 10 % of aerobic volume
98 % sludge reduction
85% Less Energy for aeration
N removal rate increase by 10
OPEX of ELAN® system expected to be 20% lower than conventional N‐DN
Positive Energy Balance: 4900 kWh ther vs 200 kWh elect
Together with a number of advantages
29
Page 30
PrimaryClarifiers
Raw Sewage
Effluent
PrimarySludge Thcikeners
AnaerobicDigester
Biogas
Secondary SludgeThickening Drums
Anoxic AerobicActivated Sludge System
Dehydration Centrifuge
Dehydrated Sludge
SecondaryClarifiers
Water line
Sludge line
BarsScreening
Pumping
Sludge Tank
Grit
Grit RemovalSieves
ELAN®
Reactor
StruviteCristallyzer
A step: BOD Valorization
B step:ELAN Process
Co‐substrates
In the future ELAN® modified is expected to be applied to the mainstream of a WWTP
30
Page 31
NH4+ NH4
+
NO2‐
NO3‐X
NH4+
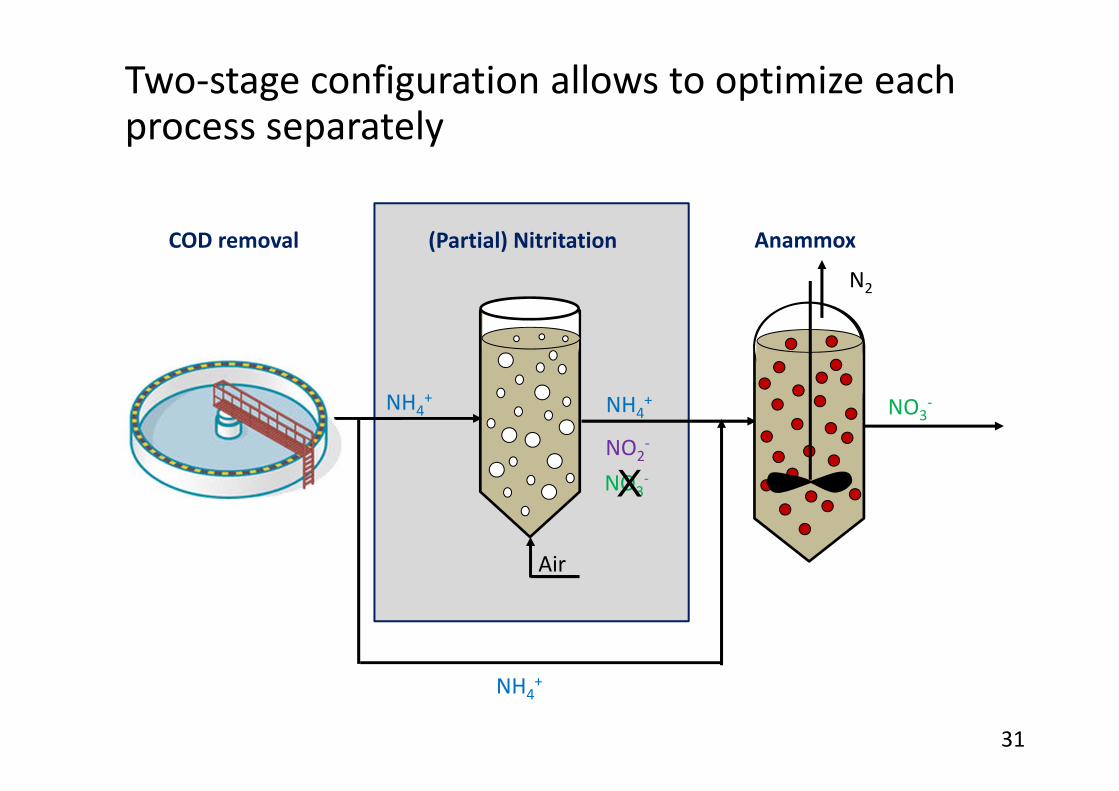
Two‐stage configuration allows to optimize each process separately
N2
Air
NO3‐
COD removal (Partial) Nitritation Anammox
31
Page 32
The process limited by NOB activity
AOB
AMX
NOBO2
NOBNO2‐
AOB = Ammonium oxidizing bacteriaNOB = Nitrite oxidizing bacteriaAMX = Anammox bacteria
32
Page 33
Anthonisen et al. (1976) Journal Water Pollution Control Federation ; 48, (5), 835‐852.Blackburne et al. (2008) Biodegradation; 19:303‐312.
NOB are more sensitive to free nitrous acid (FNA) than AOB
⁄
NH 1.4O → NONitritation:
5,0
5,3
5,6
5,9
6,2
6,5
6,8
7,1
7,4
0 10 20 30 40 50 60 70 80 90 100
pH
NO2‐‐N (mg/L)
0.02 < FNA < 0.4 mg HNO2‐N/L
AOB
NOB 0.02 mg HNO2‐N/L
0.4 mg HNO2‐N/L
5 °C10 °C 15 °C20 °C
33
Page 34
Inoculum: sludge with significant NOB activitySequencing batch reactor (SBR): 2 LT = 16 ± 1 °C
Feeding+aerationSettlingDrawingTime (min) 158 20 2
SBR cycle distribution
NOB suppressionPedrouso et al. (2017) Separation and Purification Technology 186, 55‐62.
Two‐stage configuration allows a better NOB suppression and promotes the anammox process
34
Page 35
Stage(day)
AbundanceNitrospira (%)
SI (44) 27.4%
SIII (248) 3.4%
SIII (303) 3.4%
SIII (336) 0.0%
● NH4+ Inf ○ NH4
+ Ef ■ NO2‐ Ef NO3
‐ Ef
0
10
20
30
40
50
60
70
0 50 100 150 200 250 300 350 400
mg N/L
Time (d)
Stage II (NaN3 addition) Stage IIIStage I
Selective inhibition of NOB PNComplete nitrification
Long term PN without chemical addition
To succeed the main point is to avoid nitrite oxidizing bacteria (NOB) activity
35
European Patent applied: EP 16 38 2266
Page 36
Partial nitritation by in‐situ FNA accumulation tested with municipal wastewater
Settling Mod. ELAN
Mainstream OM removal
Mainstream N removal
Primary settled wastewater
NH4+
CODNH4
+
NO2‐
NO3‐X
Air
36
Page 37
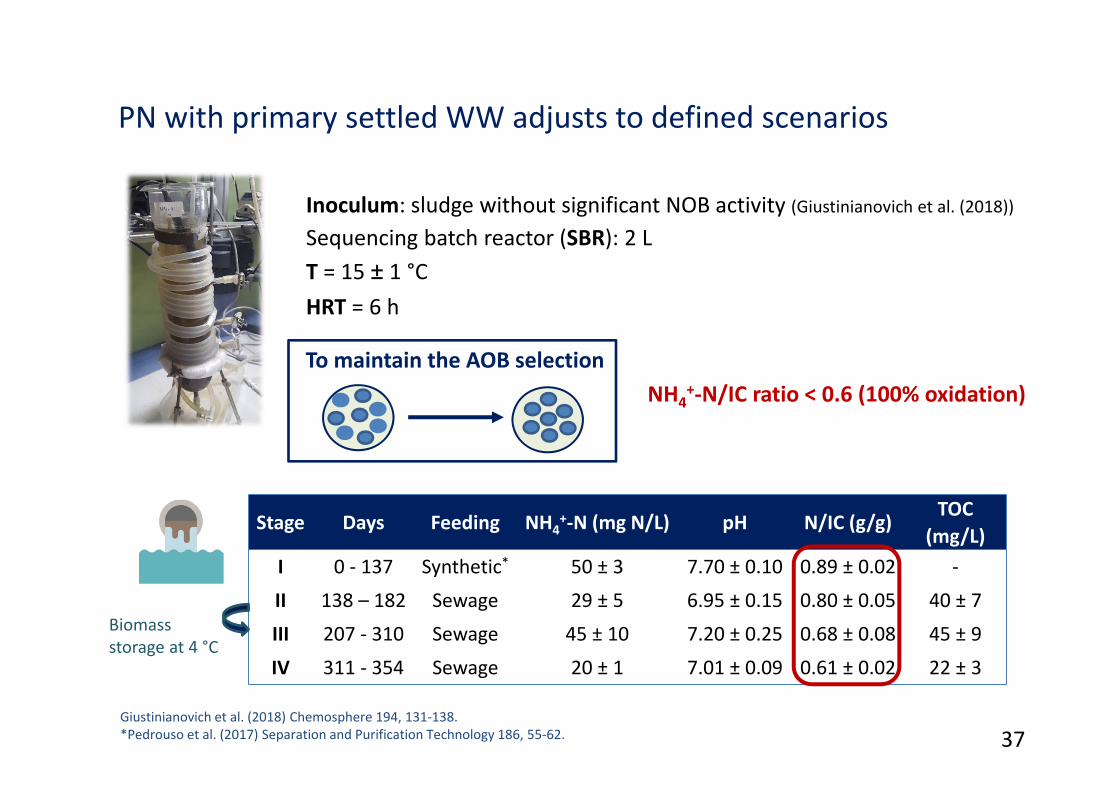
PN with primary settled WW adjusts to defined scenarios
Giustinianovich et al. (2018) Chemosphere 194, 131‐138.*Pedrouso et al. (2017) Separation and Purification Technology 186, 55‐62.
Stage Days Feeding NH4+‐N (mg N/L) pH N/IC (g/g)
TOC (mg/L)
I 0 ‐ 137 Synthetic* 50 ± 3 7.70 ± 0.10 0.89 ± 0.02 ‐
II 138 – 182 Sewage 29 ± 5 6.95 ± 0.15 0.80 ± 0.05 40 ± 7
III 207 ‐ 310 Sewage 45 ± 10 7.20 ± 0.25 0.68 ± 0.08 45 ± 9
IV 311 ‐ 354 Sewage 20 ± 1 7.01 ± 0.09 0.61 ± 0.02 22 ± 3
Biomassstorage at 4 °C
Inoculum: sludge without significant NOB activity (Giustinianovich et al. (2018))
Sequencing batch reactor (SBR): 2 LT = 15 ± 1 °CHRT = 6 h
To maintain the AOB selectionNH4
+‐N/IC ratio < 0.6 (100% oxidation)
37
Page 38
Partial nitritation established and succesfully maintaned by thein‐situ FNA produced
0
10
20
30
40
50
60
0 30 60 90 120 150 180 210 240 270 300 330 360
mg N/L
Time (days)
Stage II Stage III Stage IVStage I
Pedrouso et al. (2018) “Simultaneous partial nitritation and organic matter removal in urban wastewater at low temperature” 4th IWA Specialized International Conference, IWA, Ontario, Canada.
0
10
20
30
40
50
60
0,00
0,04
0,08
0,12
0,16
0,20
0 30 60 90 120 150 180 210 240 270 300 330 360
IC (m
g C/L)
FNA (m
g N/L)
Time (days)
Stage II Stage III Stage IVStage I
NH4+‐N inf
NH4+‐N ef
NO2‐‐N ef
NO3‐‐N ef
NOB suppression
Feeding+aerationSettlingDrawingTime (min) 158 20 2
Feeding 60Aeration 158Settling 20Withdrawal 2
Synthetic feeding Municipal wastewater
38
Page 39
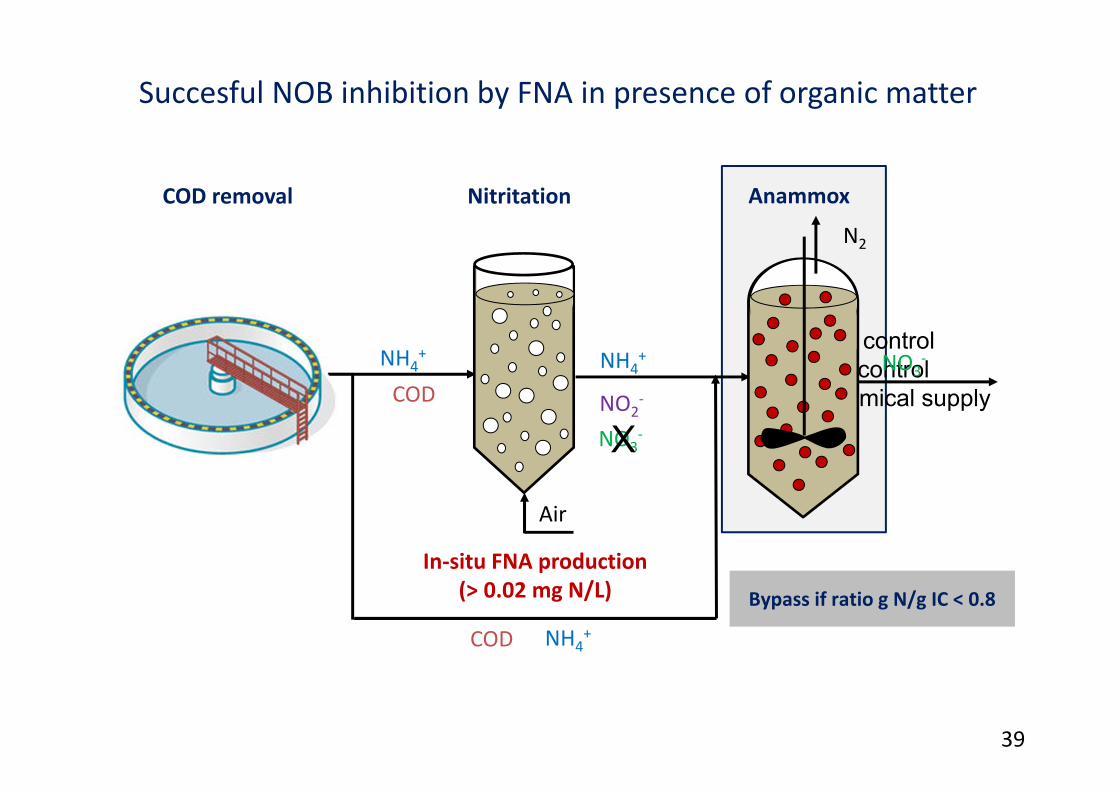
In‐situ FNA production(> 0.02 mg N/L)
NH4+
CODNH4
+
NO2‐
NO3‐X
COD NH4+
Air
COD removal Nitritation
Succesful NOB inhibition by FNA in presence of organic matter
Bypass if ratio g N/g IC < 0.8
No DO control No pH control No chemical supply
N2
NO3‐
Anammox
39
Page 40
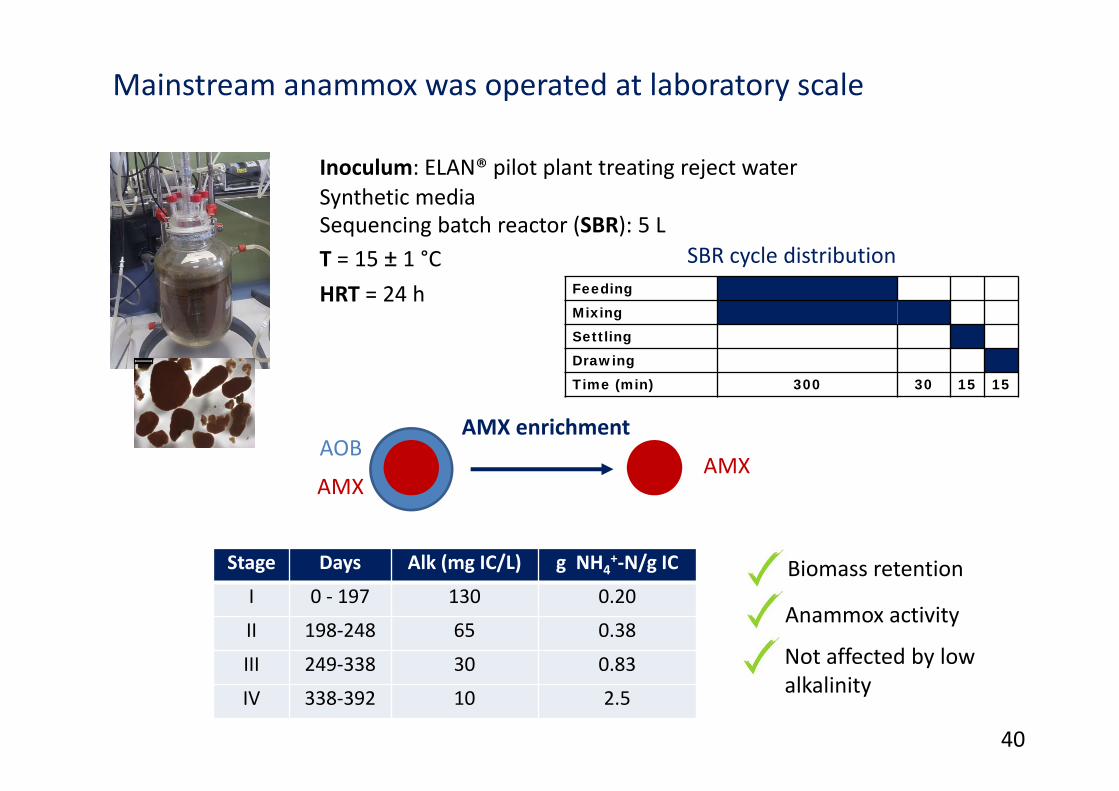
FeedingMixingSettlingDrawingTime (min) 300 30 15 15
Mainstream anammox was operated at laboratory scale
Inoculum: ELAN® pilot plant treating reject water
Sequencing batch reactor (SBR): 5 LT = 15 ± 1 °CHRT = 24 h
SBR cycle distribution
Stage Days Alk (mg IC/L) g NH4+‐N/g IC
I 0 ‐ 197 130 0.20
II 198‐248 65 0.38
III 249‐338 30 0.83
IV 338‐392 10 2.5
AMX enrichmentAOB
AMXAMX
Biomass retention
Anammox activity
Not affected by lowalkalinity
Synthetic media
40
Page 41
Sampling daySAA (30 °C)
(mg N/(g VSS·d))SAA (15 °C)
(mg N/(g VSS·d))0 270 ± 13 53 ± 11
370 200 ± 13 78 ± 8
Anammox activity is not affected by exposure time at lowtemperature
0.00
0.05
0.10
0.15
0.20
0.25
0.30
10 15 20 25 30 35
SAA (g N‐N
2/gVSS∙d)
Temperature (°C)
InoculumDay 350
Day 0
Day 370
Biomass retention
Anammox activity
Not affected by lowalkalinity
Nitrogen removal efficiency
41
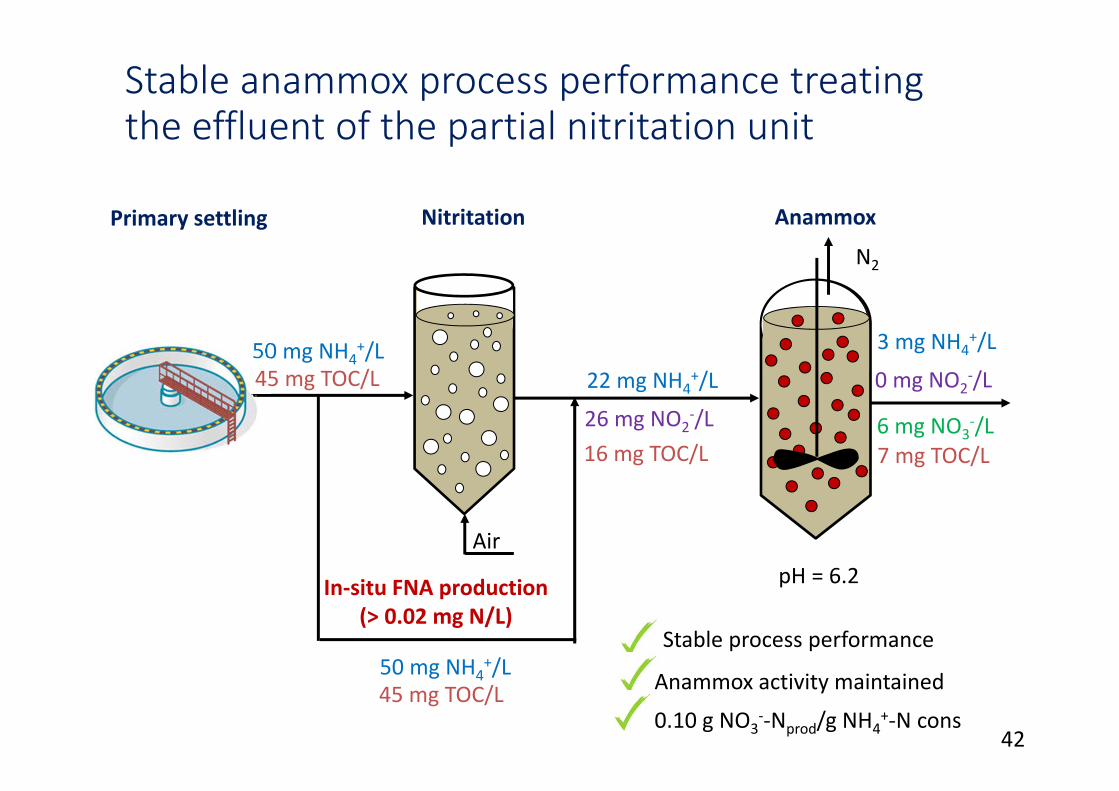
Page 42
In‐situ FNA production(> 0.02 mg N/L)
50 mg NH4+/L
22 mg NH4+/L
26 mg NO2‐/L
Stable anammox process performance treating the effluent of the partial nitritation unit
N2
Air
6 mg NO3‐/L
Primary settling Nitritation Anammox
45 mg TOC/L
50 mg NH4+/L
45 mg TOC/L
pH = 6.2
16 mg TOC/L
3 mg NH4+/L
0 mg NO2‐/L
7 mg TOC/L
Stable process performance
Anammox activity maintained
0.10 g NO3‐‐Nprod/g NH4
+‐N cons42
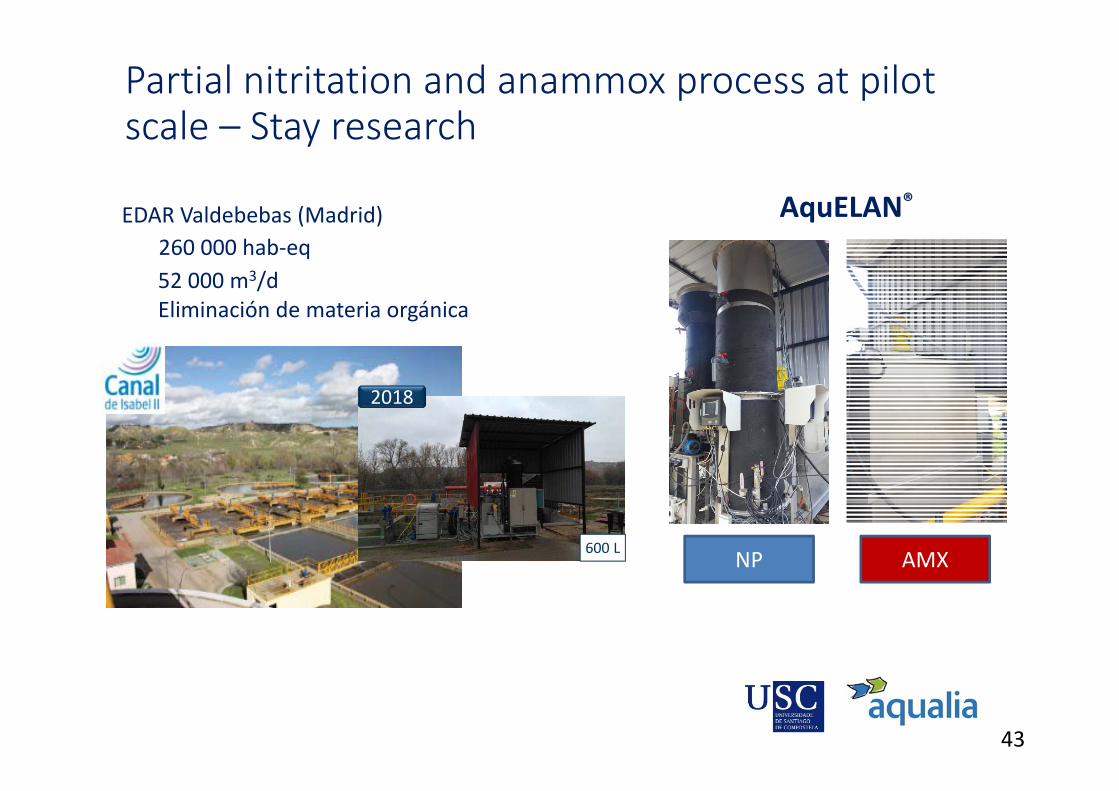
Page 43
EDAR Valdebebas (Madrid)260 000 hab‐eq52 000 m3/dEliminación de materia orgánica
2018
600 L NP AMX
AquELAN®
Partial nitritation and anammox process at pilot scale – Stay research
43
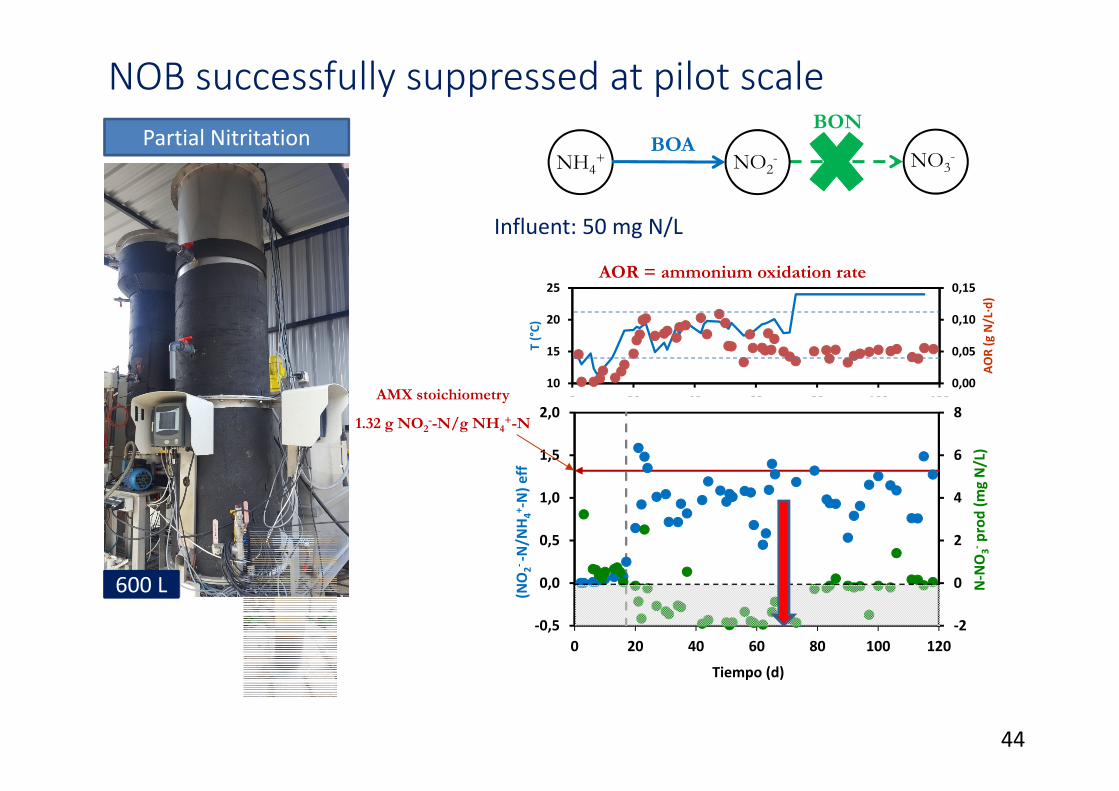
Page 44
Partial Nitritation
NOB successfully suppressed at pilot scale
600 L
Influent: 50 mg N/L
0,00
0,05
0,10
0,15
10
15
20
25
0 20 40 60 80 100 120
AOR (g N/L∙d)
T (°C)
AOR = ammonium oxidation rate
‐2
0
2
4
6
8
‐0,5
0,0
0,5
1,0
1,5
2,0
0 20 40 60 80 100 120
N‐NO
3‐prod
(mg N/L)
(NO
2‐ ‐N/N
H4+ ‐N) e
ff
Tiempo (d)
AMX stoichiometry
1.32 g NO2--N/g NH4
+-N
BONBOA
NH4+ NO2- NO3-
44
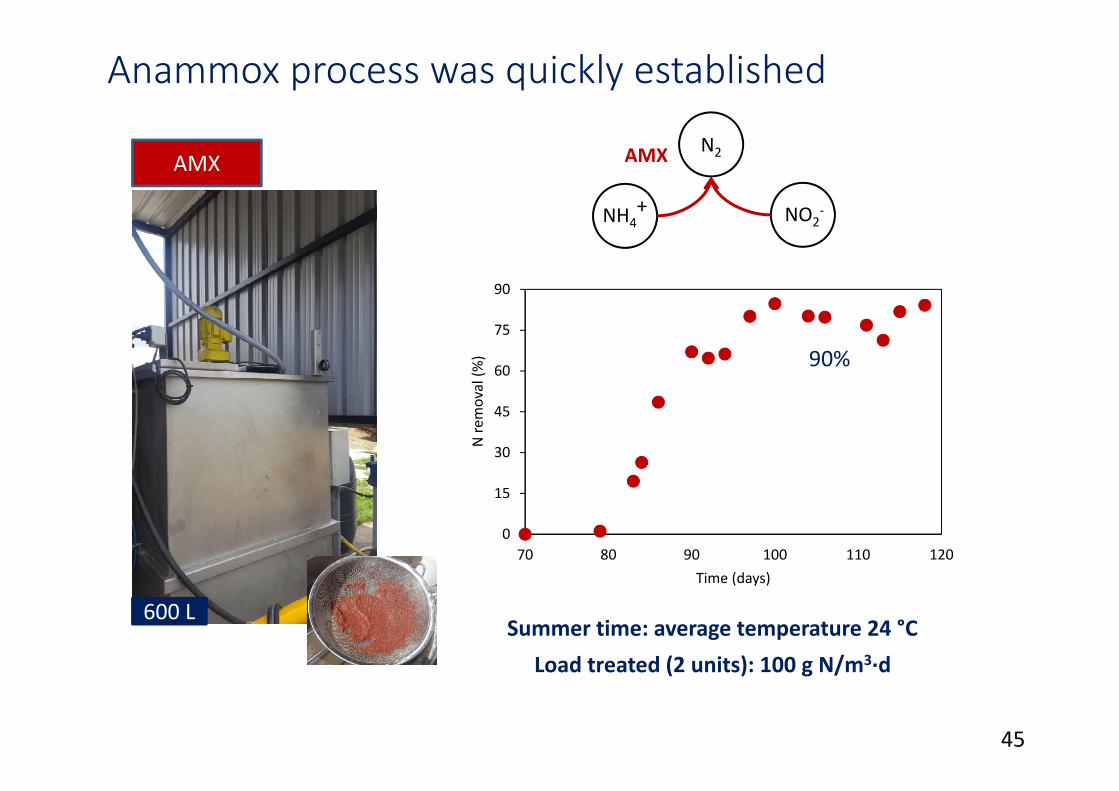
Page 45
AMX
Anammox process was quickly established
600 L
0
15
30
45
60
75
90
70 80 90 100 110 120
N re
moval(%
)
Time (days)
90%
Summer time: average temperature 24 °C
AMX N2
NH4+ NO2
‐
Load treated (2 units): 100 g N/m3∙d
45
Page 46
Case NH4+‐N/IC ratio(g N/g C)
Stream to PN unit (%)
Ammonia oxidized to nitrite (%) Action required
A >1.0 100 50 Alkalinity supply
B 0.8‐1.0 100 50 None
C 0.6‐0.8 50‐100 50‐100 Bypass to anammox unit
D <0.6 50 100 Bypass and pH control
AquELAN®NH4
+‐N/IC ratio NH4+‐N/NO2
‐‐NpH controlPN bypass to anammox unit
Variable nitrite conversions are possible depending on the wastewater characteristics
Bypass
Nitritation Anammox
NH4+ NH4
+
NO2‐
N2
46
Page 47
Acknowledgements
• Improved control and application of nitrogen cycle bacteria forammonia removal from wastewater (ICON). EuropeanCommission (EESD) (EVK1‐CT‐2000‐00054). 01/02/2001 ‐31/01/2004.
• Development of biological reactors for the ANaerobicAMMonium OXidation (OXANAMON). Ministery of Science andTechnology (PPQ2002‐00771). 01/11/2002 ‐ 31/10/2005.
• Development of clean technologies for the optimization of thedesign and operation of WWTPs. Galician Government.08/08/2010‐30/09/2013.
• ITACA project funded by the Spanish Ministry of Economythrough the CDTI INNPRONTA program (2011/CE25).
• Competitive reference group (GRC 2013‐032) funded by FEDER.
• Pioneer_STP ‐ The Potential of Innovative Technologies toImprove Sustainability of Sewage Treatment Plants (PCIN‐2015‐22(MINECO) / ID199 (WaterJPI)). April 2016 ‐May 2019
47
Page 48
The performance of PN‐AMX processes needs to be assessed for each type of wastewater
[email protected]
A. Mosquera Corral1, A. Val del Río 1, A. Pedrouso 1, J.L. Campos 1, R. Méndez 1
J.R. Vázquez‐Padín2, N. Morales2, R. Fernández‐González2
1Department of Chemical Engineering, School of Engineering, University of Santiago de Compostela, Spain
2Aqualia (FCC Group), Guillarei WWTP, Pontevedra, Spain48
Page 49
Over 100 full scale anammox based plants in the world
Mao N., Ren H., Gen J., Ding L., Xu K. (2017) World J Microbiol Biotechnol, 33:153.
Germany Netherlands China Switzerland USA
Finland Spain UK Others