Agronomía Costarricense 28(2): 37-51. 2004 PROGENY TESTANALYSIS AND POPULATION DIFFERENTIATION OF MESOAMERICAN MAHOGANY (Swietenia macrophylla) Carlos Navarro 1/* , Gustavo Hernández * Palabras clave: Swietenia macrophylla, heredabilidad, fitomejoramiento, evaluación de progenies, poblaciones naturales. Keywords: Swietenia macrophylla, heritability, tree improvement, progeny test, natural populations. Recibido: 07/01/04 Aceptado: 29/09/04 ABSTRACT The performance of open-pollinated single tree families of mahogany Swietenia macrophylla from populations in Mesoamerica was evaluated in 3 trials established in northern Costa Rica. The trials at Upala and Lagartera (Los Chiles) contain families of Costa Rican origin, while the Laberinto (Los Chiles) trial contains material from 6 Central American countries and Mexico. Data on root-collar diameter, total height, survival, and Hypsipyla grandella attack were collected. The analysis indicate significant family and population differences for height and diameter, but H. grandella attacks were uniform over all sites. Heritabilities at 1.7 years for Upala were 0.54±0.02, and 0.55±0.02 for diameter and height, respectively; after this measurement this trial was burned completely as a result of drought in El Niño year, so further measurements could not be made. Lagartera at 0.7 years presented heritabilities for diameter and height of 0.55±0.008 and 0.57±0.008. Laberinto presented heritabilities of 0.48±0.01 for diameter (2.9 years), 0.6±0.01 for height, 0.1±0.002 for H. grandella attack; 0.07±0.002 for number of shoots, and 0.18±0.003 for stem form 2.7 years RESUMEN Análisis de experimentos de progenies (familias) de una colección Mesoamericana de caoba (Swietenia macrophylla). El desarrollo de progenies de árboles madre de polinización abier- ta de caoba, Swietenia macrophylla, fue evaluado en 3 ensayos establecidos en la Zona Norte de Costa Rica. Los de Upala y Lagartera (Los Chi- les) incluyen familias originarias de Costa Rica, mientras que el de Laberinto (Los Chiles) presen- ta material de 6 países centroamericanos y Méxi- co. Se recolectó información sobre diámetro a la base, altura total, sobrevivencia, y ataque de Hypsipyla grandella. Los análisis indican dife- rencias significativas a nivel de progenie y proce- dencias para diámetro y altura, pero el ataque de H. grandella fue uniforme en todos los sitios. Las heredabilidades a los 1,7 años para Upala fueron de 0,54±0,02 y 0,55±0,02 para diámetro y altura respectivamente. Después de esta medición el en- sayo se quemó por completo, debido a sequías ba- jo el efecto de El Niño, razón por la cual no pu- dieron efectuarse mediciones posteriores. El ensayo en Lagartera, de 0,7 años, presentó here- dabilidades para diámetro y altura de 0,55±0,008 y 0,57±0,008. En Laberinto, las heredabilidades obtenidas fueron de 0,48±0,01 para diámetro (2,9 1/ Autor para correspondencia. Correo electrónico: [email protected]* Tropical Agricultural Research and Higher Educa- tion Center (CATIE), Turrialba, Costa Rica.
Transcript
Agronomía Costarricense 28(2): 37-51. 2004
PROGENY TEST ANALYSIS AND POPULATION DIFFERENTIATION OF MESOAMERICAN MAHOGANY (Swietenia macrophylla)
Keywords: Swietenia macrophylla, heritability, tree improvement, progeny test, natural populations.
Recibido: 07/01/04 Aceptado: 29/09/04
ABSTRACT
The performance of open-pollinatedsingle tree families of mahogany Swieteniamacrophylla from populations in Mesoamericawas evaluated in 3 trials established in northernCosta Rica. The trials at Upala and Lagartera(Los Chiles) contain families of Costa Ricanorigin, while the Laberinto (Los Chiles) trialcontains material from 6 Central Americancountries and Mexico. Data on root-collardiameter, total height, survival, and Hypsipylagrandella attack were collected. The analysisindicate significant family and populationdifferences for height and diameter, but H.grandella attacks were uniform over all sites.Heritabilities at 1.7 years for Upala were0.54±0.02, and 0.55±0.02 for diameter andheight, respectively; after this measurement thistrial was burned completely as a result of droughtin El Niño year, so further measurements couldnot be made. Lagartera at 0.7 years presentedheritabilities for diameter and height of0.55±0.008 and 0.57±0.008. Laberinto presentedheritabilities of 0.48±0.01 for diameter (2.9years), 0.6±0.01 for height, 0.1±0.002 for H.grandella attack; 0.07±0.002 for number ofshoots, and 0.18±0.003 for stem form 2.7 years
RESUMEN
Análisis de experimentos de progenies(familias) de una colección Mesoamericana decaoba (Swietenia macrophylla). El desarrollo deprogenies de árboles madre de polinización abier-ta de caoba, Swietenia macrophylla, fue evaluadoen 3 ensayos establecidos en la Zona Norte deCosta Rica. Los de Upala y Lagartera (Los Chi-les) incluyen familias originarias de Costa Rica,mientras que el de Laberinto (Los Chiles) presen-ta material de 6 países centroamericanos y Méxi-co. Se recolectó información sobre diámetro a labase, altura total, sobrevivencia, y ataque deHypsipyla grandella. Los análisis indican dife-rencias significativas a nivel de progenie y proce-dencias para diámetro y altura, pero el ataque deH. grandella fue uniforme en todos los sitios. Lasheredabilidades a los 1,7 años para Upala fueronde 0,54±0,02 y 0,55±0,02 para diámetro y alturarespectivamente. Después de esta medición el en-sayo se quemó por completo, debido a sequías ba-jo el efecto de El Niño, razón por la cual no pu-dieron efectuarse mediciones posteriores. Elensayo en Lagartera, de 0,7 años, presentó here-dabilidades para diámetro y altura de 0,55±0,008y 0,57±0,008. En Laberinto, las heredabilidadesobtenidas fueron de 0,48±0,01 para diámetro (2,9
* Tropical Agricultural Research and Higher Educa-tion Center (CATIE), Turrialba, Costa Rica.
AGRONOMÍA COSTARRICENSE38
INTRODUCTION
Swietenia macrophylla is an importanttree species in the neotropics, it is found in therainforests between latitudes of 22o North and20o South of the Equator. Graham (1999)indicates that pollen from an ancestor of theMeliaceae family was present in the Pliocene andMiocene in Mexico, which led us to believe thatthe species was present there many years ago.
In Meliaceae, Swietenia is the mostimportant genus for wood production followed byCedrela. Beginning in the 19th century and untilnow, the mahoganies have been the pillar of theforest industry of Meso and South America. Theycover the neotropical territory from Mexico toBrazil and Argentina, and the Caribbean Islands.
During the last decades, the Swietenianatural populations have been severely affectedand reduced by several factors, mainly due todeforestation processes that diminish populationsas well as selective logging that affects thegenetic makeup of populations.
The Mexican and Central Americanpopulations have been heavily exploited
(Matamoros and Seal 1996), while currentlogging of natural populations for theinternational market occurs in Brazil and Bolivia.
These tree species present a lowproportion of adult trees, which joined with a lownatural regeneration rate, increase their rareness.
The extensive harvest of S. macrophyllafor its valuable wood has resulted in highconcern over its conservation status andsustainable use (Proposed Amendment to CITESAppendix II 1997), and a strong focus of currentresearch on these topics (Negreros and Mize1994, Gullison et al. 1996, Snook 2003, Navarroet al. 2003). The FAO is establishing a networkto facilitate the genetic conservation of S.macrophylla, and other species of the Meliaceaefamily (Patiño 1997). S. mahagoni has alreadybeen heavily exploited, and both S. mahagoniand S. humilis were listed under Appendix II ofCITES in 1992 (Patiño 1997).
In 1994, CATIE and ITE (Institute ofTerrestrial Ecology) together with otherinstitutions and the European Union support,made a collection of mahogany germplasm inseven Mesoamerican countries. With this
after planting. Flooding in 1998 damaged theLagartera trial, which was also severely attackedby H. grandella. This resulted in very lowheritabilities, with large standard errors;therefore its genetic values in the firstmeasurement are considered unreliable. Theplantation recovered, and after 3 years geneticvalues were comparable with the other 2 trials.Isolated mother trees produced slow-growingfamilies in most cases, in comparison with theclustered ones or those in natural dense forests,suggesting inbreeding mechanisms.
años), 0,6 ± 0,01 para altura, 0,1±0,002 para elataque de H. grandella; 0,07±0,002 para númerode ejes, y 0,18±0,003 para la forma a los 2,7 añosde plantado. Las inundaciones en 1998 dañaronel ensayo de Lagartera, que además fue severa-mente atacado por H. grandella. Esto se manifes-tó en heredabilidades muy bajas con errores es-tándar altos, por lo tanto los valores genéticos enla primera medición se consideran poco confia-bles. La plantación se recuperó y después de 3años los valores genéticos fueron comparablescon los otros 2 ensayos. En general, los árbolesmadre que estaban solitarios, produjeron proge-nies de crecimiento lento, en comparación conlas progenies de árboles madre que estaban engrupos o en bosque natural, lo que sugiere meca-nismos de endogamia.
NAVARRO Y HERNÁNDEZ: Population differentiation of Mahogany 39
material studies of genetic variation were done,gene banks and progeny trials in Costa Rica andMexico were established. This work have beendone considering the importance of using bothmolecular and quantitative markers for geneconservation and breeding.
This paper investigates three major aspects:(1) The genetic variation throughout Mesoamericanpopulations and families of Swietenia macrophylla;(2) The growth variation in families and populationsof mahogany; (3) The influence of collectingisolated trees in their progeny performance.
The shootborer Hypsipyla grandella is aLepidopteran that co-evolved with some Meliaceaespecies; it attacks preferentially; Swietenia,Cedrela and Carapa. Therefore, the adaptation ofdifferent Swietenia populations to the shootborerattack was also studied in these experiments.
MATERIALS AND METHODS
Collection
Field collection of leaves, herbariummaterial and seeds from natural Swieteniapopulations were carried on. The populationssampled covered a wide range of environments,population densities and degrees of exploitation.
Prior to collection, general informationwas sought on: (1) climatic data - includingtopography, geology, soil, vegetation, land use;and (2) socio-economic data - includingpopulation, agricultural surveys, economicindicators, and information on the infrastructure,roads and other means of transportation.
This information was used to:
● Define eco-geographically distinct areasin the distribution of the species forsampling;
● Estimate the likely extent of within-speciesvariation, based on the heterogeneity in itsnatural distribution area;
● Assess the threat of genetic erosion; and● Predict the best timing for collecting.
Information concerning the human andphysical environment was also useful for field
orientation and for thorough documentation ofthe collecting mission.
Collections were made from 42 differentmahogany populations, ranging from Mexico toPanama. The number of trees sampled withinpopulations varied according to its size andaccessibility. Populations in each country werelocated using the expertise of local collaboratorsand previous reconnaissance. The approximateextent of each population was gauged asobjectively as possible.
Trees were sampled along a transect, theinitial bearing was randomly selected. Mahoganytrees were either solitary or clumped. When treeswere clumped, collections were restricted toindividual trees more than 100 m apart. To obtainmaximum diversity and avoid seeds from relatedtrees, only five individual trees per clump werecollected. Up to a maximum of 50 trees werecollected within each population along thetransect. Only mature trees were selected. Insome cases, populations were so sparse that onlysolitary trees could be collected.
Herbarium material was dried andmounted at CATIE’s herbarium, and seeds weredried and stored at the CATIE seed bank.
Table 1 and figure 1 show the sites ofcollections in Central America and Mexico.This is the most extensive single-treecollection of mahogany that has been made inthis area. The Institute of Tropical Forestry inPuerto Rico made an earlier provenancecollection of S. macrophylla in 1964 and 1965.At that time, 14 provenances were collected inMexico and Central America (Boone andChudnoff 1970).
Field trials
To observe variation in the quantitativegenetic parameters, 3 of the 6 measurements(before and after the strong attack of Hypsipylagrandella) are presented in this article. Detailsabout experimental design and dates ofmeasurement are shown in table 2.
In the first measurement, root collardiameter, total height, and H. grandella attackwere analyzed, while variables of stem formand attack response were added in the last one.
AGRONOMÍA COSTARRICENSE40
Table 1. Populations of Swietenia macrophylla sampled in Central America and Mexico. Latitude and longitude are given in
decimal degrees.
Country Population Latitude (N) Longitude (W) Altitude (masl) No. trees sampled
Costa Rica Marabamba, Los Chiles 10.94656 84.63752 45 67
Caño Negro, Los Chiles 10.91774 84.42994 55 37
Santa Cecilia, La Cruz 11.06101 85.27857 300 12
Upala, Alajuela 10.53508 85.08336 50 13
Pocosol, Liberia 10.53364 85.35957 270 37
Playuelas, Los Chiles 10.92175 84.69872 35 4
San Emilio, Los Chiles 10.97147 84.77328 30 64
Abangares, Guanacaste 10.06600 84.49641 50 6
Orotina, Alajuela 9.55140 84.29620 250 1
Turrubares, Alajuela 9.51212 84.31335 350 1
Chapernal, Puntarenas 10.07469 84.82586 50 10
Panama Quintín, Darien 8.22469 78.08581 70 10
Punta Alegre, Darien 8.26119 78.23616 10 5
Tonosí, Los Santos 7.44882 80.29070 100 15
Gatún, Gatún 9.26800 79.91958 20 4
Paraíso, Paraíso 9.03278 79.62656 50 1
Balboa, Ancon 8.95500 79.95430 50 1
Summit, Ancon 9.06489 79.64622 50 3
Calabacito, Veraguas 8.24636 81.08095 50 1
Coiba, Veraguas 7.50102 81.69603 10 1
Cerro Hoya 7.32321 80.59560 500 23
Total 782
NAVARRO Y HERNÁNDEZ: Population differentiation of Mahogany 41
The experiments were measured for total height(cm) from the ground to the terminal shoot,diameter was measured at the root collar and theattack of H. grandella was taken as a discretevariable indicating presence or absence of attack.
The trials were established at three sites innorthern Costa Rica. Trials at Lagartera and Upala(Table 3) contain Costa Rican families. The trial at
Laberinto, established 1 year later, containspopulations from Central America and Mexico(Table 4). Laberinto has some populations incommon with trials at Lagartera and Upala.
For the measurements taken during 2000and 2001, only the trials at Laberinto andLagartera were evaluated, and the new variableswere evaluated as:
Fig. 1. Mesoamerican distribution of the populations planted in the trials of Swietenia macrophylla.
Table 2. Field trials data.
Trial Location Experimental design Planting date Date of Spacing (m)(GPS) measurements in
days after planting
Upala 10.53409 N, 15 blocks, 31 families, 2 trees 12th June 1996 621 3 X 385.02287 W per plot, in lines with
Calophyllum brasilienseLagartera, 10.58853 N, 15 blocks with 31 families and 19th July 1996 585, 1658, 1812* 3 X 3Los Chiles 84.43002 W 3 trees per plot.Laberinto, 10.94774 N, 15 blocks with 91 families and 14th June 1997 251, 979, 1054*, 1327 3 X 3Los Chiles 84.70994 W 2 trees per plot.
● Response to the attack:1 = One shoot after the attack2 = Two shoots (bifurcation) after the attack3 = Three shoots after the attack4 = Four or more shoots after the attack5 = Bad stem form by other damages
For both measurements the variableisolation (solitary) of the mother tree was added,considering : 1. Isolated mother tree (no othertrees of the same species) at a distance of lessthan 500 m; 2. Semi-isolated (other trees nocloser than 100 m); and 3. Mother tree in clustersor associated with more than 2 trees in a radius ofless than 100 m. This variable was analyzed withorthogonal contrasts, analysis of variance andTukey means comparisons.
We examined a total of 92 families from 7populations: Mexico, Guatemala, Belize,Honduras, Nicaragua, Costa Rica and Panama.
The 3 field trials are all in the life zonereferred to by Holdridge (1967) as Tropical
Moist Forest with climatic association. This lifezone is characterized by having a biotemperaturebetween 24 and 25°C and around 2500 mm ofannual rainfall with a dry period ofapproximately 3 months.
The Laberinto trial was established innorthern of Costa Rica in soils classified byPerez et al. (1978), as belonging to the TypicTropaquept family fine silty isohyperther-mic. These gley and humic gley soils arefound in drained alluvial valleys, and showlittle evolution and presence of organicaccumulations on the surface. Thetopography is flat in all sites.
The Lagartera trial is found on fine clayisohyperthermic soils of the Aquic Distropeptfamily. These soils, characteristic of old terraceswith little evolution, tend to be slightly acid, andthe high clay content may cause drainageproblems.
The Upala trial is located on fine clayisohyperthermic, reddish soils of the OxicDystropept family. Such soils are deep, butlow in bases and associated with poordrainage.
Table 3. Costa Rican families planted in trials at Lagartera (Los Chiles) and Upala.
Population Nº mother trees (Family) Latitude (GPS) Longitude (GPS)
Caño Negro I 643, 644,645, 646, 647, 648, 649, 650 10.94774 84.70994Caño Negro II 651 10.94705 84.72119Caño Negro III 652 10.94646 84.72319Caño Negro IV 653 10.94774 84.70994Playuelas I 658 10.91815 84.69996Playuelas II 660 10.92770 84.68567Playuelas III 661 10.92635 84.68893Marabamba I 665* 10.95426 84.65771Marabamba II 668, 673, 674,6 76 10.95426 84.65771Marabamba III 680, 681 682 10.95403 84.65751Marabamba IV 683 10.97844 84.70361San Emilio I 684, 685, 686, 687,688, 689 10.97235 84.77287San Emilio II 690 10.95402 84.77411San Emilio III 691 10.53615 84.47122San Emilio IV 692 10.58191 84.46671San Emilio V 693 10.95971 84.77346
* Family 65 was planted only at Lagartera. Roman population numbers indicate different grouping of trees within thecollection transect.
NAVARRO Y HERNÁNDEZ: Population differentiation of Mahogany 43
Experimental design
A randomized block design was appliedin all trials. Two tree family plots were plantedat 3x3 m with 2 guard rows around the wholetrial. In Upala trees were interplanted in lineswith Calophyllum brasiliense at a 3x3 mspacing. Only Lagartera have 3 trees per family
plots, details like number of families per block,families by site and blocks by site are describedin table 2.
Preparation of the area involvedplowing and raking the soil previousplantation. The plots were maintained withmachete use and the herbicide Roundup(glyphosate).
Table 4. Families planted in trial at Laberinto, Los Chiles, Costa Rica.
Country Population Number of Family Latitude Longitude Precipitation Temperature DryGPS GPS (mm) (°C) months
MEXICO San Felipe 11, 15, 16, 116 18.74599 88.3548 1300 25 4MEXICO Nuevo Becal I 121, 122, 125, 126, 129 18.80756 89.32721 1200 26 4MEXICO Nuevo Becal II 156, 157,159,160 18.80756 89.32721 1200 24 4MEXICO Naranjal 132, 133, 136, 141 19.35549 88.46355 1200 24 4MEXICO Madrazo 152, 153, 155 19.45218 88.44468 2000 26 4BELICE Las Cuevas I 22 16.7518 89.00106 2900 22 3BELICE Las Cuevas II 257 16.42754 88.58995 2900 22 3GUATEMALA Bethel 32, 326, 331, 343 16.4835 90.50282 1800 25 4GUATEMALA Bio-Itza 396 16.85234 90.93113 1955 28 5GUATEMALA Tikal I 3101 16.85009 90.9316 1955 28 5GUATEMALA Tikal II 3131, 3151, 3153 17.22520 89.61216 1955 28 5HONDURAS Lancetilla 427, 432, 434, 435, 436, 438, 15.73991 85.45721 3278 25 3
Yijk is the phenotypic value of the kth tree of the jthfamily in the ith block;
µ = population mean;Pj = effect of the jth family; Bi = effect of ith block
BPij is the interaction of ith block with the family j.Blocks and families are considered as randomeffects.
Thus, one may expect different familystructures of the seeds from open-pollinatedcollections, sometimes self-pollinated due toisolation. Therefore, families of single mother-trees may be half-sibs, full-sibs or selfings.
The procedure (proc) in SAS forevaluating the last 2 measurements was:
proc glm;class evaluation block population family;model diameter height attack respatack form = eval block population family(population) population*block eval*population*family family*eval(population);means population;means population/Tukey lines;where eval is evaluation number and respattack is response to H. grandella attack.
The proc for the evaluation of the mother tree isolation for both the statement Contrast of GLMand Tukey means comparison was the following:
proc glm;class block mothertree;model diameter height attack shoots form =block mothertree;means mothertree/Tukey lines;contrast ‘1 vs 2y3’ mothertree 2 -1 -1;contrast ‘2 vs 3’ mothertree 0 -1 -1;
The following parameters for growth inheight and diameter were estimated based onindividual mother trees: the additive geneticvariance σ2
A = 4 σ2F, where σ2
F is the variancecomponent due to open-pollinated families; thenarrow-sense heritability on an individual treebasis h2 = σ2
A / (σ2F + σ2
BXF +σ2E), where σ2
E isthe residual variance. The standard errors forheritability were calculated following theformula by Dieters et al. (1995). The additivegenetic coefficient of variation AGCV=100(σA/x), where x is the population mean.
Coefficient of population differentiation wascalculated according to Kremer et al. (1997).
RESULTS AND DISCUSSION
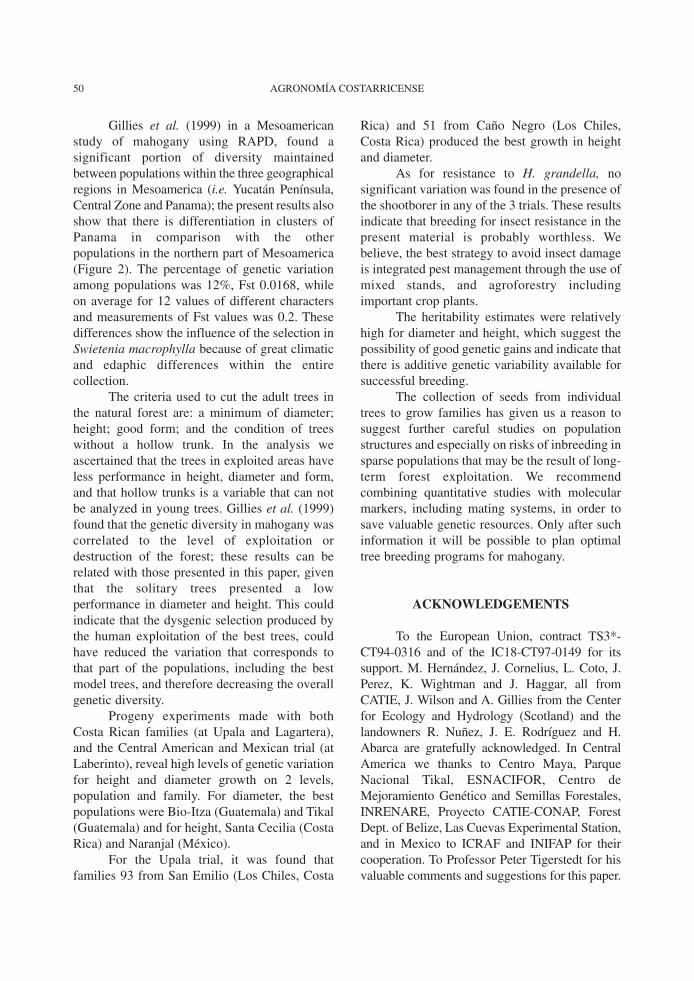
Highly significant differences betweenfamilies and populations for the variables heightand diameter were found in the Laberinto trial(P<0.0001), (Tables 5 and 6). Differentiation ofthe populations is shown in the cluster of figure2, a clear bifurcation between populations of
NAVARRO Y HERNÁNDEZ: Population differentiation of Mahogany 45
Costa Rica and Panama and the rest ofMesoamerica shows the genetic structuring ofthe species, these results are comparable with theones obtained using molecular markers byGillies et al. (1999). The attack by H. grandellashowed no significant differences amongfamilies in the Laberinto trial. In table 5 variance
components indicate differences among andwithin populations. At 251 days measurementvariation within populations was greater thanvariation among populations, but formeasurements at 979, 1054 and 1327 days, thatcondition changed, showing more variationamong populations than within populations.
Table 5. Variance components and significancies at Laberinto trial (Los Chiles, Costa Rica).
Variables Effect Block Pop Fam BlockPop Error Among Within Qst(Pop) pops pops
Variation between different years ofmeasurement was found for the coefficient ofpopulation differentiation (Qst) at 251 days andthe other measurements. Also maternal effectspossibly are affecting Qst values for themeasurement at 251 days, where there is nodifferentiation for populations. From the resultsand comparison of means, it can be seen thatpopulations show a variation between the bestand the lowest population of approximately 30%and 21%, in diameter and height, respectively. Atthe family level, the variation for diameter was125% between the highest and lowest family,while for height, the variation was 130%. Thefact that there is more variation within than
among populations has very importantimplications for gene conservation and breeding,as it suggests that local breeding activities wouldhave high possibilities of securing substantialgenetic gains.
Table 6 shows the heritabilities obtainedfor diameter and height at the Laberinto trial(0.55 and 0.57, respectively), and the additivegenetic coefficient of variation (AGCV) with13% for diameter and 14% for height. Pruningwas applied to the experiment immediately afterthe measurement for the year 2000. Ourheritability estimates are high in comparisonwith the ones shown by Cornelius (1994), whoobtained mean heritabilities of 0.28 for heightand 0.23 for diameter in a total of 67 studies,mainly with pines. For AGCV, Cornelius (1994)obtained a range of 5 to 15%; therefore, thepresent study suggests high levels of additivegenetic variation for height and diameter.
The heritability in the production of shootsafter attack by H. grandella is larger in year2000, mainly because before that year trials weremaintained without sanitary pruning. After themeasurement of the year 2000, trees attacked byH. grandella were pruned, reducing the numberof shoots.
In the measurement at 251 days atLaberinto, families 721 and 444 from Panamaand Honduras, respectively, presented the bestdiameter increment (27 mm). Families 444 and564 (Nicaragua) excelled in height (130 cm);these results were obtained using themeasurements at 118 days as co-variables toeliminate the nursery or maternal effects in theANOVA shown in table 7.
The best (721) and the worst (528)families differed by 127% in collar diameter. Forheight, the range from best (444) to worst (726)was 131%.
The Gatun (Panamá), Comayagua(Honduras) and Coiba (Panamá) populationsshowed the lowest performance, being inferiorby 30% in diameter and 52% in height, comparedto the best performers Bio-Itza and Santa Cecilia.It can be observed that variation amongpopulations were lower than among familieswithin locations. The trees from Bio-Itza
AGRONOMÍA COSTARRICENSE46
Fig. 2. Cluster for Swietenia macrophylla populations inMesoamerica. Laberinto site (Los Chiles, CostaRica) at 3.65 years.
2.5 2.0 1.5 1.0 0.5 0.0
Santa CeciliaNaranjalMarabambaBio-ItzaSan FelipeMukuwasLancetillaSan EmilioMadrazoTikalNuevo BecalLas CuevasBethelPunta AlegrePocosolGatúnComayaguaCoibaQuintinTonosiParaísoCaño NegroUpalaChapernalAbangares
McQuitty’s Similarty
popu
latio
n
(Guatemala), Tikal (Guatemala), Santa Cecilia(Costa Rica), Marabamba (Costa Rica) andNaranjal (México) came from natural standscomposed by large populations; this is reflectedin the superior performance of their families (381cm of height and 77 mm of diameter in averagefor the five populations at 3.6 years).
Table 8 shows the analysis of variancefor the family trial in Upala. As in the othertrials, significant differences were found(P>0.0001) in diameter and height but not forthe variable Hypsipyla attack. The growth ofmahogany is overwhelming in this location(growth can be considered fast when root collardiameter increases by 2 cm per year and heightmore than 1 m per year). Mahogany registered
more than 100% superiority in heightincrement to Calophyllum brasiliense. Thisreflects the different ecological behavior of thetwo species, mahogany being a light tolerantpioneer while Calophyllum is a shade tolerantclimax species.
The individual narrow sense heritabilityestimates, for diameter and height, were 0.54 and0.55, respectively in Upala trial.
The family with the best growth was No. 93from San Emilio (see Table 3 for details), animportant area of natural forest in northern CostaRica. This family was superior by 45% to family76 from Marabamba. Family 93 was 50% superiorin diameter and height, compared to family 45 ofCaño Negro (Costa Rica). These data show that
NAVARRO Y HERNÁNDEZ: Population differentiation of Mahogany 47
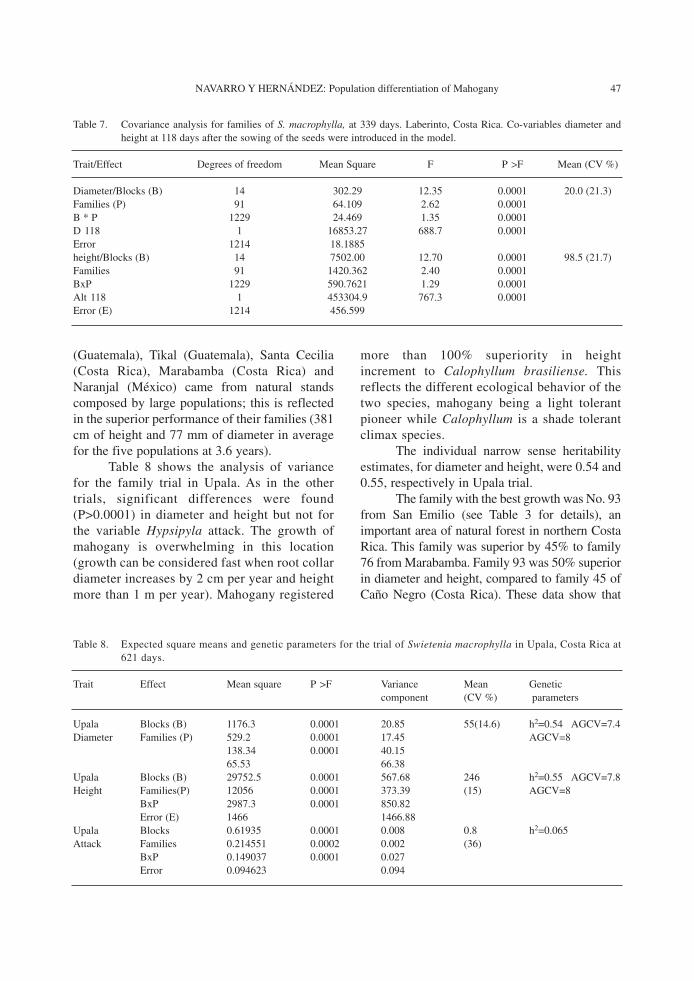
Table 8. Expected square means and genetic parameters for the trial of Swietenia macrophylla in Upala, Costa Rica at621 days.
Trait Effect Mean square P >F Variance Mean Geneticcomponent (CV %) parameters
Table 7. Covariance analysis for families of S. macrophylla, at 339 days. Laberinto, Costa Rica. Co-variables diameter andheight at 118 days after the sowing of the seeds were introduced in the model.
Trait/Effect Degrees of freedom Mean Square F P >F Mean (CV %)
local material of northern Costa Rica containenough variation for an improvement program.
Table 9 shows the results of the Lagarteratrial where flooding affected some blocks in thetest. The effect of families was not significant fordiameter but significant for the variables heightand Hypsipyla attack (P>0.01).
Lagartera at 1812 days (4.6 years) had adiameter average of 68 mm and a coefficient ofvariation (CV) of 21%. Diameter differenceswere significant to Pr > F =0.0017.
The family 50 had the best diameter (78.8mm), and the lowest performance was for family68 with a diameter of 49.2 mm. The variableheight registered an average of 306 cm, while theCV was 31% (Pr > F =0.0262). Again, the bestfamily was the 50 with 306.8 cm and the lowestfamily the 68 with 188.8 cm, at 4.5 years.Pruning was applied 1 year before the 2001measurement.
Analysis of variance is presented in tables 10and 11. Results show that solitary (isolated) mothertrees presented lower progeny performance inheight and diameter (Pr > F <0.0001 and formPr > F <0.0037).
The presence of attack was notsignificant in the performance of the family forthe solitary analysis; nor was the response to theattack (Pr > F =0.3440). It is interesting to notethat there appears to be differences due to thepopulation structures. Thus, mother trees thatgrow together in clumps generally show superiorfamilies when compared to the families frommothers that grow as solitaries.
Table 10 presents the analysis of variance,table 11 the orthogonal contrast analysis, and thetest of Tukey for the means. We interpret this factas a possible indication of an increase in selfingin case of solitaries. Karkkainen et al. (1996) andKoski and Muona (1986) in studies with Pinussylvestris have showed the same possible effectof inbreeding. Future tree improvementprograms must consider the risk of inbreedingdepression when collecting seed from singletrees growing far apart. The mating system,including estimates of selfing, should beundertaken using relevant genes markers.
We suggest that family differences reflect3 sources of variation: 1) among populations; 2)among families within populations due toadditive genetic variability; and 3) amongfamilies due to inbreeding depression.
These differences clearly reflectadaptations to different environments such as thelatitude spans from 7.5 degrees to 19.45 degrees,precipitation from 1200 to 3500 mm year-1 and thelength of the dry season from 3-6 months per year.
The variation in the Fst values in themeasurement at young stages may be caused bymaternal effects; the same applies for thecomponents of variance within and betweenpopulations. Also, for the first measurement, alltrees had the same soil condition in the plastic pot,so the adaptive characters given to differentmicroenvironments were minimized. The othermeasurements were done in the field where theseedlings were submitted to the edaphic and climaticconditions in the northern zone of the country.
AGRONOMÍA COSTARRICENSE48
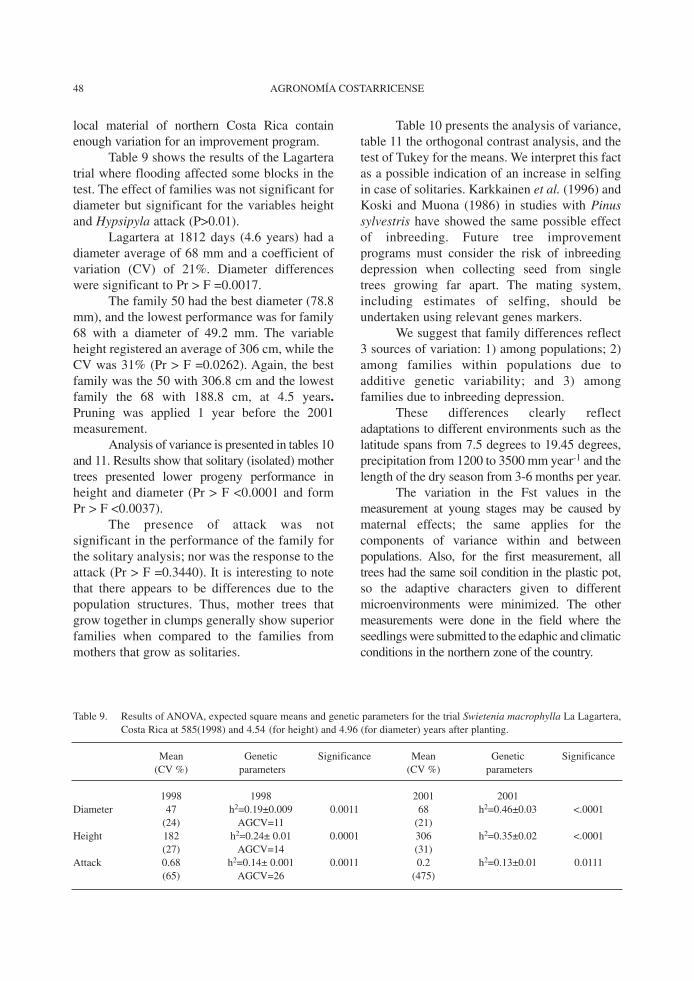
Table 9. Results of ANOVA, expected square means and genetic parameters for the trial Swietenia macrophylla La Lagartera,Costa Rica at 585(1998) and 4.54 (for height) and 4.96 (for diameter) years after planting.
Mean Genetic Significance Mean Genetic Significance(CV %) parameters (CV %) parameters
Table 11. Orthogonal contrasts for the variable solitary mother tree and Tukey grouping for the analysis of the variable solitarymother tree. Laberinto trial. Costa Rica.
Contrast Analysis Mean Square F Value Pr > F Tukey Groups Mean (cm) Mother tree*
Diameter DiameterContrast A 70.7063 21 vs 2 y 3 24276.68368 86.63 <.0001 A 68.9839 32 vs 3 831.70919 2.97 0.0850 B 63.7809 1Height Height1 vs 2 y 3 1123677.466 114.08 <.0001 A 317.624 22 vs 3 9069.200 0.92 0.3373 A 312.806 3
B 274.469 1Attack Ataque1 vs 2 y 3 0.02972101 6.04 0.0141 A 0.998144 32 vs 3 0.00049464 0.10 0.7513 A 0.997354 2
A 0.990813 1# of shoots # of shoots1 vs 2 y 3 0.87230015 1.18 0.2783 A 2.37359 12 vs 3 0.40331726 0.54 0.4610 A 2.35450 2
A 2.31374 3Form Form1 vs 2 y 3 3.92386213 7.61 0.0059 A 1.31802 12 vs 3 0.09892198 0.19 0.6615 B A 1.24339 2
B 1.23082 3
* 1. Isolated mother tree (no other trees of the same species) at a distance of less than 500 m, 2. Semi-isolated (other trees nocloser than 100 m) and 3. Mother tree in clusters or associated with more than 2 trees in a radius of less than 100 m.
Gillies et al. (1999) in a Mesoamericanstudy of mahogany using RAPD, found asignificant portion of diversity maintainedbetween populations within the three geographicalregions in Mesoamerica (i.e. Yucatán Península,Central Zone and Panama); the present results alsoshow that there is differentiation in clusters ofPanama in comparison with the otherpopulations in the northern part of Mesoamerica(Figure 2). The percentage of genetic variationamong populations was 12%, Fst 0.0168, whileon average for 12 values of different charactersand measurements of Fst values was 0.2. Thesedifferences show the influence of the selection inSwietenia macrophylla because of great climaticand edaphic differences within the entirecollection.
The criteria used to cut the adult trees inthe natural forest are: a minimum of diameter;height; good form; and the condition of treeswithout a hollow trunk. In the analysis weascertained that the trees in exploited areas haveless performance in height, diameter and form,and that hollow trunks is a variable that can notbe analyzed in young trees. Gillies et al. (1999)found that the genetic diversity in mahogany wascorrelated to the level of exploitation ordestruction of the forest; these results can berelated with those presented in this paper, giventhat the solitary trees presented a lowperformance in diameter and height. This couldindicate that the dysgenic selection produced bythe human exploitation of the best trees, couldhave reduced the variation that corresponds tothat part of the populations, including the bestmodel trees, and therefore decreasing the overallgenetic diversity.
Progeny experiments made with bothCosta Rican families (at Upala and Lagartera),and the Central American and Mexican trial (atLaberinto), reveal high levels of genetic variationfor height and diameter growth on 2 levels,population and family. For diameter, the bestpopulations were Bio-Itza (Guatemala) and Tikal(Guatemala) and for height, Santa Cecilia (CostaRica) and Naranjal (México).
For the Upala trial, it was found thatfamilies 93 from San Emilio (Los Chiles, Costa
Rica) and 51 from Caño Negro (Los Chiles,Costa Rica) produced the best growth in heightand diameter.
As for resistance to H. grandella, nosignificant variation was found in the presence ofthe shootborer in any of the 3 trials. These resultsindicate that breeding for insect resistance in thepresent material is probably worthless. Webelieve, the best strategy to avoid insect damageis integrated pest management through the use ofmixed stands, and agroforestry includingimportant crop plants.
The heritability estimates were relativelyhigh for diameter and height, which suggest thepossibility of good genetic gains and indicate thatthere is additive genetic variability available forsuccessful breeding.
The collection of seeds from individualtrees to grow families has given us a reason tosuggest further careful studies on populationstructures and especially on risks of inbreeding insparse populations that may be the result of long-term forest exploitation. We recommendcombining quantitative studies with molecularmarkers, including mating systems, in order tosave valuable genetic resources. Only after suchinformation it will be possible to plan optimaltree breeding programs for mahogany.
ACKNOWLEDGEMENTS
To the European Union, contract TS3*-CT94-0316 and of the IC18-CT97-0149 for itssupport. M. Hernández, J. Cornelius, L. Coto, J.Perez, K. Wightman and J. Haggar, all fromCATIE, J. Wilson and A. Gillies from the Centerfor Ecology and Hydrology (Scotland) and thelandowners R. Nuñez, J. E. Rodríguez and H.Abarca are gratefully acknowledged. In CentralAmerica we thanks to Centro Maya, ParqueNacional Tikal, ESNACIFOR, Centro deMejoramiento Genético and Semillas Forestales,INRENARE, Proyecto CATIE-CONAP, ForestDept. of Belize, Las Cuevas Experimental Station,and in Mexico to ICRAF and INIFAP for theircooperation. To Professor Peter Tigerstedt for hisvaluable comments and suggestions for this paper.
AGRONOMÍA COSTARRICENSE50
NAVARRO Y HERNÁNDEZ: Population differentiation of Mahogany 51
LITERATURE CITED
BOONE R.S., CHUDNOFF M. 1970. Variations in wooddensity of the mahoganies of Mexico and CentralAmerica. Turrialba 20 (3):369-371.
CITES. 1997. Proposed amendment to CITES Appendix II.Convention on international trade in endangeredspecies of wild fauna and flora. 10th Meeting of theConference of the Parties, Harare, Zimbabwe, 9-20June 1997. 36 p.
CORNELIUS J.P. 1994. Heritabilities and additive geneticcoefficients of variation in forest trees. Can. J. For.Res. 24(2):372-379.
DIETERS M.J., WHITE T.L., LITTELL R.C., HODGE G.R.1995. Application of approximate variances ofvariances components and their ratios in genetictests. Theor. Appl. Gen. 91:15-24.
GILLIES A., NAVARRO C., LOWE A.J, NEWTON A.C.,HERNANDEZ M., WILSON J., CORNELIUS J.P.1999. Genetic diversity in Mesoamericanpopulations of mahogany (Swietenia macrophylla),assessed using RAPDs. Heredity 83 (1999): 722-732.
GRAHAM A. 1999. Studies in Neotropical Paleobotany.XIII. An Oligo-Miocene Palynoflora from Simojovel(Chiapas, Mexico). American Journal of Botany86(1): 17-31.
GULLISON R. E., PANFIL S.N., STROUSE J.J., HUBBELLS.P. 1996. Ecology and management of mahogany(Swietenia macrophylla King) in the ChimanesForest, Beni, Bolivia. Botanical Journal of theLinnean Society 122:9-34.
HOLDRIDGE L.R. 1967. Life zone ecology. San Jose, CostaRica. Tropical Science Center. 206 p.
KARKKAINEN K., KOSKI V., SAVOLAINEN O. 1996.Geographical variation in the inbreeding depressionof Scots Pine. Evolution 50(1): 111-119.
KOSKI V., MUONA O. 1986. Probability of inbreeding inrelation to clonal differences in male flowering and
KREMER A., ZANETTO A., DUCOUSSO A. 1997.Multilocus and multitrait measures of differentiationfor gene markers and phenotypic traits. Genetics145: 1229-1241.
MATAMOROS Y., SEAL U.S. (eds.). 1996. Report ofthreatened plants of Costa Rica Workshop, 4-6October. IUCN/SSC Conservation BreedingSpecialist Group: Apple Valley MN.
NAVARRO C., WILSON J., GILLIES A., HERNÁNDEZ M.2003. A new Mesoamerican collection of big-leafMahogany, pp 103-117. In: A.E. Lugo, J.C. Figueroaand M. Alayón (eds.). Big leaf mahogany: Genetics,ecology and management. Ecological Studies 159,Springer. New York.
NEGREROS C., MIZE C. 1994. El efecto de la abertura deldosel y eliminación del sotobosque sobre laregeneración natural de una selva de Quintana Roo.pp. 107-126 In: Snook, L. & A. Barrera de Jorgenson(eds.). Madera, Chicle, Caza y Milpa: Contribucionesal manejo integral de las selvas de Quintana Roo.INIFAP/PROAFT/AID/WWF-US, Mérida, México.
PATIÑO F. 1997. Genetic resources of Swietenia and Cedrelain the neotropics: Proposals for coordinated action.1997. Based on contractual work for FAO by P.Y.Kageyama, C.Linares, C. Navarro and F. Patiño.Forest Resources Division, Forestry Department,FAO, Rome.
PÉREZ S., ALVARADO A., RAMÍREZ C. 1978. Mapaasociación de subgrupo de suelos de Costa Rica. SanJosé, Costa Rica, Instituto Geográfico Nacional. Esc.1: 200.000.
SNOOK L.K. 2003. Natural regeneration and growth ofMahogany (Swietenia macrophylla) in Mexico´sYucatan forests: Implications for sustainablesilviculture, pp.169-192. In: A.E. Lugo, J.C.Figueroa and M. Alayón (eds.). Big leaf Mahogany:Genetics, ecology and management. EcologicalStudies 159, Springer. New York.