● 271 UC students responded to 24 university student motivation statements in 2008 using an 8-point Likert scale (False to True) e.g., “I study at university … ”– to enhance my job prospects.– because other people have told me I should.
● EFA PC Oblimin revealed 5 factors
Example EFA: University student motivation
11
Exa
mpl
e E
FA
:P
atte
rn m
atrix
12
Example EFA: University student motivation
• Career & Qualifications (6 items; α = .92)
• Self Development (5 items; α = .81)
• Social Opportunities (3 items; α = .90)
• Altruism (5 items; α = .90)
• Social Pressure (5 items; α = .94)
13
Example EFA: University student motivation factor correlations
Motivation CQ SD SO AL SPCareer & Qualif.
.26 .25 .24 .06
Self Develop. .33 .55 -.18Social Enjoyment
.26 .33
Altruism .11Social Pressure
15
Exploratory factor analysis: Q & A
Questions?
Concepts & their measurement
Operationalising fuzzy concepts
17
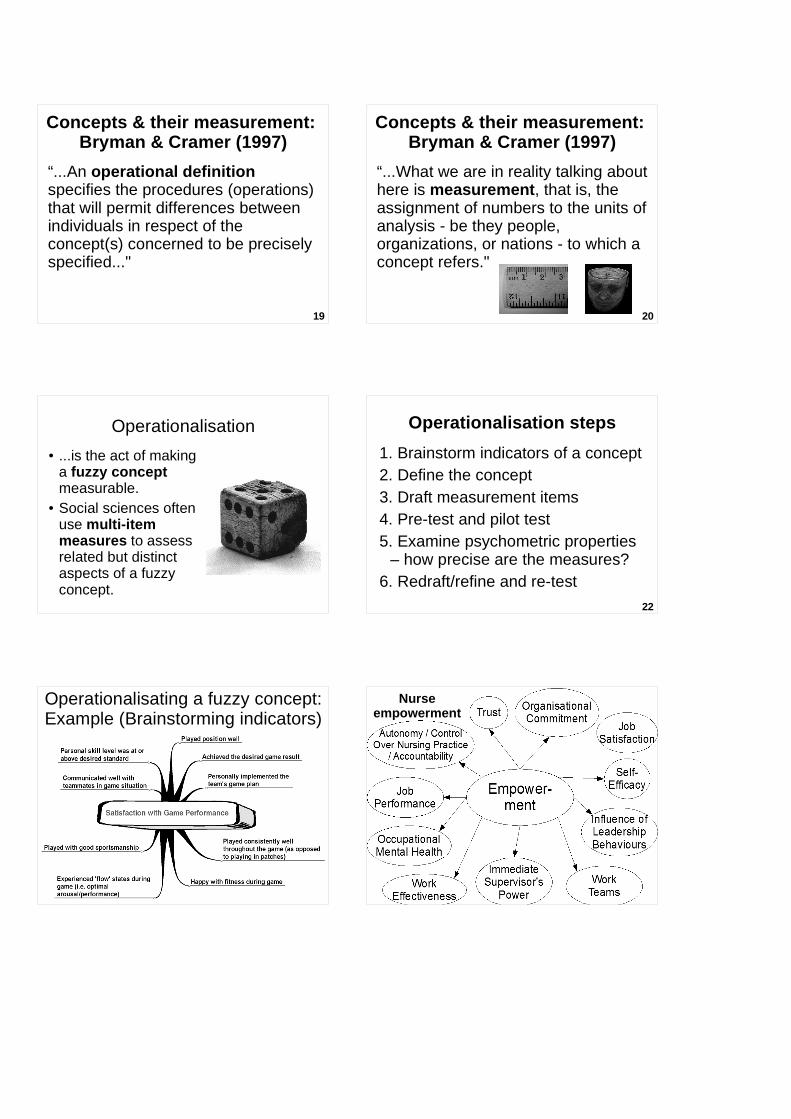
Concepts & their measurement: Bryman & Cramer (1997)
Concepts• form a linchpin in the process of social
research• express common elements in the world
(to which we give a name)
Hypotheses • express relations between concepts
18
Concepts & their measurement: Bryman & Cramer (1997)
“Once formulated, a concept … will need to be operationally defined, in order for systematic research to be conducted in relation to it..."
19
Concepts & their measurement: Bryman & Cramer (1997)
“...An operational definition specifies the procedures (operations) that will permit differences between individuals in respect of the concept(s) concerned to be precisely specified..."
20
Concepts & their measurement: Bryman & Cramer (1997)
“...What we are in reality talking about here is measurement, that is, the assignment of numbers to the units of analysis - be they people, organizations, or nations - to which a concept refers."
Operationalisation● ...is the act of making
a fuzzy concept measurable.
● Social sciences often use multi-item measures to assess related but distinct aspects of a fuzzy concept.
22
Operationalisation steps
1. Brainstorm indicators of a concept2. Define the concept3. Draft measurement items4. Pre-test and pilot test5. Examine psychometric properties
– how precise are the measures?6. Redraft/refine and re-test
Operationalisating a fuzzy concept: Example (Brainstorming indicators)
Fuzzy concepts - MindmapNurse empowerment
Factor analysis process
Image source: Figure 4.2 Bryman & Cramer (1997)
27
Measurement error
Measurement error is any deviation from the true value caused by the measurement procedure.• Observed score =
true score +/- measurement error
• Measurement error =systematic error + random error
28
Sources of measurement error
Non-sampling(e.g., unreliableor invalidtests)
Sampling(e.g., non-rep. sample)
Researcher bias(e.g., researcher favours a hypothesis)
Paradigm(e.g., Western focus on individualism)
Respondent bias(e.g., social desirability)
29
Measurement precision & noise
“The lower the precision, the more subjects you'll need in your study to make up for the "noise" in your measurements. Even with a larger sample, noisy data can be hard to interpret. And if you are an applied scientist in the business of testing and assessing clients, you need special care when interpreting results of noisy tests.”
• Ensure administrative accuracy:– Set up efficient coding, with well-
labelled variables– Check data (double-check at least a
portion of the data)
To minimise measurement error
Psychometrics
34
Psychometrics: Goal
To validly measure differences between individuals and groups in psychosocial qualities such as attitudes and personality.
35
Psychometric tasks
• Develop approaches and procedures (theory and practice) for measurement of psychological phenomena
• Design and test psychological measurement instrumentatione.g., examine and improve reliability and validity
36
Psychometrics: As test-taking grows, test-makers grow rarer
"Psychometrics, one of the most obscure, esoteric and cerebral professions in America, is now also one of the hottest.”- As test-taking grows, test-makers grow rarer, David M. Herszenhor, May 5, 2006, New York Times
e.g., due to increased testing of educational and psychological capacity and performance
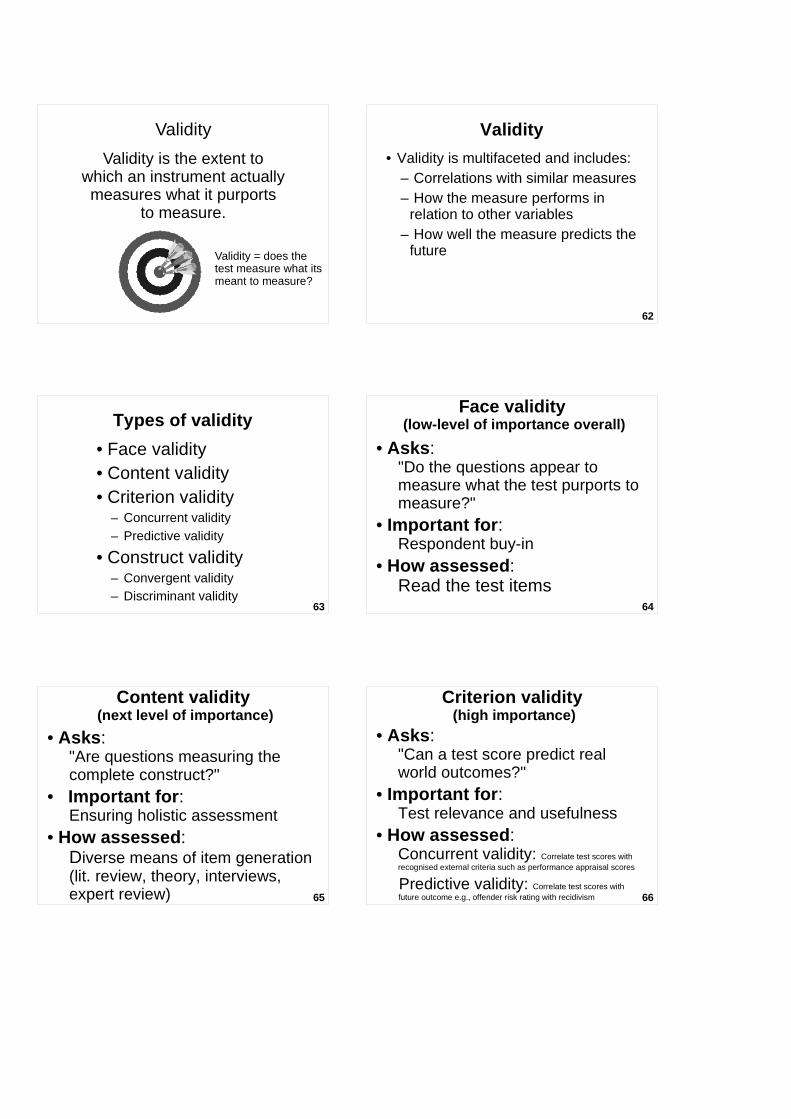
Reliability and validity (“classical test theory”) are ways of evaluating psychological tests and measures.• Reliability is about consistency of
– the items within the measure – a measure over time
• Validity is about whether the measure actually measures what it is intended to measure.
Reliability vs. validityIn classical test theory, reliability is generally thought to be necessary for validity, but it does not guarantee validity.
In practice, a test of a relatively changeable psychological construct such as suicide ideation, may be valid (i.e., accurate), but not particularly reliable over time (because suicide ideation is likely to fluctuate). 42
Reliability and validity(Howitt & Cramer, 2005)
• Reliability and validity are not inherent characteristics of measures. They are affected by the context and purpose of the measurement → a measure that is valid for one purpose may not be valid for another purpose.
Reliability
Reproducibility of a measurement
44
Types of reliability
• Internal consistency : Correlation among multiple items in a factor
• Test-retest reliability : Correlation between test at one time and another– Product-moment correlation (r)
• Inter-rater reliability : Correlation between one observer and another:– Kappa
45
Reliability rule of thumb
< .6 = Unreliable.6 = OK.7 = Good.8 = Very good, strong.9 = Excellent>.95 = may be overly reliable or redundant – this is subjective and whether a scale is overly reliable depends also on the nature what is being measured
Reliability rule of thumb Table 7 Fabrigar et al (1999).
Table 7 Fabrigar et al. (1999)
Rule of thumb - reliability coefficients should be over .70, up to approx. .90
47
Internal consistency(or internal reliability)
Internal consistency refers to:• How well multiple items combine as a measure
of a single concept• The extent to which responses to multiple
• Asks : "Do the questions appear to measure what the test purports to measure?"
• Important for : Respondent buy-in
• How assessed : Read the test items
65
Content validity (next level of importance)
• Asks : "Are questions measuring the complete construct?"
• Important for : Ensuring holistic assessment
• How assessed : Diverse means of item generation (lit. review, theory, interviews, expert review) 66
Criterion validity (high importance)
• Asks : "Can a test score predict real world outcomes?"
• Important for :Test relevance and usefulness
• How assessed : Concurrent validity: Correlate test scores with recognised external criteria such as performance appraisal scores
Predictive validity: Correlate test scores with future outcome e.g., offender risk rating with recidivism
67
Construct validity (high importance)
• Asks : Does the test assess the construct it purports to? ("the truth, the whole truth and nothing but the truth.")
• Important for :Making inferences from operationalisations to theoretical constructs
• How assessed : - Theoretical (is the theory about the construct valid?) - Statistical Convergent – correlation with similar measures Discriminant – not correlated with other constructs
Composite Scores
70
Composite scores
Combine item-scores into overall scores which represent individual differences in the target constructs.These new 'continuous' variables can then be used for:• Descriptive statistics and histograms• Correlations• As IVs and/or DVs in inferential
analyses such as MLR and ANOVA
71
Composite scores
There are two ways of creating composite scores:• Unit weighting• Regression weighting
72
Unit weighting
Average (or total) of item scores within a factor.(each variable is equally weighted)
X = mean(y1…yp)Unit
Weighting
.25.25 .25
.25
73
Creating composite scores: Dealing with missing data
It can be helpful to maximise sample size by allowing for some missing data.
The contribution of eachitem to the composite scoreis weighted to reflect someitems more than otheritems.
X = 20*a + .19*b + .27*c + .34*d
X
.20.19 .27
.34
ab c
d
This is arguably more valid, but the advantage may be marginal, and it makes factor scores difficult to compare.
76
Regression weighting
Two calculation methods:• Manual (use Compute)• Automatic (use Factor
Analysis – Factor Scores)
Regression weighting – SPSS data
Data view : Data are standardised, centred around 0
Variable view : Variables auto-calculated through SPSS factor analysis
79
Writing up instrument development
• Introduction–Literature review about underlying
factors – theory and research
• Method–Materials/Instrumentation –
summarise how the measures were developed and the expected factor structure e.g., present a table of the expected factors and their operational definitions. 80
–Reliability for each factor–Composite scores for each factor–Correlations between factors
81
Writing up instrument development• Discussion
– Theoretical underpinning – Was it supported by the data? What adaptations should be made to the theory?
– Quality / usefulness of measure – Provide an objective, critical assessment, reflecting the measures' strengths and weaknesses
– Recommendations for further improvement
• Writing up a factor analysis– Download examples: http://goo.gl/fD2qby 82
Summary
83
Summary: Concepts & their measurement1. Concepts name common elements2. Hypotheses identify relations between
concepts3. Brainstorm indicators of a concept4. Define the concept5. Draft measurement items6. Pre-test and pilot test7. Examine psychometric properties8. Redraft/refine and re-test
84
Summary: Measurement error
1. Deviation of measure from true score2. Sources:
4. Discussion 1. Balanced interpretation and critique of theory
and measure with recommendations 90
1. Allen, P. & Bennett, K. (2008). Reliability analysis (Ch 15) in SPSS for the health & behavioural sciences (pp. 205-218). South Melbourne, Victoria, Australia: Thomson.
2. Bryman, A. & Cramer, D. (1997). Concepts and their measurement (Ch. 4). In Quantitative data analysis with SPSS for Windows: A guide for social scientists (pp. 53-68). Routledge.
3. DeCoster, J. (2000). Scale construction notes. http://www.stat-help.com/scale.pdf (pdf)
4. Fabrigar, L. R., Wegener, D. T., MacCallum, R. C., & Strahan, E. J. (1999). Evaluating the use of exploratory factor analysis in psychological research. Psychological Methods, 4(3), 272-299.
5. Fowler, F. (2002). Designing questions to be good measures. In Survey research methods (3rd ed.)(pp. 76-103). Thousand Oaks, CA: Sage. Ereserve.
6. Howitt, D. & Cramer, D. (2005). Reliability and validity: Evaluating the value of tests and measures (Ch. 13). In Introduction to research methods in psychology (pp. 218-231). Harlow, Essex: Pearson. eReserve.