November 2015 Final Report to PTAC on 2013 and 2015 Surveys 1/20 Final Report To PTAC Collaboration Group On 2013 and 2015 Surveys November 2015 Sky Hunter Corporation www.skyhunter.ca 403.830.8349
Transcript
November 2015 Final Report to PTAC on 2013 and 2015 Surveys 1/20
Final Report
To PTAC Collaboration Group
On 2013 and 2015 Surveys
November 2015
Sky Hunter Corporation
www.skyhunter.ca
403.830.8349
Letter to PTAC
Letter To PTAC
November 2015 Final Report to PTAC on 2013 and 2015 Surveys 2/20
PTAC statement:
The operators reviewed information, there is more to be done. The operators did indicate there is a
relationship between Sky Hunter readings and formation thickness.
20 November 2015
Sky Hunter thanks Petroleum Technology Alliance Canada (PTAC) for their funding and management of
this collaboration.
In addition, Sky Hunter thanks PTAC for its 2014 SME Commercialization Award.
The GeoViz Project in conjunction with VizworX forms a portion of this project.
We also want to thank the following for their funding, input and participation:
LOOKNorth Remote Sensing innovation for responsible, sustainable
development of Northern natural resources
Government of Alberta Enterprise and Advanced Education
The Participating Oil Sands Operators
As this is a collaboration, the project was adjusted by the participants as information was received and
evaluated. The time line increase was as a result of Sky Hunter’s operational requirements. The recent
data sets are undergoing continuing reviews by the project teams.
The introduction of new survey systems to the energy industry takes time and effort by all. We trust
the results of this collaboration will lead to effective use of this environmentally friendly, oil and gas
reservoir mapping system.
Again, a sincere thank you.
Ken Bradley Co-founder Russ Duncan Co-founder
Project Overview
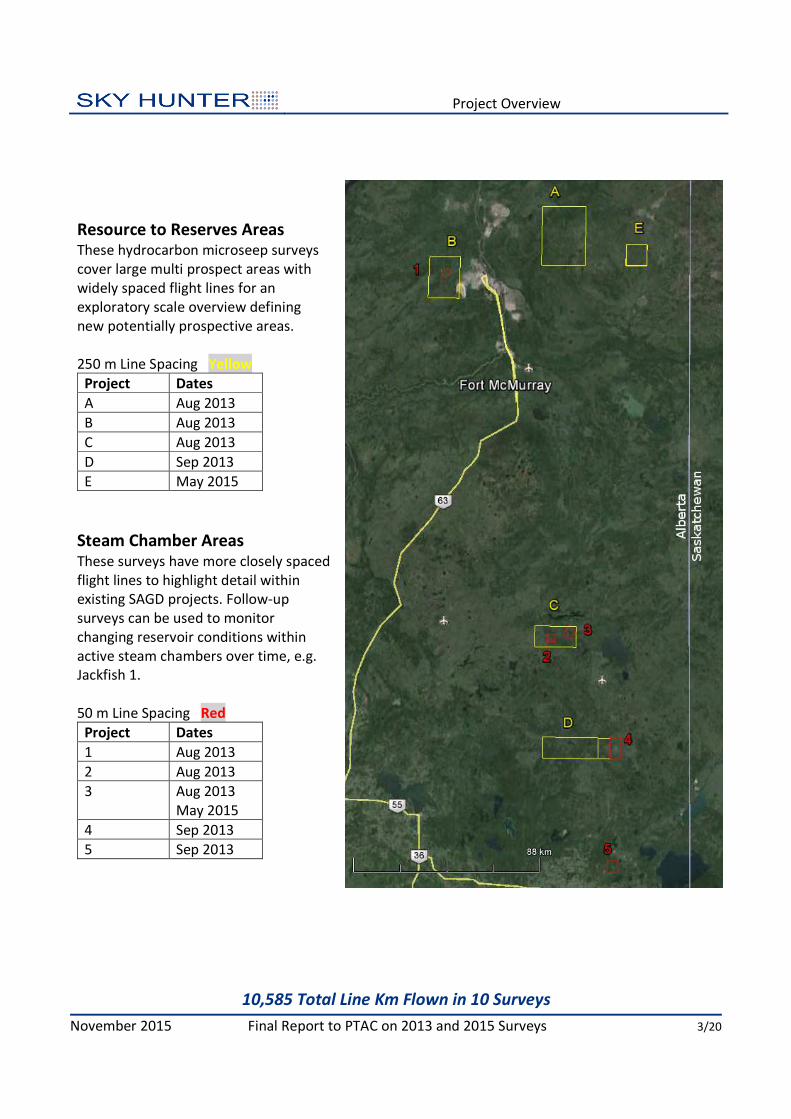
10,585 Total Line Km Flown in 10 Surveys
November 2015 Final Report to PTAC on 2013 and 2015 Surveys 3/20
Resource to Reserves Areas These hydrocarbon microseep surveys
cover large multi prospect areas with
widely spaced flight lines for an
exploratory scale overview defining
new potentially prospective areas.
250 m Line Spacing Yellow
Project Dates
A Aug 2013
B Aug 2013
C Aug 2013
D Sep 2013
E May 2015
Steam Chamber Areas These surveys have more closely spaced
flight lines to highlight detail within
existing SAGD projects. Follow-up
surveys can be used to monitor
changing reservoir conditions within
active steam chambers over time, e.g.
Jackfish 1.
50 m Line Spacing Red
Project Dates
1 Aug 2013
2 Aug 2013
3 Aug 2013
May 2015
4 Sep 2013
5 Sep 2013
Sky Hunter Survey System - Reservoir to Sensors
Hydrocarbons Migrate Vertically From Reservoirs
November 2015 Final Report to PTAC on 2013 and 2015 Surveys 4/20
Ionosphere
The Ionosphere (100 km altitude) is positively
charged to 500,000 Volts and thus attracts
negatively charged hydrocarbon particles
emanating above the earth’s surface.
Concentration
Sky Hunter’s proprietary “Hydrocarbon Nose”
concentrates the negatively charged
hydrocarbon particles and funnels them to the
sensors inside the aircraft. The sensors detect
the concentrations of three different suites of
hydrocarbons originating from oil and gas
reservoirs at depth.
Nucleation
An independent White Paper
from the University of Calgary
Department of Physics and
Astronomy describes and
confirms the mechanism for the creation of
negatively charged aerosol particles in the
lower atmosphere above hydrocarbon
reservoirs. A nucleation process combines the
organic hydrocarbon bearing particles with
ubiquitous sulphur compounds, resulting in
negatively charged particles that then travel
upwards towards the Ionosphere.
Buoyancy
A second White Paper
produced by an
independent Geological
Engineer describes the underground
processes involved in vertical migration of
hydrocarbons to the earth’s surface. The
primary driving force is the buoyancy of the
hydrocarbons.
Sky Hunter Survey System – Sensors to Maps
Sensors Measure Both Oil and Gas Concentrations
November 2015 Final Report to PTAC on 2013 and 2015 Surveys 5/20
Aircraft
Aries Aviation owns and operates the aircraft
that Sky Hunter utilizes for domestic and
international operations.
A custom nose cone concentrates negatively
charged hydrocarbon particles.
Sample air is routed to the sensors inside the
aircraft.
Sensor System
MacDonald, Dettwiler and Associates (MDA)
developed the custom Airborne Hydrocarbon
Sensing System from an earlier Sky Hunter
prototype.
MDA also designed and built the Canadarm used
on the Space Shuttle and the International Space
Station, as well as RADARSAT.
Processing
Custom algorithms process the data gathered
from the sensors to produce maps of gas and oil
concentrations.
Three Sensors
Oil1 Signal Strength
Blue = Low Red = High Footprint maps are top 25 %
Reservoir Considerations
Complex Reservoirs Lead To Variations in Bitumen In Place Estimates
November 2015 Final Report to PTAC on 2013 and 2015 Surveys 6/20
Buoyancy Pressure
Hydrocarbons are
generally less dense than
water and will tend to rise
to the surface. The
buoyancy force is
proportional to the
differential between the
oil vs. water pressure
gradients with depth.
Vertical Permeability
Clean homogeneous
sands have high vertical
permeability, resulting in
strong microseepage.
Increased shale content
and shale interbedding
reduces vertical
permeability and thus
microseepage.
Original Bitumen In Place
(OBIP) Estimates
The “SAGD-able” estimate
of OBIP can be doubled or
halved depending on
reservoir cut off
parameters.
Oil Sands Geology Is Complex
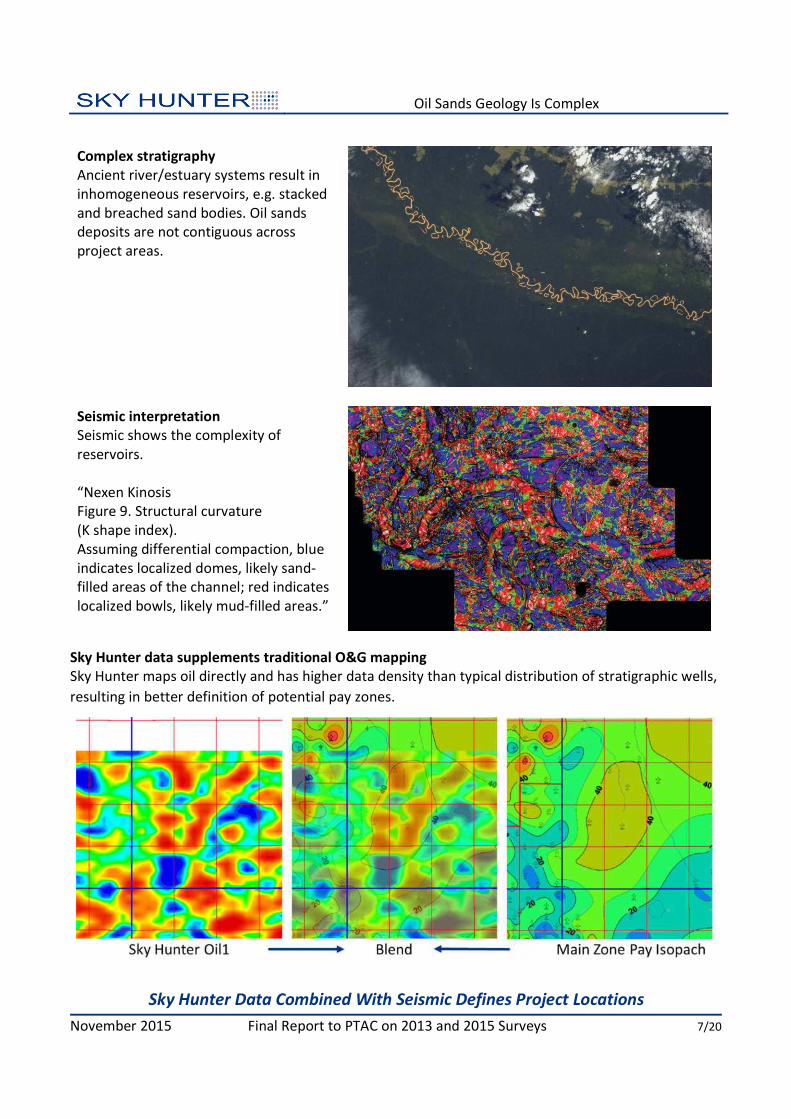
Sky Hunter Data Combined With Seismic Defines Project Locations
November 2015 Final Report to PTAC on 2013 and 2015 Surveys 7/20
Complex stratigraphy
Ancient river/estuary systems result in
inhomogeneous reservoirs, e.g. stacked
and breached sand bodies. Oil sands
deposits are not contiguous across
project areas.
Seismic interpretation
Seismic shows the complexity of
reservoirs.
“Nexen Kinosis
Figure 9. Structural curvature
(K shape index).
Assuming differential compaction, blue
indicates localized domes, likely sand-
filled areas of the channel; red indicates
localized bowls, likely mud-filled areas.”
Sky Hunter data supplements traditional O&G mapping
Sky Hunter maps oil directly and has higher data density than typical distribution of stratigraphic wells,
resulting in better definition of potential pay zones.
Reserves Repeat Project
Averaged Data Shows Repeatability
November 2015 Final Report to PTAC on 2013 and 2015 Surveys 8/20
Repeat survey
Resource to Reserves E
Flown May 2015
This project area has water over bitumen.
Multiple passes of the same north-south line
were averaged together over two flights that
were flown several days apart. Results show a
good fit over much of the line.
The repeat surveys showed the SE quadrant of
this township area had stronger signal than the
average.
Flight Averages for Repeat Line
Oil1 Line 320 averages by flight (4 passes per flight)
Flight 1 Flight 2 Flights 1&2
0
10
20
30
40
50
60
70
80
90
1
10
19
28
37
46
55
64
73
82
91
10
0
10
9
11
8
12
7
13
6
14
5
15
4
16
3
17
2
18
1
19
0
19
9
20
8
21
7
22
6
23
5
24
4
25
3
26
2
27
1
28
0
28
9
29
8
30
7
31
6
32
5
33
4
34
3
35
2
36
1
Normalized Oil1 Flight Averages
Avg F1 Avg F2 Avg F1-2
Signal Strength vs. Remaining Bitumen In Place (Single Project)
Signal Strength Correlates with Remaining Bitumen In Place
November 2015 Final Report to PTAC on 2013 and 2015 Surveys 9/20
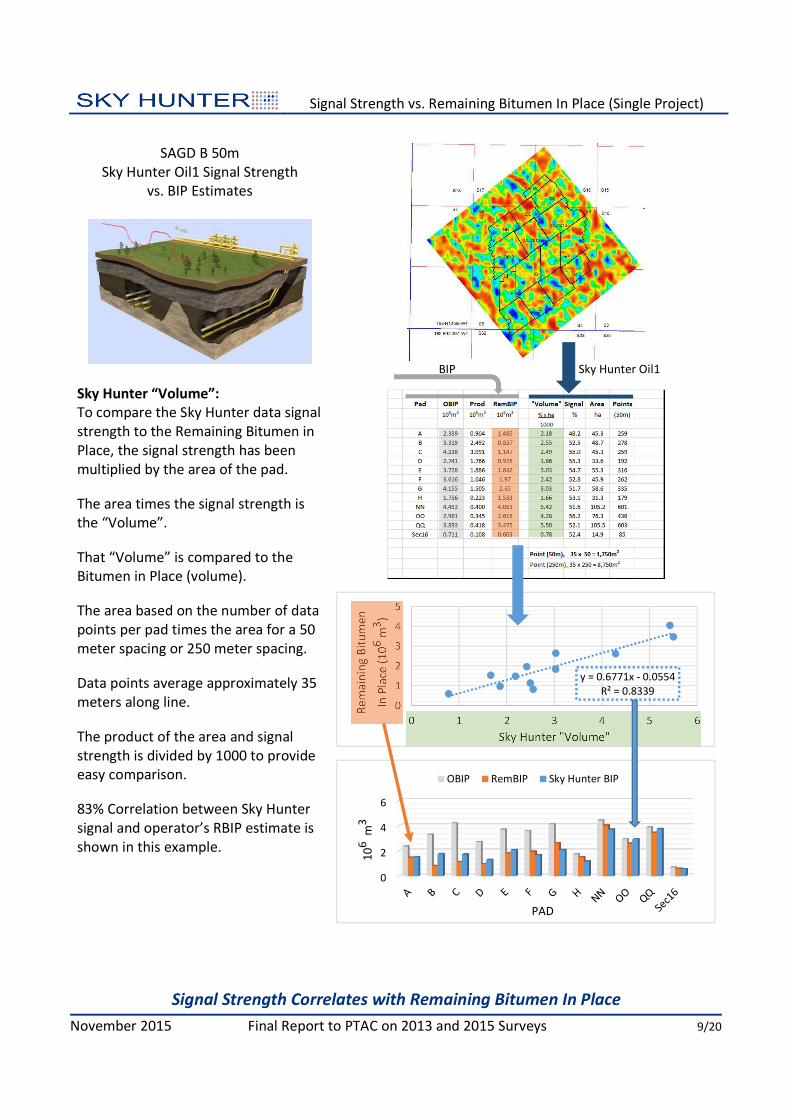
SAGD B 50m
Sky Hunter Oil1 Signal Strength
vs. BIP Estimates
Sky Hunter “Volume”:
To compare the Sky Hunter data signal
strength to the Remaining Bitumen in
Place, the signal strength has been
multiplied by the area of the pad.
The area times the signal strength is
the “Volume”.
That “Volume” is compared to the
Bitumen in Place (volume).
The area based on the number of data
points per pad times the area for a 50
meter spacing or 250 meter spacing.
Data points average approximately 35
meters along line.
The product of the area and signal
strength is divided by 1000 to provide
easy comparison.
83% Correlation between Sky Hunter
signal and operator’s RBIP estimate is
shown in this example.
BIP Sky Hunter Oil1
y = 0.6771x - 0.0554
R² = 0.8339
0
1
2
3
4
5
0 1 2 3 4 5 6
Re
ma
inin
g B
itu
me
n
In P
lace
(1
06
m3
)
Sky Hunter "Volume"
0
2
4
6
10
6m
3
PAD
OBIP RemBIP Sky Hunter BIP
Signal Strength vs. Remaining Bitumen In Place (All Projects)
Signal Strength Correlates with Remaining Bitumen In Place Over Multiple Projects
November 2015 Final Report to PTAC on 2013 and 2015 Surveys 10/20
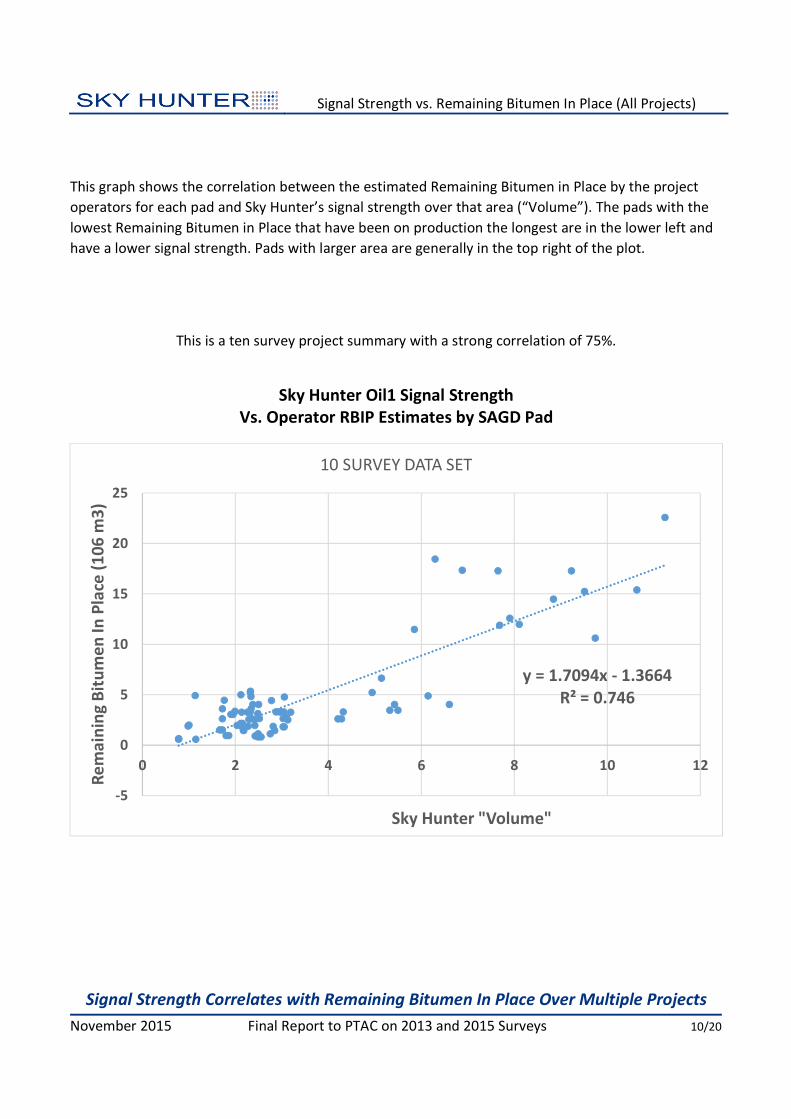
This graph shows the correlation between the estimated Remaining Bitumen in Place by the project
operators for each pad and Sky Hunter’s signal strength over that area (“Volume”). The pads with the
lowest Remaining Bitumen in Place that have been on production the longest are in the lower left and
have a lower signal strength. Pads with larger area are generally in the top right of the plot.
This is a ten survey project summary with a strong correlation of 75%.
Sky Hunter Oil1 Signal Strength
Vs. Operator RBIP Estimates by SAGD Pad
y = 1.7094x - 1.3664
R² = 0.746
-5
0
5
10
15
20
25
0 2 4 6 8 10 12
Re
ma
inin
g B
itu
me
n I
n P
lace
(1
06
m3
)
Sky Hunter "Volume"
10 SURVEY DATA SET
Using Signal Strength to Estimate Net Pay
Combine Sky Hunter Data and Reservoir Model to Estimate Net Pay Contours
November 2015 Final Report to PTAC on 2013 and 2015 Surveys 11/20
Estimating Net Pay from Sky Hunter data
To compare the Sky Hunter data signal strength
to the Remaining Bitumen in Place, the signal
strength has been multiplied by the area of the
pad.
The area times the signal strength is the
“Volume”.
That “Volume” is compared to the Bitumen in
Place (volume).
The area based on the number of data points per
pad times the area for a 50 meter spacing or 250
meter spacing.
Data points average approximately 35 meters
along line.
The product of the area and signal strength is
divided by 1000 to provide easy comparison.
Net pay is calculated using meters of oil from Sky
Hunter map using area porosity and oil
saturation.
Multiple Stacked Reservoirs
Sky Hunter Signal Strength Is the Sum of All Stacked zones
November 2015 Final Report to PTAC on 2013 and 2015 Surveys 12/20
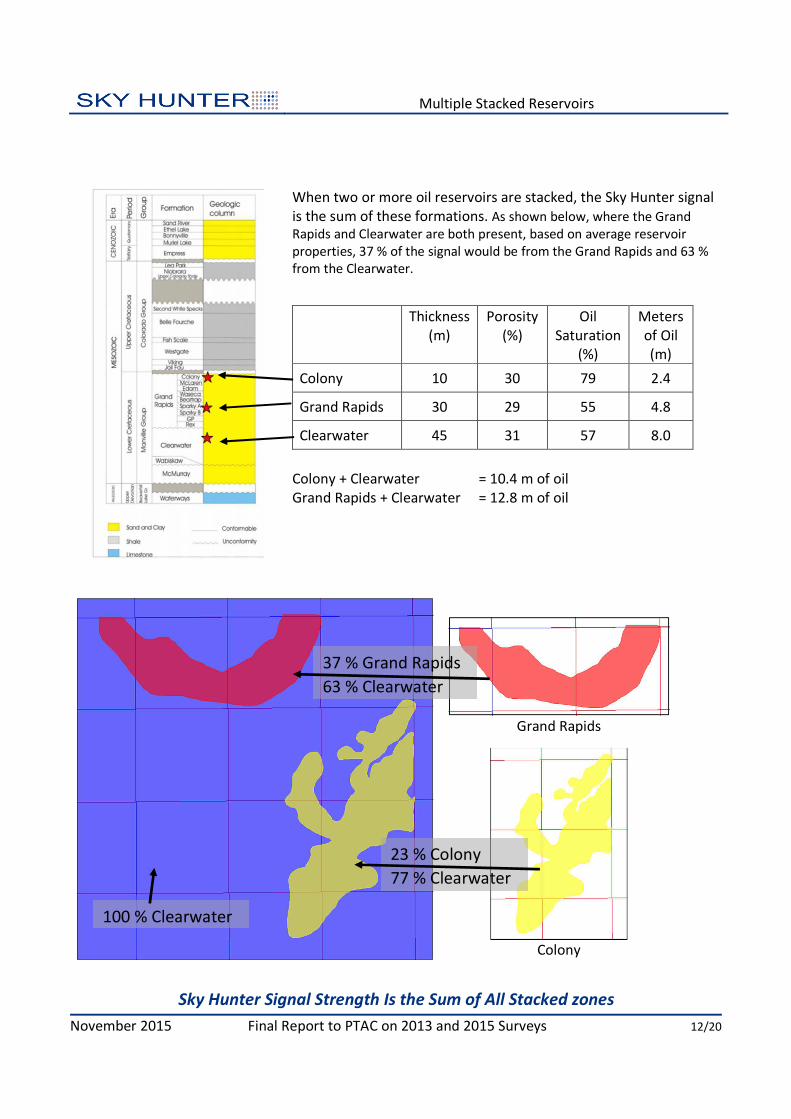
When two or more oil reservoirs are stacked, the Sky Hunter signal
is the sum of these formations. As shown below, where the Grand
Rapids and Clearwater are both present, based on average reservoir
properties, 37 % of the signal would be from the Grand Rapids and 63 %
from the Clearwater.
Thickness
(m)
Porosity
(%)
Oil
Saturation
(%)
Meters
of Oil
(m)
Colony 10 30 79 2.4
Grand Rapids 30 29 55 4.8
Clearwater 45 31 57 8.0
Colony + Clearwater = 10.4 m of oil
Grand Rapids + Clearwater = 12.8 m of oil
Grand Rapids
Colony
23 % Colony
77 % Clearwater
100 % Clearwater
37 % Grand Rapids
63 % Clearwater
Steam Chamber Survey
Microseep Signal Enhanced at Steam Front
November 2015 Final Report to PTAC on 2013 and 2015 Surveys 13/20
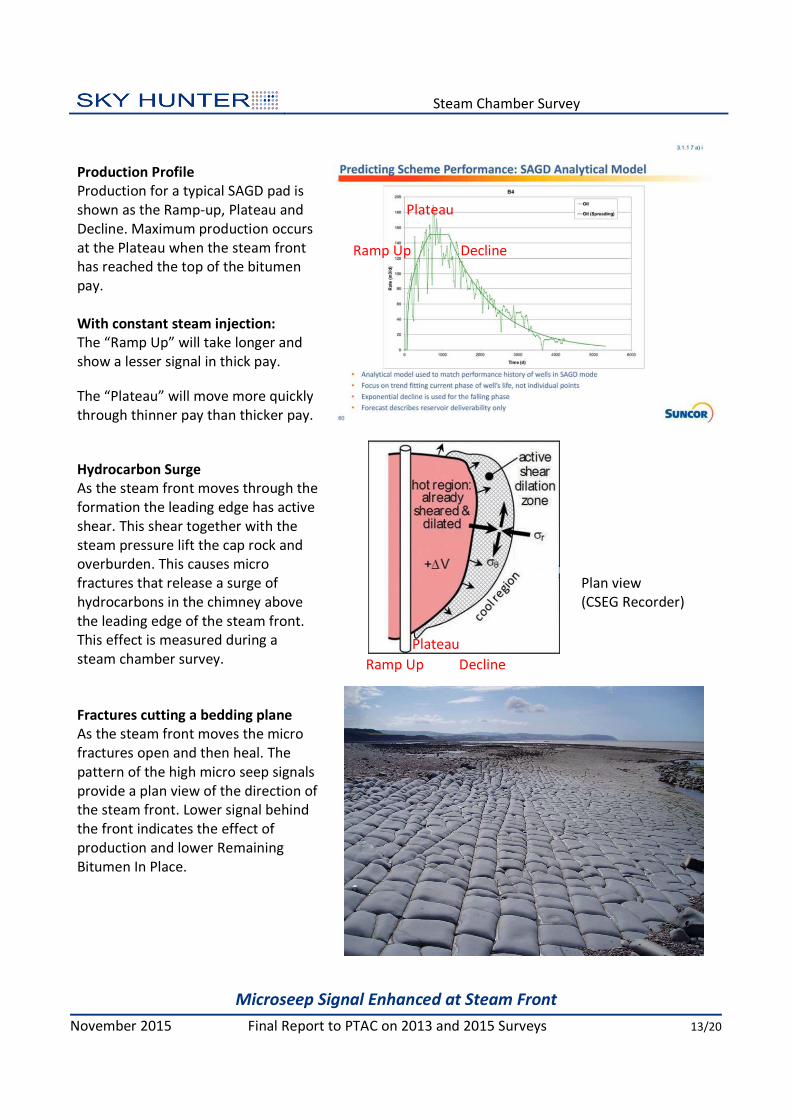
Production Profile
Production for a typical SAGD pad is
shown as the Ramp-up, Plateau and
Decline. Maximum production occurs
at the Plateau when the steam front
has reached the top of the bitumen
pay.
With constant steam injection:
The “Ramp Up” will take longer and
show a lesser signal in thick pay.
The “Plateau” will move more quickly
through thinner pay than thicker pay.
Hydrocarbon Surge
As the steam front moves through the
formation the leading edge has active
shear. This shear together with the
steam pressure lift the cap rock and
overburden. This causes micro
fractures that release a surge of
hydrocarbons in the chimney above
the leading edge of the steam front.
This effect is measured during a
steam chamber survey.
Plan view
(CSEG Recorder)
Fractures cutting a bedding plane
As the steam front moves the micro
fractures open and then heal. The
pattern of the high micro seep signals
provide a plan view of the direction of
the steam front. Lower signal behind
the front indicates the effect of
production and lower Remaining
Bitumen In Place.
Plateau
Ramp Up Decline
Plateau
Ramp Up Decline
Steam Chamber with 4D Seismic and Heave Mapping
The Combination of 4D Seismic, Surface Heave and Sky Hunter Mapping
Aid in the Definition of Steam Chambers.
November 2015 Final Report to PTAC on 2013 and 2015 Surveys 14/20
4D Seismic
SH Oil1 Signal Strength
May 2015
Blend
2014 4D Seismic
Sky Hunter survey results have been compared with 4D seismic interpretation over the SAGD projects
for all four operators. There is a good correlation in the drainage mapped by 4D seismic and the Sky
Hunter data. The Sky Hunter signal is low where the steam chamber is developed. The chimney surge
needs to be considered in using absolute data.
Surface Heave
SH Oil1 Signal Strength
May 2015
Blend
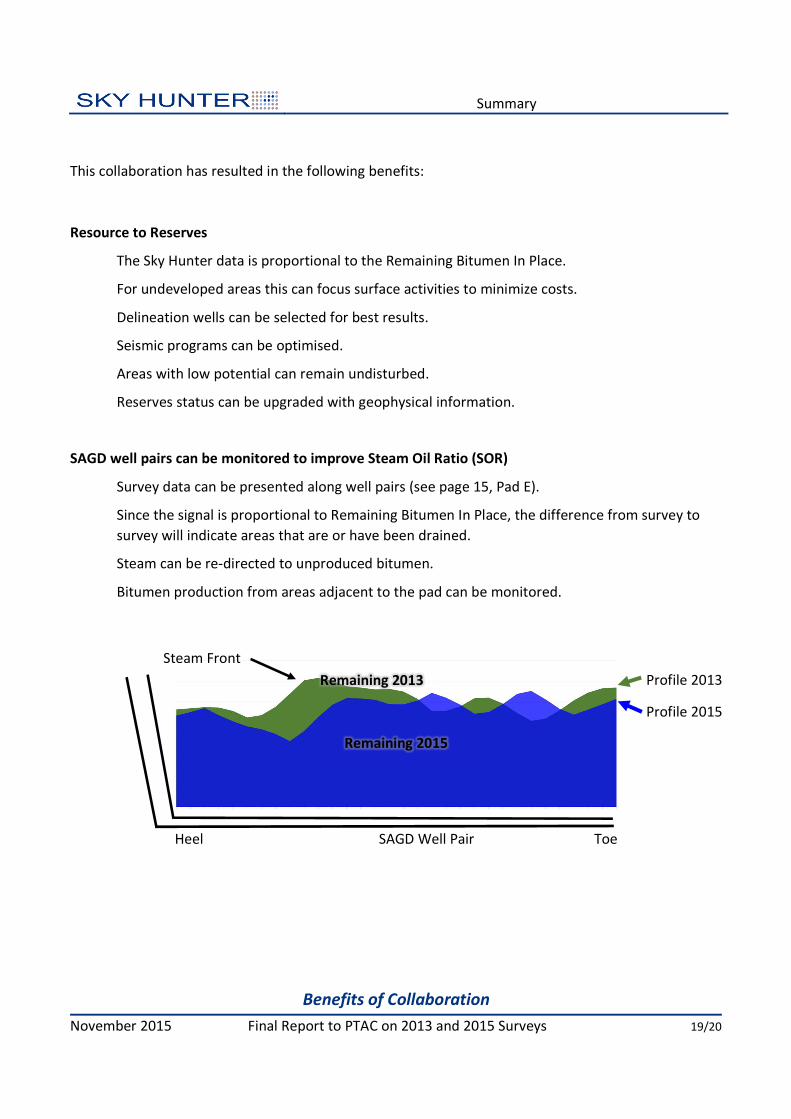
2008-2014 Surface Heave
Sky Hunter data was also compared to surface heave maps. Surface heave occurs when the Plateau
during the production cycle is reached. High intensity micro seep readings are seen on the Sky Hunter
surveys outside the pad areas (next page).
Reservoir Geomechanics
Signal Strength Can Be Used To Monitor Growth of Steam Chambers
November 2015 Final Report to PTAC on 2013 and 2015 Surveys 15/20
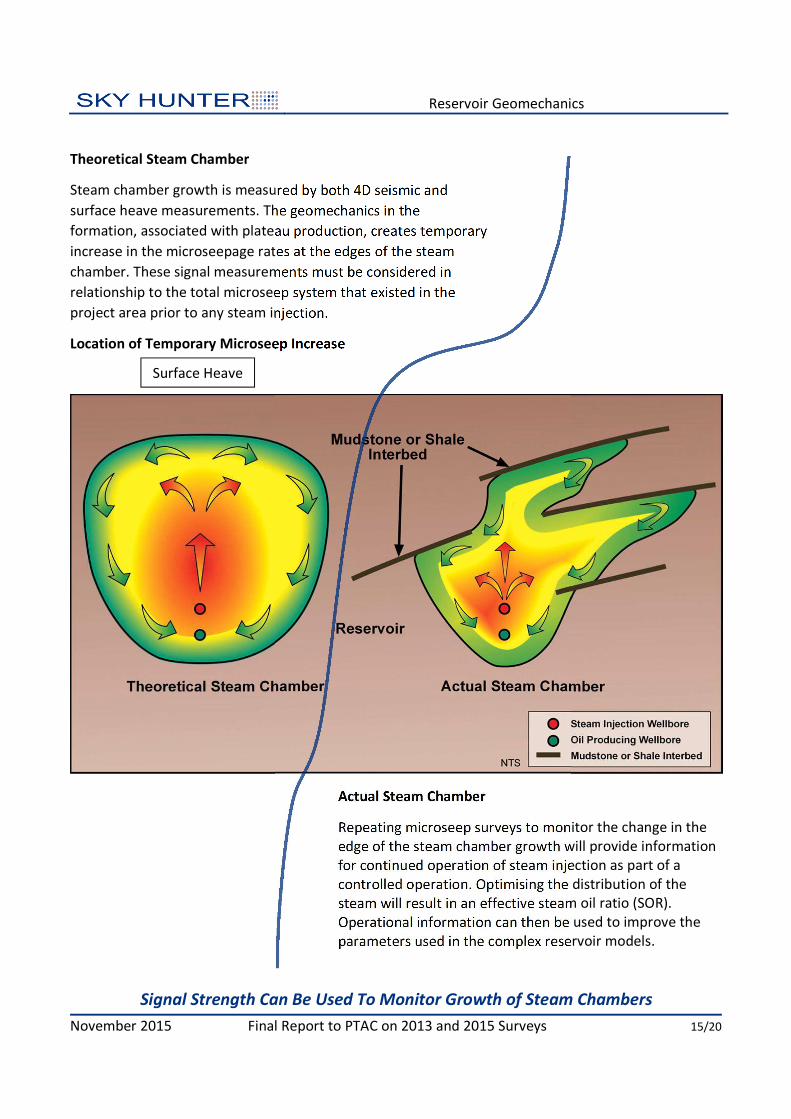
Theoretical Steam Chamber
Steam chamber growth is measured by both 4D seismic and
surface heave measurements. The geomechanics in the
formation, associated with plateau production, creates temporary
increase in the microseepage rates at the edges of the steam
chamber. These signal measurements must be considered in
relationship to the total microseep system that existed in the
project area prior to any steam injection.
Location of Temporary Microseep Increase
Actual Steam Chamber
Repeating microseep surveys to monitor the change in the
edge of the steam chamber growth will provide information
for continued operation of steam injection as part of a
controlled operation. Optimising the distribution of the
steam will result in an effective steam oil ratio (SOR).
Operational information can then be used to improve the
parameters used in the complex reservoir models.
Surface Heave
Observations
Additional Conclusions Remain To Be Gleaned from Sky Hunter Data
November 2015 Final Report to PTAC on 2013 and 2015 Surveys 16/20