31
PX-PTA-Polyester in India YJ Kim PCI Xylenes & Polyesters Asia Thursday 30 October 2014 Mumbai 2014 Indian Petchem Conference

PX-PTA-Polyester in India
YJ Kim
PCI Xylenes & Polyesters Asia
Thursday 30 October 2014 Mumbai
2014 Indian Petchem Conference

Agenda
PX trade flows and margins.
PTA landscape and pricing changes
Polyester demand growth potential and profitability.
Thursday 30 October 2014 Mumbai2014Indian Petrochem Conference

World Paraxylene Capacity Growth 2012-2018
3 new units completed in 2013 and another 8 new units completed in 2014
MT%
2.44.8
0.41.2
2.9 7.5
4.7 11.3
3.5 7.7
2.54.8
2.7 4.9
Growth per annum
88%
90%
4.0
5.02014.
Utilisation rates drop from the high 80’s to the low 80’s.
Asset clos res (or idling) in Korea
84%
86%
2 0
3.0
n To
nnes
Asset closures (or idling) in Korea, Japan and Taiwan has been underway for 8 months. Anticipate similar asset outages in Europe and
80%
82%
1.0
2.0
Milli
on
g pNorth America.
Further slowing of announced investments anticipated to allow
76%
78%
-1.0
0.0
2012 2013 2014 2015 2016 2017 2018
some margin recovery in the 2017+ time frame.
2012 2013 2014 2015 2016 2017 2018
North America South AmericaEurope Middle East/AfricaAsia/Far East Utilisation (RHS)
Thursday 30 October 2014 Mumbai2014Indian Petrochem Conference
( )

India Paraxylene Supply Demand
Capacity doubles in a 2 year period
New investment supports downstream growth
94%7 p y y p
OMPL and RIL both have integration links to PTA (JBF and RIL)90%
92%
5
6
Utilization rates ease as potential for PTA and PX exports is limited
84%
86%
88%
4
5
on T
onne
s
80%
82%
84%
2
3
Mill
io
76%
78%
80%
0
1
2013 2014 2015 2016 2017 2018
Total Production Total ConsumptionCapacity Utilisation Rate
Thursday 30 October 2014 Mumbai2014Indian Petrochem Conference
p y

Paraxylene Capacity Status 2014Country Location Company Nameplate
Capacity or Expansion
(Thousand Tonnes)
Feedstock Actual or Proposed Startup
China Sichuan, Pengzhou Petrochina Sichuan Petrochemical 650 HVN Q1 2014
China Hainan, Yangpu Sinopec Hainan Refining 1 600 HVN Q1 2014
Japan Mats ama TS Aromatics 290 MX Q1 2014Japan Matsuyama TS Aromatics -290 MX Q1 2014
Saudi Arabia Al-Jubail SATORP 660 HVN Q1 2014
Korea Ulsan Ulsan Aromatics 1,000 MX/C7/C9 Q2 2014
India Mangalore ONGC Mangalore Petrochemicals 920 HVN Q3 2014
Korea Daesan Samsung Total 2 1,000 COND Q3 2014
Korea Inchon SK Energy 1,300 COND Q3 2014gy ,
Singapore Jurong Jurong Aromatics Corp 800 COND Q3 2014
Algeria Skikda Sonatrach 220 HVN Q4 2014
2014 Total 6 8602014 Total 6,860
Thursday 30 October 2014 Mumbai2014Indian Petrochem Conference

Paraxylene Capacity Status 2015-2016
Country Location Company Nameplate Capacity or
Feedstock Actual or Proposed
Expansion (Thousand Tonnes)
Startup
Kazakhstan Atyrau JSC KazMunaiGas 469 HVN Q2 2015
India Jamnagar Reliance Industries 4 2,250 HVN Q3 2015
Thailand Mab ta Phut PTTGC 120 HVN Q3 2015
2015 Total 2,839
Thailand Mab ta Phut PTTGC 85 MX Q1 2016
Thailand Mab ta Phut PTTGC 40 MX Q1 2016
Saudi Arabia Rabigh PetroRabigh 1,300 HVN Q3 2016
2016 Total 1,325
Thursday 30 October 2014 Mumbai2014Indian Petrochem Conference

Key Country PX Trade Flow Changes 2013-2018
6
7
4
5
6
2
3
4
n To
nnes
0
1
2
Mill
ion
2
-1
0
-2Korea Japan Singapore KSA India Indonesia Taiwan
2013 2014 2015 2016 2017 2018
Thursday 30 October 2014 Mumbai2014Indian Petrochem Conference

Cost Curve April 2014 (Asia Spot $1,209, PX-Naphtha $270)
Brent Crude Oil $108.15/barrel$
STDP $1,130
MX $1,200
TA $1 310TA $1,310
Chart Source: PCI’s Online Paraxylene Global Cost Model
Thursday 30 October 2014 Mumbai2014Indian Petrochem Conference

PCI Cost Model PX-Naphtha Values for March 2015 PX Forecast
$/Tonne Constrained Unconstrained
Cash Cost Breakeven 300 260Variable Cost B k 260 210Breakeven 260 210
Constrained = Production Balance, Supply=DemandUnconstrained = Supply>Demand, High Level of Competition
PCI PX-Naphtha Spread Forecast $280/tonne
Transalkylation Variable Costs economic assumes constrained yproduction with marginal assets not quite covering full cash costs
Thursday 30 October 2014 Mumbai2014Indian Petrochem Conference

PCI Cost Model PX-Naphtha Values for June 2015 PX Forecast
$/Tonne Constrained Unconstrained
Cash Cost Breakeven 410 330Variable Cost B k 370 300Breakeven 370 300
Constrained = Production Balance, Supply=DemandUnconstrained = Supply>Demand, High Level of Competition
PCI PX-Naphtha Spread Forecast $350/tonne
Transalkylation Variable Costs not quite covered assumes y qconstrained production with marginal assets not quite covering variable costs
Thursday 30 October 2014 Mumbai2014Indian Petrochem Conference

A Future for ACP?
PX and PTA ACP negotiators should be able to support downstream polyester markets, end uncertainty and fix monthly ACP if PTA cost-plus system remains intactplus system remains intact.
PTA sector still needs to robustly negotiate PX values to protectPTA sector still needs to robustly negotiate PX values to protect integrity of polyester chain economics both upstream and downstream.
Stability and pricing visibility is more likely to lead to stronger growth than opaque, retrospective price-setting mechanisms of the past 8 months.
ACP should survive and provide a platform for polyester chain economics to be visible and support positive decision-making in every sector.
Thursday 30 October 2014 Mumbai2014Indian Petrochem Conference

Paraxylene Summary
PCI’s Online Paraxylene Global Cost Model indicates PX-Naphtha spread of between $280 and $350 per tonne, depending on the t th f th li lt tistrength of the gasoline alternatives.
This period of low PX margins is likely to last though 2016 with p g y grecovery beyond this dependent on slowing of announced investments to allow some margin recovery in the 2017+ time frame.
PX asset idling and rationalisation in all regions.
I di f th j t i 2015 17 b t b l India emerge as one of the major export in 2015-17 but balance stabilizes on robust local demand growth.
Thursday 30 October 2014 Mumbai2014Indian Petrochem Conference
Changing Landscape for PTA 2015-17
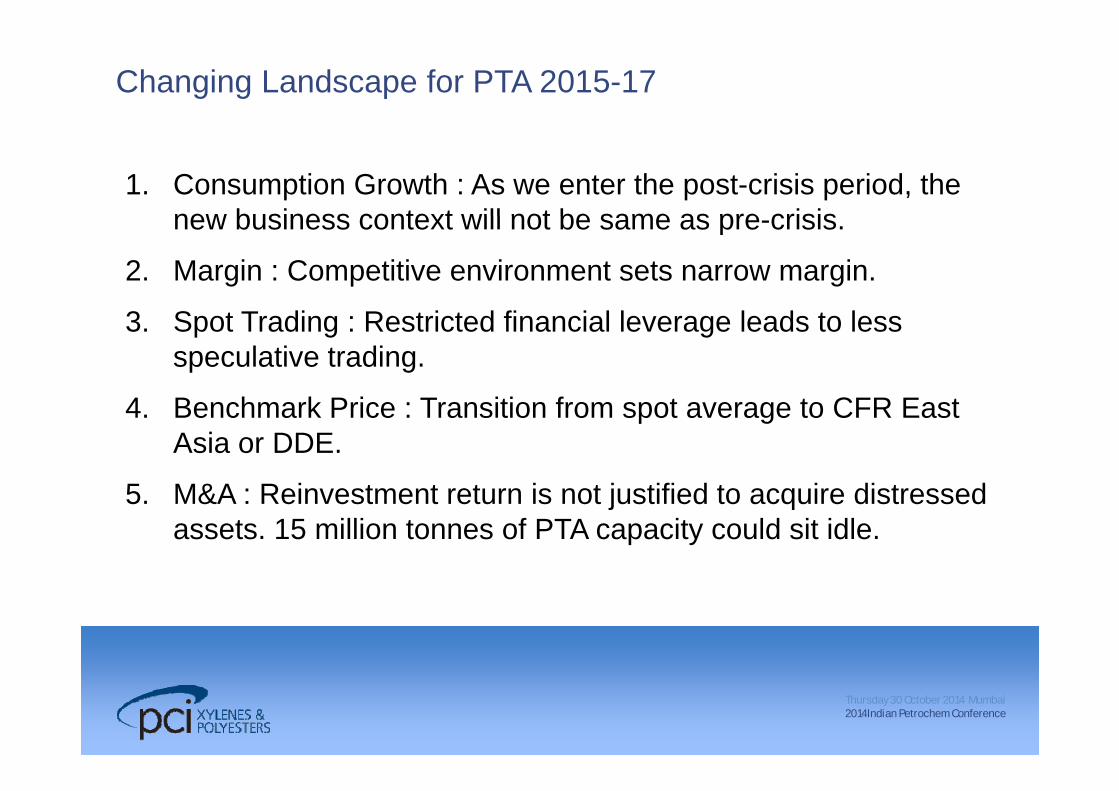
1. Consumption Growth : As we enter the post-crisis period, the new business context will not be same as pre crisisnew business context will not be same as pre-crisis.
2. Margin : Competitive environment sets narrow margin.
3. Spot Trading : Restricted financial leverage leads to less speculative trading.
4. Benchmark Price : Transition from spot average to CFR East Asia or DDE.
5 M&A R i t t t i t j tifi d t i di t d5. M&A : Reinvestment return is not justified to acquire distressed assets. 15 million tonnes of PTA capacity could sit idle.
Thursday 30 October 2014 Mumbai2014Indian Petrochem Conference

World PTA Supply Demand
Demand growth remains 95%90
solid at 6% +.
Overcapacity in Asia set to d i t k t d i80%
85%
90%
60
70
80
s dominate market dynamics for next 3 years.
Plant closures are being70%
75%
80%
40
50
60
lion
Tonn
es
Plant closures are being seen, mostly in Asia but do little to offset surplus 60%
65%
70%
20
30
40
Mill
capacity.
Production discipline in 2011 2012 2013 2014 2015 2016
50%
55%
0
10
China is the key to market stability.
2011 2012 2013 2014 2015 2016
Total Production Total ConsumptionCapacity Utilisation Rate
Thursday 30 October 2014 Mumbai2014Indian Petrochem Conference

Indian Subcontinent PTA Supply Demand
One of few current net Market will be in transition in 2015
90%9import areas but 1 million tonne import disappear in 201586%
88%
90%
7
8
9
2015.
Demand growth forecast at 9%82%
84%
86%
5
6
n To
nnes
9%.
Large scale PTA capacity growth will swing India’s 78%
80%
82%
2
3
4
Mill
ion
g gtrade position.
Reliance and JBF start-ups 74%
76%
0
1
2
will directly impact Korea/Thailand balances.
2011 2012 2013 2014 2015 2016
Total Production Total ConsumptionCapacity Utilisation Rate
Thursday 30 October 2014 Mumbai2014Indian Petrochem Conference

Monthly PX Price Page
FAR EAST 24-Jun-14 31-Jul-14 29-Aug-14PTA PCI Index * CFR $/tonne 974 1 018 1 1 030PTA PCI Index CFR $/tonne 974 1,018 1,030PTA East Asia (new price) CFR $/tonne n/a n/a 1,020PTA China Domestic DEL RMB/tonne 7,450 7850-7900 7675-7750PTA China Delivered Dollar
Eq i alent (ne price)DDE DEL $/tonne n/a n/a 1,011
Equivalent (new price)
PTA China Imports CFR $/tonne 955-965 995-1105 1 1000-1020PTA China Spot * CFR $/tonne 897-977 960-1009 990-1035PTA China ChiPIX * CFR $/tonne 956.35 994.17 1011.71PTA India Domestic EXW Rs/tonne 64,300 67,400 71,700PTA Pakistan L/C opening CFR $/tonne 995 1,020 1 1,033DMT Imports CFR $/tonne 1420-1430 1480-1490 1455-1465MEG PCI L/C opening CFR $/tonne 1065-1090 1110-1130 1140-1150MEG PCI L/C opening CFR $/tonne 1065 1090 1110 1130 1140 1150Methanol Imports CFR $/tonne 430 410 410PET Resin Exports FOB $/tonne 1300-1350 1350-1400 1320-1350Polyester Chip Imports CFR $/tonne 1250-1260 1290-1300 1290-13001 5 d St l R i l CFR ¢/lb 60 66 64 68 62 671.5 den Staple Regional CFR ¢/lb 60-66 64-68 62-67150 den POY Regional CFR ¢/lb 59-61 59-61 60-61Exchange Rate Average Indian Rupee : US$ 59.74 60.06 60.92Exchange Rate Average Chinese RMB : US$ 6.23 6.2 6.16
Thursday 30 October 2014 Mumbai2014Indian Petrochem Conference

Outlook for PTA
Asia margins could be volatile as China’s production discipline will be constantly challenged by themselveswill be constantly challenged by themselves.
Rate of investment is slowing, but capacity will continue to be added into 2015 driving down overall industry utilizationadded into 2015, driving down overall industry utilization.
Plant closures have been carried out and more are planned, but are too small and too few to have any meaningful impact onare too small and too few to have any meaningful impact on utilisation and margin in the next 18 months.
Asset renewal is one of the few options for survival, but this canAsset renewal is one of the few options for survival, but this can lead to further unwanted capacity, keeping margins persistently low and extending to current down cycle for several more years tto come.
Thursday 30 October 2014 Mumbai2014Indian Petrochem Conference
World Polyester Forecast
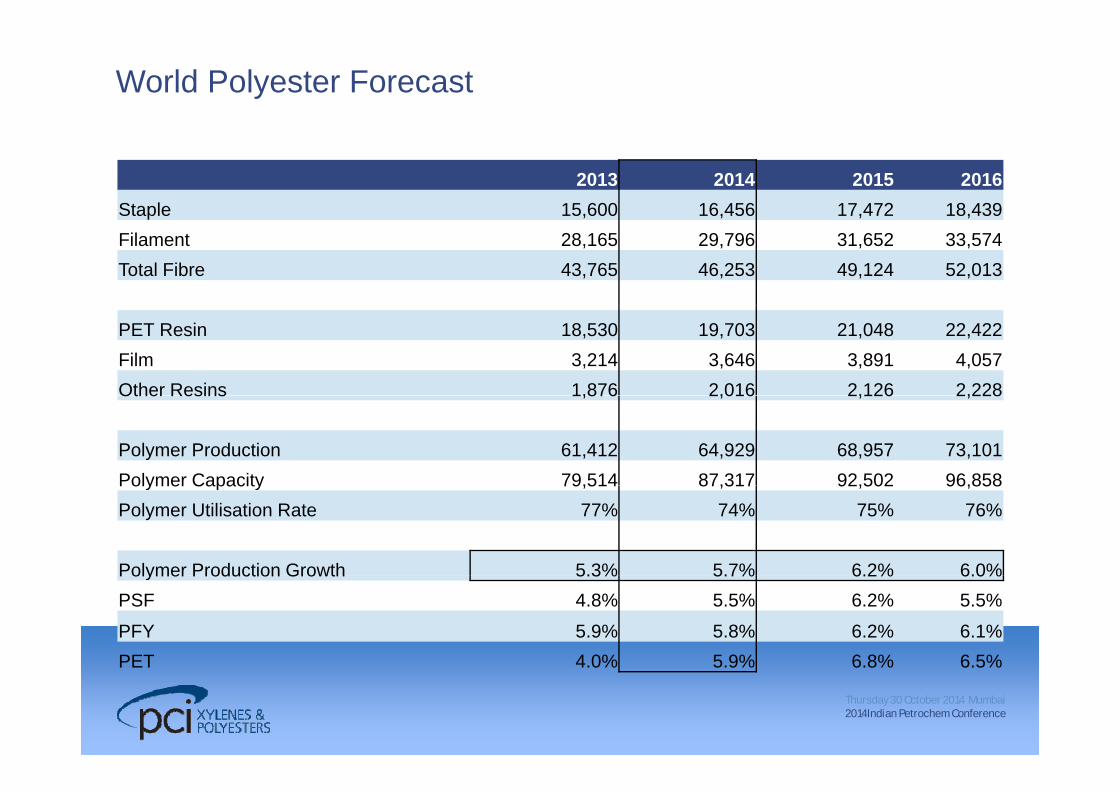
2013 2014 2015 2016Staple 15,600 16,456 17,472 18,439p , , , ,Filament 28,165 29,796 31,652 33,574Total Fibre 43,765 46,253 49,124 52,013
PET Resin 18,530 19,703 21,048 22,422Film 3,214 3,646 3,891 4,057Other Resins 1,876 2,016 2,126 2,228Other Resins 1,876 2,016 2,126 2,228
Polymer Production 61,412 64,929 68,957 73,101Polymer Capacity 79,514 87,317 92,502 96,858Polymer Capacity 79,514 87,317 92,502 96,858Polymer Utilisation Rate 77% 74% 75% 76%
Polymer Production Growth 5.3% 5.7% 6.2% 6.0%Polymer Production Growth 5.3% 5.7% 6.2% 6.0%PSF 4.8% 5.5% 6.2% 5.5%
PFY 5.9% 5.8% 6.2% 6.1%PET 4 0% 5 9% 6 8% 6 5%
Thursday 30 October 2014 Mumbai2014Indian Petrochem Conference
PET 4.0% 5.9% 6.8% 6.5%

China textile mill consumption
60000
'000 tonnes
50000
60000WoolAcrylicPolypropylene
Source: PCI Fibres Green Book.
40000
yp pyNylon stapleNylon carpet filamentNylon industrial + other fil
20000
30000 Nylon textile filamentCellulosicPolyester staple
10000
Polyester other filamentPolyester industrial filamentPolyester textile filament
0
2000
2001
2002
2003
2004
2005
2006
2007
2008
2009
2010
2011
2012
2013
2014
2015
2016
2017
2018
Cotton
Thursday 30 October 2014 Mumbai2014Indian Petrochem Conference

China Polyester Forecast
2013 2014 2015 2016Staple 9,748 10,137 10,832 11,482Staple 9,748 10,137 10,832 11,482Filament 19,873 21,092 22,519 24,110Total Fibre 29,621 31,229 33,351 35,592
PET Resin 5,332 5,550 5,670 5,851Film 961 1,213 1,333 1,383Other Resins 243 258 284 320
Polymer Production 33,052 34,789 36,798 39,050Polymer Capacity 39,856 44,874 47,783 50,712y p y , , , ,Polymer Utilisation Rate 82.9% 77.5% 77.0% 77.0%
Polymer Production Growth 7.7% 5.3% 5.8% 6.1%yPSF 4.9% 4.0% 6.9% 6.0%PFY 6.6% 6.1% 6.8% 7.1%PET 14.2% 4.1% 2.2% 3.2%
Thursday 30 October 2014 Mumbai2014Indian Petrochem Conference

India Polyester Forecast
2013 2014 2015 2016Staple 1,230 1,335 1,450 1,590Staple 1,230 1,335 1,450 1,590Filament 2,890 3,130 3,320 3,530Total Fibre 4,120 4,465 4,770 5,120
PET Resin 900 1,020 1,140 1,320Film 393 430 480 540Other Resins 12 10 10 10
Polymer Production 5,210 5,664 6,124 6,676Polymer Capacity 7,044 7,735 8,488 8,887y p y , , , ,Polymer Utilisation Rate 73.8% 73.1% 72.0% 75.1%
Polymer Production Growth 9.5% 8.8% 8.1% 9.2%yPSF 9.4% 8.5% 8.6% 9.7%PFY 7.0% 8.3% 6.1% 6.3%PET 25.0% 13.3% 11.8% 15.8%
Thursday 30 October 2014 Mumbai2014Indian Petrochem Conference

India textile mill consumption
14000
'000 tonnes
12000
14000WoolAcrylicPolypropylene
Source: PCI Fibres Green Book.
8000
10000yp py
Nylon stapleNylon carpet filamentNylon industrial + other fil
4000
6000Nylon textile filamentCellulosicPolyester staple
2000
4000 Polyester other filamentPolyester industrial filamentPolyester textile filament
0
2000
2001
2002
2003
2004
2005
2006
2007
2008
2009
2010
2011
2012
2013
2014
2015
2016
2017
2018
Cotton
Thursday 30 October 2014 Mumbai2014Indian Petrochem Conference

Asia Polyester Production Growth by Key Country 2013-2020
18 020.0
18.1A A l G th
12 014.016.018.0
es
18.1Average Annual GrowthChina vs India 2011‐2015 2016‐2020
China 2.3 2.6
India 0 370 0 734
8.010.012.0
lion
Tonn
e India 0.370 0.734
India Growth as % of China 16% 28%
2.04.06.0
Mill
3.1 2.4 2.93.2 2.4
-2.00.0
2011 2012 2013 2014 2015 2016-2020 CumulativeCumulative
Growth
China India Korea Taiwan Indonesia Thailand
Thursday 30 October 2014 Mumbai2014Indian Petrochem Conference

Polyester Staple Supply/Demand - India
ti t'000 t
Production Mill Consumption Capacity Utilisation
100%2500
operating rate'000 tonnes
Source: PCI Fibres Green Book.
60%
80%
1500
2000
40%1000
20%500
0%0
2000
2001
2002
2003
2004
2005
2006
2007
2008
2009
2010
2011
2012
2013
2014
2015
2016
2017
2018
Thursday 30 October 2014 Mumbai2014Indian Petrochem Conference

Polyester Filament Supply/Demand - India
Production Mill Consumption Capacity Utilisation
100%6000operating rate'000 tonnes
Source: PCI Fibres Green Book.
60%
80%
3600
4800
40%2400
20%1200
0%0
2000
2001
2002
2003
2004
2005
2006
2007
2008
2009
2010
2011
2012
2013
2014
2015
2016
2017
2018
Thursday 30 October 2014 Mumbai2014Indian Petrochem Conference

Global Trade Flows Forecast-PET
4000
2000
3000
0
1000
2012 2013 2014 2015 2016 2017 2018Metri
c Ton
s
-2000
-1000
2012 2013 2014 2015 2016 2017 2018
000 M
-4000
-3000
4000North America South America West EuropeEast Europe Africa & Middle East Indian SubcontinentChina NE Asia Rest of Asia
Thursday 30 October 2014 Mumbai2014Indian Petrochem Conference

Polyester Profitability ($/ton equivalent)
250
300
150
200
50
100
100
-50
0
-150
-100
Jul Aug Sep Sep W3 Sep W4 Oct W1 Oct W2
SD Polyester Chip PSF POY PET FDY DTY
Thursday 30 October 2014 Mumbai2014Indian Petrochem Conference

Outlook for Polyester
Margin cycle may have bottomed out for polyester, with increasingly competitive PX/PTA prices giving some positiveincreasingly competitive PX/PTA prices giving some positive outlook.
Inventory release from China’s cotton stockpile may negatively Inventory release from China s cotton stockpile may negatively impact PSF.
Scale investment continues to drive the business cycleScale investment continues to drive the business cycle, although at reduced rate.
Many polyester assets sit idle in China, Korea, and Taiwan butMany polyester assets sit idle in China, Korea, and Taiwan but those plants are likely to be scrapped as M&A options are limited.
Thursday 30 October 2014 Mumbai2014Indian Petrochem Conference
17th Oct 2014
PX = Spot CFR Taiwan/China PTA = Spot CFR China MEG = Spot CFR China SD polyester chip = ex-works All information has been obtained in good faith from market sources but PCI Xylenes & Polyesters Ltd accepts no liability whatsoever for any commercial decisions based on this report. For detailed methodology of the assessment please email [email protected]
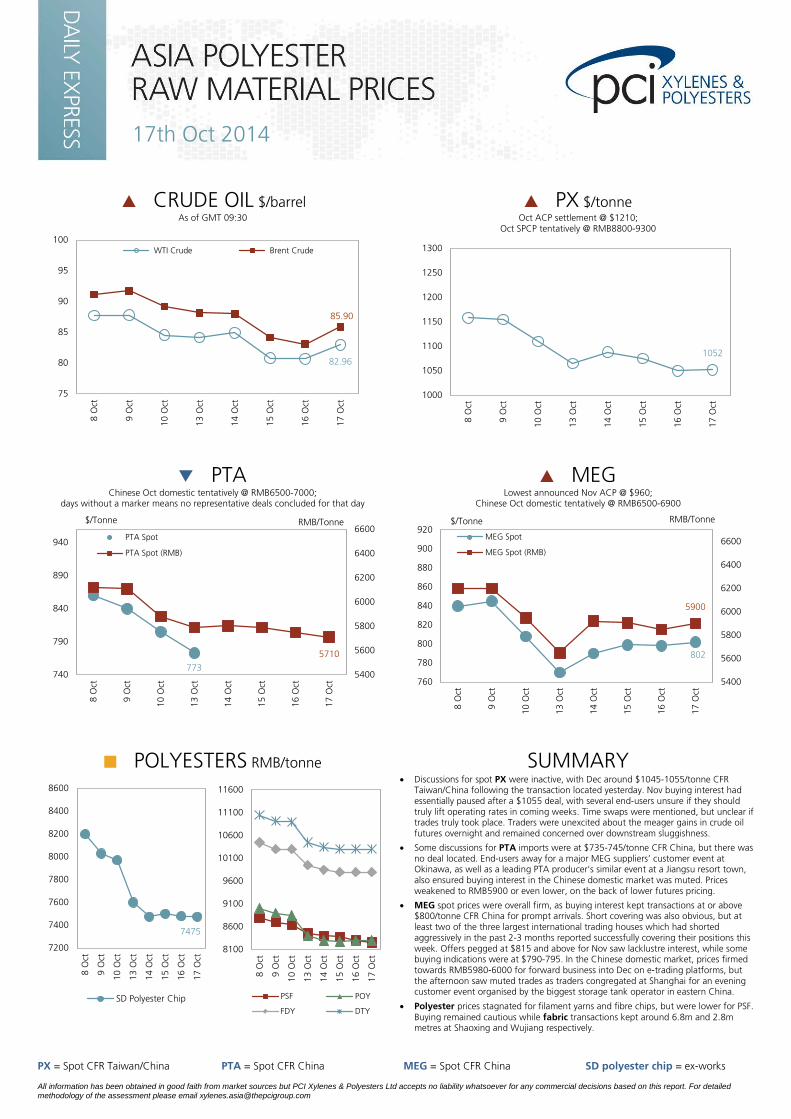
CRUDE OIL $/barrel As of GMT 09:30
PX $/tonne Oct ACP settlement @ $1210;
Oct SPCP tentatively @ RMB8800-9300
PTA Chinese Oct domestic tentatively @ RMB6500-7000;
days without a marker means no representative deals concluded for that day
MEG Lowest announced Nov ACP @ $960;
Chinese Oct domestic tentatively @ RMB6500-6900
POLYESTERS RMB/tonne
SUMMARY • Discussions for spot PX were inactive, with Dec around $1045-1055/tonne CFR
Taiwan/China following the transaction located yesterday. Nov buying interest had essentially paused after a $1055 deal, with several end-users unsure if they should truly lift operating rates in coming weeks. Time swaps were mentioned, but unclear if trades truly took place. Traders were unexcited about the meager gains in crude oil futures overnight and remained concerned over downstream sluggishness.
• Some discussions for PTA imports were at $735-745/tonne CFR China, but there was no deal located. End-users away for a major MEG suppliers’ customer event at Okinawa, as well as a leading PTA producer’s similar event at a Jiangsu resort town, also ensured buying interest in the Chinese domestic market was muted. Prices weakened to RMB5900 or even lower, on the back of lower futures pricing.
• MEG spot prices were overall firm, as buying interest kept transactions at or above $800/tonne CFR China for prompt arrivals. Short covering was also obvious, but at least two of the three largest international trading houses which had shorted aggressively in the past 2-3 months reported successfully covering their positions this week. Offers pegged at $815 and above for Nov saw lacklustre interest, while some buying indications were at $790-795. In the Chinese domestic market, prices firmed towards RMB5980-6000 for forward business into Dec on e-trading platforms, but the afternoon saw muted trades as traders congregated at Shanghai for an evening customer event organised by the biggest storage tank operator in eastern China.
• Polyester prices stagnated for filament yarns and fibre chips, but were lower for PSF. Buying remained cautious while fabric transactions kept around 6.8m and 2.8m metres at Shaoxing and Wujiang respectively.
82.96
85.90
75
80
85
90
95
100
8 O
ct
9 O
ct
10 O
ct
13 O
ct
14 O
ct
15 O
ct
16 O
ct
17 O
ct
WTI Crude Brent Crude
1052
1000
1050
1100
1150
1200
1250
1300
8 O
ct
9 O
ct
10 O
ct
13 O
ct
14 O
ct
15 O
ct
16 O
ct
17 O
ct
773
5710
5400
5600
5800
6000
6200
6400
6600
740
790
840
890
940
8 O
ct
9 O
ct
10 O
ct
13 O
ct
14 O
ct
15 O
ct
16 O
ct
17 O
ct
RMB/Tonne $/Tonne
PTA Spot
PTA Spot (RMB)
802
5900
5400
5600
5800
6000
6200
6400
6600
760
780
800
820
840
860
880
900
920
8 O
ct
9 O
ct
10 O
ct
13 O
ct
14 O
ct
15 O
ct
16 O
ct
17 O
ct
RMB/Tonne $/Tonne
MEG Spot
MEG Spot (RMB)
7475
7200
7400
7600
7800
8000
8200
8400
8600
8 O
ct
9 O
ct
10 O
ct
13 O
ct
14 O
ct
15 O
ct
16 O
ct
17 O
ct
SD Polyester Chip
8100
8600
9100
9600
10100
10600
11100
11600
8 O
ct
9 O
ct
10 O
ct
13 O
ct
14 O
ct
15 O
ct
16 O
ct
17 O
ct
PSF POY
FDY DTY

13th Oct 2014
NOTE: Spot prices reflect weekly averages extracted from PCI’s Daily Express Report. Please contact Salmon Lee, [email protected], if you require a copy of the methodology. Key: PCI Index = Weighted PCI Price in Asia; ChiPIX = PCI monthly mean price CFR China; SD Polyester Chip, PSF, POY, PET = ex-works RMB converted to US$; F = Forecast; T = Tentative, TBC=To be confirmed; SA = Spot Price Average (no contract settlement) All information has been obtained in good faith from market sources but PCI Xylenes & Polyesters Ltd accepts no liability whatsoever for any commercial decisions based on this report.
CRUDE OIL $/barrel
PARAXYLENE $/tonne
PTA $/tonne + RMB/tonne
MEG $/tonne + RMB/tonne
PRICES AT A GLANCE
WEEKLY Oct W1 Oct W2 Week-on-Week
Trend One-Week Projection
Crude Oil WTI Contract $/Barrel 91.44 87.62 N/A Crude Oil Brent $/Barrel 93.30 90.09 N/A Paraxylene Spot (Taiwan/China) CFR $/Tonne 1243 1141 PTA* Weekly Spot Average (China domestic) RMB/Tonne 6525 6036 MEG Weekly Spot Average (China) CFR $/Tonne 897 831 MEG Weekly Spot Average RMB/Tonne 6548 6116 DEG Weekly Spot (China) CFR $/Tonne 1165 1085 DEG Weekly Spot (East China) RMB/Tonne 8800 8250 DEG Weekly Spot (South China) RMB/Tonne 8850 8300
MONTHLY Sep Oct Monthly Trend One-Month Projection
Paraxylene Asian Contract Price CFR $/Tonne 1254SA 1210 Paraxylene SPCP China domestic contract RMB/Tonne 9150 8800T PTA** ChiPIX (China) CFR $/Tonne N/A N/A - PTA*** East Asia CFR $/Tonne 930 829F PTA Chinese domestic contract RMB/Tonne 6900-7050 6500-7000T PTA*** Delivered Dollar Equivalent CFR $/Tonne 919 856T PTA Contract (China) CFR $/Tonne 930 N/A MEG Lowest announced ACP (Asia) CFR $/Tonne 1150 1100T MEG ChiPIX (China) CFR $/Tonne 929.10 830F MEG Chinese domestic contract RMB/Tonne 7075 6500
* quoted in RMB/tonne from September 2014; ** to be discontinued after December 2014; ***new Asia PTA price series
102.92
96.38 93.21 93.54 93.11
91.44
87.62
106.52
101.28
97.14 96.84 95.10
93.30
90.09
Jul Aug Sep Sep W3 Sep W4 Oct W1 Oct W2
WTI Brent Crude Oil
1415SA
1356SA
1255SA 1210
1105 1100
1415
1356
1254 1243 1251 1243
1141
Jul Aug Sep Sep W3 Sep W4 Oct W1 Oct W2 Oct Nov F Dec F
Contract Spot
1000 1010
1018 1029
943
994.17 1011.71 930
829 789 796
6680 6608 6525
6036
7875 7713
6975
Jul Aug Sep Sep W3 Sep W4 Oct W1 Oct W2 Oct F Nov F Dec F
CFR China (Contract) PCI Index ChiPIX CFR East Asia Spot (RMB) China Contract (RMB)
1110 1140 1150 1100
929 891 897 831 830
780 780
991.87 990.81 929.10
1220 1165 1165
1085
6850 6553 6548
6116
Jul Aug Sep Sep W3 Sep W4 Oct W1 Oct W2 Oct F Nov F Dec F
MEG Lowest Announced ACP MEG Spot
MEG ChiPIX DEG Spot
MEG Spot (RMB)
SA = no official settlement; spot price average

13th Oct 2014
NOTE: Spot prices reflect weekly averages extracted from PCI’s Daily Express Report. Please contact Salmon Lee, [email protected], if you require a copy of the methodology. Key: PCI Index = Weighted PCI Price in Asia; ChiPIX = PCI monthly mean price CFR China; SD Polyester Chip, PSF, POY, PET = ex-works RMB converted to US$; F = Forecast; T = Tentative, TBC=To be confirmed; SA = Spot Price Average (no contract settlement) All information has been obtained in good faith from market sources but PCI Xylenes & Polyesters Ltd accepts no liability whatsoever for any commercial decisions based on this report.
THE WEEK AT A GLANCE WTI & Brent Crude: A lacklustre global economy, falling US dollar and talk of extra supplies dragged energy levels lower.
PX: The Oct ACP settlement at $1210 and absence of Chinese players in the first half of the week, due to the seven-day National Day holiday, did not prevent PX spot prices falling. Traders all but gave up hope that Chinese end-users would absorb the stray spot volumes, even as Chinese PTA utilisation rates are expected to rise this month. Tumbling crude oil and naphtha futures weighed heavily on the broader aromatics sector, and all it needed was a poor showing in the downstream segments of the polyester chain to drag PX towards $1110-1115 by the end of the week.
PTA: Affected by the sharp decline in energy and PX values, PTA buying slowed considerably even as the Chinese players returned to the market after the National Day break mid-week. Sentiment was extremely bad, as those traders with regular supplies dumped whatever they had at hand for the month, convinced that prices could tumble further. That sent Chinese domestic prices on a downspin towards RMB6000 and below. It was similar for imports; prices look set to test $800 and below soon, and local Chinese pricing slipped below RMB5900 by Fri.
MEG: The price collapse in the chain spared few, and MEG spot values took a hard beating as well. Imports dived towards $800 by Fri, an almost $100 tumble since the start of the holidays. Many buyers defaulting for deals concluded earlier contributed to the panic, both on the import and the Chinese domestic arena. Shorting by several international traders also became intense after Wed. Consequently, domestic prices broke below RMB6000, and e-trading for forward business saw few participants for most of the week. A weak recovery later afternoon Fri saw some buying especially for short covering, but still not enough to reverse the overall downtrend for the week.
Futures & forward: PTA futures at Zhengzhou led the way down, while MEG e-trading platforms saw few players as the number of sellers far outstripped buyers.
Polyester Raw Material Costs: Any hope of a rebound in polyester values were smashed this week, when crude-oil, PTA and MEG all dived south. With leading producers in China actually forced to lower their PTA and MEG tentative pricing for the month sharply from the original RMB7000 and RMB6900 respectively buying all but came to a stop mid-week for filament yarns, even as fabric transactions persisted. Feeling uncertainty rather than despair, polyester producers scrambled to lower the offers of their products to move sales. This effort paid off and by the end of the week sales against daily output picked up again towards 100% or just below for most. But that also meant some gain in product inventories, already on the rise after the week-long holidays the week earlier. Fortunately, polyester profits remained intact theoretically, as feedstock costs fell more sharply. But this massive decline spells ill for the biggest of polyester producers which depend on contract PTA and MEG, as it was a foregone conclusion that raw material costs for the month earlier were much higher than the prevailing levels, and unless prices of their products stage a strong recovery later the month, it could still mean a significant squeeze on profits. For this reason if nothing else, buying of feedstocks slowed to a trickle among these polyester makers, further hurting the already badly bruised sentiment.
SPOT PRICE: PX ; PTA ; MEG ; DEG
SPOT PRICE PROJECTIONS:
PX ; PTA ; MEG ; DEG
UPSTREAM PRICES:
Crude ; Naphtha ; Mixed Xylene ; Ethylene
CHINESE ECONOMIC CLIMATE: Poor industrial performance at home, sub-par global economy prove double whammy
DOWNSTREAM MARKET CONDITIONS:
Polyester Utilisation Rates: 68-75% ↔
Daily Sales/Output Ratio: 50-120%
Downstream Demand: STABLE to SOFT Product/Inventories: 9-22 days
Price Trends: Price Projections:
Margins: Collapse in feedstock pricing smashes all hopes of price gains, but margins still positive for now
PRODUCTION NEWS MEG: The MTO based plant by Fund Energy (formerly Ningbo Heyuan or Skyford) in eastern China expected down for 2 weeks Nov, instead of the originally planned dates Oct. In Saudi Arabia, the JUPC 2 line of SABIC is planned for a shutdown starting this month, to facilitate change in reactors. Sister facility YANPET 2 will undergo a catalyst change this month, with downtime about 45 days. Next week: PTA updates.
CHINA CHARTS
POLYESTER PRICES VS FEEDSTOCK COSTS
DAILY FABRIC TRANSACTIONS Million Metres
POLYESTER PROFITABILITY $/tonne equivalent
950
1000
1050
1100
1150
1200
1250
1300
1350
Jul Aug Sep Sep W3
Sep W4
Oct W1 Oct W2 Oct F Nov F Dec F
$/tonne
Feedstock Portion SD Polyester Chip PSF POY PET
0
2
4
6
8
10
12
14
16
18
21 J
ul
28 J
ul
04 A
ug
11 A
ug
18 A
ug
25 A
ug
01 S
ep
08 S
ep
15 S
ep
22 S
ep
29 S
ep
06 O
ct
Shaoxing (China Textile City) Wujiang Shaoxing + Wujiang
-150
-100
-50
0
50
100
150
200
250
300
Jul Aug Sep Sep W3 Sep W4 Oct W1 Oct W2
SD Polyester Chip PSF POY PET FDY DTY


![Untitled-2 [radekoncar.com.mk]radekoncar.com.mk/wp-content/uploads/2019/06/Elektricni-ormari-.pdf · PP2 polyester PW3 polyester PP3 polyester PW4 polyester PP4 polyester PW5 polyester](https://static.documents.pub/doc/80x56/5fc2e1f5b98d77452302c149/untitled-2-pp2-polyester-pw3-polyester-pp3-polyester-pw4-polyester-pp4-polyester.jpg)