182
QlikView Developer August 2008 Release QlikView Version: 8.5 English

QlikView Developer
August 2008 Release
QlikView Version: 8.5 English

Copyright © 2008 QlikTech International AB, Sweden.
Under international copyright laws, neither the documentation nor the software may be copied, photocopied, reproduced, translated or reduced to any electronic medium or machine-readable form, in whole or in part, without the prior written permission of QlikTech International AB, except in the manner described in the software agree-ment.
Qlik®View and QlikTech are registered trademarks of QlikTech International AB.
Microsoft, MS-DOS, Windows, Windows NT, Windows 2000 Windows XP, Win-dows Vista, SQL Server, FoxPro, Excel, Access, ActiveX, the Internet Explorer logo, and MS Query are trademarks of Microsoft Corporation.
IBM, AS/400 and PowerPC are trademarks of International Business Machines Cor-poration.
Borland, Paradox and dBASE are trademarks of Borland International.
ORACLE and SQL*Net are trademarks of Oracle Corporation.
Apple, TimeType, Macintosh, PowerMacintosh and MacOS are trademarks of Apple Computer, Inc.
Release Date: August 2008
CONTENT
1 INTRODUCTION ................................................................................71.1 Who is QlikTech? ....................................................................................71.2 What is QlikView? ..................................................................................71.3 QlikView Developer ...............................................................................81.4 Course Logistics ....................................................................................101.5 Notes ......................................................................................................11
2 THE QLIK WHOLESALE TRADE (QWT) BUSINESS INTELLIGENCE PROJECT PLAN 13
2.1 Project plan review ...............................................................................13
3 A SHORT INTRODUCTION TO DATA STRUCTURES .............................153.1 Relational databases ..............................................................................153.2 Other data structures ..............................................................................16
4 QLIKVIEW DATA STRUCTURES ........................................................194.1 Comparing database structures to QlikView data structures .................194.2 Data structures in QlikView ..................................................................20
5 LOADING DATA INTO QLIKVIEW .......................................................235.1 Script editing .........................................................................................235.2 Edit Script Toolbar ................................................................................245.3 Edit Script Menu Commands ................................................................255.4 Statements Area ............................................................................................. 265.5 Edit Script Tool Pane ............................................................................265.6 Syntax ....................................................................................................305.7 Renaming a Field ..................................................................................33
6 DATA SOURCE FILES ...................................................................356.1 The QWT primary data source ..............................................................356.2 The QWT secondary data files ..............................................................36
7 CREATING THE SCRIPT ..................................................................377.1 Script generation ....................................................................................377.2 Creating a connection to the database ..................................................377.3 Reading tables into QlikView .............................................................40
8 EXERCISES .................................................................................478.1 Script Debugging ..................................................................................48
9 STRUCTURING THE SCRIPT ............................................................519.1 Creating tabs in the script .....................................................................51
3
10 DATA STRUCTURE OF THE LOADED DATA .......................................5710.1 The Table Viewer ...............................................................................5710.2 System fields .......................................................................................5910.3 The system tab ....................................................................................5910.4 The system table ..................................................................................6010.5 Document Properties: Tables page .....................................................61
11 SCRIPTING CONSIDERATIONS .........................................................6311.1 Reading the Shipments table ...............................................................6311.2 Synthetic key tables .............................................................................6411.3 Circular references ..............................................................................6611.4 Causes of circular references ..............................................................6711.5 Loosely Coupled Tables ......................................................................69
12 ADDING TEXT DATA ......................................................................7112.1 Employees ..........................................................................................7112.2 Offices ................................................................................................7212.3 Script generation using the Table Files Wizard .................................72
13 LOADING AN XML FILE ...................................................................7713.1 Loading a text file in XML Format .....................................................7713.2 Renaming fields using the Qualify statement .....................................79
14 KEY FIELDS ...................................................................................8314.1 Example predicament .........................................................................8314.2 How does this affect you? ..................................................................8314.3 Loading a field into a table multiple times .........................................8414.4 Using a record counter on key fields ..................................................8414.5 Does the chart really show what I want it to? ....................................85
15 EXERCISES ..................................................................................8716 GENERATING DATA IN THE QLIKVIEW SCRIPT ..................................89
16.1 Resident Load .....................................................................................8916.2 Advanced – Using Orders to determine Sales Person. .......................9116.3 Creating data using Load Inline and Autogenerate ............................9216.4 Inline tables ........................................................................................9216.5 Autogenerate tables ............................................................................98
17 MAPPING TABLES ..........................................................................9917.1 Mapping Quarters to the Orders table .................................................9917.2 MonthYear .........................................................................................10217.3 Cleaning up the table structure .........................................................103
18 EXERCISES .................................................................................107
4
19 CREATING A CALENDAR .............................................................10919.1 Getting the Highest and Lowest date from the Orders table .............10919.2 Creating variables in the script .........................................................11019.3 Creating the Master Calendar ...........................................................112
20 INCLUDE .....................................................................................11521 READING BUDGET INTO QLIKVIEW ................................................117
21.1 Reading Cross Tables .......................................................................11721.2 Adding an Input Field .......................................................................119
22 ADVANCED SCRIPTING ................................................................12122.1 Condition on a field in a table ..........................................................12122.2 Aggregating Data .............................................................................12222.3 Joining tables ....................................................................................12222.4 Concatenation ....................................................................................12322.5 Preceding Load on Preceding Load ...................................................127
23 EXERCISES ................................................................................12924 QLIKVIEW DATA (QVD) FILES ........................................................131
24.1 QVD file format ................................................................................13124.2 Use of QVD files ...............................................................................13124.3 Creating QVD files ............................................................................13224.4 Manual creation of a QVD file in the script ......................................13224.5 Automatic Creation of a QVD file in the script ................................13424.6 QVD file script functions ..................................................................136
25 NEW IN QLIKVIEW 8.5 ................................................................13725.1 Set Analysis .......................................................................................13725.2 Dollar-Sign Expansion ......................................................................14125.3 Set Analysis / Dollar-Sign Expansion Exercise ................................14225.4 Hierarchy Resolution .........................................................................14725.5 Hierarchy Resolution Exercise ..........................................................151
26 QLIKVIEW SECURITY ....................................................................15326.1 Access control ..................................................................................15326.2 Access levels ....................................................................................15326.3 Access control database ....................................................................15326.4 Inherited access restrictions ..............................................................15526.5 Hidden script ....................................................................................15626.6 Adding Section Access .....................................................................15626.7 Access control for certain commands ..............................................15826.8 Further access control ........................................................................16026.9 Unattended Command Line Reload Considerations ........................161
5
26.10 Access restrictions on selected field values ....................................16126.11 Field value limitation in Section Access .........................................162
27 REPORTING BUGS IN QLIKVIEW ...................................................16528 QLIKVIEW REFERENCE MATERIALS ...............................................167
APPENDIX
DATA TYPES IN QLIKVIEW ..................................................................171A.1 Data storage in QlikView .................................................................171A.2 Data containing information on data type .........................................171A.3 Data without information on data type ..............................................172A.4 Dates and times ..................................................................................173
THE FINAL SCRIPT..............................................................................175
6

INTRODUCTION
1 INTRODUCTIONThis chapter introduces QlikTech, and explains the differences between the QlikView products. It outlines the basic capabilities of QlikView Developer and the underlying contents of a QlikView file. It also lays out the format and structure of the rest of the manual, and guides the student through the installation of QlikView Developer and the course materials on their computer, setting up the interactivity and hands-on access required for remainder of the class.
1.1 Who is QlikTech?QlikTech was founded in Lund, Sweden in 1993. Today, research and development continue in Lund, and Radnor, Pennsylvania is both U.S. and International Headquar-ters. QlikTech has offices and partners around the world and is experiencing rapid and sustained growth.
Information is the lifeblood of any organization. It is the foundation of knowledge, and knowledge is the basis for appropriate action. This can be a distinct competitive advantage. QlikTech delivers fast, powerful and affordable data analysis and report-ing solutions, giving users clear insight and enhanced decision-making capabilities across the enterprise.
How does this happen? Through innovative technologies and unmatched customer service.
1.2 What is QlikView?QlikView is a revolutionary platform that simplifies analysis for everyone. It is user-friendly and provides superfast in-memory analysis capabilities by dynamically inte-grating and presenting data from multiple data sources, or a single Excel or text file.
QlikView provides analysis and reporting that is• Easy to use• Broadly distributed• Flexible• Insightful
QlikView files can be deployed to users on corporate networks or through sophisti-cated web-based portals and can be viewed in many different file types. Some of the more common analysis clients for QlikView files include Java Objects, Internet Explorer plug-in, AJAX (Asynchronus JavaScript and XML) Zero-Footprint and Windows-based Analyzers. QlikView analysis files can also be e-mailed, just like a Word or Excel document, and can be secured in many different ways. QlikView Developer files are created using QlikView Developer and QlikView Professional
©1996 - 2008 QlikTech International 7
and are deployed and distributed using QlikView Server and QlikView Publisher. Users access the files with QlikView Analyzer, which comes in various client types listed above.
1.2.1 The QlikView ProductsQlikView products include:• Developer — for the Developer (this course)• Professional — for the Power User • Analyzer — for the End User• Server — for Deployment• Publisher — for Distribution
1.3 QlikView Developer QlikView Developer is the toolkit for extracting, modeling and loading data. QlikView Professional is the designer’s toolkit for creating compelling QlikView lay-outs and design. This functionality is also available in QlikView Developer.
QlikView manages information like the human brain works. Just like the human brain, QlikView makes associative connections with the information being pro-cessed. You – not the database – decide which questions to ask. Just click on the item you want to know more about. Conventional information search systems often require a top-down approach, while QlikView allows you to get started with any piece of data regardless of its location in the data structure.
The retrieval of data in conventional systems is often a complex task requiring exten-sive knowledge of the structure of the databases and of the syntax of the query lan-guage. The user is frequently limited to predefined search routines. QlikView revolutionizes this by making it possible to select freely from data displayed on the screen with a click of the mouse.
QlikView can be used in many ways. QlikView helps you acquire a unified and coherent overview of the data in different databases and/or data sources - your own or someone else's, central or local. QlikView can be used with virtually any database and/or data source.
With QlikView you can• create a flexible end user interface to an information warehouse• get snapshots of data relations• make presentations based on your data• create dynamic graphical charts and tables• perform statistical analysis• link descriptions and multimedia to your data
8 ©1996 - 2008 QlikTech International
INTRODUCTION
• build your own expert systems• create new tables, merging information from several sources• build your own business intelligence system
Some examples of QlikView applications being used today are financial systems, human resources administration, market analysis, customer support, project adminis-tration, production control, stock inventories and purchasing. You can even mix the different applications to gain entirely new information overviews.
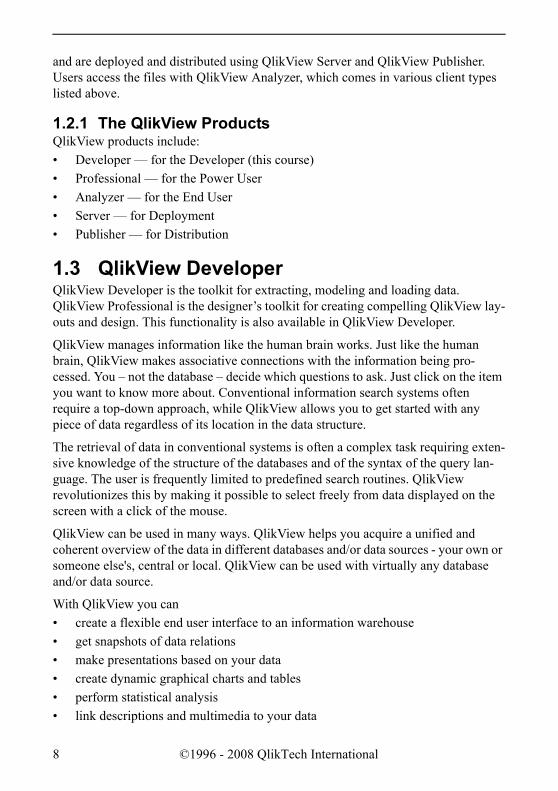
A QlikView file is not a full relational SQL (Structured Query Language) database in itself, although every one contains its own database that is updated every time the source data are refreshed. The contents of a typical QlikView file are shown, below:
We will be working on how to create a QlikView file from the beginning, focusing almost entirely on the script and using a few data display functionalities to ensure that data is interpreted in a correct way.
The next section will guide you through the process of installing QlikView Developer and the course materials on your computer.
Figure 1. The structure of a .QVW file and its relation to external data sources.
©1996 - 2008 QlikTech International 9

1.4 Course LogisticsYour instructor will have supplied the course materials and an evaluation copy of QlikView. Perform the following tasks to prepare your computer for the class. Do not worry if this has not been done before class time. It is a common starting point to kick off the training.
1.4.1 Step-by-Step Instructions for Preparing Your Computer for Class
The files for the installation of the evaluation copy of QlikView include:
QvSetupRedist_Eng.exe (or equivalent in your language, provided by your instructor)
The course materials include:
QlikViewDeveloperCourse.zip
To Install QlikView:
Note that the QvSetupRedist_Eng.exe file is the same installation package as for a licensed copy of the QlikView software, so if you have a license key, or antici-pate getting one, the QvSetupRedist_Eng.exe file can be used and the license key entered, either at installation or at any time during the evaluation period.
Please complete the following steps to install an evaluation copy of QlikView on your computer:
1 Shut down any open applications on your computer.
2 Place the QvSetupRedist_Eng.exe file in a folder (a folder located on your desktop is fine; you can delete it later).
3 Navigate to the QvSetupRedist_Eng.exe in the folder you just created and double-click on it.
4 A dialog box will appear. Click Run. The installation files will temporarily be extracted to your computer.
5 Follow the prompts to select the country in which the software will be used from the drop-down list.
6 Review and, to continue, accept the license agreement.
7 Type your name and your company name in the appropriate dialog box and check the box to allow “Anyone who uses this computer” to use QlikView.
10 ©1996 - 2008 QlikTech International

INTRODUCTION
Note if you do not enter a license key, you will be brought to the license key/eval-uate QlikView screen each time you run QlikView during your evaluation period. Be sure to check the Evaluate QlikView Developer radio button each time.
8 Accept the default location for QlikView: C:\Program Files\QlikView. Note: if you are installing on Vista or a 64-bit machine, please refer to the product documentation for more information.
9 Make sure the radio button for the Complete installation is selected. This will ensure that all the sample files, manuals and the API Guide are installed with the program
10 Complete the installation.
11 The first time you launch QlikView, you will be brought to a screen to enter your license information. Click on the Evaluate QlikView Developer radio but-ton if you do not have a license key. Your evaluation period includes fifteen days of use. The days need not be contiguous. You must agree to the evalua-tion conditions to move forward.
To Install the Course Materials:Extract the course materials from the QlikViewDeveloperCourse.zip file into the QlikView program folder that you created in when you installed the evaluation copy of QlikView. If you followed the instructions above, the directory is C:\Program Files\QlikView. When you have finished extracting the files, the path to your course materials will be C:\Program Files\QlikView\TrainingVersion8\QlikViewDevelo-perCourse.
Make a Windows shortcut to this folder and place it on your desktop.
Also, make a Windows shortcut to the documentation folder and place it on your desktop (see below): C:\Program Files\QlikView\Documentation
1.5 Notes1.5.1 Program versionsThis course was built using the English version of QlikView 8.5 running on Windows XP. Thus, if other operating systems or languages are used, minor differences may also be noted in the visual appearance of windows and dialog boxes.
©1996 - 2008 QlikTech International 11
1.5.2 Text formats of this materialExercises and actions to be completed by you, the student, will be set-off by the QlikView icon, as you see, below:
Do:This is a sample of instructions you would see to complete an exercise containing a sequence of steps –
1 Click on the Start button
2 Locate the QlikView icon
3 Click on the QlikView icon to launch the program
All commands, as well as all names of menus, dialogs and buttons are in the follow-ing font style: File - OpenAll names of list boxes, graphs and specific data in list boxes, etc. are in the follow-ing font style: Country
All file names are in the following font style: QlikViewDeveloperCourse.qvw
Tips and Notes are outlined on a gray background, as you see below:
This sample sentence is used to illustrate important points in the text, tips and notes to consider as you complete the course materials.
12 ©1996 - 2008 QlikTech International

THE QLIK WHOLESALE TRADE (QWT) BUSINESS INTELLIGENCE PROJECT
2 THE QLIK WHOLESALE TRADE (QWT) BUSINESS INTELLIGENCE PROJECT PLAN
The QWT Business Intelligence (BI) Project Plan has been included in this course as an example of a project plan you may receive in your normal working environ-ment. This is not meant to be a fully configured plan with time charts, responsibili-ties, etc. It is designed to provide you with an overall objective to be completed during the course. We will use the project plan as a guide for developing the load script required for the QlikView document deliverable. We will refer to the project plan document throughout the course, so you may want to keep the document open on your computer for easy access.
You will find the project plan in your course materials with the name QWT Business Intelligence Project Plan.pdf.
2.1 Project plan reviewIf you open the QWT Business Intelligence (BI) Project Plan document, you will find that it includes the following sections:
Key Measures: here you will find some of the expressions that will be required in the building of the QlikView document. Some of these calculations will be used in the load script, while others will be used within sheet objects such as charts, pivot tables, text boxes, etc.
Key Performance Indicators (KPIs): this section includes high level KPIs that can be displayed through a dashboard perspective in the QlikView document.
Key Dimensions: this section includes a list of some of the key dimensions that will be used throughout the application.
Trends: provides a list of the important time dimension fields that will be required to analyze trends over time.
Key Selection Filters: includes a list of the fields required in the QlikView document for the selection and filtering of data.
Security: contains the secured access requirements for the QlikView document.
Source Data Descriptions: provides source data locations and field level descrip-tions for each of the data sources.
©1996 - 2008 QlikTech International 13
Each of these sections may also include one or more Business Rules to help the appli-cation developer understand and deliver the appropriate features and functionality for the users of this QlikView document.
14 ©1996 - 2008 QlikTech International
A SHORT INTRODUCTION TO DATA STRUCTURES
3 A SHORT INTRODUCTION TO DATA STRUCTURES
In case you have not done much work with databases previously, we have provided a short introduction to the basics of data structures and databases. This introduction will assist you in creating QlikView documents based on your own data. If you are already familiar with these terms, you may skip this chapter.
3.1 Relational databasesData is typically stored in relational databases. Such databases include Microsoft SQL Server, Microsoft Access, Oracle, DB2, Sybase, Informix, and Teradata.
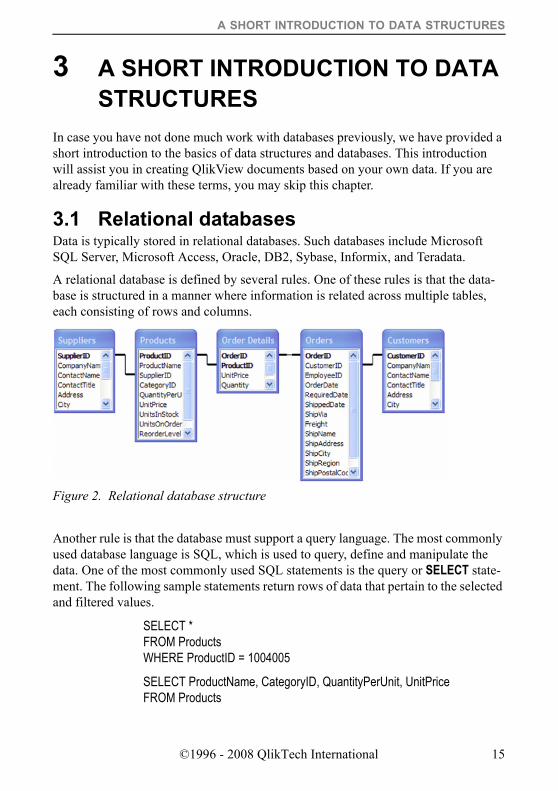
A relational database is defined by several rules. One of these rules is that the data-base is structured in a manner where information is related across multiple tables, each consisting of rows and columns.
Another rule is that the database must support a query language. The most commonly used database language is SQL, which is used to query, define and manipulate the data. One of the most commonly used SQL statements is the query or SELECT state-ment. The following sample statements return rows of data that pertain to the selected and filtered values.
SELECT * FROM Products WHERE ProductID = 1004005
SELECT ProductName, CategoryID, QuantityPerUnit, UnitPrice FROM Products
Figure 2. Relational database structure
©1996 - 2008 QlikTech International 15
WHERE ProductID = 1004005 OR ProductID = 1005006
Figure 3. Query examples from a relational database
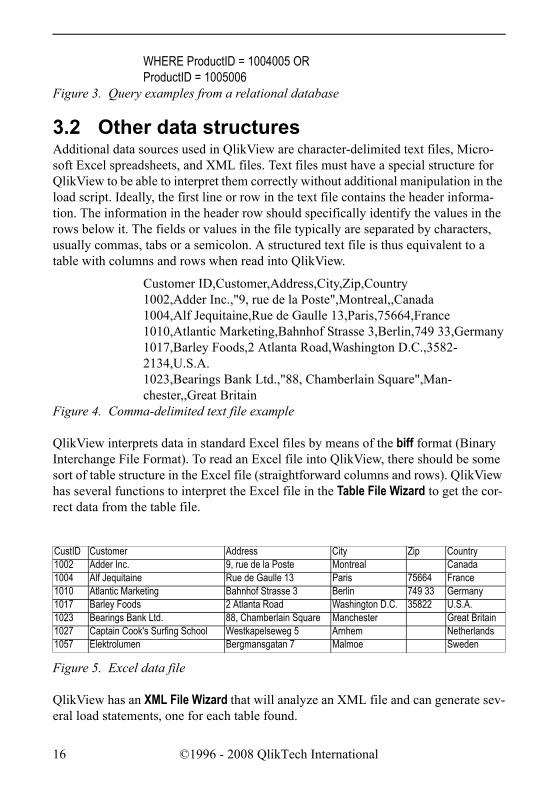
3.2 Other data structuresAdditional data sources used in QlikView are character-delimited text files, Micro-soft Excel spreadsheets, and XML files. Text files must have a special structure for QlikView to be able to interpret them correctly without additional manipulation in the load script. Ideally, the first line or row in the text file contains the header informa-tion. The information in the header row should specifically identify the values in the rows below it. The fields or values in the file typically are separated by characters, usually commas, tabs or a semicolon. A structured text file is thus equivalent to a table with columns and rows when read into QlikView.
Customer ID,Customer,Address,City,Zip,Country1002,Adder Inc.,"9, rue de la Poste",Montreal,,Canada1004,Alf Jequitaine,Rue de Gaulle 13,Paris,75664,France1010,Atlantic Marketing,Bahnhof Strasse 3,Berlin,749 33,Germany1017,Barley Foods,2 Atlanta Road,Washington D.C.,3582-2134,U.S.A.1023,Bearings Bank Ltd.,"88, Chamberlain Square",Man-chester,,Great Britain
Figure 4. Comma-delimited text file example
QlikView interprets data in standard Excel files by means of the biff format (Binary Interchange File Format). To read an Excel file into QlikView, there should be some sort of table structure in the Excel file (straightforward columns and rows). QlikView has several functions to interpret the Excel file in the Table File Wizard to get the cor-rect data from the table file.
Figure 5. Excel data file
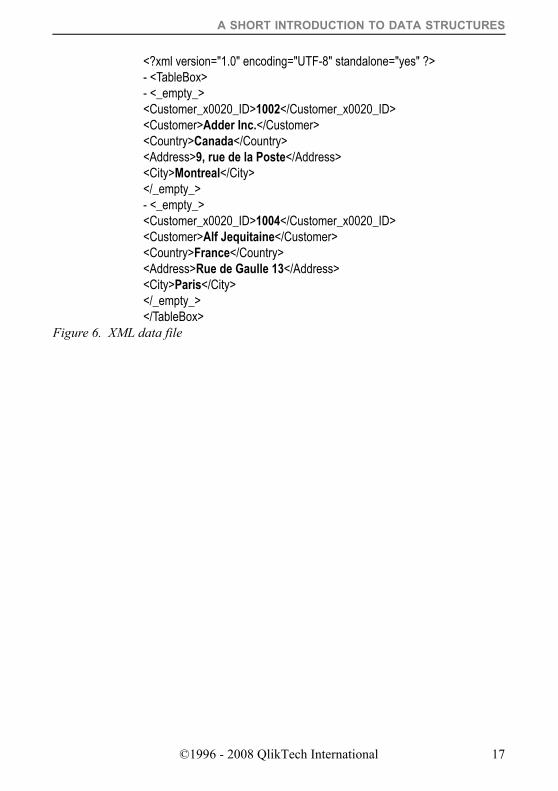
QlikView has an XML File Wizard that will analyze an XML file and can generate sev-eral load statements, one for each table found.
CustID Customer Address City Zip Country1002 Adder Inc. 9, rue de la Poste Montreal Canada1004 Alf Jequitaine Rue de Gaulle 13 Paris 75664 France1010 Atlantic Marketing Bahnhof Strasse 3 Berlin 749 33 Germany1017 Barley Foods 2 Atlanta Road Washington D.C. 35822 U.S.A.1023 Bearings Bank Ltd. 88, Chamberlain Square Manchester Great Britain1027 Captain Cook's Surfing School Westkapelseweg 5 Arnhem Netherlands1057 Elektrolumen Bergmansgatan 7 Malmoe Sweden
16 ©1996 - 2008 QlikTech International
A SHORT INTRODUCTION TO DATA STRUCTURES
<?xml version="1.0" encoding="UTF-8" standalone="yes" ?> - <TableBox> - <_empty_> <Customer_x0020_ID>1002</Customer_x0020_ID> <Customer>Adder Inc.</Customer> <Country>Canada</Country> <Address>9, rue de la Poste</Address> <City>Montreal</City> </_empty_> - <_empty_> <Customer_x0020_ID>1004</Customer_x0020_ID> <Customer>Alf Jequitaine</Customer> <Country>France</Country> <Address>Rue de Gaulle 13</Address> <City>Paris</City> </_empty_> </TableBox>
Figure 6. XML data file
©1996 - 2008 QlikTech International 17

18 ©1996 - 2008 QlikTech International
QLIKVIEW DATA STRUCTURES
4 QLIKVIEW DATA STRUCTURESThe QlikView data structure can be a bit different from the data structure of a rela-tional database. In this chapter we are going to talk about the QlikView data structure.
4.1 Comparing database structures to QlikView data structures
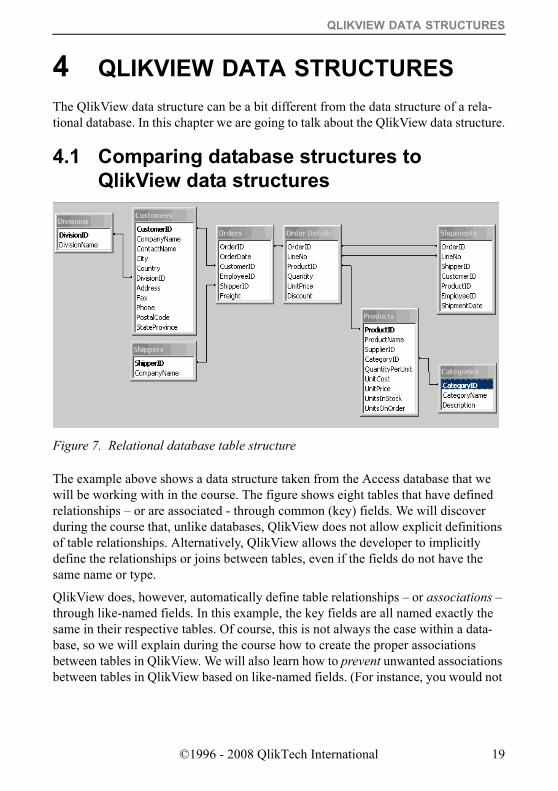
The example above shows a data structure taken from the Access database that we will be working with in the course. The figure shows eight tables that have defined relationships – or are associated - through common (key) fields. We will discover during the course that, unlike databases, QlikView does not allow explicit definitions of table relationships. Alternatively, QlikView allows the developer to implicitly define the relationships or joins between tables, even if the fields do not have the same name or type.
QlikView does, however, automatically define table relationships – or associations – through like-named fields. In this example, the key fields are all named exactly the same in their respective tables. Of course, this is not always the case within a data-base, so we will explain during the course how to create the proper associations between tables in QlikView. We will also learn how to prevent unwanted associations between tables in QlikView based on like-named fields. (For instance, you would not
Figure 7. Relational database table structure
©1996 - 2008 QlikTech International 19
want to link the Address field from a Supplier table to the Address field in the Cus-tomer table.) We will also learn how to associate other data, that may not necessarily be in database format (e.g. text files), to this data.
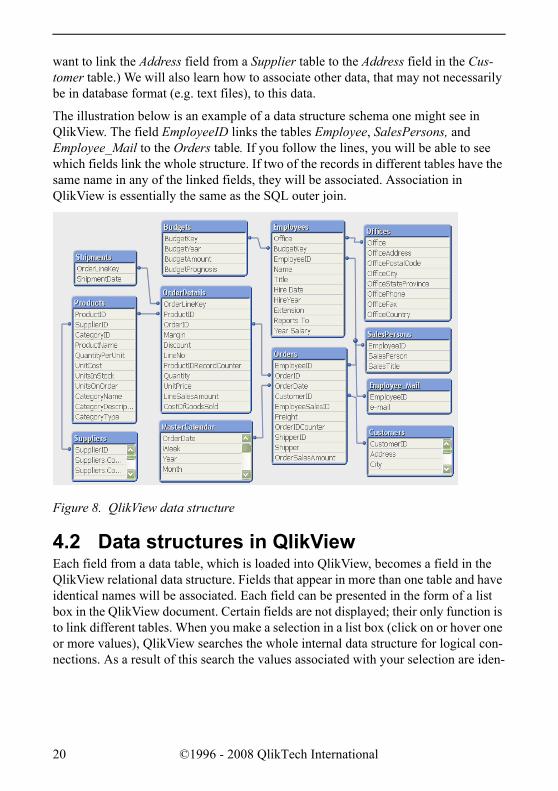
The illustration below is an example of a data structure schema one might see in QlikView. The field EmployeeID links the tables Employee, SalesPersons, and Employee_Mail to the Orders table. If you follow the lines, you will be able to see which fields link the whole structure. If two of the records in different tables have the same name in any of the linked fields, they will be associated. Association in QlikView is essentially the same as the SQL outer join.
4.2 Data structures in QlikViewEach field from a data table, which is loaded into QlikView, becomes a field in the QlikView relational data structure. Fields that appear in more than one table and have identical names will be associated. Each field can be presented in the form of a list box in the QlikView document. Certain fields are not displayed; their only function is to link different tables. When you make a selection in a list box (click on or hover one or more values), QlikView searches the whole internal data structure for logical con-nections. As a result of this search the values associated with your selection are iden-
Figure 8. QlikView data structure
20 ©1996 - 2008 QlikTech International
QLIKVIEW DATA STRUCTURES
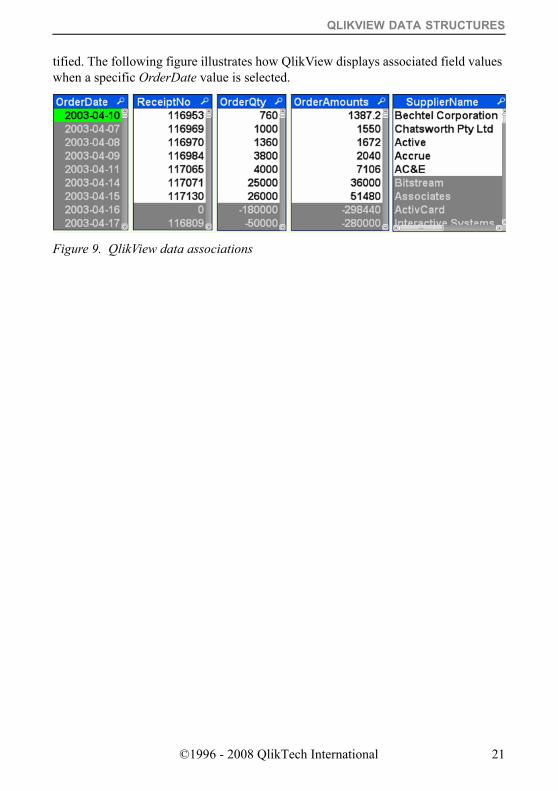
tified. The following figure illustrates how QlikView displays associated field values when a specific OrderDate value is selected.
Figure 9. QlikView data associations
©1996 - 2008 QlikTech International 21

22 ©1996 - 2008 QlikTech International
LOADING DATA INTO QLIKVIEW
5 LOADING DATA INTO QLIKVIEWTo load data into QlikView, it is necessary to create instructions for data retrieval and handling. These instructions make up the bulk of the load script.
The script may specify instructions for how QlikView should interpret different data sets. QlikView can load and interpret the following types of data as input:• The result of a database query, made by SQL via OLE DB/ODBC.• Any type of character-delimited text files, e.g. comma separated files.• Fixed field value position format files.• Excel files in standard BIFF format.• XML tables• HTML tables• QlikView Data (qvd) files.• Previously created QlikView-files• Dif files (common export format from AS/400).• Custom data sources (e.g. Web Services) via a plug-in interface
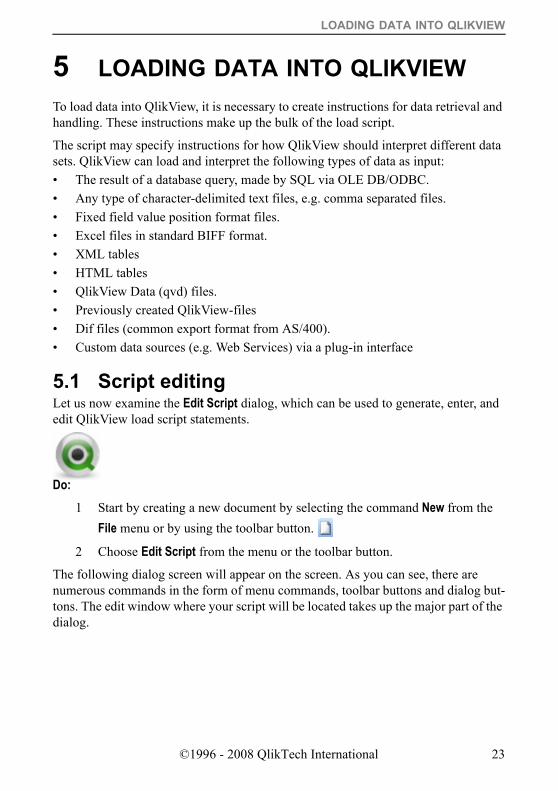
5.1 Script editingLet us now examine the Edit Script dialog, which can be used to generate, enter, and edit QlikView load script statements.
Do:1 Start by creating a new document by selecting the command New from the
File menu or by using the toolbar button.
2 Choose Edit Script from the menu or the toolbar button.
The following dialog screen will appear on the screen. As you can see, there are numerous commands in the form of menu commands, toolbar buttons and dialog but-tons. The edit window where your script will be located takes up the major part of the dialog.
©1996 - 2008 QlikTech International 23
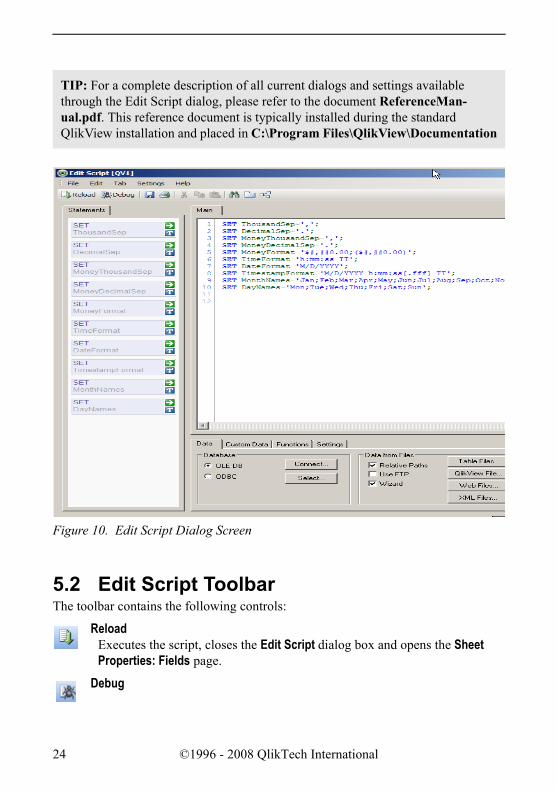
TIP: For a complete description of all current dialogs and settings available through the Edit Script dialog, please refer to the document ReferenceMan-ual.pdf. This reference document is typically installed during the standard QlikView installation and placed in C:\Program Files\QlikView\Documentation
5.2 Edit Script ToolbarThe toolbar contains the following controls:
ReloadExecutes the script, closes the Edit Script dialog box and opens the Sheet Properties: Fields page.
Debug
Figure 10. Edit Script Dialog Screen
24 ©1996 - 2008 QlikTech International
LOADING DATA INTO QLIKVIEW
Starts the script execution in the Debugger. The debugger searches for errors in the script. Every script statement can be monitored and the values of the variables can be examined while the script is executed.
Save Entire Document Saves the active .qvw document in a file. Data, script and layout are saved.
Print TabLets you print the contents of the currently active tab.
CutCuts out the selected script text and stores it in the Clipboard.
CopyCopies out the selected script text.
PastePastes the script text stored in the Clipboard back in.
SearchSearches the script for the specified text string in the current tab only.
Add New Tab Adds a new script tab. The script is executed tab by tab, from left to right.
Table Viewer Displays the graphical table viewer for current data.
Additional useful commands are also available in the five menu drop down lists at the top of the dialog.
5.3 Edit Script Menu CommandsWithin the FILE menu you will find the option for exporting the script as a script file (file extension .qvs) or printing the script statements. If you need to work with a hid-den script, it can be exposed from this menu.
The EDIT menu holds all the commands necessary for editing the contents of the text edit pane. In addition to the commands for selecting, copying, cutting and pasting of text, you will find the functions Insert File which is used for inserting a script file as well as Find/Replace which lets you search for specific text strings. This menu can also be used for commenting parts of the script.
As with other standard windows applications, many of these commands can be exe-cuted by means of the keyboard shortcuts (e.g. CTRL+A will select all text).
The TAB menu contains the necessary commands to manage the tabs of the script.
©1996 - 2008 QlikTech International 25
The SETTINGS menu includes the Configure command, which opens the Font tab of the User Preferences dialog where you can set font type and font color for the various text types of the script.
The commands of the HELP menu open the QlikView Help files. (For more informa-tion about the Edit Script dialog screen, you can refer to the Help right now.)
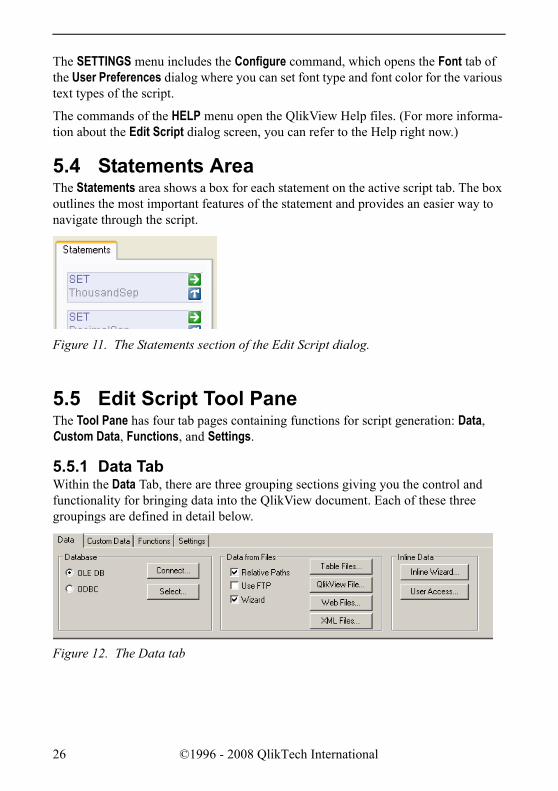
5.4 Statements AreaThe Statements area shows a box for each statement on the active script tab. The box outlines the most important features of the statement and provides an easier way to navigate through the script.
5.5 Edit Script Tool PaneThe Tool Pane has four tab pages containing functions for script generation: Data, Custom Data, Functions, and Settings.
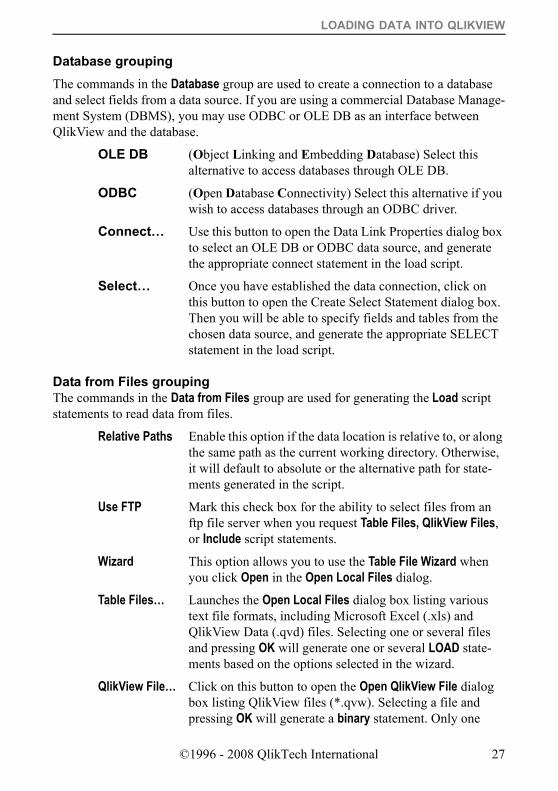
5.5.1 Data TabWithin the Data Tab, there are three grouping sections giving you the control and functionality for bringing data into the QlikView document. Each of these three groupings are defined in detail below.
Figure 11. The Statements section of the Edit Script dialog.
Figure 12. The Data tab
26 ©1996 - 2008 QlikTech International
LOADING DATA INTO QLIKVIEW
Database groupingThe commands in the Database group are used to create a connection to a database and select fields from a data source. If you are using a commercial Database Manage-ment System (DBMS), you may use ODBC or OLE DB as an interface between QlikView and the database.
OLE DB (Object Linking and Embedding Database) Select this alternative to access databases through OLE DB.
ODBC (Open Database Connectivity) Select this alternative if you wish to access databases through an ODBC driver.
Connect… Use this button to open the Data Link Properties dialog box to select an OLE DB or ODBC data source, and generate the appropriate connect statement in the load script.
Select… Once you have established the data connection, click on this button to open the Create Select Statement dialog box. Then you will be able to specify fields and tables from the chosen data source, and generate the appropriate SELECT statement in the load script.
Data from Files groupingThe commands in the Data from Files group are used for generating the Load script statements to read data from files.
Relative Paths Enable this option if the data location is relative to, or along the same path as the current working directory. Otherwise, it will default to absolute or the alternative path for state-ments generated in the script.
Use FTP Mark this check box for the ability to select files from an ftp file server when you request Table Files, QlikView Files, or Include script statements.
Wizard This option allows you to use the Table File Wizard when you click Open in the Open Local Files dialog.
Table Files… Launches the Open Local Files dialog box listing various text file formats, including Microsoft Excel (.xls) and QlikView Data (.qvd) files. Selecting one or several files and pressing OK will generate one or several LOAD state-ments based on the options selected in the wizard.
QlikView File… Click on this button to open the Open QlikView File dialog box listing QlikView files (*.qvw). Selecting a file and pressing OK will generate a binary statement. Only one
©1996 - 2008 QlikTech International 27
binary statement is allowed in a QlikView load script, and it must be the first statement in the load script.
Web Files… Opens the Table Files Wizard: Source dialog box to enter a URL as a source for your data table.
XML Files… Activates the Table Files Wizard: Source dialog box to browse for an XML file.
Inline Data groupingThe commands in this grouping of options are used for generating the script state-ments to create data inline in the script.
Inline Wizard… This button opens the Inline Data Wizard dialog box to assist you with creating a Load Inline statement using a spread-sheet type control.
User Access… Opens the Access Restriction Table Wizard dialog box to assist you with creating a special Load Inline statement to be used in a section access (application security).
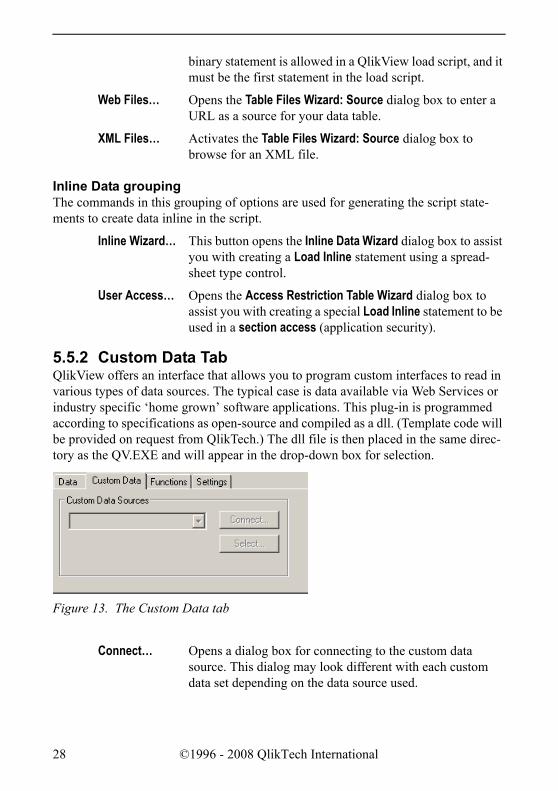
5.5.2 Custom Data TabQlikView offers an interface that allows you to program custom interfaces to read in various types of data sources. The typical case is data available via Web Services or industry specific ‘home grown’ software applications. This plug-in is programmed according to specifications as open-source and compiled as a dll. (Template code will be provided on request from QlikTech.) The dll file is then placed in the same direc-tory as the QV.EXE and will appear in the drop-down box for selection.
Connect… Opens a dialog box for connecting to the custom data source. This dialog may look different with each custom data set depending on the data source used.
Figure 13. The Custom Data tab
28 ©1996 - 2008 QlikTech International
LOADING DATA INTO QLIKVIEW
Select… Allows you to select fields from the custom data source. This dialog may also look different with each data source used.
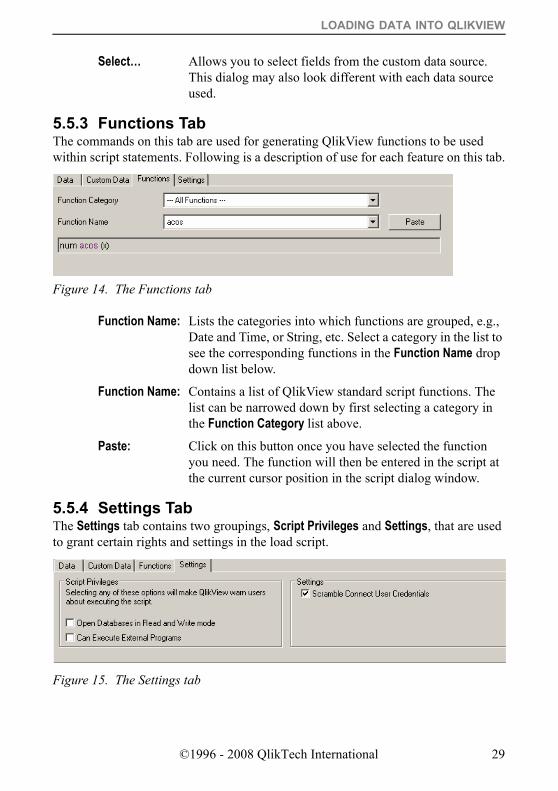
5.5.3 Functions TabThe commands on this tab are used for generating QlikView functions to be used within script statements. Following is a description of use for each feature on this tab.
Function Name: Lists the categories into which functions are grouped, e.g., Date and Time, or String, etc. Select a category in the list to see the corresponding functions in the Function Name drop down list below.
Function Name: Contains a list of QlikView standard script functions. The list can be narrowed down by first selecting a category in the Function Category list above.
Paste: Click on this button once you have selected the function you need. The function will then be entered in the script at the current cursor position in the script dialog window.
5.5.4 Settings TabThe Settings tab contains two groupings, Script Privileges and Settings, that are used to grant certain rights and settings in the load script.
Figure 14. The Functions tab
Figure 15. The Settings tab
©1996 - 2008 QlikTech International 29
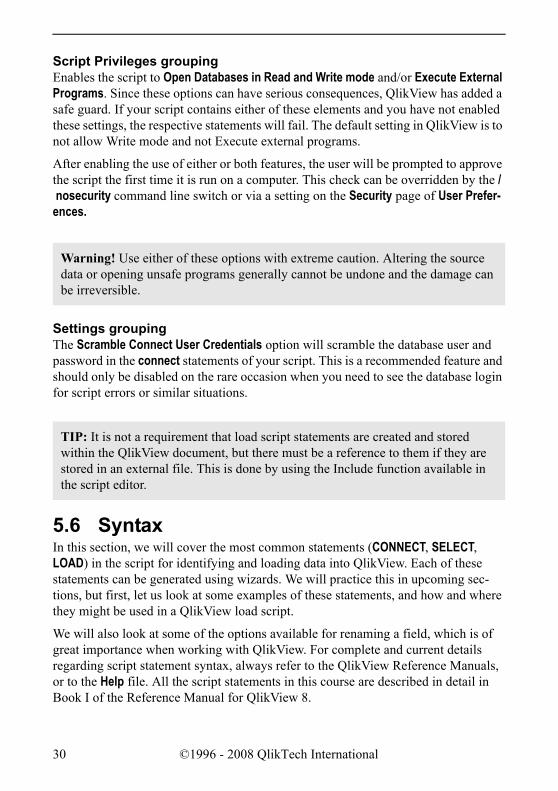
Script Privileges groupingEnables the script to Open Databases in Read and Write mode and/or Execute External Programs. Since these options can have serious consequences, QlikView has added a safe guard. If your script contains either of these elements and you have not enabled these settings, the respective statements will fail. The default setting in QlikView is to not allow Write mode and not Execute external programs.
After enabling the use of either or both features, the user will be prompted to approve the script the first time it is run on a computer. This check can be overridden by the / nosecurity command line switch or via a setting on the Security page of User Prefer-ences.
Warning! Use either of these options with extreme caution. Altering the source data or opening unsafe programs generally cannot be undone and the damage can be irreversible.
Settings groupingThe Scramble Connect User Credentials option will scramble the database user and password in the connect statements of your script. This is a recommended feature and should only be disabled on the rare occasion when you need to see the database login for script errors or similar situations.
5.6 SyntaxIn this section, we will cover the most common statements (CONNECT, SELECT, LOAD) in the script for identifying and loading data into QlikView. Each of these statements can be generated using wizards. We will practice this in upcoming sec-tions, but first, let us look at some examples of these statements, and how and where they might be used in a QlikView load script.
We will also look at some of the options available for renaming a field, which is of great importance when working with QlikView. For complete and current details regarding script statement syntax, always refer to the QlikView Reference Manuals, or to the Help file. All the script statements in this course are described in detail in Book I of the Reference Manual for QlikView 8.
TIP: It is not a requirement that load script statements are created and stored within the QlikView document, but there must be a reference to them if they are stored in an external file. This is done by using the Include function available in the script editor.
30 ©1996 - 2008 QlikTech International
LOADING DATA INTO QLIKVIEW
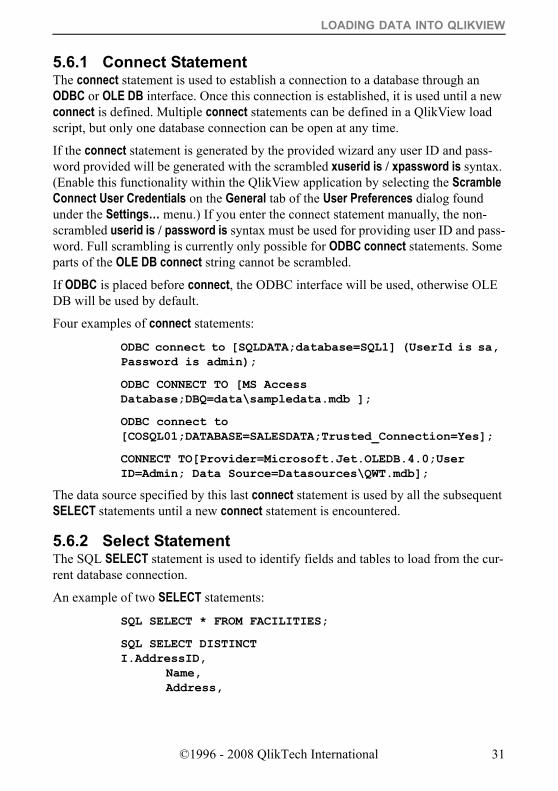
5.6.1 Connect StatementThe connect statement is used to establish a connection to a database through an ODBC or OLE DB interface. Once this connection is established, it is used until a new connect is defined. Multiple connect statements can be defined in a QlikView load script, but only one database connection can be open at any time.
If the connect statement is generated by the provided wizard any user ID and pass-word provided will be generated with the scrambled xuserid is / xpassword is syntax. (Enable this functionality within the QlikView application by selecting the Scramble Connect User Credentials on the General tab of the User Preferences dialog found under the Settings… menu.) If you enter the connect statement manually, the non-scrambled userid is / password is syntax must be used for providing user ID and pass-word. Full scrambling is currently only possible for ODBC connect statements. Some parts of the OLE DB connect string cannot be scrambled.
If ODBC is placed before connect, the ODBC interface will be used, otherwise OLE DB will be used by default.
Four examples of connect statements:
ODBC connect to [SQLDATA;database=SQL1] (UserId is sa, Password is admin);
ODBC CONNECT TO [MS Access Database;DBQ=data\sampledata.mdb ];
ODBC connect to [COSQL01;DATABASE=SALESDATA;Trusted_Connection=Yes];
CONNECT TO[Provider=Microsoft.Jet.OLEDB.4.0;User ID=Admin; Data Source=Datasources\QWT.mdb];
The data source specified by this last connect statement is used by all the subsequent SELECT statements until a new connect statement is encountered.
5.6.2 Select StatementThe SQL SELECT statement is used to identify fields and tables to load from the cur-rent database connection.
An example of two SELECT statements:
SQL SELECT * FROM FACILITIES;
SQL SELECT DISTINCT I.AddressID,
Name, Address,
©1996 - 2008 QlikTech International 31

PostalCode FROM [Invoice] I, [Address] A
WHERE I.InvoiceType is not null and I.InvoiceDate >= '2008-01-01' and I.AddressID = A.AddressID;
Any valid SELECT statement can be used, but be aware that ODBC drivers can impose limitations on acceptable syntax for a particular database connection.
ODBC Limitations:The following is a partial listing of limitations imposed by ODBC drivers:• QlikView functions cannot be used within the SELECT statements.• SQL Syntax deviations may occur. Since the SELECT statement is interpreted by
the selected ODBC driver, the syntax will likely vary with each unique ODBC connection. For example, the ODBC driver sometimes does not accept some types of quotation marks. Following is another example using the as operator.
as is sometimes not allowed, i.e. aliasname must follow immediately after fieldname.
as is sometimes compulsory if an aliasname is used.
distinct, as, where, group by, order by, or union are sometimes not supported.• Field names and table names must be bracketed by quotes or square brackets if
they contain spaces or special characters. • Quotation mark types may vary in the script by ODBC connection. When the
script is automatically generated by QlikView, the quotation mark that is used is the one preferred by that ODBC driver as specified in the definition of the data source in the connect statement.
Union Join AdvantageA benefit with using the SELECT statement is the ability to concatenate several state-ments into one using a union operator (if supported by a particular ODBC connec-tion):
selectstatement union selectstatement
5.6.3 Load StatementThe LOAD statement can bring in data through several different methods. Following is a partial listing of the types of data that can be loaded into QlikView:• Load from a database table• Load directly from a text, Excel, qvd, xml, etc. file
32 ©1996 - 2008 QlikTech International
LOADING DATA INTO QLIKVIEW
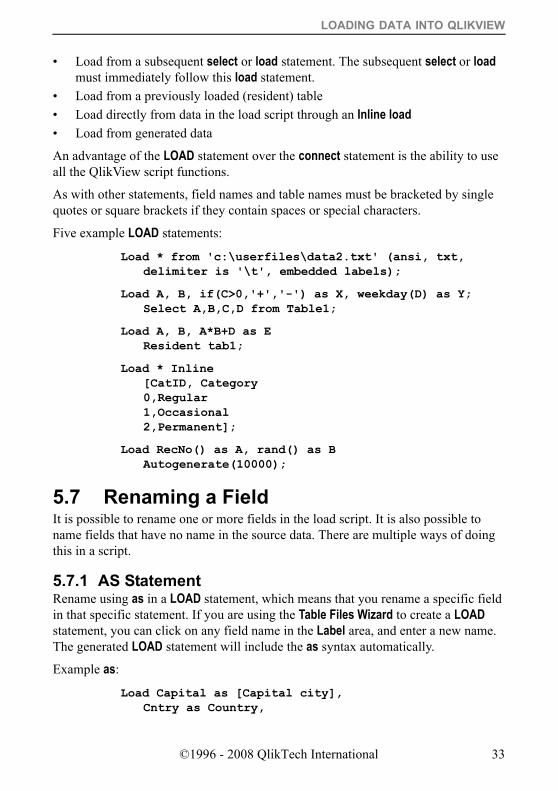
• Load from a subsequent select or load statement. The subsequent select or load must immediately follow this load statement.
• Load from a previously loaded (resident) table• Load directly from data in the load script through an Inline load• Load from generated data
An advantage of the LOAD statement over the connect statement is the ability to use all the QlikView script functions.
As with other statements, field names and table names must be bracketed by single quotes or square brackets if they contain spaces or special characters.
Five example LOAD statements:
Load * from 'c:\userfiles\data2.txt' (ansi, txt, delimiter is '\t', embedded labels);
Load A, B, if(C>0,'+','-') as X, weekday(D) as Y; Select A,B,C,D from Table1;
Load A, B, A*B+D as E Resident tab1;
Load * Inline [CatID, Category 0,Regular 1,Occasional 2,Permanent];
Load RecNo() as A, rand() as B Autogenerate(10000);
5.7 Renaming a FieldIt is possible to rename one or more fields in the load script. It is also possible to name fields that have no name in the source data. There are multiple ways of doing this in a script.
5.7.1 AS StatementRename using as in a LOAD statement, which means that you rename a specific field in that specific statement. If you are using the Table Files Wizard to create a LOAD statement, you can click on any field name in the Label area, and enter a new name. The generated LOAD statement will include the as syntax automatically.
Example as:
Load Capital as [Capital city], Cntry as Country,
©1996 - 2008 QlikTech International 33
Pop as Population From Country.csv (ansi, txt, delimiter is ',' ,embedded labels);
5.7.2 Alias StatementRename using the alias statement, which means that you rename all the occurrences of those fields with the names specified in the script. Following is the syntax guide-line:
Alias <fieldname> as <new fieldname>, <fieldname> as <new fieldname>,…
Example use of the alias statement:
Alias ProdId as ProductID, Mon as Month, Cname as Customer;
5.7.3 Rename Field StatementRename one or more existing fields using Rename Field statement. This statement can optionally use a mapping table, which stores the oldname to newname conversion data. We will discuss mapping tables later in this course.
The syntax for a rename field statement is:
rename field[s] (using mapname | oldname to newname {, oldname to newname} )
mapname is the name of a previously loaded mapping table containing one or more pairs of old and new field names
oldname is the old field name and
newname is the new field name.
Note: Both rename field and rename fileds are allowed forms with no difference in effect.
Example use of the rename field statement:
Rename field XAZ0007 to Sales;
FieldMap: Mapping select oldnames, newnames from datadict; Rename fields using FieldMap;
34 ©1996 - 2008 QlikTech International
DATA SOURCE FILES
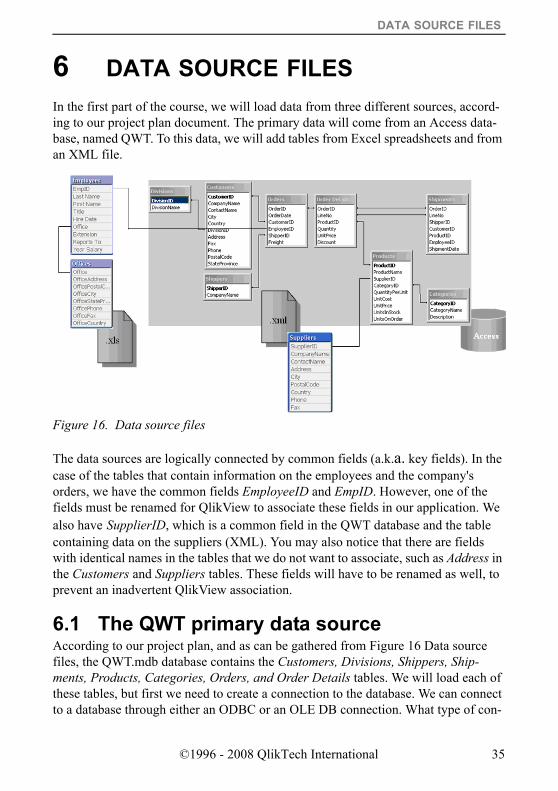
6 DATA SOURCE FILES In the first part of the course, we will load data from three different sources, accord-ing to our project plan document. The primary data will come from an Access data-base, named QWT. To this data, we will add tables from Excel spreadsheets and from an XML file.
The data sources are logically connected by common fields (a.k.a. key fields). In the case of the tables that contain information on the employees and the company's orders, we have the common fields EmployeeID and EmpID. However, one of the fields must be renamed for QlikView to associate these fields in our application. We also have SupplierID, which is a common field in the QWT database and the table containing data on the suppliers (XML). You may also notice that there are fields with identical names in the tables that we do not want to associate, such as Address in the Customers and Suppliers tables. These fields will have to be renamed as well, to prevent an inadvertent QlikView association.
6.1 The QWT primary data sourceAccording to our project plan, and as can be gathered from Figure 16 Data source files, the QWT.mdb database contains the Customers, Divisions, Shippers, Ship-ments, Products, Categories, Orders, and Order Details tables. We will load each of these tables, but first we need to create a connection to the database. We can connect to a database through either an ODBC or an OLE DB connection. What type of con-
Figure 16. Data source files
©1996 - 2008 QlikTech International 35
nection to use is often dependent on the type of database used. In general, an OLE DB connection should be used if available. In this training material, we will use an OLE DB connection towards the access database.
6.2 The QWT secondary data filesIn addition to the primary database, our project plan also calls for data extraction from the following data sources:
6.2.1 Excel files• Budget.xls• EmpOff.xls
6.2.2 XML files• Suppliers.xml
36 ©1996 - 2008 QlikTech International
CREATING THE SCRIPT
7 CREATING THE SCRIPTIn this chapter, we will start loading data into QlikView. We do this by creating a script that defines which data to load. The script that we will write in this part of the course loads data from an Access database. Fields from several tables will be loaded using SELECT statements. The syntax used is standard SQL. We will connect to the database using an OLE DB connection.
7.1 Script generationThe advantage of using the QlikView script editor is that many of the script state-ments are generated automatically by selecting the fields you want to load in the file wizards. It is often necessary to make some changes manually, e.g. to assign new field names. The script editor may also point out obvious errors through color-cod-ing, e.g. unmatched parenthesis on a function.
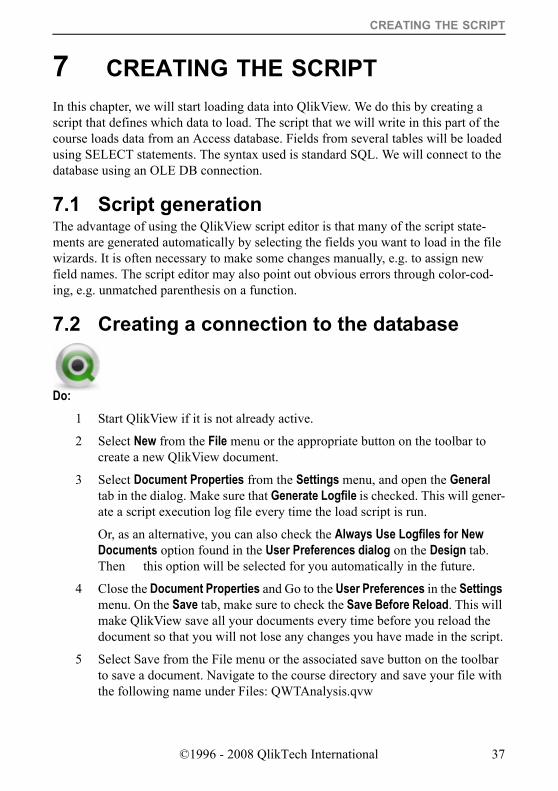
7.2 Creating a connection to the database
Do:1 Start QlikView if it is not already active.
2 Select New from the File menu or the appropriate button on the toolbar to create a new QlikView document.
3 Select Document Properties from the Settings menu, and open the General tab in the dialog. Make sure that Generate Logfile is checked. This will gener-ate a script execution log file every time the load script is run.
Or, as an alternative, you can also check the Always Use Logfiles for New Documents option found in the User Preferences dialog on the Design tab. Then this option will be selected for you automatically in the future.
4 Close the Document Properties and Go to the User Preferences in the Settings menu. On the Save tab, make sure to check the Save Before Reload. This will make QlikView save all your documents every time before you reload the document so that you will not lose any changes you have made in the script.
5 Select Save from the File menu or the associated save button on the toolbar to save a document. Navigate to the course directory and save your file with the following name under Files: QWTAnalysis.qvw
©1996 - 2008 QlikTech International 37
TIP: It is usually a good idea to save a new document prior to editing the script, so the correct relative paths can be generated. This is required for portability of the QlikView document.
6 Select Edit Script from the File menu or the toolbar.
You have now created a new script file and, as you can see, it already con-tains some lines of script. These are the format variables, which are gener-ated automatically by QlikView. The variables are based on the regional settings in your operating system regarding date, currency, time, etc.
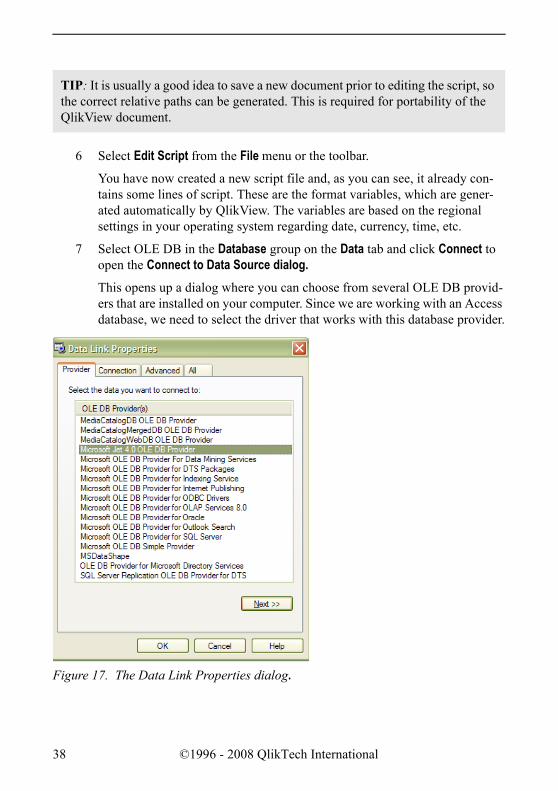
7 Select OLE DB in the Database group on the Data tab and click Connect to open the Connect to Data Source dialog.This opens up a dialog where you can choose from several OLE DB provid-ers that are installed on your computer. Since we are working with an Access database, we need to select the driver that works with this database provider.
Figure 17. The Data Link Properties dialog.
38 ©1996 - 2008 QlikTech International
CREATING THE SCRIPT
8 Select the Microsoft Jet 4.0 OLE DB Provider to connect to the Access data-base.
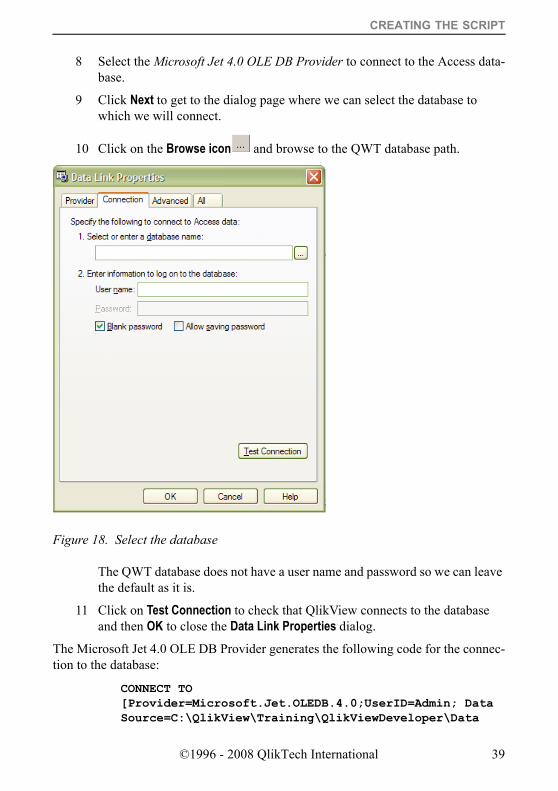
9 Click Next to get to the dialog page where we can select the database to which we will connect.
10 Click on the Browse icon and browse to the QWT database path.
The QWT database does not have a user name and password so we can leave the default as it is.
11 Click on Test Connection to check that QlikView connects to the database and then OK to close the Data Link Properties dialog.
The Microsoft Jet 4.0 OLE DB Provider generates the following code for the connec-tion to the database:
CONNECT TO [Provider=Microsoft.Jet.OLEDB.4.0;UserID=Admin; Data Source=C:\QlikView\Training\QlikViewDeveloper\Data
Figure 18. Select the database
©1996 - 2008 QlikTech International 39
sources\QWT.mdb;Mode=Share Deny None;ExtendedProperties=""; Jet OLEDB:System database="";Jet OLEDB:Registry Path="";Jet OLEDB:Database Password="";Jet OLEDB:Engine Type=5;Jet OLEDB :Database Locking Mode=1;Jet OLEDB:Global Partial Bulk Ops= 2;Jet OLEDB:Global Bulk Transactions=1;Jet OLEDB:New Data base Password="";Jet OLEDB:Create System Database=False;Jet OLEDB:Encrypt Database=False;Jet OLEDB:Don't Copy Locale on Compact=False;Jet OLEDB:Compact Without Replica Repair=False;Jet OLEDB:SFP=False];
Because of the properties of the database, any part of the string after the Data Source statement can be altered or eliminated. Below you can see what is necessary for the connection to the QWT database for QlikView:
CONNECT TO [Provider=Microsoft.Jet.OLEDB.4.0;User ID=Admin;Data Source=Datasources\QWT.mdb];
The statements needed in our OLE DB connection are the Provider, the User ID and the Datasources. This may be different between databases and between differ-ent OLE DB drivers.
As you can see, we can alter the path of the database to a relative path instead of an absolute path. We do this by removing the part of the path to the folder where we have saved the QlikView document. The part of the path removed from the example above is:
C:\QlikView\Training\QlikViewDeveloper\
In this case, our database was stored in a folder below where our QlikView document resides.
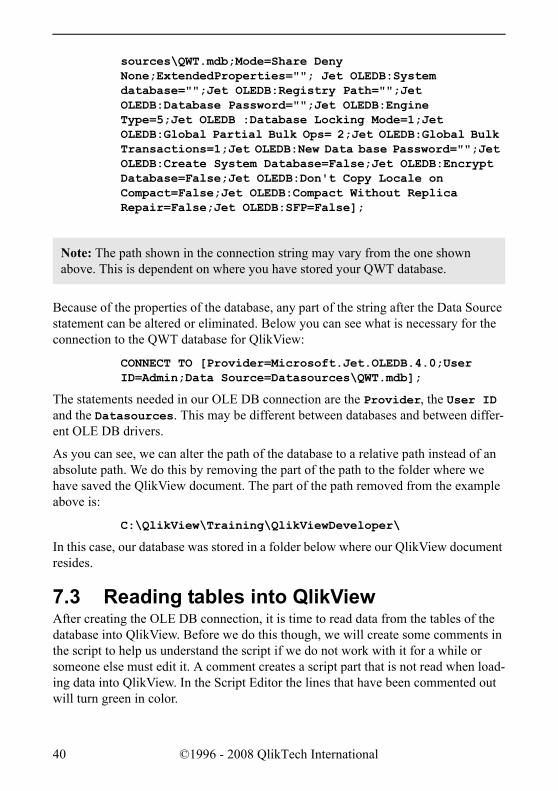
7.3 Reading tables into QlikView After creating the OLE DB connection, it is time to read data from the tables of the database into QlikView. Before we do this though, we will create some comments in the script to help us understand the script if we do not work with it for a while or someone else must edit it. A comment creates a script part that is not read when load-ing data into QlikView. In the Script Editor the lines that have been commented out will turn green in color.
Note: The path shown in the connection string may vary from the one shown above. This is dependent on where you have stored your QWT database.
40 ©1996 - 2008 QlikTech International
CREATING THE SCRIPT
The following figure shows an example of comments added following the connection string to describe the database that is being used.
Warning! Do not use the // comment for an Include function, since that will only comment the initial line in the Include file.
QlikView allows three different comment types:• REM preceding a statement will comment that statement up to its ending ;• // will comment all text following it on a single line.• /* … */ will comment all text between the delimiters.
In the following exercise, you are free to add any type of comment you would like. The suggestion above used the text from the project plan document from the Custom-ers table data description. (Some formatting was required to line up the columns in the record layout table).
Do:1 We will start by adding the Customers table to the script.
Figure 19. Adding comments to the load script
©1996 - 2008 QlikTech International 41
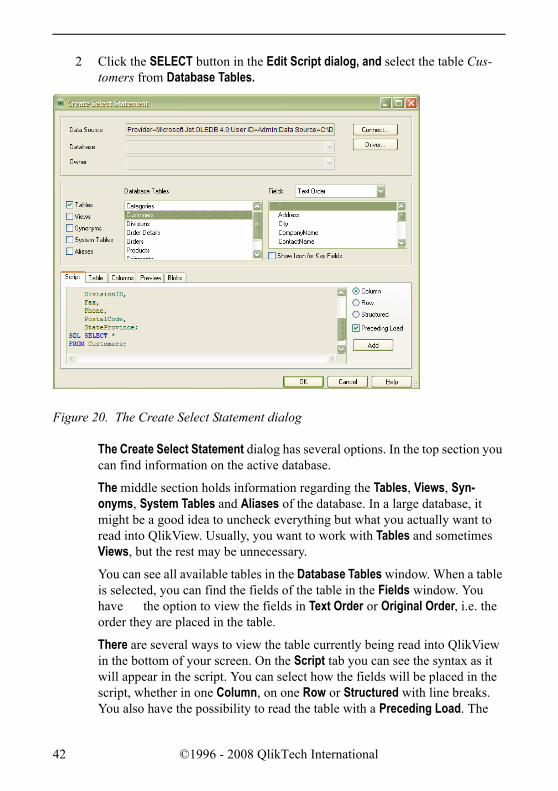
2 Click the SELECT button in the Edit Script dialog, and select the table Cus-tomers from Database Tables.
The Create Select Statement dialog has several options. In the top section you can find information on the active database.
The middle section holds information regarding the Tables, Views, Syn-onyms, System Tables and Aliases of the database. In a large database, it might be a good idea to uncheck everything but what you actually want to read into QlikView. Usually, you want to work with Tables and sometimes Views, but the rest may be unnecessary.
You can see all available tables in the Database Tables window. When a table is selected, you can find the fields of the table in the Fields window. You have the option to view the fields in Text Order or Original Order, i.e. the order they are placed in the table.
There are several ways to view the table currently being read into QlikView in the bottom of your screen. On the Script tab you can see the syntax as it will appear in the script. You can select how the fields will be placed in the script, whether in one Column, on one Row or Structured with line breaks. You also have the possibility to read the table with a Preceding Load. The
Figure 20. The Create Select Statement dialog
42 ©1996 - 2008 QlikTech International
CREATING THE SCRIPT
preceding load gives you the advantage of working with the QlikView syn-tax instead of the SQL syntax.
3 Make sure to check Preceding Load so that we can use the QlikView syntax in the script.
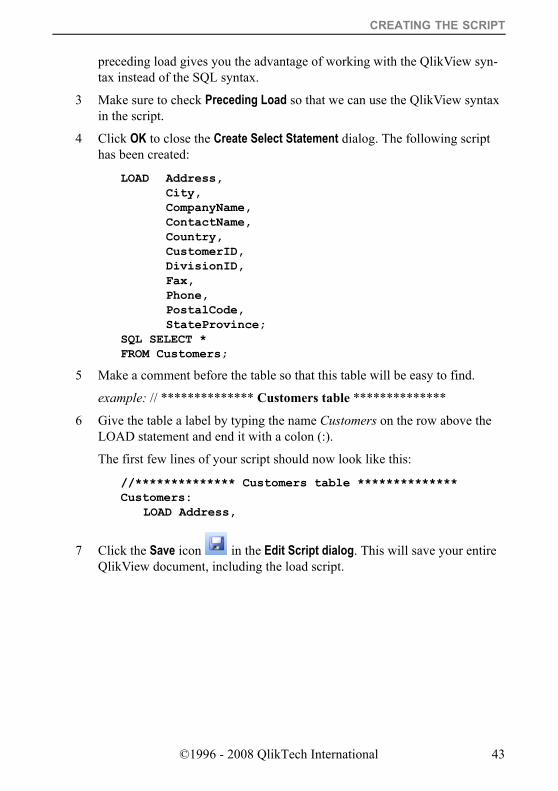
4 Click OK to close the Create Select Statement dialog. The following script has been created:
LOAD Address, City, CompanyName, ContactName, Country, CustomerID, DivisionID, Fax, Phone, PostalCode, StateProvince;
SQL SELECT * FROM Customers;
5 Make a comment before the table so that this table will be easy to find.
example: // ************** Customers table **************
6 Give the table a label by typing the name Customers on the row above the LOAD statement and end it with a colon (:).
The first few lines of your script should now look like this:
//************** Customers table ************** Customers:
LOAD Address,
7 Click the Save icon in the Edit Script dialog. This will save your entire QlikView document, including the load script.
©1996 - 2008 QlikTech International 43
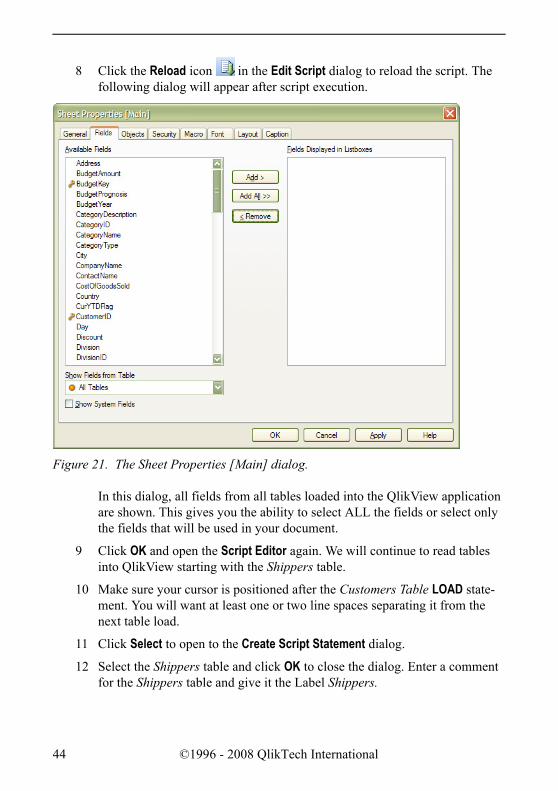
8 Click the Reload icon in the Edit Script dialog to reload the script. The following dialog will appear after script execution.
In this dialog, all fields from all tables loaded into the QlikView application are shown. This gives you the ability to select ALL the fields or select only the fields that will be used in your document.
9 Click OK and open the Script Editor again. We will continue to read tables into QlikView starting with the Shippers table.
10 Make sure your cursor is positioned after the Customers Table LOAD state-ment. You will want at least one or two line spaces separating it from the next table load.
11 Click Select to open to the Create Script Statement dialog.
12 Select the Shippers table and click OK to close the dialog. Enter a comment for the Shippers table and give it the Label Shippers.
Figure 21. The Sheet Properties [Main] dialog.
44 ©1996 - 2008 QlikTech International
CREATING THE SCRIPT
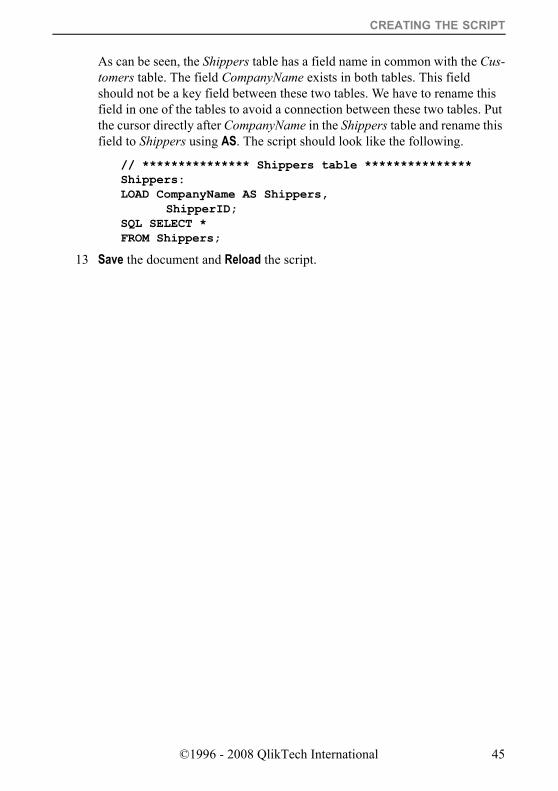
As can be seen, the Shippers table has a field name in common with the Cus-tomers table. The field CompanyName exists in both tables. This field should not be a key field between these two tables. We have to rename this field in one of the tables to avoid a connection between these two tables. Put the cursor directly after CompanyName in the Shippers table and rename this field to Shippers using AS. The script should look like the following.
// *************** Shippers table *************** Shippers: LOAD CompanyName AS Shippers,
ShipperID; SQL SELECT * FROM Shippers;
13 Save the document and Reload the script.
©1996 - 2008 QlikTech International 45

46 ©1996 - 2008 QlikTech International
EXERCISES
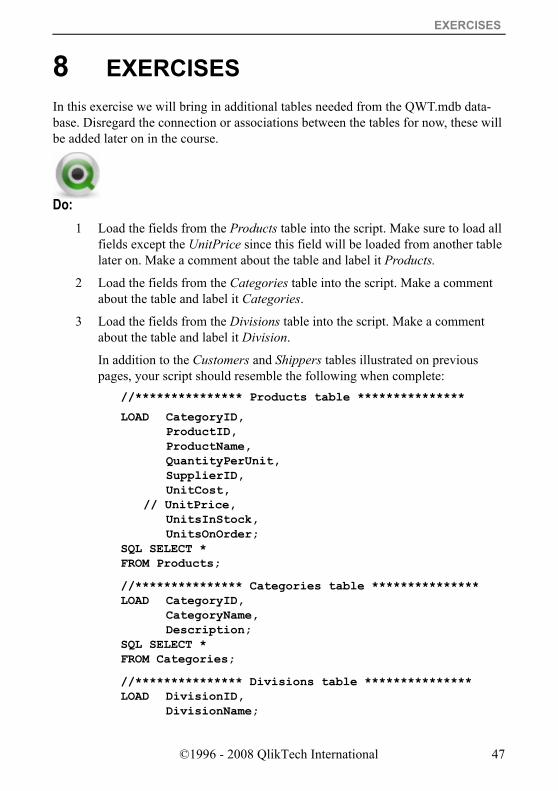
8 EXERCISES In this exercise we will bring in additional tables needed from the QWT.mdb data-base. Disregard the connection or associations between the tables for now, these will be added later on in the course.
Do:1 Load the fields from the Products table into the script. Make sure to load all
fields except the UnitPrice since this field will be loaded from another table later on. Make a comment about the table and label it Products.
2 Load the fields from the Categories table into the script. Make a comment about the table and label it Categories.
3 Load the fields from the Divisions table into the script. Make a comment about the table and label it Division.
In addition to the Customers and Shippers tables illustrated on previous pages, your script should resemble the following when complete:
//*************** Products table ***************
LOAD CategoryID, ProductID, ProductName, QuantityPerUnit, SupplierID, UnitCost,
// UnitPrice, UnitsInStock, UnitsOnOrder;
SQL SELECT * FROM Products;
//*************** Categories table *************** LOAD CategoryID,
CategoryName, Description;
SQL SELECT * FROM Categories;
//*************** Divisions table *************** LOAD DivisionID,
DivisionName;
©1996 - 2008 QlikTech International 47
SQL SELECT * FROM Divisions;
8.1 Script DebuggingWhen making script changes, it can sometimes be difficult to find errors. QlikView therefore contains a script execution debugger to help you identify mistakes in your script.
Running the script in the debugger makes it much easier to find errors. It can also save a great deal of time. In the debugger, you can study each statement and check the values of the variables while the script is being executed.
The script is shown in the window in the upper half of the dialog. A yellow cursor shows how far execution has proceeded. Breakpoints can be inserted by clicking on a line number, and removed by clicking again. All breakpoints can be removed by clicking the Clear button. When a new breakpoint is encountered, execution is halted until the command is given to resume.
The current script statement is shown in the window in the middle of the dialog.
Status codes and error messages are shown in the lower left window. This is essen-tially the same information as that shown in the Script Execution Progress window when the script is run without the debugger.
The bottom right-hand window shows all the variables and their values. Values that have been changed are shown in red.
The script can be run in three different modes:
To run the whole script, use one of the following methods:
Select Limited Load and enter a number in the window below. The number is the max-imum number of records accepted for each LOAD and SELECT statement. This is a very practical way to limit the execution time when a script is being run on live data.
Click End Here toend the current reload. Data that has already been loaded will be retained in QlikView.
Run This is the normal mode for script execution. The script is run to the end or until a breakpoint is encountered.
Animate The script is run as described above, but with a short pause after each statement. This allows you to follow the execution more carefully.
Step The script is executed one statement at a time.
48 ©1996 - 2008 QlikTech International
EXERCISES
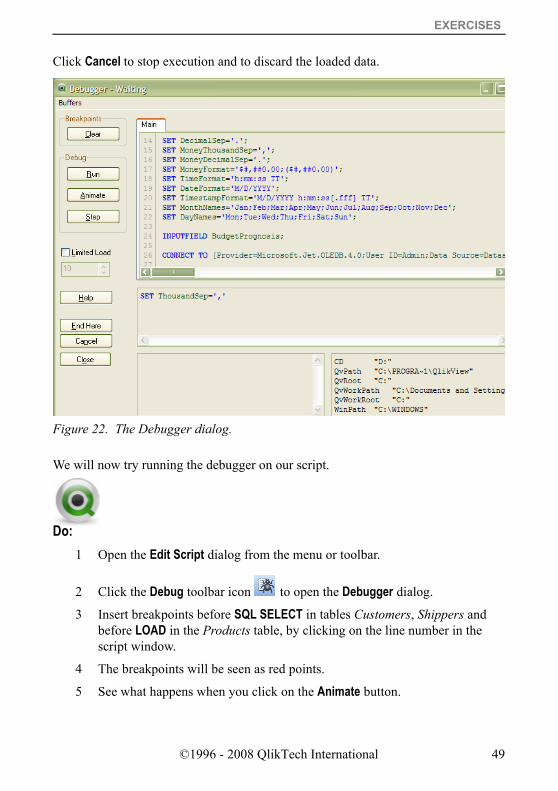
Click Cancel to stop execution and to discard the loaded data.
We will now try running the debugger on our script.
Do:1 Open the Edit Script dialog from the menu or toolbar.
2 Click the Debug toolbar icon to open the Debugger dialog.
3 Insert breakpoints before SQL SELECT in tables Customers, Shippers and before LOAD in the Products table, by clicking on the line number in the script window.
4 The breakpoints will be seen as red points.
5 See what happens when you click on the Animate button.
Figure 22. The Debugger dialog.
©1996 - 2008 QlikTech International 49
Running the script in the various modes available in the debugger is like clicking Run in the script.
6 When the script has been loaded, you must click Close to get to the Select Fields dialog.
7 Open the debugger again and Run the script with a Limited Load of 10 records.
Not only can this be a useful tool for identifying errors and validating changes, but as a way to create template applications with a small number of records in them.
8.1.1 The Script Execution Log FileAt the beginning of the course, we set the Generate Logfile selection in Document Properties. Now we will take a look at the file that is generated during script execu-tion.
The log file will have the same name as your QlikView document, but with a “.qvw“appended to it, and a file extension of .log (e.g. QVE_Course.qvw.log). The file will be located in the same directory as the QlikView document that is being reloaded.
The log file will generally contain all executed script statements, without the line or bracketed comments (REM statements are shown). It also includes the following information.• Start execution timestamp• Finished execution timestamp• The number of fields and name of each field identified in a LOAD or SELECT,
along with the number of records included in that LOAD or SELECT.• The line number from the script• The QlikView version running the script• Any script execution errors that may have occurred• Any synthetic keys that are created will be listed at the end of the log file.
Do:1 See if you can locate the log file from your application, and open it using
Notepad, or a similar tool.
50 ©1996 - 2008 QlikTech International
STRUCTURING THE SCRIPT
9 STRUCTURING THE SCRIPTSo far, we have loaded several tables. Often when building a QlikView application, many tables are used and sometimes you want to manipulate existing tables. To make the script easier to work with, we can divide the script into different tabs. In this chapter, we will work with tabs to get a clear and easy to follow structure of the script.
9.1 Creating tabs in the scriptTo structure the QlikView script and easily find the different tables, we are going to create different tabs in the script. The tables read so far would be considered dimen-sion tables. These tables hold information that is pertinent to look at by time or other values as well as make selections in. We are going to create a tab in the script called Dimensions and put our dimension tables in this tab.
Do:1 Open the script using the Edit Script icon.
2 Click on the Add new tab tool button or go to the Tab Menu and click Add Tab.
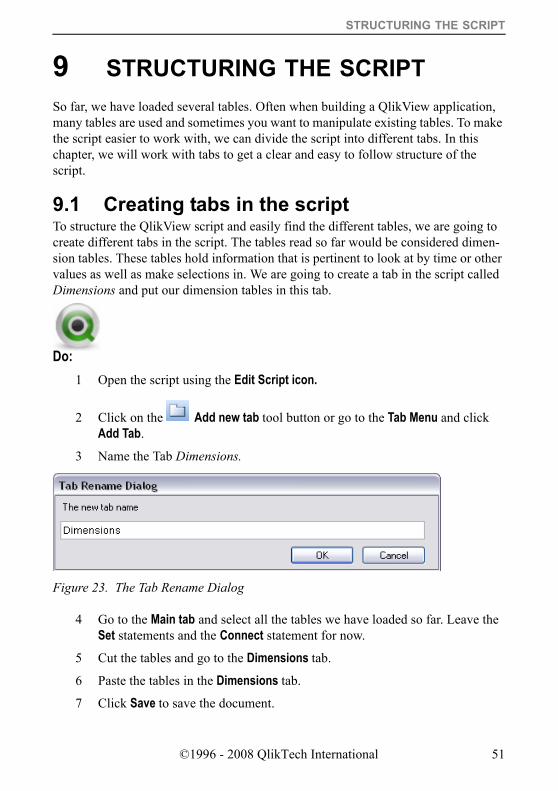
3 Name the Tab Dimensions.
4 Go to the Main tab and select all the tables we have loaded so far. Leave the Set statements and the Connect statement for now.
5 Cut the tables and go to the Dimensions tab.
6 Paste the tables in the Dimensions tab.
7 Click Save to save the document.
Figure 23. The Tab Rename Dialog
©1996 - 2008 QlikTech International 51
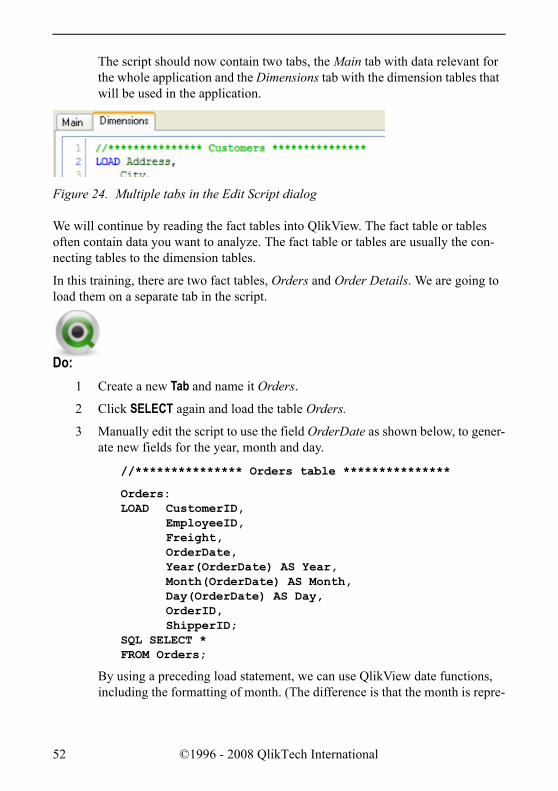
The script should now contain two tabs, the Main tab with data relevant for the whole application and the Dimensions tab with the dimension tables that will be used in the application.
We will continue by reading the fact tables into QlikView. The fact table or tables often contain data you want to analyze. The fact table or tables are usually the con-necting tables to the dimension tables.
In this training, there are two fact tables, Orders and Order Details. We are going to load them on a separate tab in the script.
Do:1 Create a new Tab and name it Orders.
2 Click SELECT again and load the table Orders.
3 Manually edit the script to use the field OrderDate as shown below, to gener-ate new fields for the year, month and day.
//*************** Orders table ***************
Orders: LOAD CustomerID,
EmployeeID, Freight, OrderDate, Year(OrderDate) AS Year, Month(OrderDate) AS Month, Day(OrderDate) AS Day, OrderID, ShipperID;
SQL SELECT * FROM Orders;
By using a preceding load statement, we can use QlikView date functions, including the formatting of month. (The difference is that the month is repre-
Figure 24. Multiple tabs in the Edit Script dialog
52 ©1996 - 2008 QlikTech International
STRUCTURING THE SCRIPT
sented as a number when using the SELECT statement, and as a combination of text and number when using the LOAD statement.)
Note: Text strings used to represent the months is dependent on the regional set-tings in your operating system (as seen in the initial script statements). If your set-tings are in English, the months will be shown in English.
According to the project plan, under the Trends section, we will need to offer time analysis over Month, MonthYear, Quarter, and Year. The script above will provide the Year, the Month, and the Day of the month. We will expand on this later to add MonthYear and Quarter.
4 We will select and load the table OrderDetails under the Orders table. Here we will create a new field LineSalesAmount, which is the first Key Measure, identified in the project plan in the Key Measures section. LineSalesAmount is the result of a calculation based on UnitPrice*Quantity*(1-Discount). The load script is as follows:
//*************** Order Details table *************** OrderDetails: LOAD Discount,
LineNo, OrderID, ProductID, Quantity, UnitPrice, UnitPrice * Quantity * (1 - Discount) AS LineSalesAmount;
SQL SELECT * FROM “Order Details”;
5 Save the document and Reload the script.
The script should be as follows. Note that the different script tabs are marked ///$tab. This is the QlikView way of marking the different tabs when you export the script to a script file.
///$tab Main SET ThousandSep=','; SET DecimalSep='.'; SET MoneyThousandSep=','; SET MoneyDecimalSep='.'; SET MoneyFormat='$#,##0.00;($#,##0.00)'; SET TimeFormat='h:mm:ss TT'; SET DateFormat='M/D/YYYY'; SET TimestampFormat='M/D/YYYY h:mm:ss[.fff] TT';
©1996 - 2008 QlikTech International 53
SET MonthNames='Jan;Feb;Mar;Apr;May;Jun;Jul; Aug;Sep;Oct;Nov;Dec';
SET DayNames='Mon;Tue;Wed;Thu;Fri;Sat;Sun';
CONNECT TO [Provider=Microsoft.Jet.OLEDB.4.0;User ID=Admin;Data Source=Datasources\QWT.mdb];
///$tab Dimensions //*************** Customers table ************** Customers: LOAD Address,
City, CompanyName, ContactName, Country, CustomerID, DivisionID, Fax, Phone, PostalCode, StateProvince;
SQL SELECT * FROM Customers;
//*************** Shippers table ************** Shippers: LOAD CompanyName as Shippers,
ShipperID; SQL SELECT * FROM Shippers;
//*************** Products table ************** Products: LOAD CategoryID,
ProductID, ProductName, QuantityPerUnit, SupplierID, UnitCost, //UnitPrice, UnitsInStock, UnitsOnOrder;
SQL SELECT * FROM Products;
//*************** Categories table ************** Categories: LOAD CategoryID,
54 ©1996 - 2008 QlikTech International
STRUCTURING THE SCRIPT
CategoryName, Description;
SQL SELECT * FROM Categories;
//*************** Divisions table ************** Divisions: LOAD DivisionID,
DivisionName; SQL SELECT * FROM Divisions;
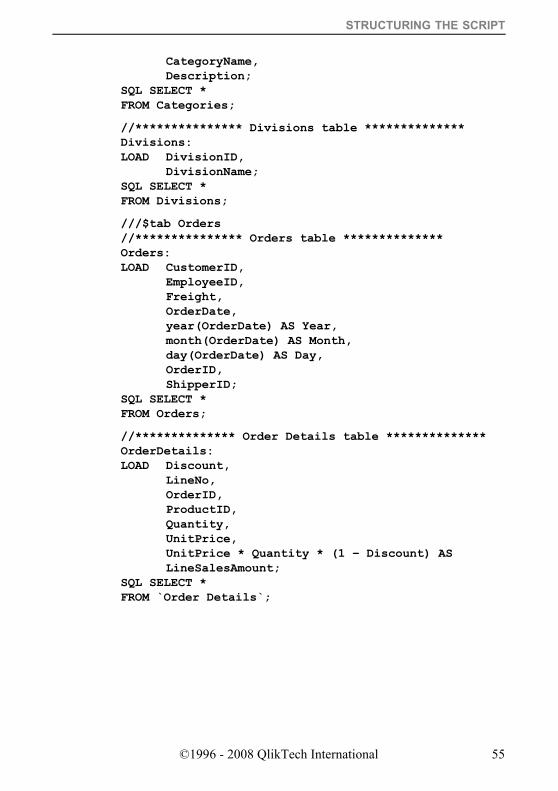
///$tab Orders //*************** Orders table ************** Orders: LOAD CustomerID,
EmployeeID, Freight, OrderDate, year(OrderDate) AS Year, month(OrderDate) AS Month, day(OrderDate) AS Day, OrderID, ShipperID;
SQL SELECT * FROM Orders;
//************** Order Details table ************** OrderDetails: LOAD Discount,
LineNo, OrderID, ProductID, Quantity, UnitPrice, UnitPrice * Quantity * (1 – Discount) AS LineSalesAmount;
SQL SELECT * FROM `Order Details`;
©1996 - 2008 QlikTech International 55

56 ©1996 - 2008 QlikTech International
DATA STRUCTURE OF THE LOADED DATA
10 DATA STRUCTURE OF THE LOADED DATA
In this chapter, we will learn about the Table Viewer. We will see how we can use it to analyze and understand the internal structure of our QlikView document. We will also be introduced to several ways to monitor and analyze the structure of the QlikView data. These tools and techniques will be useful while we create the load script and the document structure; and, it will be critical when trying to verify the integrity of a document or to debug error behavior.
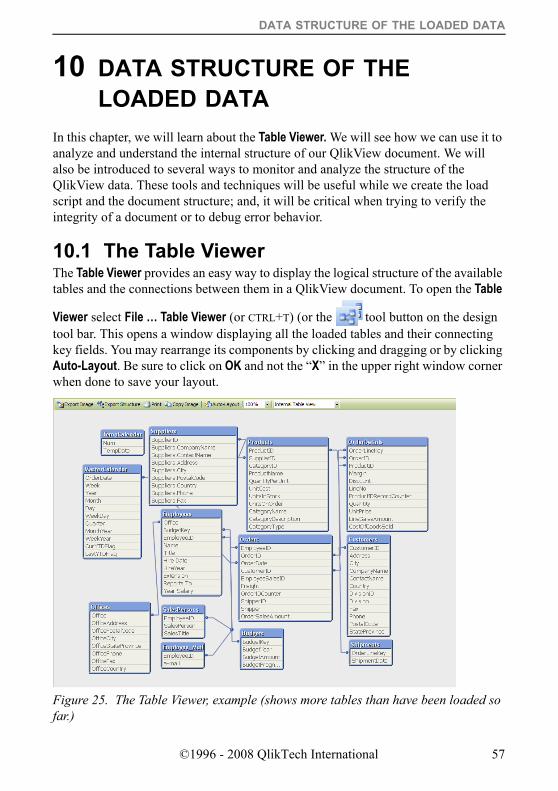
10.1 The Table ViewerThe Table Viewer provides an easy way to display the logical structure of the available tables and the connections between them in a QlikView document. To open the Table
Viewer select File … Table Viewer (or CTRL+T) (or the tool button on the design tool bar. This opens a window displaying all the loaded tables and their connecting key fields. You may rearrange its components by clicking and dragging or by clicking Auto-Layout. Be sure to click on OK and not the “X” in the upper right window corner when done to save your layout.
Figure 25. The Table Viewer, example (shows more tables than have been loaded so far.)
©1996 - 2008 QlikTech International 57
The Table Viewer gives you a graphical view of the tables and the connections between the tables. You can rearrange the tables so that the structure becomes easy to follow. You can also switch between the Internal Table View of QlikView i.e. how the tables are connected in QlikView and a Source Table View that shows you the original connections between the tables as they are read into QlikView.
Do:1 Open the Table Viewer from the File menu or use the shortcut CTRL+T.
2 Manually rearrange the tables, or click the tool button, so that you can see the connections between them.
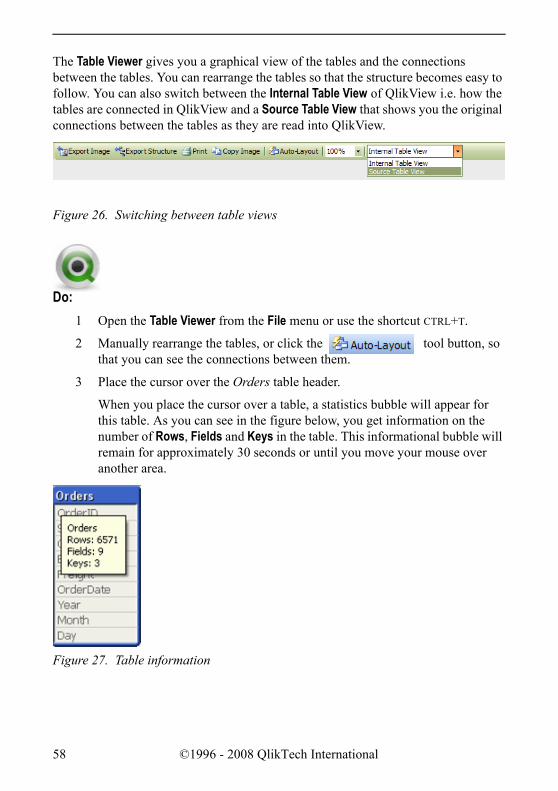
3 Place the cursor over the Orders table header.
When you place the cursor over a table, a statistics bubble will appear for this table. As you can see in the figure below, you get information on the number of Rows, Fields and Keys in the table. This informational bubble will remain for approximately 30 seconds or until you move your mouse over another area.
Figure 26. Switching between table views
Figure 27. Table information
58 ©1996 - 2008 QlikTech International
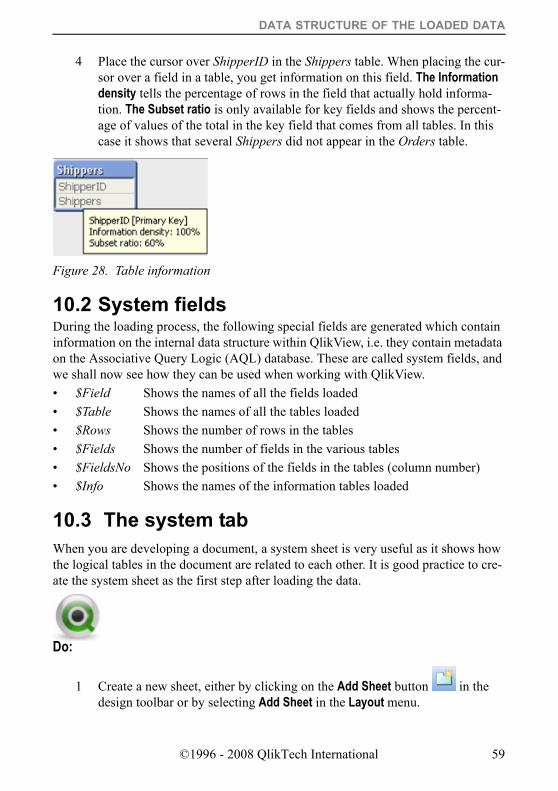
DATA STRUCTURE OF THE LOADED DATA
4 Place the cursor over ShipperID in the Shippers table. When placing the cur-sor over a field in a table, you get information on this field. The Information density tells the percentage of rows in the field that actually hold informa-tion. The Subset ratio is only available for key fields and shows the percent-age of values of the total in the key field that comes from all tables. In this case it shows that several Shippers did not appear in the Orders table.
10.2 System fieldsDuring the loading process, the following special fields are generated which contain information on the internal data structure within QlikView, i.e. they contain metadata on the Associative Query Logic (AQL) database. These are called system fields, and we shall now see how they can be used when working with QlikView.• $Field Shows the names of all the fields loaded• $Table Shows the names of all the tables loaded• $Rows Shows the number of rows in the tables• $Fields Shows the number of fields in the various tables• $FieldsNo Shows the positions of the fields in the tables (column number) • $Info Shows the names of the information tables loaded
10.3 The system tabWhen you are developing a document, a system sheet is very useful as it shows how the logical tables in the document are related to each other. It is good practice to cre-ate the system sheet as the first step after loading the data.
Do:
1 Create a new sheet, either by clicking on the Add Sheet button in the design toolbar or by selecting Add Sheet in the Layout menu.
Figure 28. Table information
©1996 - 2008 QlikTech International 59
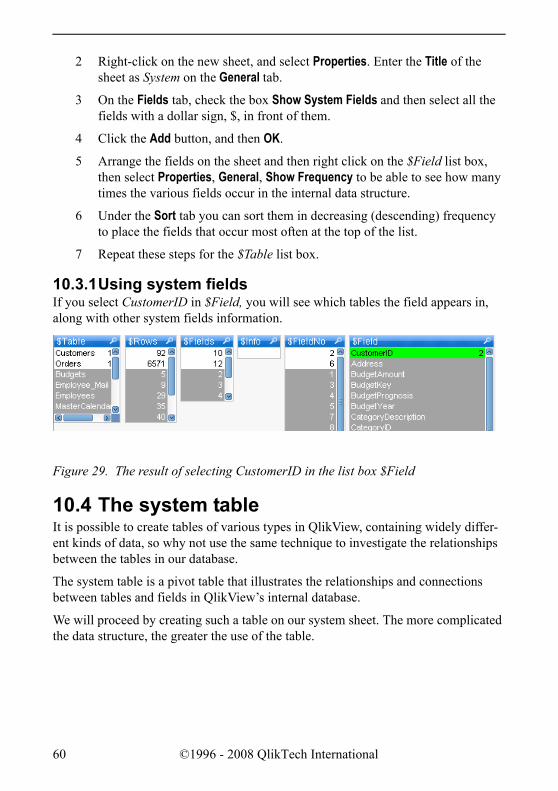
2 Right-click on the new sheet, and select Properties. Enter the Title of the sheet as System on the General tab.
3 On the Fields tab, check the box Show System Fields and then select all the fields with a dollar sign, $, in front of them.
4 Click the Add button, and then OK.
5 Arrange the fields on the sheet and then right click on the $Field list box, then select Properties, General, Show Frequency to be able to see how many times the various fields occur in the internal data structure.
6 Under the Sort tab you can sort them in decreasing (descending) frequency to place the fields that occur most often at the top of the list.
7 Repeat these steps for the $Table list box.
10.3.1Using system fieldsIf you select CustomerID in $Field, you will see which tables the field appears in, along with other system fields information.
10.4 The system tableIt is possible to create tables of various types in QlikView, containing widely differ-ent kinds of data, so why not use the same technique to investigate the relationships between the tables in our database.
The system table is a pivot table that illustrates the relationships and connections between tables and fields in QlikView’s internal database.
We will proceed by creating such a table on our system sheet. The more complicated the data structure, the greater the use of the table.
Figure 29. The result of selecting CustomerID in the list box $Field
60 ©1996 - 2008 QlikTech International
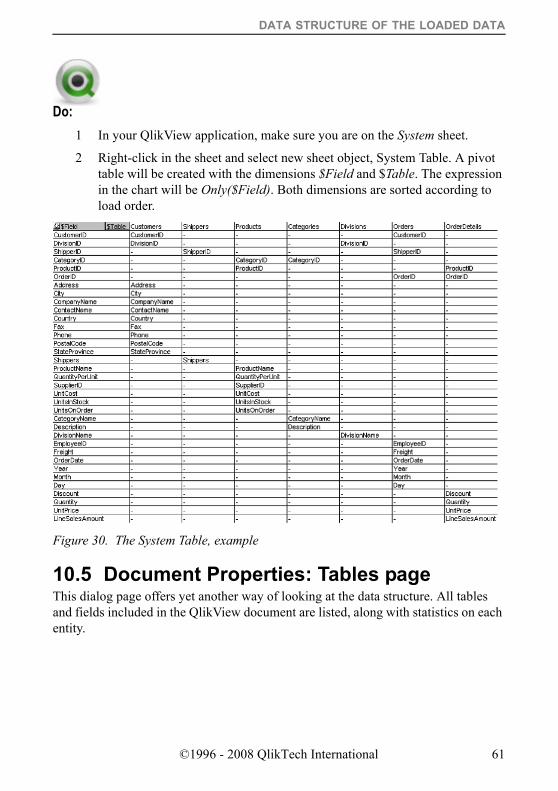
DATA STRUCTURE OF THE LOADED DATA
Do:1 In your QlikView application, make sure you are on the System sheet.
2 Right-click in the sheet and select new sheet object, System Table. A pivot table will be created with the dimensions $Field and $Table. The expression in the chart will be Only($Field). Both dimensions are sorted according to load order.
10.5 Document Properties: Tables pageThis dialog page offers yet another way of looking at the data structure. All tables and fields included in the QlikView document are listed, along with statistics on each entity.
Figure 30. The System Table, example
©1996 - 2008 QlikTech International 61
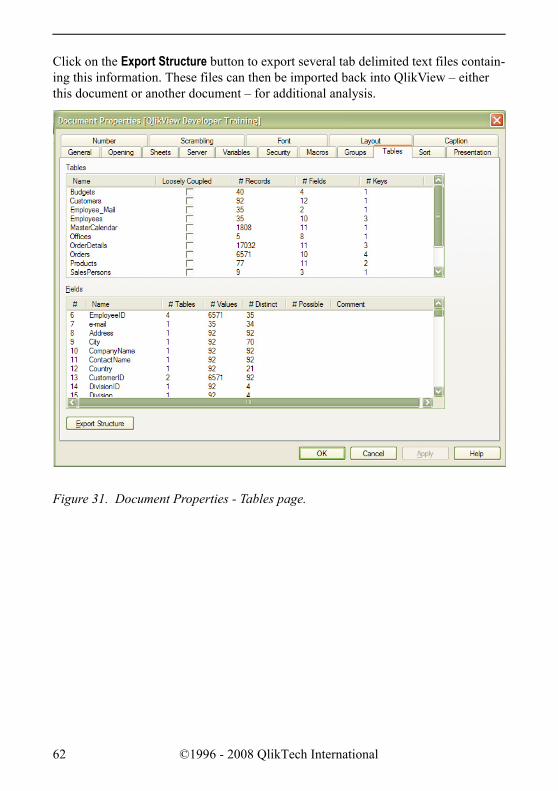
Click on the Export Structure button to export several tab delimited text files contain-ing this information. These files can then be imported back into QlikView – either this document or another document – for additional analysis.
Figure 31. Document Properties - Tables page.
62 ©1996 - 2008 QlikTech International
SCRIPTING CONSIDERATIONS
11 SCRIPTING CONSIDERATIONSWhen reading data into QlikView, we sometimes encounter complex data structures that are not straightforward to understand and may perform less efficiently. When this happens you need to know how to work around the problem. In this chapter we will encounter some of the common problems in QlikView and introduce a method for solving these problems.
11.1 Reading the Shipments tableThere is one table left in the QWT database and it is time to read this now.
Do:1 Go to the Script Editor and go to the Dimensions tab.
2 Click Select to go to the Create Select Statement dialog. Select the Shipments table and read all fields into the QlikView document with a preceding load.
3 Save and Reload the document.
4 Open up the Table Viewer and structure the tables so that the connections are easy to follow.
©1996 - 2008 QlikTech International 63
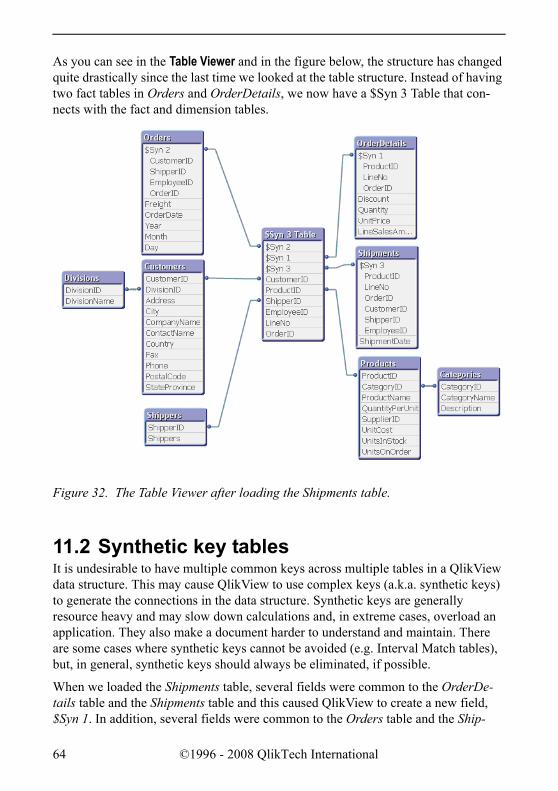
As you can see in the Table Viewer and in the figure below, the structure has changed quite drastically since the last time we looked at the table structure. Instead of having two fact tables in Orders and OrderDetails, we now have a $Syn 3 Table that con-nects with the fact and dimension tables.
11.2 Synthetic key tablesIt is undesirable to have multiple common keys across multiple tables in a QlikView data structure. This may cause QlikView to use complex keys (a.k.a. synthetic keys) to generate the connections in the data structure. Synthetic keys are generally resource heavy and may slow down calculations and, in extreme cases, overload an application. They also make a document harder to understand and maintain. There are some cases where synthetic keys cannot be avoided (e.g. Interval Match tables), but, in general, synthetic keys should always be eliminated, if possible.
When we loaded the Shipments table, several fields were common to the OrderDe-tails table and the Shipments table and this caused QlikView to create a new field, $Syn 1. In addition, several fields were common to the Orders table and the Ship-
Figure 32. The Table Viewer after loading the Shipments table.
64 ©1996 - 2008 QlikTech International
SCRIPTING CONSIDERATIONS
ments table and caused QlikView to generate a $Syn 2 and $Syn 3 field. It is not uncommon to get a data structure like this in QlikView; but, because of the reasons above, you should always try to avoid this kind of structure. There are several ways to eliminate synthetic keys in QlikView and it is important to know the data structure and the data sources to create the correct solution.
Use the Business Plan and review the rules for the Shipments table. This information can be found on the “Shipments Data” page of the Busienss Plan. We can see that there is a one to one relationship between the OrderDetails table and the Shipments table. We can also see that the field ProductID gets the values directly from the OrderDetails Table. Since this is the case, we can remove the ProductID field from the Shipments table. To get a unique key between the OrderDetails table and the Shipments table, we can create a composite key of the remaining common fields OrderID and LineNo.
Do:1 Go to the Script Editor.2 Locate the Shipments table.3 Make a comment of the field ProductID.
4 Create a composite field of OrderID and LineNo using the “&” to concate-nate the fields. Make sure to put a separator in between the fields as well. Name the key field OrderLineKey.
5 Use the autonumber function to get a number instead of text for the key field. This is especially useful when working with large tables since numeric values takes up less memory than text values.
Comment the fields OrderID and LineNo. This is necessary to avoid the syn-thetic key and have only one (OrderLineKey) connecting field between the Shipments and the OrderDetails tables.
The script should look as follows://*************** Shipments table *************** Shipments: LOAD CustomerID,
EmployeeID, //LineNo, //OrderID, autonumber(OrderID &'-'& LineNo) as OrderLineKey, //ProductID,
©1996 - 2008 QlikTech International 65
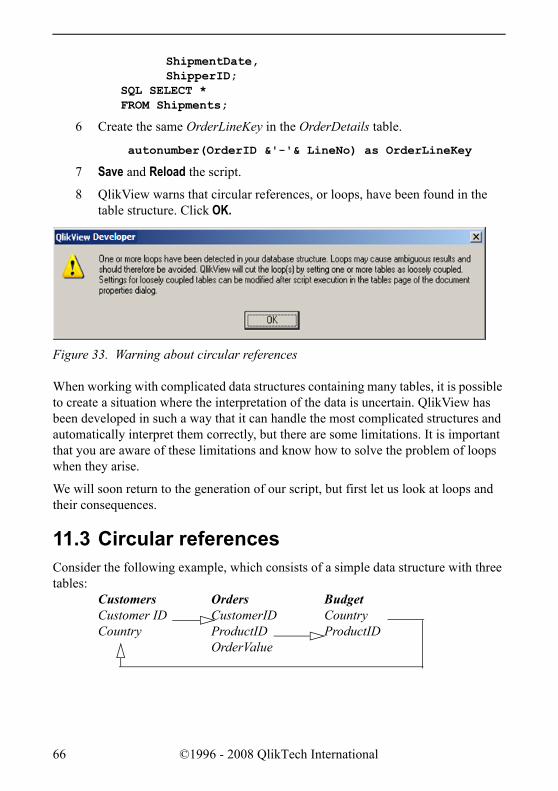
ShipmentDate, ShipperID;
SQL SELECT * FROM Shipments;
6 Create the same OrderLineKey in the OrderDetails table.
autonumber(OrderID &'-'& LineNo) as OrderLineKey
7 Save and Reload the script.
8 QlikView warns that circular references, or loops, have been found in the table structure. Click OK.
When working with complicated data structures containing many tables, it is possible to create a situation where the interpretation of the data is uncertain. QlikView has been developed in such a way that it can handle the most complicated structures and automatically interpret them correctly, but there are some limitations. It is important that you are aware of these limitations and know how to solve the problem of loops when they arise.
We will soon return to the generation of our script, but first let us look at loops and their consequences.
11.3 Circular referencesConsider the following example, which consists of a simple data structure with three tables:
Customers Orders BudgetCustomer ID CustomerID CountryCountry ProductID ProductID
OrderValue
Figure 33. Warning about circular references
66 ©1996 - 2008 QlikTech International
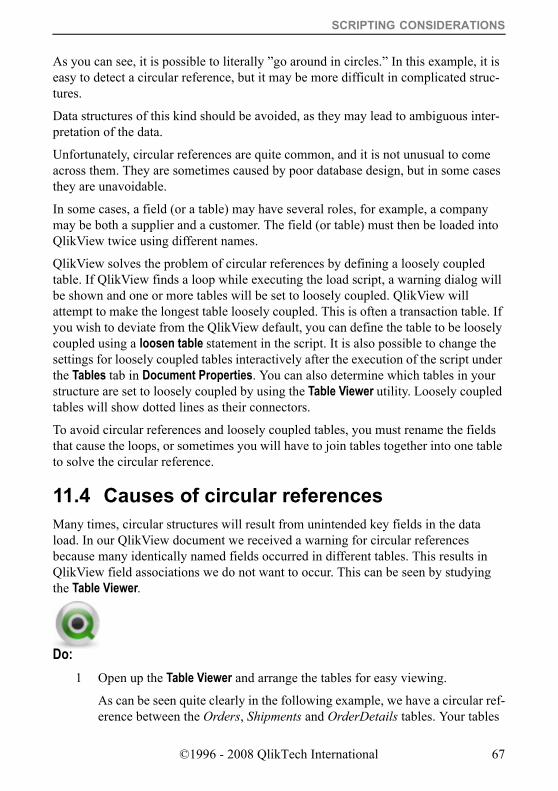
SCRIPTING CONSIDERATIONS
As you can see, it is possible to literally ”go around in circles.” In this example, it is easy to detect a circular reference, but it may be more difficult in complicated struc-tures.
Data structures of this kind should be avoided, as they may lead to ambiguous inter-pretation of the data.
Unfortunately, circular references are quite common, and it is not unusual to come across them. They are sometimes caused by poor database design, but in some cases they are unavoidable.
In some cases, a field (or a table) may have several roles, for example, a company may be both a supplier and a customer. The field (or table) must then be loaded into QlikView twice using different names.
QlikView solves the problem of circular references by defining a loosely coupled table. If QlikView finds a loop while executing the load script, a warning dialog will be shown and one or more tables will be set to loosely coupled. QlikView will attempt to make the longest table loosely coupled. This is often a transaction table. If you wish to deviate from the QlikView default, you can define the table to be loosely coupled using a loosen table statement in the script. It is also possible to change the settings for loosely coupled tables interactively after the execution of the script under the Tables tab in Document Properties. You can also determine which tables in your structure are set to loosely coupled by using the Table Viewer utility. Loosely coupled tables will show dotted lines as their connectors.
To avoid circular references and loosely coupled tables, you must rename the fields that cause the loops, or sometimes you will have to join tables together into one table to solve the circular reference.
11.4 Causes of circular referencesMany times, circular structures will result from unintended key fields in the data load. In our QlikView document we received a warning for circular references because many identically named fields occurred in different tables. This results in QlikView field associations we do not want to occur. This can be seen by studying the Table Viewer.
Do:1 Open up the Table Viewer and arrange the tables for easy viewing.
As can be seen quite clearly in the following example, we have a circular ref-erence between the Orders, Shipments and OrderDetails tables. Your tables
©1996 - 2008 QlikTech International 67
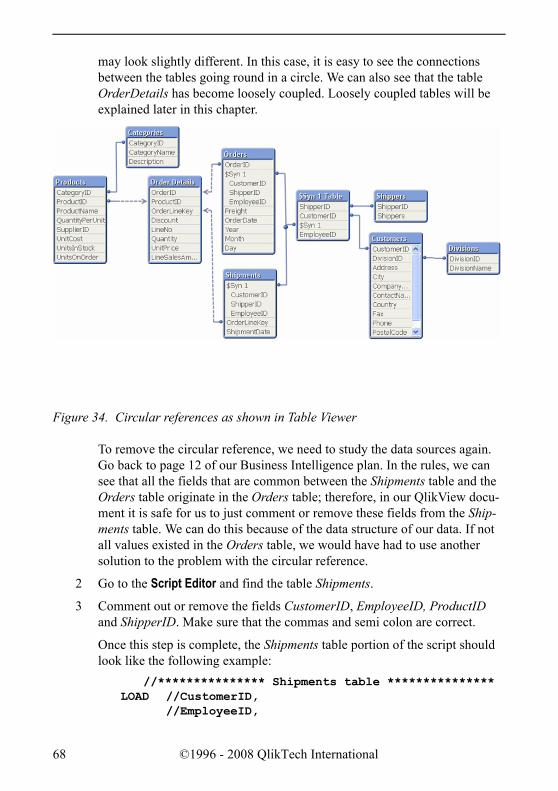
may look slightly different. In this case, it is easy to see the connections between the tables going round in a circle. We can also see that the table OrderDetails has become loosely coupled. Loosely coupled tables will be explained later in this chapter.
To remove the circular reference, we need to study the data sources again. Go back to page 12 of our Business Intelligence plan. In the rules, we can see that all the fields that are common between the Shipments table and the Orders table originate in the Orders table; therefore, in our QlikView docu-ment it is safe for us to just comment or remove these fields from the Ship-ments table. We can do this because of the data structure of our data. If not all values existed in the Orders table, we would have had to use another solution to the problem with the circular reference.
2 Go to the Script Editor and find the table Shipments.
3 Comment out or remove the fields CustomerID, EmployeeID, ProductID and ShipperID. Make sure that the commas and semi colon are correct.
Once this step is complete, the Shipments table portion of the script should look like the following example:
//*************** Shipments table *************** LOAD //CustomerID,
//EmployeeID,
Figure 34. Circular references as shown in Table Viewer
68 ©1996 - 2008 QlikTech International

SCRIPTING CONSIDERATIONS
//LineNo, //OrderID, //ProductID, autonumber(OrderID & '-' & LineNo) as OrderLineKey, ShipmentDate; //ShipperID;
SQL SELECT * FROM Shipments;
4 Save the document and Reload the script.
5 Open the Table Viewer and look at the result. The circular reference should have disappeared and there should be no synthetic keys.
11.5 Loosely Coupled TablesIn a loosely coupled table, the associative logic in QlikView is internally discon-nected. This means that selections in the non-key fields in the table do not affect other tables or other fields within this table. In certain cases, this can be quite effec-tive, although in our case, we do not want to implement this feature. To understand the concept of loosely coupled, consider the example below:
Below we can see table boxes created by three different tables.
If we choose the value 2 in field B, the following will occur:
The selection affects all the tables. Let us now retain this value, but instead make Table 2 loosely coupled. This means that the logic between fields A and C is discon-nected. The result is:
Note that Table 2 shown previously is a table box and not the actual table. The table box shows all the possible combinations of columns. As there is no logical connec-tion between fields A and C, all the possible combinations of their values are shown.
©1996 - 2008 QlikTech International 69

Since Table 2 is loosely coupled, the selections made in Table 1 will not propagate through to Table 3.
70 ©1996 - 2008 QlikTech International
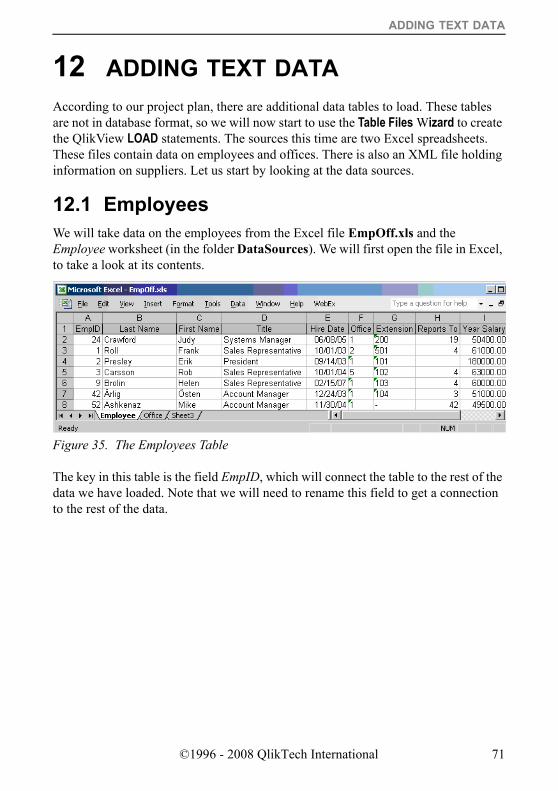
ADDING TEXT DATA
12 ADDING TEXT DATAAccording to our project plan, there are additional data tables to load. These tables are not in database format, so we will now start to use the Table Files Wizard to create the QlikView LOAD statements. The sources this time are two Excel spreadsheets. These files contain data on employees and offices. There is also an XML file holding information on suppliers. Let us start by looking at the data sources.
12.1 EmployeesWe will take data on the employees from the Excel file EmpOff.xls and the Employee worksheet (in the folder DataSources). We will first open the file in Excel, to take a look at its contents.
The key in this table is the field EmpID, which will connect the table to the rest of the data we have loaded. Note that we will need to rename this field to get a connection to the rest of the data.
Figure 35. The Employees Table
©1996 - 2008 QlikTech International 71
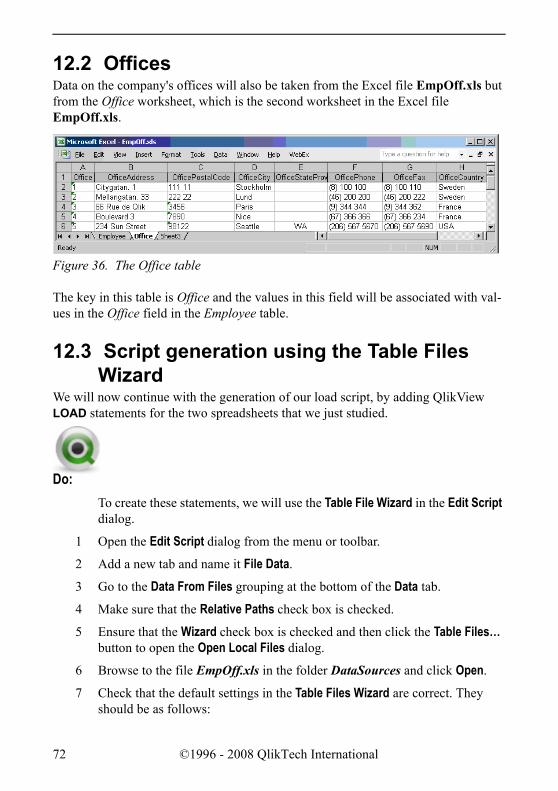
12.2 OfficesData on the company's offices will also be taken from the Excel file EmpOff.xls but from the Office worksheet, which is the second worksheet in the Excel file EmpOff.xls.
The key in this table is Office and the values in this field will be associated with val-ues in the Office field in the Employee table.
12.3 Script generation using the Table Files Wizard
We will now continue with the generation of our load script, by adding QlikView LOAD statements for the two spreadsheets that we just studied.
Do:To create these statements, we will use the Table File Wizard in the Edit Script dialog.
1 Open the Edit Script dialog from the menu or toolbar.
2 Add a new tab and name it File Data.
3 Go to the Data From Files grouping at the bottom of the Data tab.
4 Make sure that the Relative Paths check box is checked.
5 Ensure that the Wizard check box is checked and then click the Table Files… button to open the Open Local Files dialog.
6 Browse to the file EmpOff.xls in the folder DataSources and click Open.
7 Check that the default settings in the Table Files Wizard are correct. They should be as follows:
Figure 36. The Office table
72 ©1996 - 2008 QlikTech International
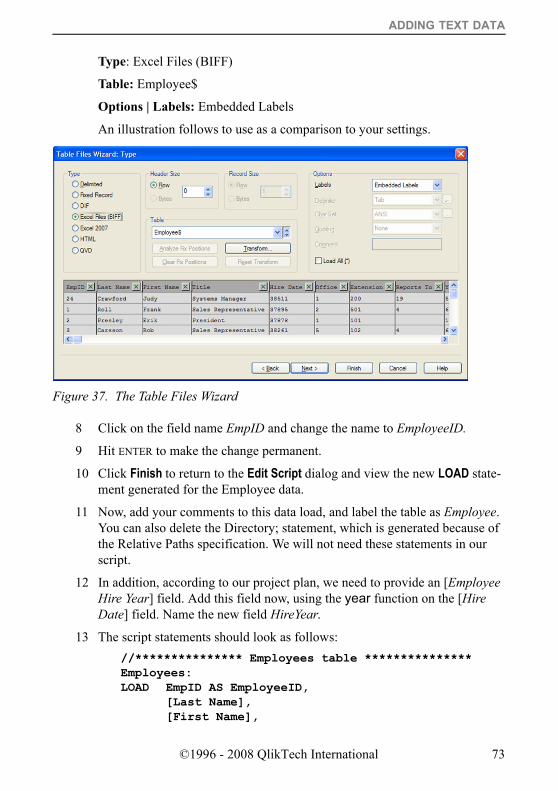
ADDING TEXT DATA
Type: Excel Files (BIFF)
Table: Employee$
Options | Labels: Embedded Labels
An illustration follows to use as a comparison to your settings.
8 Click on the field name EmpID and change the name to EmployeeID.
9 Hit ENTER to make the change permanent.
10 Click Finish to return to the Edit Script dialog and view the new LOAD state-ment generated for the Employee data.
11 Now, add your comments to this data load, and label the table as Employee. You can also delete the Directory; statement, which is generated because of the Relative Paths specification. We will not need these statements in our script.
12 In addition, according to our project plan, we need to provide an [Employee Hire Year] field. Add this field now, using the year function on the [Hire Date] field. Name the new field HireYear.
13 The script statements should look as follows://*************** Employees table *************** Employees: LOAD EmpID AS EmployeeID,
[Last Name], [First Name],
Figure 37. The Table Files Wizard
©1996 - 2008 QlikTech International 73
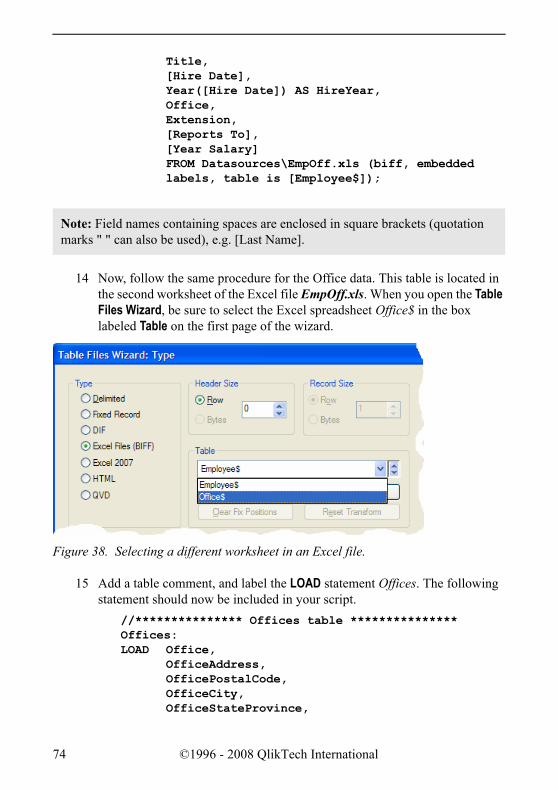
Note: Field names containing spaces are enclosed in square brackets (quotation marks " " can also be used), e.g. [Last Name].
Title, [Hire Date], Year([Hire Date]) AS HireYear, Office, Extension, [Reports To], [Year Salary] FROM Datasources\EmpOff.xls (biff, embedded labels, table is [Employee$]);
14 Now, follow the same procedure for the Office data. This table is located in the second worksheet of the Excel file EmpOff.xls. When you open the Table Files Wizard, be sure to select the Excel spreadsheet Office$ in the box labeled Table on the first page of the wizard.
15 Add a table comment, and label the LOAD statement Offices. The following statement should now be included in your script.
//*************** Offices table *************** Offices: LOAD Office,
OfficeAddress, OfficePostalCode, OfficeCity, OfficeStateProvince,
Figure 38. Selecting a different worksheet in an Excel file.
74 ©1996 - 2008 QlikTech International
ADDING TEXT DATA
OfficePhone, OfficeFax, OfficeCountry
FROM Datasources\EmpOff.xls (biff, embedded labels, table is [Office$]);
16 Save and Reload the document.
©1996 - 2008 QlikTech International 75

76 ©1996 - 2008 QlikTech International
LOADING AN XML FILE
13 LOADING AN XML FILEThe acronym XML stands for Extensible Markup Language. It is a simple, flexible text format. Originally it was designed to meet the challenges of large scale elec-tronic publishing. Today, XML is also being used in a wide variety of ways to store data.
13.1 Loading a text file in XML Format
Do:1 Open the Edit Script dialog from the menu or toolbar.
2 Position your cursor at the bottom of the Dimensions tab, and add a comment for the Suppliers data table load.
3 Ensure that the Wizard check box is checked and then click the XML Files… button to open the Table Files Wizard: Source dialog.
4 Browse to the file suppliers.xml in the folder DataSources and click Open.5 Press next to see how QlikView interprets the XML.
6 Select the Tables tab to see what tables the XML file contains.
©1996 - 2008 QlikTech International 77
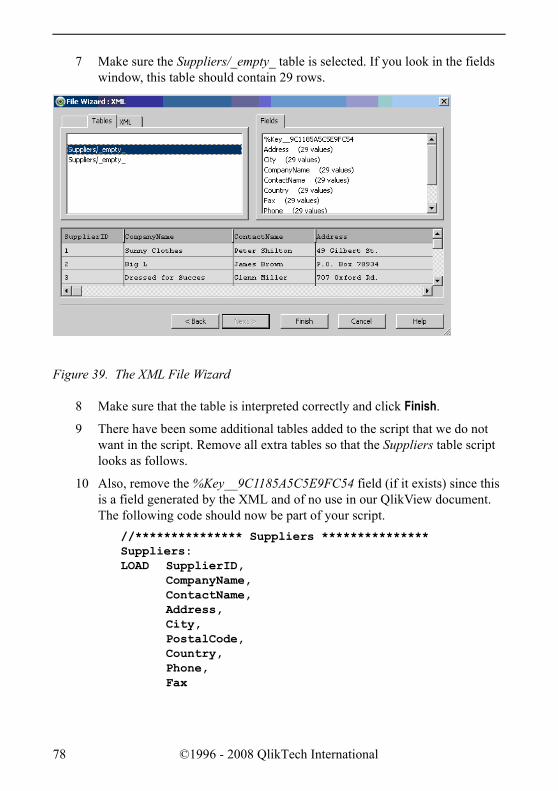
7 Make sure the Suppliers/_empty_ table is selected. If you look in the fields window, this table should contain 29 rows.
8 Make sure that the table is interpreted correctly and click Finish.
9 There have been some additional tables added to the script that we do not want in the script. Remove all extra tables so that the Suppliers table script looks as follows.
10 Also, remove the %Key__9C1185A5C5E9FC54 field (if it exists) since this is a field generated by the XML and of no use in our QlikView document. The following code should now be part of your script.
//*************** Suppliers *************** Suppliers: LOAD SupplierID,
CompanyName, ContactName, Address, City, PostalCode, Country, Phone, Fax
Figure 39. The XML File Wizard
78 ©1996 - 2008 QlikTech International
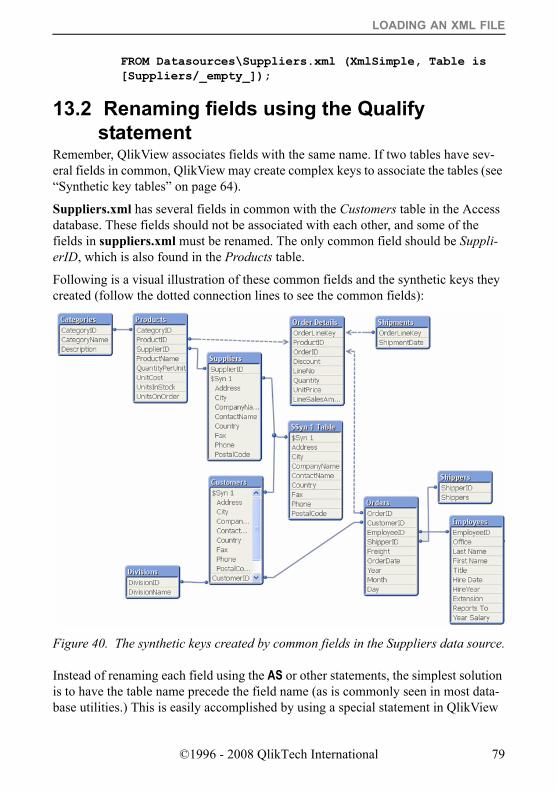
LOADING AN XML FILE
FROM Datasources\Suppliers.xml (XmlSimple, Table is [Suppliers/_empty_]);
13.2 Renaming fields using the Qualify statement
Remember, QlikView associates fields with the same name. If two tables have sev-eral fields in common, QlikView may create complex keys to associate the tables (see “Synthetic key tables” on page 64).
Suppliers.xml has several fields in common with the Customers table in the Access database. These fields should not be associated with each other, and some of the fields in suppliers.xml must be renamed. The only common field should be Suppli-erID, which is also found in the Products table.
Following is a visual illustration of these common fields and the synthetic keys they created (follow the dotted connection lines to see the common fields):
Instead of renaming each field using the AS or other statements, the simplest solution is to have the table name precede the field name (as is commonly seen in most data-base utilities.) This is easily accomplished by using a special statement in QlikView
Figure 40. The synthetic keys created by common fields in the Suppliers data source.
©1996 - 2008 QlikTech International 79
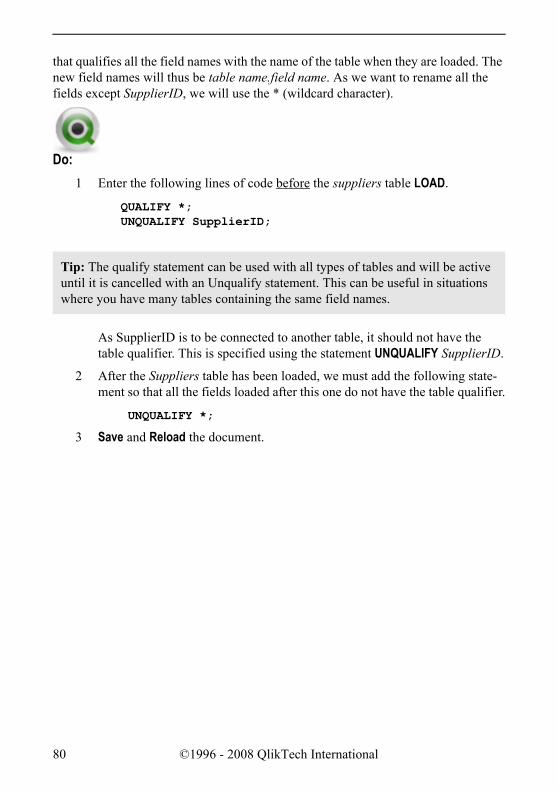
that qualifies all the field names with the name of the table when they are loaded. The new field names will thus be table name.field name. As we want to rename all the fields except SupplierID, we will use the * (wildcard character).
Do:
Tip: The qualify statement can be used with all types of tables and will be active until it is cancelled with an Unqualify statement. This can be useful in situations where you have many tables containing the same field names.
1 Enter the following lines of code before the suppliers table LOAD.
QUALIFY *; UNQUALIFY SupplierID;
As SupplierID is to be connected to another table, it should not have the table qualifier. This is specified using the statement UNQUALIFY SupplierID.
2 After the Suppliers table has been loaded, we must add the following state-ment so that all the fields loaded after this one do not have the table qualifier.
UNQUALIFY *;
3 Save and Reload the document.
80 ©1996 - 2008 QlikTech International
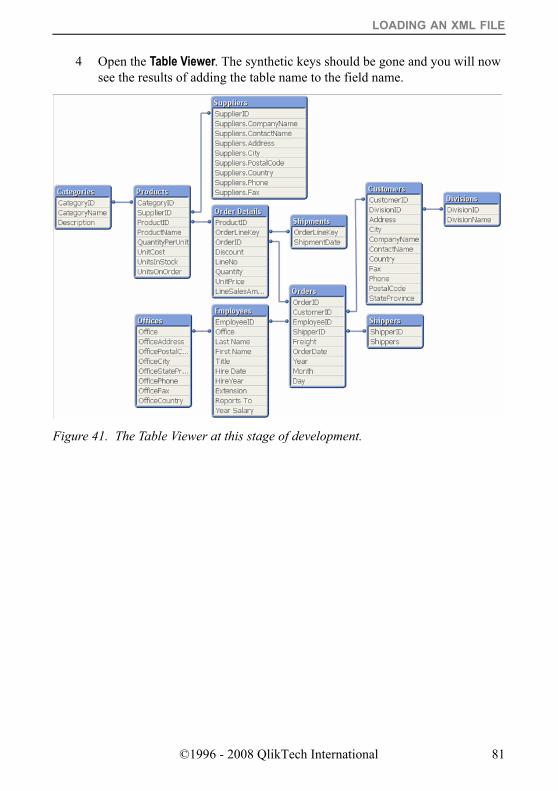
LOADING AN XML FILE
4 Open the Table Viewer. The synthetic keys should be gone and you will now see the results of adding the table name to the field name.
Figure 41. The Table Viewer at this stage of development.
©1996 - 2008 QlikTech International 81

82 ©1996 - 2008 QlikTech International
KEY FIELDS
14 KEY FIELDSRemember, key fields are fields that are common to one or more tables (associated fields). When a field occurs in more than one table, it may be unclear to QlikView which table to use to calculate the frequency of the data.
14.1 Example predicamentAssume that we have a table called Orders with 200 records containing order num-bers (OrderID). We also have a table called OrderDetails, which contains 1000 records of order numbers. These numbers are also found in the first table.
The two tables will be associated via the common field OrderID. The problem arises when you want to know the exact number of unique OrderID’s. Is it 1000, 200 or 1200? We know, based on the information we have, that the correct answer is 200 unique OrderID’s, but this is not always clear to QlikView.
In this case, QlikView will look for a main table. It may choose the right one, but in most cases the program will have to guess.
As guesses can lead to serious consequences, QlikView has been designed so that it does not allow certain operations if there is any doubt as to which table is the main table. These operations include, for instance, calculating the frequency.
14.2 How does this affect you?You should bear in mind the following limitations when working with key fields.• In some cases, it is not possible to obtain information on frequency in a list box
that shows key fields. For example, you will see that the checkbox Show Fre-quency is inactivated for the CustomerID and EmployeeID fields.
• In most cases, it will not be possible to use functions for calculating the fre-quency of key fields in charts (Count, etc.) You must use a Distinct qualifier in these expressions.
• In general, it is good practice to avoid using key fields in list boxes and expres-sions. Key fields should be used for linking tables together, and not for display-ing data in a QlikView document. In the next section we will learn how you can still use the values needed in your document as well as use key fields for linking.
Tip: Look above the Edit window when creating an expression. If you get the error message Dangerous Field Name(s): Fieldname you have used a Key field in the expression that you are not allowed to use in that type of calculation.
©1996 - 2008 QlikTech International 83

14.3 Loading a field into a table multiple timesThere is a relatively simple solution to the problem of key fields and the calculation of data frequency. You load the field you want to use to calculate the frequency once again under another name.
The problem we described above can thus be solved in the following way:
LOAD…, OrderID, OrderID AS OrderIDCount,
FROM Orders;
You can now use the new field (not associated) in a list box that shows the frequency or a chart with functions to calculate the frequency. The new field name can easily be concealed by giving it another label so that it will not confuse users of the document. If you create a calculated field the data is assumed to be unique. If it is not, you need to perform a distinct count.
This solution works well in smaller applications, but if you have applications with much data, this solution can consume memory since you often want to count distinct on these fields.
14.4 Using a record counter on key fieldsInstead of using the key field a second time, we can use a record counter in the table where we want to make the calculation. A record counter is simply the number 1 for each row in the table connected to the ID field of the table. For instance, if we want to count the number of orders, we create a record counter in the Orders table and use the sum of the record counter in charts.
The record counter can be created in the following way:
LOAD …, OrderID, 1 AS OrderRecordCounter, …
FROM Orders;
This way of solving the problem is more efficient when working with large amounts of data since a sum of a numeric value takes very little power compared to a count of a value.
Note: You need to be careful when creating both Count Fields and Record Coun-ters so that you create the new field in the correct table.
84 ©1996 - 2008 QlikTech International
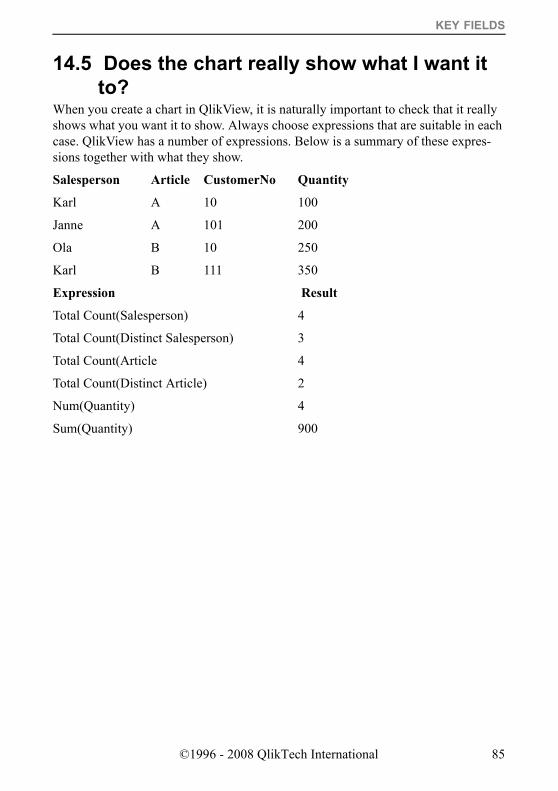
KEY FIELDS
14.5 Does the chart really show what I want it to?
When you create a chart in QlikView, it is naturally important to check that it really shows what you want it to show. Always choose expressions that are suitable in each case. QlikView has a number of expressions. Below is a summary of these expres-sions together with what they show.
Salesperson Article CustomerNo Quantity
Karl A 10 100
Janne A 101 200
Ola B 10 250
Karl B 111 350
Expression Result
Total Count(Salesperson) 4
Total Count(Distinct Salesperson) 3
Total Count(Article 4
Total Count(Distinct Article) 2
Num(Quantity) 4
Sum(Quantity) 900
©1996 - 2008 QlikTech International 85

86 ©1996 - 2008 QlikTech International
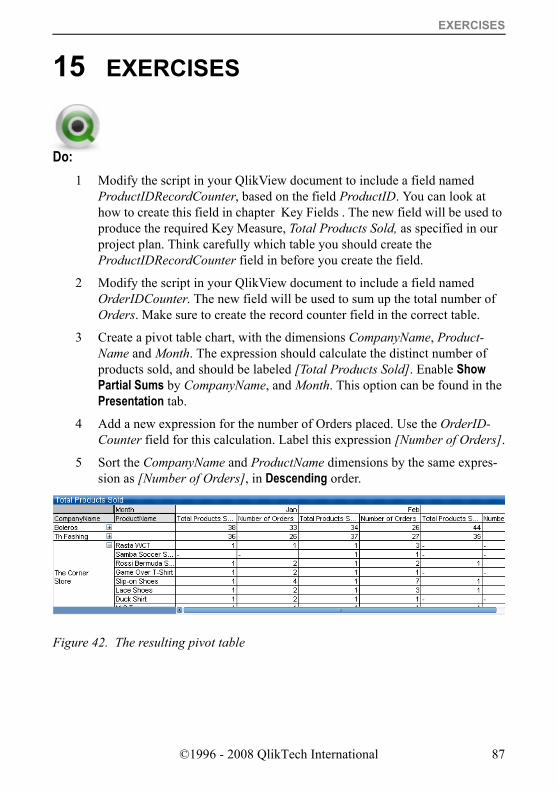
EXERCISES
15 EXERCISES
Do:1 Modify the script in your QlikView document to include a field named
ProductIDRecordCounter, based on the field ProductID. You can look at how to create this field in chapter Key Fields . The new field will be used to produce the required Key Measure, Total Products Sold, as specified in our project plan. Think carefully which table you should create the ProductIDRecordCounter field in before you create the field.
2 Modify the script in your QlikView document to include a field named OrderIDCounter. The new field will be used to sum up the total number of Orders. Make sure to create the record counter field in the correct table.
3 Create a pivot table chart, with the dimensions CompanyName, Product-Name and Month. The expression should calculate the distinct number of products sold, and should be labeled [Total Products Sold]. Enable Show Partial Sums by CompanyName, and Month. This option can be found in the Presentation tab.
4 Add a new expression for the number of Orders placed. Use the OrderID-Counter field for this calculation. Label this expression [Number of Orders].
5 Sort the CompanyName and ProductName dimensions by the same expres-sion as [Number of Orders], in Descending order.
Figure 42. The resulting pivot table
©1996 - 2008 QlikTech International 87

88 ©1996 - 2008 QlikTech International
GENERATING DATA IN THE QLIKVIEW SCRIPT
16 GENERATING DATA IN THE QLIKVIEW SCRIPT
In this chapter we will look at some different methods of creating data directly in the QlikView script. We will look at how we can use tables read into QlikView previ-ously in the script and we will also look at how we can generate data directly in QlikView.
In our project plan, one of the Key Dimensions listed is Sales Person. Since there is no field included in our source data for Sales Person, we will need to generate this field in QlikView during the data load. In this chapter, we will practice resident loads and conditional loads, as well as introduce the concept of creating multiple logical tables in QlikView based on a single source data table.
16.1 Resident LoadIn this section, we will learn how to create a new logical table in QlikView, based on a previously loaded (resident) table. As we can see in the project plan, on page , the SalesPerson is a concatenated field of First Name and Last Name in the Employees table. We will start by creating this field in the Employees table since we are not really interested in only the first or the last names of our employees.
Do:1 Open the Edit Script dialog.
2 Find the Employees table on the tab File Data and replace the fields First Name and Last Name with the following row:
[First Name]&' '&[Last Name] AS Name,
3 Add a new tab to the script and name the new tab Sales Person.
We will now add another table load to the script, but this time, instead of using a wizard to create the code, we will copy existing code, and modify it. First, locate the Employee table load in the File Data script tab. Copy (high-light and CTRL+C, or Edit … Copy) all the lines for this statement. Then switch back to the Sales Person tab, and Paste (CTRL+V, or Edit … Paste). You should now have a duplicate of the Employee table load in the new tab. Edit the LOAD statement as follows:
4 Change the table name to SalesPersons.
©1996 - 2008 QlikTech International 89
5 Change the rename of EmpID to use the QlikView field name of Employ-eeID (we are no longer reading from the source data).
6 Remove the First Name and Last Name concatenation operation of the field Name and use the field SalesPersons.
7 Remove the [Hire Date], Office, Extension, [Reports To], and [Year Salary] fields from the LOAD statement.
8 Remove the comma from the Title field (it is now the last field in this load) and rename this field to SalesTitle.
9 Remove the FROM specification, since we will not be reading from a disk file for this load.
10 Add a RESIDENT specification, pointing to the resident table we wish to load from, at the same location as the earlier FROM.
Your script should now look as follows://************** SalesPersons table ************** SalesPersons: LOAD EmployeeID, Name AS SalesPerson, Title AS SalesTitle RESIDENT Employees;
Now we want to limit the load of all Employee data records to just those we can identify as a sales person. To do this, we need to make another change to the script code. First, remove the semicolon (;) located after Resident Employee. Next, add the where condition after the Resident line as follows:
WHERE Title LIKE 'Sales*' or Title='President';
11 The LIKE operator works with the wildcard (*) and searches the field and finds all values that start with Sales.
12 Save and Reload the document. Add list boxes for Name, Title, and SalesTitle to the Main sheet. Select All in the SalesTitle field, and notice that only some of the Name and Title values are shown as possible values (white). For a value of the original Employees table to be included in the new logical Sales-Persons table, it must satisfy at least one of the conditions we have defined. The first condition is that the value in the field Title should start with Sales. The second condition is that the field Title is equal to President.
13 Save your document.
90 ©1996 - 2008 QlikTech International
GENERATING DATA IN THE QLIKVIEW SCRIPT
16.2 Advanced – Using Orders to determine Sales Person.
We just used a rather simplistic method that allowed us to sample the field values required for the field SalesPersons. This method is perfectly adequate, but what hap-pens if we get Employees that are involved in selling and have a Title not beginning with Sales? To get away from this problem, we can obtain the same result by using a more elegant solution.
We begin by observing that all sales people are included in our sales data. It follows that they must occur in the field EmployeeID in the table Orders. We begin by creat-ing a new field EmployeeSalesID in the script where Orders table is being loaded. By referring to this field later in the script, we can insure that all employees that have been credited with sales will be listed in the SalesPerson field.
The following steps will walk us through this process.
Do:1 Add the following script line in the Orders table LOAD statement immedi-
ately after the loading of the EmployeeID field.EmployeeID as EmployeeSalesID,
2 Next, comment the WHERE condition in the SalesPerson table LOAD state-ment and create a new WHERE condition to use the QlikView exists function.
SalesPersons: LOAD EmployeeID,
Name AS SalesPerson, Title AS SalesTitle RESIDENT Employees
//WHERE Title LIKE 'Sales*' or Title='President'; WHERE exists(EmployeeSalesID, EmployeeID);
The condition in the Where clause checks that the loaded data has matching values in the field EmployeeSalesID. As the name implies, the exists func-tion can be used to check whether a specific field value exists in a specified field of the data loaded so far. Remember to be careful of the order of your script statements, since the reference field should be populated prior to checking for values. In this example, the Orders table must be loaded prior to the Sales_Person table for this condition to work properly.
3 Save and close the Edit Script dialog.
©1996 - 2008 QlikTech International 91
4 Verify the functionality of your script by adding an OrderID list box, right click and choose Select All. The associated values in the other list boxes should easily be apparent from what we know of this data.
16.3 Creating data using Load Inline and Autogenerate
There are two (2) additional time dimension fields required in our QlikView docu-ment according to the Trends section of our project plan. We need to add Quarter and MonthYear. We will use a fairly simple technique for generating Quarter that will introduce the concepts of Load Inline, and autogenerate tables. For MonthYear, we will introduce some additional QlikView date functions, as well as how to specify date formats.
16.4 Inline tablesYou may remember that earlier in the course, we talked about several ways to load data in the QlikView script. We have already been introduced to many of these tech-niques, and now we will meet a new one.
In some cases, it may be advantageous to enter table data directly in the script. This is done with the aid of a so-called load inline statement.
Do:1 Open the Edit Script dialog from the menu or toolbar.
2 Position your cursor near the top after the Connect statement on the Main tab. Add a comment named Quarters Defined for loading Quarter data.
3 Add the following statement to the script:Quarters: LOAD* INLINE [
Month, Quarter 1,Q1 2,Q1 3,Q1 4,Q2 5,Q2 6,Q2 7,Q3 8,Q3 9,Q3
92 ©1996 - 2008 QlikTech International
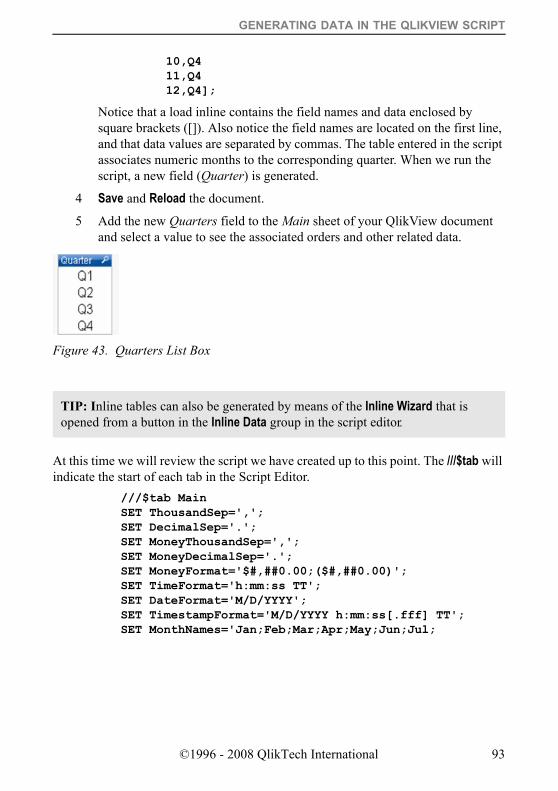
GENERATING DATA IN THE QLIKVIEW SCRIPT
10,Q4 11,Q4 12,Q4];
Notice that a load inline contains the field names and data enclosed by square brackets ([]). Also notice the field names are located on the first line, and that data values are separated by commas. The table entered in the script associates numeric months to the corresponding quarter. When we run the script, a new field (Quarter) is generated.
TIP: Inline tables can also be generated by means of the Inline Wizard that is opened from a button in the Inline Data group in the script editor.
4 Save and Reload the document.
5 Add the new Quarters field to the Main sheet of your QlikView document and select a value to see the associated orders and other related data.
At this time we will review the script we have created up to this point. The ///$tab will indicate the start of each tab in the Script Editor.
///$tab Main SET ThousandSep=','; SET DecimalSep='.'; SET MoneyThousandSep=','; SET MoneyDecimalSep='.'; SET MoneyFormat='$#,##0.00;($#,##0.00)'; SET TimeFormat='h:mm:ss TT'; SET DateFormat='M/D/YYYY'; SET TimestampFormat='M/D/YYYY h:mm:ss[.fff] TT'; SET MonthNames='Jan;Feb;Mar;Apr;May;Jun;Jul;
Figure 43. Quarters List Box
©1996 - 2008 QlikTech International 93
Aug;Sep;Oct;Nov;Dec'; SET DayNames='Mon;Tue;Wed;Thu;Fri;Sat;Sun';
CONNECT TO [Provider=Microsoft.Jet.OLEDB.4.0;User ID=Admin;Data Source=\Datasources\QWT.mdb;
//************** Quarters defined ************** Quarters: LOAD * INLINE [
Month, Quarter 1,Q1 2,Q1 3,Q1 4,Q2 5,Q2 6,Q2 7,Q3 8,Q3 9,Q3 10,Q4 11,Q4 12,Q4];
///$tab Dimensions //************** Customers table ************** Customers: LOAD Address,
City, CompanyName, ContactName, Country, CustomerID, DivisionID, Fax, Phone, PostalCode, StateProvince; SQL SELECT * FROM Customers;
//************** Shippers table ************** Shippers: LOAD CompanyName AS Shippers,
ShipperID;
94 ©1996 - 2008 QlikTech International
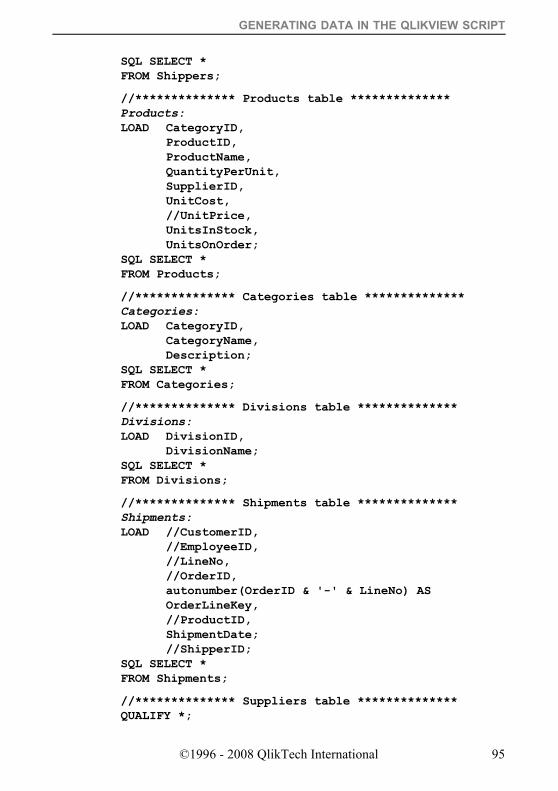
GENERATING DATA IN THE QLIKVIEW SCRIPT
SQL SELECT * FROM Shippers;
//************** Products table ************** Products: LOAD CategoryID,
ProductID, ProductName, QuantityPerUnit, SupplierID, UnitCost, //UnitPrice, UnitsInStock, UnitsOnOrder;
SQL SELECT * FROM Products;
//************** Categories table ************** Categories: LOAD CategoryID,
CategoryName, Description;
SQL SELECT * FROM Categories;
//************** Divisions table ************** Divisions: LOAD DivisionID,
DivisionName; SQL SELECT * FROM Divisions;
//************** Shipments table ************** Shipments: LOAD //CustomerID,
//EmployeeID, //LineNo, //OrderID, autonumber(OrderID & '-' & LineNo) AS OrderLineKey, //ProductID, ShipmentDate; //ShipperID;
SQL SELECT * FROM Shipments;
//************** Suppliers table ************** QUALIFY *;
©1996 - 2008 QlikTech International 95
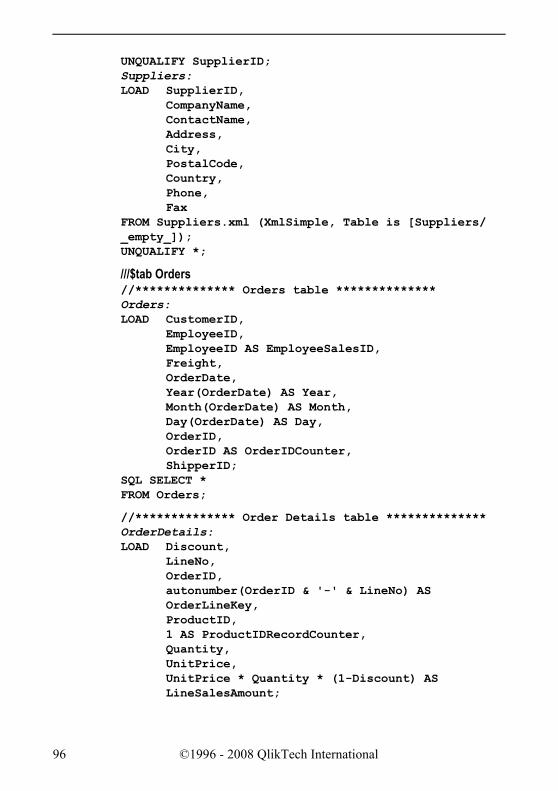
UNQUALIFY SupplierID; Suppliers: LOAD SupplierID,
CompanyName, ContactName, Address, City, PostalCode, Country, Phone, Fax
FROM Suppliers.xml (XmlSimple, Table is [Suppliers/_empty_]); UNQUALIFY *;
///$tab Orders //************** Orders table ************** Orders: LOAD CustomerID,
EmployeeID, EmployeeID AS EmployeeSalesID, Freight, OrderDate, Year(OrderDate) AS Year, Month(OrderDate) AS Month, Day(OrderDate) AS Day, OrderID, OrderID AS OrderIDCounter, ShipperID;
SQL SELECT * FROM Orders;
//************** Order Details table ************** OrderDetails: LOAD Discount,
LineNo, OrderID, autonumber(OrderID & '-' & LineNo) AS OrderLineKey, ProductID, 1 AS ProductIDRecordCounter, Quantity, UnitPrice, UnitPrice * Quantity * (1-Discount) AS LineSalesAmount;
96 ©1996 - 2008 QlikTech International
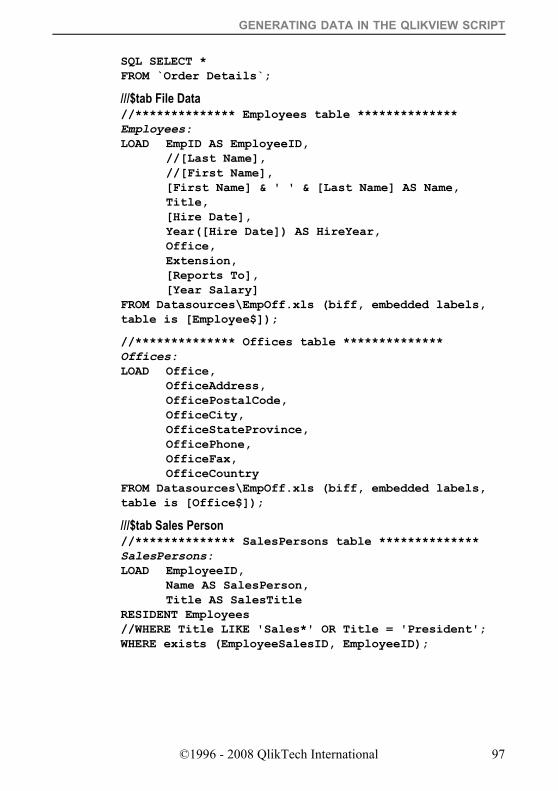
GENERATING DATA IN THE QLIKVIEW SCRIPT
SQL SELECT * FROM `Order Details`;
///$tab File Data //************** Employees table ************** Employees: LOAD EmpID AS EmployeeID,
//[Last Name], //[First Name], [First Name] & ' ' & [Last Name] AS Name, Title, [Hire Date], Year([Hire Date]) AS HireYear, Office, Extension, [Reports To], [Year Salary]
FROM Datasources\EmpOff.xls (biff, embedded labels, table is [Employee$]);
//************** Offices table ************** Offices: LOAD Office,
OfficeAddress, OfficePostalCode, OfficeCity, OfficeStateProvince, OfficePhone, OfficeFax, OfficeCountry
FROM Datasources\EmpOff.xls (biff, embedded labels, table is [Office$]);
///$tab Sales Person //************** SalesPersons table ************** SalesPersons: LOAD EmployeeID,
Name AS SalesPerson, Title AS SalesTitle
RESIDENT Employees //WHERE Title LIKE 'Sales*' OR Title = 'President'; WHERE exists (EmployeeSalesID, EmployeeID);
©1996 - 2008 QlikTech International 97

16.5 Autogenerate tablesAnother way to generate data in QlikView is to use the AUTOGENERATE clause on the LOAD statement. Specifying AUTOGENERATE on a LOAD statement will automat-ically generate a specific number of records. Only constants and parameter-free func-tions are allowed in an AUTOGENERATE LOAD. Quite often, the recno() or rowno() functions are used to provide a unique number for each row.
Do:1 Open the Edit Script dialog from the menu or toolbar.
2 Position your cursor after the Quarters table load we just added in the previ-ous step on the Main tab. Comment out that LOAD statement, since we will be replacing it with another alternative. If you add REM in front of the table label, that will comment the entire statement.
3 Add the following statement to the script:
Quarters: LOAD
rowno() as Month, 'Q' & Ceil(rowno()/3) as Quarter
AUTOGENERATE(12);
The rowno() function will return the current row number of the QlikView logical table that is being created, starting with 1. The ceil (ceiling) function will round the number passed up to the nearest integer. The & character is used for string concatenation in QlikView.
Remember to use only one of the Quarters load statements, and comment out the other statement you originally created.
4 Save and Reload the document.
98 ©1996 - 2008 QlikTech International
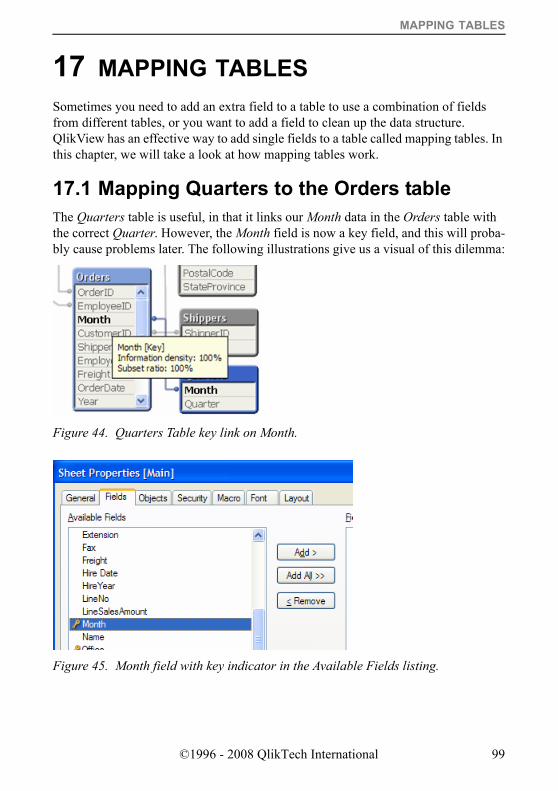
MAPPING TABLES
17 MAPPING TABLESSometimes you need to add an extra field to a table to use a combination of fields from different tables, or you want to add a field to clean up the data structure. QlikView has an effective way to add single fields to a table called mapping tables. In this chapter, we will take a look at how mapping tables work.
17.1 Mapping Quarters to the Orders tableThe Quarters table is useful, in that it links our Month data in the Orders table with the correct Quarter. However, the Month field is now a key field, and this will proba-bly cause problems later. The following illustrations give us a visual of this dilemma:
Figure 44. Quarters Table key link on Month.
Figure 45. Month field with key indicator in the Available Fields listing.
©1996 - 2008 QlikTech International 99
By changing our Quarters table into a MAPPING table, we will be able to integrate the Quarters field into the same table as Month (the Orders table).
The MAPPING prefix is used on a LOAD or SELECT statement to create a mapping table. Tables read via MAPPING LOAD or MAPPING SELECT are treated differently from other tables. They will be stored in a separate area of memory and used only as mapping tables during script execution. After script execution they will be automati-cally dropped.
A mapping table must have two fields, the first one containing comparison values and the second the desired mapping values. The two fields must be named, but the names have no relevance in themselves. The field names have no connection to field names in regular input tables. When mapping tables are used to map a certain field value or expression, that value will be compared to the values in the first field of the mapping table. If found, the original value will be replaced by the corresponding value in the second field of the mapping table. If not found, no replacement is made.
The syntax is:mapping ( load statement | select statement )
Do:1 Now, let us change the Quarters table load into a mapping load.
2 Go to the Edit Script dialog.
3 Immediately following the Main tab, create a new tab called Mapping Loads. This should now be the second tab in your Edit Script dialog.
4 Go to the Main tab and cut out the Quarters table you want to use. Make sure that the other table is commented so that you do not read from two Quarters tables.
5 Paste the table into the Mapping Loads tab and add _Map to the table name.
6 On the next line, type MAPPING in front of the LOAD statement.
7 When complete, verify that this section of your script resembles the follow-ing:
Quarters_Map: MAPPING LOAD
rowno() as Month,
100 ©1996 - 2008 QlikTech International
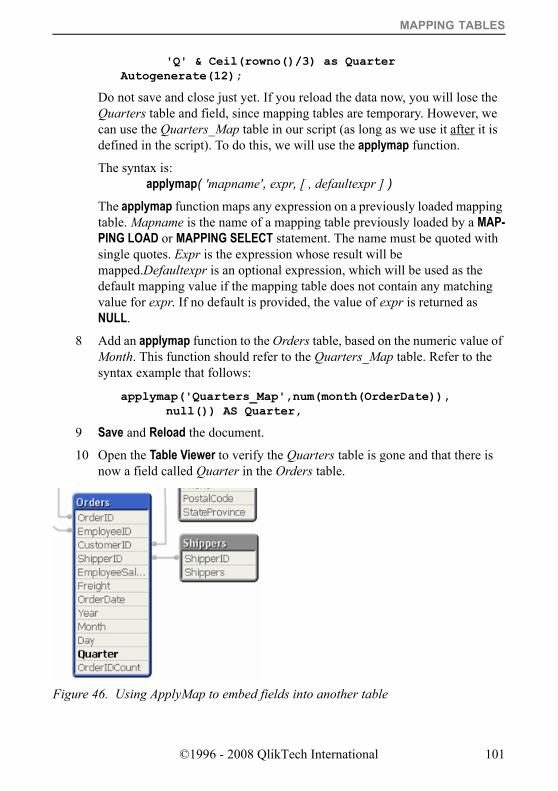
MAPPING TABLES
'Q' & Ceil(rowno()/3) as Quarter Autogenerate(12);
Do not save and close just yet. If you reload the data now, you will lose the Quarters table and field, since mapping tables are temporary. However, we can use the Quarters_Map table in our script (as long as we use it after it is defined in the script). To do this, we will use the applymap function.
The syntax is: applymap( 'mapname', expr, [ , defaultexpr ] )
The applymap function maps any expression on a previously loaded mapping table. Mapname is the name of a mapping table previously loaded by a MAP-PING LOAD or MAPPING SELECT statement. The name must be quoted with single quotes. Expr is the expression whose result will be mapped.Defaultexpr is an optional expression, which will be used as the default mapping value if the mapping table does not contain any matching value for expr. If no default is provided, the value of expr is returned as NULL.
8 Add an applymap function to the Orders table, based on the numeric value of Month. This function should refer to the Quarters_Map table. Refer to the syntax example that follows:
applymap('Quarters_Map',num(month(OrderDate)), null()) AS Quarter,
9 Save and Reload the document.
10 Open the Table Viewer to verify the Quarters table is gone and that there is now a field called Quarter in the Orders table.
Figure 46. Using ApplyMap to embed fields into another table
©1996 - 2008 QlikTech International 101
17.2 MonthYearWe will complete our time dimension fields by creating a new field that makes every month unique. There are, of course, several ways to accomplish this. In this course, we will create the field MonthYear by using QlikView date functions based on the OrderDate field, along with a date formatting function to provide the correct display format for our new month field. Open the Edit Script dialog from the menu or toolbar.
Do:1 Locate the Orders table LOAD statement on the Orders tab.
2 Immediately following the applymap… as Quarter field line, create a new field named MonthYear in the LOAD statement for the table Orders, as follows:
date(monthstart(OrderDate),'MMM-YYYY') AS MonthYear,
The monthstart function returns the first day of the month of the OrderDate value. The date function then formats this value into a 3-character month name, followed by a 4-digit year. Since QlikView stores this field as both a text string (the format we just specified) and as a numeric, it can be sorted numerically, as you would expect.
The complete Orders table LOAD statement should now look as follows. Be sure your script syntax matches this. Note, your Quarter and MonthYear fields line will likely fit on a single line instead of wrapping as seen below.
//*************** Orders table *************** Orders: LOAD CustomerID,
EmployeeID, EmployeeID AS EmployeeSalesID, Freight, OrderDate, year(OrderDate) AS Year, month(OrderDate) AS Month, day(OrderDate) AS Day, applymap('Quarters_Map', num(month(OrderDate)), null()) AS Quarter, date(monthstart(OrderDate), 'MMM-YYYY') AS MonthYear, OrderID, OrderID AS OrderIDCounter, ShipperID;
102 ©1996 - 2008 QlikTech International
MAPPING TABLES
SQL SELECT * FROM Orders;
3 Save and Reload the script.
4 Now, replace the Month dimension in the pivot table you created in the set of exercises in chapter 15, with the MonthYear field. You will have to set the properties for this field again as they were set for Month. (See the exercises in chapter 15 for guidance.)
5 In the Presentation tab of the Chart Properties dialog, select the MonthYear dimension, then enable the Show Partial Sums option.
17.3 Cleaning up the table structureIt is often desirable to minimize the number of tables in the QlikView structure. This is because it takes power to make calculations between tables. If you have tables with only two fields, it is easy to map those tables to another table and so minimize the number of tables. Let us look at the Table Viewer and see if there are any tables than can easily be mapped to another table.
Do:1 Open up the Table Viewer.
©1996 - 2008 QlikTech International 103
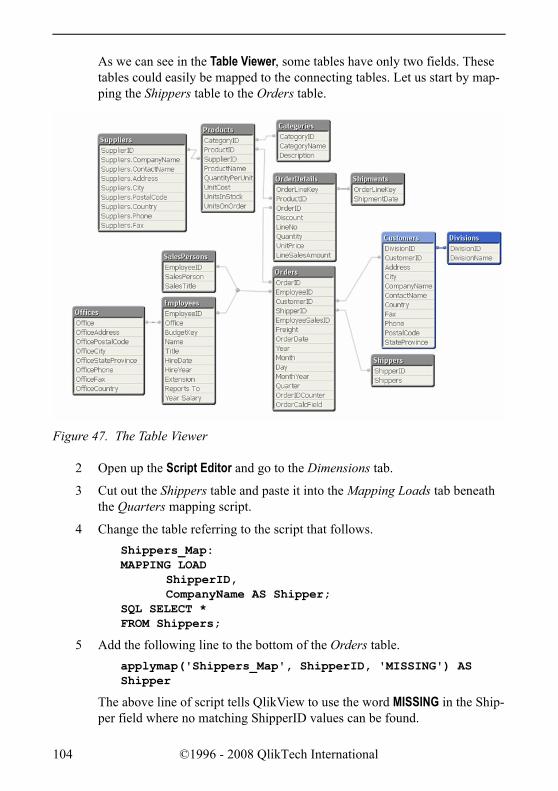
As we can see in the Table Viewer, some tables have only two fields. These tables could easily be mapped to the connecting tables. Let us start by map-ping the Shippers table to the Orders table.
2 Open up the Script Editor and go to the Dimensions tab.
3 Cut out the Shippers table and paste it into the Mapping Loads tab beneath the Quarters mapping script.
4 Change the table referring to the script that follows.Shippers_Map: MAPPING LOAD
ShipperID, CompanyName AS Shipper;
SQL SELECT * FROM Shippers;
5 Add the following line to the bottom of the Orders table.applymap('Shippers_Map', ShipperID, 'MISSING') AS Shipper
The above line of script tells QlikView to use the word MISSING in the Ship-per field where no matching ShipperID values can be found.
Figure 47. The Table Viewer
104 ©1996 - 2008 QlikTech International
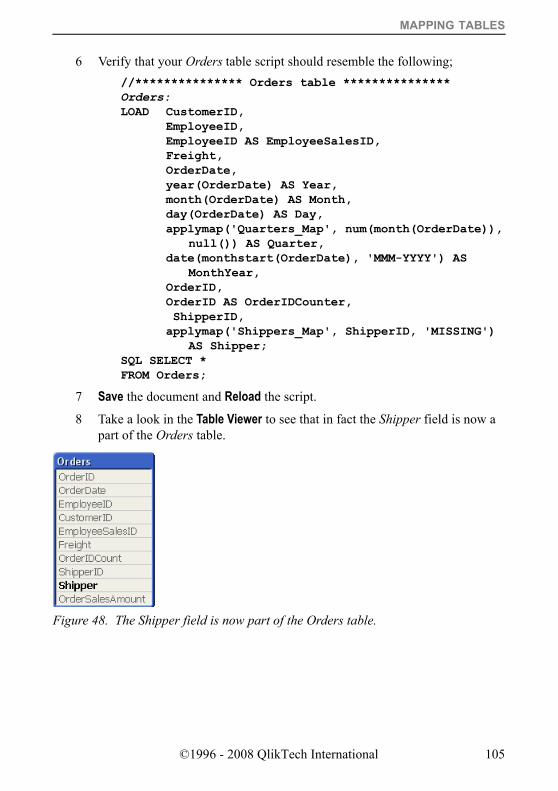
MAPPING TABLES
6 Verify that your Orders table script should resemble the following;//*************** Orders table *************** Orders: LOAD CustomerID,
EmployeeID, EmployeeID AS EmployeeSalesID, Freight, OrderDate, year(OrderDate) AS Year, month(OrderDate) AS Month, day(OrderDate) AS Day, applymap('Quarters_Map', num(month(OrderDate)),
null()) AS Quarter, date(monthstart(OrderDate), 'MMM-YYYY') AS
MonthYear, OrderID, OrderID AS OrderIDCounter, ShipperID, applymap('Shippers_Map', ShipperID, 'MISSING')
AS Shipper; SQL SELECT * FROM Orders;
7 Save the document and Reload the script.
8 Take a look in the Table Viewer to see that in fact the Shipper field is now a part of the Orders table.
Figure 48. The Shipper field is now part of the Orders table.
©1996 - 2008 QlikTech International 105

106 ©1996 - 2008 QlikTech International
EXERCISES
18 EXERCISES
Do:1 Map the Divisions table to the Customers table. Make sure to remove the
Divisions table from the Dimensions tab and create a mapping table on the Mapping Loads tab.
Although script examples are at the bottom of this page, they are for refer-ence only should you need help. We encourage you to try to add the Mapping Load and ApplyMap script on your own.
2 Are there any other tables that can be mapped to another table? Check the Table Viewer. Make sure to look for tables with only two fields. Discuss with the course Instructor.
//*************** Divisions *************** Divisions_Map: MAPPINGLOAD
DivisionID, DivisionName;
SQL SELECT * FROM Divisions;
//*************** Customers *************** Customers: LOAD Address,
City, CompanyName, ContactName, Country, CustomerID, DivisionID, applymap ('Divisions_Map', DivisionID) as Division, Fax, Phone, PostalCode, StateProvince;
SQL SELECT * FROM Customers;
©1996 - 2008 QlikTech International 107

108 ©1996 - 2008 QlikTech International
CREATING A CALENDAR
19 CREATING A CALENDAR Sometimes when working with dates, it is better to keep the date fields outside the fact tables and create them in a table of their own. For instance, you may want to be able to see all dates, not only dates when something has happened. In that case, you can get the start and the end date from the fact table and use these dates to create a calendar table. In this chapter, we will look at how to get the highest and the lowest date values from the Orders table. We will place these values into variables that we use to create a Calendar table.
19.1 Getting the Highest and Lowest date from the Orders table
There are, of course, several ways to get the highest and lowest values from a field in a table. In this chapter, we are going to work with an IterNo record function in QlikView that we can use inside a table or, as in this case, to create a variable. When using IterNo record functions, the sort order of the table is always important. There-fore, we will start by sorting the Orders table so that we get the dates in the correct order.
Do:1 Open the Edit Script dialog and go to the Orders tab.
2 Except for the OrderDate field, remove all Date fields from the Orders table by commenting them out. The reason for keeping OrderDate is that this will be the connecting field to the Calendar table.
3 Sort the Orders table by typing the following at the end of the SELECT state-ment before the semicolon.
ORDER BY OrderDate ASC;
4 The script should look as follows after you have added the Order By state-ment.
//************** Orders table ************** Orders: LOAD CustomerID,
EmployeeID, EmployeeID AS EmployeeSalesID, Freight, OrderDate,
©1996 - 2008 QlikTech International 109
//Year(OrderDate) AS Year, //Month(OrderDate) AS Month, //Day(OrderDate) AS Day, //applymap('Quarters_Map',num
(month(OrderDate)), null()) AS Quarter, OrderID, OrderID AS OrderIDCounter, ShipperID, applymap('Shippers_Map', ShipperID, 'MISSING') AS Shipper;
SQL SELECT * FROM Orders ORDER BY OrderDate ASC;
The ORDER BY statement sets the sort order of the table. You can use one or more fields in the statement to specify how the table should be sorted. The fields will be sorted in the order shown with the first field having priority if you have more than one field. Commas should separate the fields. You can also decide if you want to sort the fields Ascending or Descending by typing Asc or Desc after the last field.
Once the table has been sorted, we can use the Peek function to get the first and the last OrderDate from the Orders table.
19.2 Creating variables in the scriptWe can create variables in the QlikView script to get dynamic values that may change over time. In this case we will create one variable that holds the first date in the Orders table, and one variable that holds the last date in the Orders table.
Do:1 Create a new tab and call it Calendar. It should now be the fifth tab and
should follow the Orders tab.
2 Create a new variable for the first date by typing the following script state-ment.
LET varMinDate = Num(Peek('OrderDate', 0, 'Orders'));
When creating a variable in QlikView, a SET or a LET statement is often used to define the variable. The SET statement is used when you want a variable to hold the string or numeric value that is to the right of the Equal (=) sign. The LET statement is used when you need to evaluate what is to the right of the Equal sign.
110 ©1996 - 2008 QlikTech International
CREATING A CALENDAR
The Peek function has the following syntax: Peek( ‘fieldname’ [ , row [ , ‘tablename’ ] ] ).
The fieldname, is the field that we want to take a value from. Row is the row number of the value we want to get. 0 is the first row of the table and -1 is the last row of the table. Tablename is the name of the table where the Field-name exists.
In our script, we want to find the value in OrderDate on the first row of the Orders table to get the first date. We can do this since we sorted the table by OrderDate previously in this chapter.
3 Create a second variable for the last date by typing the following statement.
LET varMaxDate = Num(Peek('OrderDate', -1, 'Orders'));
4 Create a third variable for today by typing the following statement.
LET vToday = num(today());
5 Create a new table by typing the following script into the Script Editor.//*************** Temporary Calendar *************** TempCalendar: LOAD $(varMinDate)+IterNo()-1 AS Num, Date($(varMinDate)+IterNo()-1) AS TempDate AUTOGENERATE (1) WHILE $(varMinDate)+IterNo()-1<= $(varMaxDate);
The AUTOGENERATE statement creates the table where the numbers of rows created are dependent on the number of days between the min and the max date. To get the correct number of dates, we use a control statement called WHILE. The WHILE statement continues to run the AUTOGENERATE state-ment as long as the condition after the WHILE statement is true. The WHILE statement works together with the IterNo function. This is a counter that will increment by one each time the WHILE statement is evaluated as TRUE. The IterNo function starts at 1 so you need to subtract 1 from it to start from 0. In the table just created, we use the IterNo function to create all dates between the min date and the max date.
6 Save and Reload the script.
©1996 - 2008 QlikTech International 111
19.3 Creating the Master CalendarOnce we have created all the dates needed, we can start creating a Master Calendar table where we create all the date fields needed. Earlier, we created Year, Month and Day in the Orders table. Let us create these fields again, and some other date fields that may be of use in the layout.
Do:1 Open up the script editor again.
2 Create a MasterCalendar table referring to the script shown below.
//*************** Master Calendar *************** MasterCalendar: LOAD TempDate AS OrderDate,
Week(TempDate) AS Week, Year(TempDate) AS Year, Month(TempDate) AS Month, Day(TempDate) AS Day, Weekday(TempDate) AS WeekDay, applymap('Quarters_Map', num(month(TempDate)),
null()) AS Quarter, Date(monthstart(TempDate), 'MMM-YYYY') AS
MonthYear, Week(TempDate)&'-'&Year(TempDate) AS WeekYear, Year2Date(TempDate, 0, 1, $(vToday))*-1 AS
CurYTDFlag, Year2Date(TempDate,-1, 1, $(vToday))*-1 AS
LastYTDFlag RESIDENT TempCalendar ORDER BY TempDate ASC;
You will notice we had to rename the TempDate field to OrderDate to get a connec-tion to the Orders table. Most of the fields are created by date functions that do not need any further explanation, but we have created two flag fields that can be explained a bit further. The flag fields are created by using the year2date function. The syntax of this function is as follows.
year2date(date [ , yearoffset [ , firstmonth [ , todaydate] ] ] )
The year2date function is a Boolean function that returns either -1 or 0. -1 is returned if the statement is evaluated to true and 0 is returned if the statement is false. The first part of the function is the date that is to be evaluated. The second part, yearoffset, is the year that you want to evaluate. If you omit this, the current year will be assumed.
112 ©1996 - 2008 QlikTech International
CREATING A CALENDAR
By specifying a firstmonth between 1 and 12 (1 if omitted), the beginning of the year may be moved forward to the first day of any month. By specifying a todaydate, you may move the day used as the upper boundary of the period.
By creating the flag fields CurYTDFlag and LastYTDFlag, we have created fields that we can use in expressions where we only want to see the results of the current year and the same period last year.
Before we reload the script, we need to get rid of the TempCalendar table used for creating the dates. We can do this by using the DROP TABLE statement in the follow-ing way.
DROP TABLE TempCalendar;
The DROP TABLE statement removes a table entirely from the QlikView database.
©1996 - 2008 QlikTech International 113

114 ©1996 - 2008 QlikTech International
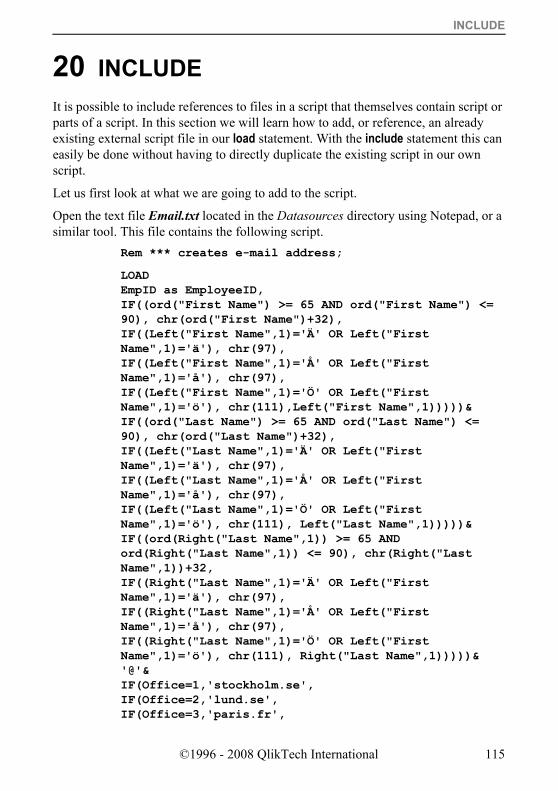
INCLUDE
20 INCLUDEIt is possible to include references to files in a script that themselves contain script or parts of a script. In this section we will learn how to add, or reference, an already existing external script file in our load statement. With the include statement this can easily be done without having to directly duplicate the existing script in our own script.
Let us first look at what we are going to add to the script.
Open the text file Email.txt located in the Datasources directory using Notepad, or a similar tool. This file contains the following script.
Rem *** creates e-mail address;
LOAD EmpID as EmployeeID, IF((ord("First Name") >= 65 AND ord("First Name") <= 90), chr(ord("First Name")+32), IF((Left("First Name",1)='Ä' OR Left("First Name",1)='ä'), chr(97), IF((Left("First Name",1)='Å' OR Left("First Name",1)='å'), chr(97), IF((Left("First Name",1)='Ö' OR Left("First Name",1)='ö'), chr(111),Left("First Name",1)))))& IF((ord("Last Name") >= 65 AND ord("Last Name") <= 90), chr(ord("Last Name")+32), IF((Left("Last Name",1)='Ä' OR Left("First Name",1)='ä'), chr(97), IF((Left("Last Name",1)='Å' OR Left("First Name",1)='å'), chr(97), IF((Left("Last Name",1)='Ö' OR Left("First Name",1)='ö'), chr(111), Left("Last Name",1)))))& IF((ord(Right("Last Name",1)) >= 65 AND ord(Right("Last Name",1)) <= 90), chr(Right("Last Name",1))+32, IF((Right("Last Name",1)='Ä' OR Left("First Name",1)='ä'), chr(97), IF((Right("Last Name",1)='Å' OR Left("First Name",1)='å'), chr(97), IF((Right("Last Name",1)='Ö' OR Left("First Name",1)='ö'), chr(111), Right("Last Name",1)))))& '@'& IF(Office=1,'stockholm.se', IF(Office=2,'lund.se', IF(Office=3,'paris.fr',
©1996 - 2008 QlikTech International 115
IF(Office=4,'nice.fr','seattle.com')))) as "e-mail" FROM datasources\empoff.xls(ansi, biff, embedded labels, table is [Employee$]);
This is an example of a complicated load statement, which is mainly based on nested if statements. In this case, we want to create e-mail addresses from the information contained in our database. Many conditions must be satisfied, which leads to a com-plicated LOAD statement that generates a new logical table containing two fields. We will load EmployeeID and the new field e-mail, the former giving us the association to the rest of the structure.
The LOAD statement creates a signature consisting of the first letter of the first name, and the first and last letters of the last name. It also ensures that there are no capital letters in the signature, only lower case letters. Foreign (Swedish) letters, e.g. å, Å, ä, Ä, ö and Ö are also removed. Following the signature, @ is appended, followed by the appropriate server address. The latter is determined by the office in which the employee works.
We will now include the external file in our load script.
Do:1 Open the Edit Script dialog from the menu or toolbar
2 Position your cursor at the bottom of the Main tab.
3 Select Include from the Edit menu command.
4 Browse to the file Email.txt located in the Datasources directory, and click Open. The following line will be added to your script.
$(Include=datasources\Email.txt)
Note that there is no semicolon after the statement but there can be one or more semicolons located within the included text file.
Note: Any part, or even the entire script can be located in an external Include file. There can also be multiple Include files in a script.
5 Save and Reload the script.
6 Add a new sheet to the layout, and name it Employees. Add the new field e-mail as a list box.
116 ©1996 - 2008 QlikTech International
READING BUDGET INTO QLIKVIEW
21 READING BUDGET INTO QLIKVIEWIn the QWT Business Intelligence project plan on page 13, there is a Budget table for Employees and Offices. We are going to read this into our document. The Budget table is built as a cross table and we need to convert this when we read it into QlikView. We will also add a field to the Budget table that allows us to alter the val-ues of the budget.
21.1 Reading Cross TablesLet us open the Budget table that is contained in the Excel file. This table does need some rework to read it into QlikView. Fortunately, QlikView has excellent function-ality to interpret and change tables so that we do not need to alter the original look of the Excel file.
Do:1 Open up the Script Editor.2 Create a new tab following the Sales Person tab and call it Budget.
3 Click on the Table Files button and open the Budget.xls file.
4 In the Table Files Wizard, start by setting the Header Size to one row.
5 Next, we need to make sure that there are no empty rows in the Office field. Click on Transform… to transform the table and then click the Fill tab.
6 Click the Fill… button and then Cell Condition. We want the cell to fill if it is empty. Click OK, OK and OK to return to the Table Files Wizard.
7 Click Next to get to the next tab of the Table Files Wizard.
8 Click on Crosstable… to change the table from a cross table to a normal table.
9 Answer Yes to the question “Office” is a qualifying field?A qualifying field in a cross table, is a field that should not be altered during the Cross table load.
10 Answer Yes to the question “EmployeeID” is a qualifying field?11 Answer No to the question “2004” is a qualifying field?
©1996 - 2008 QlikTech International 117
2004 is not a qualifying field. This is the first of the fields we want to trans-form so that the years are placed in one field and the budget values are placed in another field.
12 Name the Attribute (Year) field BudgetYear.
13 Name the data (Budget values) field BudgetAmount.
14 Click FINISH. You should have the following table in the script.
CROSSTABLE(BudgetYear, BudgetAmount, 2) LOAD Office,
EmployeeID, [2004], [2005], [2006], [2007], [2008]
FROM Datasources\Budget.xls (biff, header is line, embedded labels, table is [Sheet1$], filters(Replace(1, top, StrCnd(null)) ));
15 Name this table Budgets.
16 Save and Reload the document.
Open the Table Viewer. As you can see, there is a synthetic key between the Budgets and the Employees table. We want to resolve this key as we did in a previous chapter. If we look at the Business Plan again, we can see that all values in the Budget table for Office and Employees should be in the Employees table. This means that we can resolve this synthetic key by con-catenating the fields involved into a key field, and just keep them in the Employees table.
17 Go to the Script Editor.18 Change the Budget table to the following script. Make sure you change the
CROSSTABLE statement to have only one qualifying field.
Budgets: CROSSTABLE(BudgetYear, BudgetAmount, 1) LOAD Office&'-'&EmployeeID AS BudgetKey,
[2004], [2005], [2006], [2007], [2008]
FROM Datasources\Budget.xls
118 ©1996 - 2008 QlikTech International
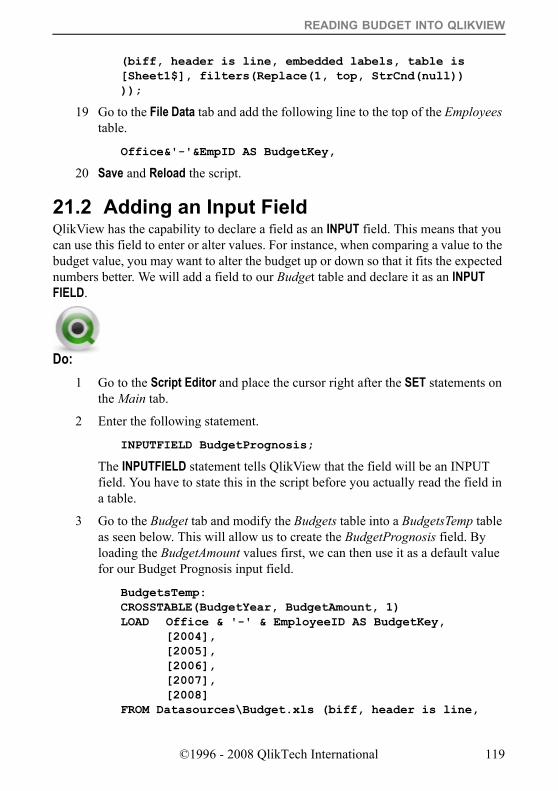
READING BUDGET INTO QLIKVIEW
(biff, header is line, embedded labels, table is [Sheet1$], filters(Replace(1, top, StrCnd(null)) ));
19 Go to the File Data tab and add the following line to the top of the Employees table.
Office&'-'&EmpID AS BudgetKey,
20 Save and Reload the script.
21.2 Adding an Input FieldQlikView has the capability to declare a field as an INPUT field. This means that you can use this field to enter or alter values. For instance, when comparing a value to the budget value, you may want to alter the budget up or down so that it fits the expected numbers better. We will add a field to our Budget table and declare it as an INPUT FIELD.
Do:1 Go to the Script Editor and place the cursor right after the SET statements on
the Main tab.
2 Enter the following statement.
INPUTFIELD BudgetPrognosis;
The INPUTFIELD statement tells QlikView that the field will be an INPUT field. You have to state this in the script before you actually read the field in a table.
3 Go to the Budget tab and modify the Budgets table into a BudgetsTemp table as seen below. This will allow us to create the BudgetPrognosis field. By loading the BudgetAmount values first, we can then use it as a default value for our Budget Prognosis input field.
BudgetsTemp: CROSSTABLE(BudgetYear, BudgetAmount, 1) LOAD Office & '-' & EmployeeID AS BudgetKey,
[2004], [2005], [2006], [2007], [2008]
FROM Datasources\Budget.xls (biff, header is line,
©1996 - 2008 QlikTech International 119
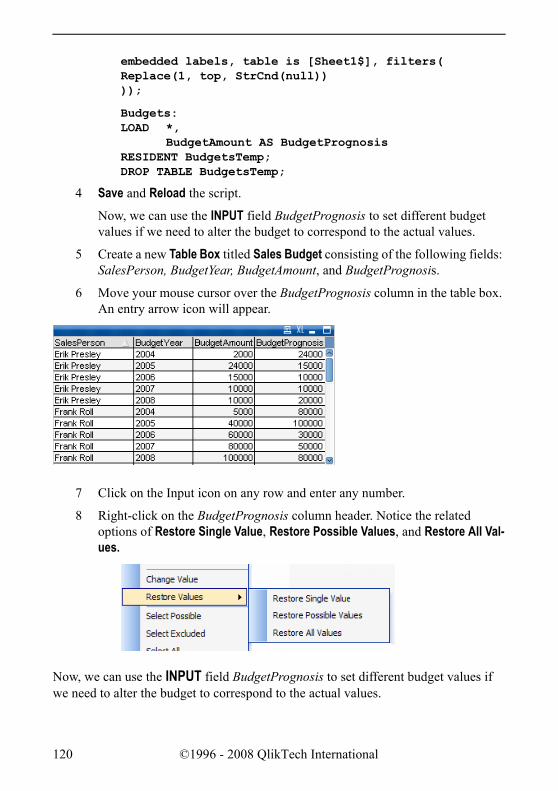
embedded labels, table is [Sheet1$], filters( Replace(1, top, StrCnd(null)) ));
Budgets: LOAD *,
BudgetAmount AS BudgetPrognosis RESIDENT BudgetsTemp; DROP TABLE BudgetsTemp;
4 Save and Reload the script.
Now, we can use the INPUT field BudgetPrognosis to set different budget values if we need to alter the budget to correspond to the actual values.
5 Create a new Table Box titled Sales Budget consisting of the following fields: SalesPerson, BudgetYear, BudgetAmount, and BudgetPrognosis.
6 Move your mouse cursor over the BudgetPrognosis column in the table box. An entry arrow icon will appear.
7 Click on the Input icon on any row and enter any number.
8 Right-click on the BudgetPrognosis column header. Notice the related options of Restore Single Value, Restore Possible Values, and Restore All Val-ues.
Now, we can use the INPUT field BudgetPrognosis to set different budget values if we need to alter the budget to correspond to the actual values.
120 ©1996 - 2008 QlikTech International
ADVANCED SCRIPTING
22 ADVANCED SCRIPTINGOpen the Business Intelligence Plan to page 3. There are several key measures that have not yet been created. We need to calculate those key measures in the script to satisfy the requirements of the project plan. The key measures we need to calculate in the script are OrderLineAmount, CostOfGoodsSold and Margin. To make these cal-culation fields, we need to do some advanced scripting. There is also a key field, Cat-egoryType, which we need to create. How this field should be created can be found on page 5 in the Project Plan. The functionalities we are going to look at in this chap-ter are:• Conditions in tables • Aggregation• Joining tables• Preceding Load on Preceding Load
22.1 Condition on a field in a tableAccording to the Project Plan, the CategoryType field can be created by using the CategoryID field. If the CategoryID is 5 or 6, the CategoryType should be Footwear, otherwise the type should be clothing. Let us create this field in the script.
Do:1 Open the Edit Script dialog and go to the Dimensions tab.
2 Find the Categories table and place the cursor after the last field of this table.
3 Type a comma and press ENTER to get to a new row. Type the following to create the CategoryType.
IF(CategoryID = 5 OR CategoryID = 6, 'Footwear', 'Clothing') AS CategoryType;
The IF statement in QlikView uses the following syntax:
if( condition , then , else )
The condition should be evaluated to be either true or false. If the condition is true, the then part will be processed. However, if the condition is false, the else portion of the statement will be processed.
4 Save the script and Reload.
©1996 - 2008 QlikTech International 121
5 Look at the fields. You can now see that we have a new field named Catego-ryType.
22.2 Aggregating DataOne of the key measures is OrderSalesAmount. We need to calculate this in the script. At the moment we have LineSalesAmount, but we want to have a total amount for each Order. To accomplish this, we need to aggregate the LineSalesAmount.
To group or aggregate data, we will use the GROUP BY clause in the LOAD statement. In this case, we need to aggregate the data in the OrderDetails table by OrderID.
Do:1 Open the Script Editor and place the cursor after the OrderDetails table on
the Orders tab.
2 Add the following statement to your script:
LOAD OrderID, sum(LineSalesAmount) AS OrderSalesAmount
RESIDENT OrderDetails GROUP BY OrderID;
3 Notice the aggregation function sum(LineSalesAmount) included in this statement. This function will be evaluated over all the potential combina-tions of the other fields in the LOAD (OrderID) statement. The GROUP BY clause is needed to aggregate, or group fields other than those included in the aggregation. In this case, it will total the Sales Amount for each OrderID.
22.3 Joining tablesWe want to add the OrderSalesAmount field to the Orders table. To do so we can add the values of this table to the Orders table. To use two tables together like this, we must begin by combining them into a single table. Here, the JOIN between tables can be performed against the source database or we can use a QlikView JOIN command. Since we already have the source data we need loaded into memory, we will use the QlikView JOIN LOAD statement against the table just created.
122 ©1996 - 2008 QlikTech International
ADVANCED SCRIPTING
Do:1 Go to the Script again and place the cursor just in front of LOAD in the table
just created.
2 Type LEFT JOIN (Orders) in front of the LOAD statement. The result should be as below.
LEFT JOIN (Orders) LOAD …
Here we use a LEFT JOIN load because we want to make sure that we do not get any values of Orders that do not exist in the Orders table. In QlikView, the default join behavior is a full outer join. Therefore, if there are no match-ing fields between the two joined tables, you will get a Cartesian product of the records. Since we are specifying OrderID in both tables, and we are specifying Left, only the records matching OrderID included in the Orders table will be included. We include the OrderSalesAmount field because that is what we want to add to the Orders table.
3 Save and Reload the script.
22.4 ConcatenationAnother way to join data together from multiple tables is to use concatenation. There are three ways to concatenate data. We will explore each of these methods.
22.4.1Automatic ConcatenationIf the field names and the number of fields of two or more loaded tables are exactly the same, QlikView will automatically concatenate the results of the different LOAD or SELECT statements into one table.
Example:
LOAD a, b, c FROM Table1.csv; LOAD a, c, b FROM Table2.csv;
The resulting logical table has the fields a, b and c. The number of records is the sum of the numbers of records in table 1 and table 2.
Rules:
- The number and names of the fields must be exactly the same.
- The order of the fields listed in each statement is arbitrry
©1996 - 2008 QlikTech International 123
- The order of the two statements is arbitrary.
22.4.2Forced ConcatenationIf two or more tables do not have exactly the same set of fields, it is still pos-sible to force QlikView to concatenate the two tables. This is done with the Concatenate prefix in the script, which concatenates a table with another named table or with the last previously created logical table.
Example:
LOAD a, b, c FROM Table1.csv; Concatenate LOAD a, c FROM Table2.csv;
The resulting logical table has the fields a, b and c. The number of records in the resulting table is the sum of the numbers of records in table 1 and table 2.The value of field b in the records coming from table 2 is NULL.
Rules:
- The names of the fields must be exactly the same.
- The order of the fields listed in each statement is arbitrary
- Unless a table name of a previously loaded table is specified in the concat enate statement the concatenate prefix uses the last previously created logi-cal table. The order of the two statements is thus not arbitrary
22.4.3Prevent ConcatenationIf two tables have the same set of fields and thus would normally be auto-matically concatenated, you can prevent the concatenation with the NoCon-catenate prefix. This statement prevents concatenation with any existing logical table with the same set of fields.
The syntax is:
NoConcatenate ( LoadStatement | SelectStatement )
Example:LOAD a, b FROM Table1.csv; Noconcatenate LOAD a, b FROM Table2.csv;
In our data, we have been provided with an additional set of new employees that are not yet contained in the EmpOff.xls file. In order to add this data, we need to modify our load script.
124 ©1996 - 2008 QlikTech International
ADVANCED SCRIPTING
Do:1 Open the Edit Script dialog
2 Position your cursor on the File Data tab directly after the Employee table has been loaded. We need to duplicate the fields we currently have for Employee, so we will not use the Table Wizard in this case. Instead, copy the Employee LOAD statement, and paste the copied text after the original text.
3 Since the new file data format matches our first file, we only need to change the source of the data. Revise the From clause in the new load statement to read as follows:
FROM Datasources\Employees_New.xls (biff, embedded labels, table is [Employee$]);
4 Click OK and Save the QlikView document.
5 Run the script.
If you notice a number of new Synthetic Keys, or a new $Table value of Employee-1, you know something did not work correctly with automatic concatenation.
You can avoid a number of potential problems with automatic concatenation by using the concatenate prefix on load statements that you know should be concatenated.
6 Add the concatenate prefix to the new Employee LOAD statement, and spec-ify the Employee table.
This will always concatenate these two tables together, even if inadvertent script changes are made later to one of the loads, but not the other. The new Employee LOAD statement should now begin as follows:
Concatenate (Employee) Load
7 You may have noticed that there are very few differences between our two Employee LOAD statements. In fact, we can use another QlikView feature to load the same data in just a single load statement. By using a wildcard spec-ification on the FROM file name, QlikView will automatically load from all files matching that specification, and concatenate the data into a single logi-cal table for you. Since both our file names start with “Emp”, and have the
©1996 - 2008 QlikTech International 125
“.xls” file extension, we can use the wildcard “Emp*.xls” in the FROM clause. If we make this change, and comment the second Employee LOAD statement, the script should now read as follows:
Employees: Load Office & ‘-’ & EmpID as BudgetKey,
EmpID AS EmployeeID, //[Last Name], //[First Name], [First Name] & ' ' & [Last Name] AS Name, Title, [Hire Date], Year([Hire Date]) AS [Employee Hire Year], Office, Extension, [Reports To], [Year Salary]
FROM Datasources\Emp*.xls (biff, embedded labels, table is [Employee$]);
//Employees: //Concatenate (Employee) Load
//Office & ‘-’ & EmpID as BudgetKey, //EmpID AS EmployeeID, //[Last Name], //[First Name], //[First Name] & ' ' & [Last Name] AS Name, //Title, //[Hire Date], //Year([Hire Date]) AS [Employee Hire Year], //Office, //Extension, //[Reports To], //[Year Salary]
//FROM Datasources\Employees_New.xls (biff, embedded labels, table is [Employee$]);
8 Save the revised script and the QlikView document. Then Reload, and verify the Employee data has not changed.
9 As an optional exercise, you may want to try to determine why the employ-ees listed in the Employees_New.xls file are not assigned email addresses (field e-mail is null for these employees). What do you need to do to correct this problem?
126 ©1996 - 2008 QlikTech International
ADVANCED SCRIPTING
22.5 Preceding Load on Preceding LoadThe next key measure we are going to add is the CostOfGoodsSold. To calculate this value, we need to add the UnitCost field from the Products table to the OrderDetails table. We are going to do this by using a mapping table and apply this to the Order-Details table.
Do:1 Go to the Script Editor and place the cursor at the bottom of the Mapping
Loads tab.
2 Create the following table by copying and pasting from the Dimensions tab, or by creating it from scratch using the Select button.
UnitCost_Map: MAPPING LOAD
ProductID, UnitCost;
SQL SELECT * FROM Products;
3 Go to the Orders tab and add the following script line to the bottom of the OrderDetails table just above the SQL SELECT * line.
applymap('UnitCost_Map', ProductID, 0) * Quantity AS CostOfGoodsSold
We combine the applymap function with a calculation and create the CostOf-GoodsSold field directly in the preceding LOAD of the OrderDetails table.
The last of the remaining key measures that we need to create in the script is the Margin. According to the project plan, the Margin is calculated as the LineSalesAmount – CostOfGoodsSold. The easiest way to do this is to place a preceding load on top of the preceding load in the OrderDetails table. You can add several preceding loads on top of each other and they will be evalu-ated from the bottom and up. This means that you can use a field created in a preceding load in a new preceding load on top of the first one.
4 We will use this functionality to create the Margin field.
5 Put the cursor after the OrderDetails label.
6 Create a preceding load by adding the following script.LOAD
LineSalesAmount - CostOfGoodsSold AS Margin,
©1996 - 2008 QlikTech International 127
* ;
7 The full OrderDetails script should look like this:
//************** Order Details table ************** OrderDetails: LOAD LineSalesAmount - CostOfGoodsSold AS Margin, * ; LOAD Discount, LineNo, OrderID, autonumber(OrderID & '-' & LineNo) AS OrderLineKey, ProductID, 1 AS ProductIDRecordCounter, Quantity, UnitPrice, UnitPrice * Quantity * (1-Discount) AS LineSalesAmount, applymap('UnitCost_Map', ProductID, 0) * Quantity AS CostOfGoodsSold; SQL SELECT * FROM `Order Details`;
LEFT JOIN (Orders) LOAD OrderID, sum(LineSalesAmount) AS OrderSalesAmount RESIDENT OrderDetails GROUP BY OrderID;
8 Save and Reload the script.
The new key measure fields should be ready for use.
128 ©1996 - 2008 QlikTech International
EXERCISES
23 EXERCISES
Do:1 To clean up the script a little more, Join the Categories table with the Prod-
ucts table. Make sure not to get any Categories that do not exist in the Prod-ucts table.
//************** Categories table ************** Categories: LEFT JOIN (Products) LOAD CategoryID,
CategoryName, Description AS CategoryDescription, IF(CategoryID = 5 OR CategoryID = 6, 'Footwear', 'Clothing') AS CategoryType;
SQL SELECT * FROM Categories;
2 Create a pivot table with CategoryType and CategoryName as dimensions.
3 Create the following four expressions:
Sales Sum(LineSalesAmount)
COGS Sum (CostOfGoodsSold)
Margin Sum (Margin)
Margin % Sum (Margin)/ Sum (LineSalesAmount)
4 Format the table the way you want to.CategoryType CategoryName Sales COGS Margin Margin % Clothing Baby Clothes $1004182.70 $865657.81 $138524.89 14%
Children's Clothes $672992.08 $556478.81 $116513.27 17% Men's Clothes $1103597.99 $965081.48 $138516.51 13% Sportswear $2152403.81 $1828130.85 $324272.96 15% Swimwear $240237.66 $203765.47 $36472.19 15% Women's Clothes $5169127.06 $4192395.55 $976731.51 19%
Footwear Men's Footwear $1836121.56 $1556124.93 $279996.63 15% Women's Footwear $1142575.19 $991745.78 $150829.41 13%
©1996 - 2008 QlikTech International 129

130 ©1996 - 2008 QlikTech International
QLIKVIEW DATA (QVD) FILES
24 QLIKVIEW DATA (QVD) FILESOne of the most important features in writing scripts within QlikView is the use of QlikView Data (QVD) files. A QVD file contains a table of data exported from QlikView. QVD is a native QlikView format. It can only be written to and read from QlikView. The file format is optimized for speed when reading data from a QlikView script but it is also very compact. Reading data from a QVD file is typically 10-100 times faster than reading from other data sources.
24.1 QVD file formatA QVD file contains exactly one table. Conceptually it is quite similar to any typed file (e.g. csv, dif, biff or fix). A QVD file is composed of three parts:• A well formed XML header (in UTF-8 char set) describing the fields in the table,
the layout of the subsequent information and some other meta-data.• Symbol tables in a byte stuffed format.• Actual table data in a bit-stuffed format.
24.2 Use of QVD filesQVD files can be used for many purposes. At least four major uses can be easily identified. In many cases two or more of them will be applicable at the same time.• Increasing Load Speed - By buffering non-changing or slowly-changing parts
of input data in QVD files, script execution can become considerably faster for large data sets. For large data sets it will thus be easier to meet reload time-win-dow limitations. When developing applications it is often necessary to run the script repeatedly. By using QVD buffering in such situations repeated waiting times can be reduced significantly even if the data set is not that large.
• Decreasing Load on Database Servers - By buffering non-changing or slowly-changing parts of input data in QVD files, the amount of data fetched from exter-nal data sources can be greatly reduced. This reduces load on external databases and network traffic. When several QlikView scripts share the same data it is only necessary to load it once from the source database. The other applications can make use of the data from a QVD file.
• Consolidating Data from Multiple QlikView Applications - Consolidation of data from multiple QlikView applications is possible with the help of QVD files. With the Binary script statement you can only load data from only one single QlikView application into another. With QVD files, a QlikView script can com-bine data from any number of QlikView applications. This opens up possibili-ties, e.g. for applications consolidating similar data from different business units etc.
©1996 - 2008 QlikTech International 131
• Incremental Load - In many common cases the QVD functionality can be used to facilitate incremental load, i.e. only loading new records from a growing data-base.
24.3 Creating QVD filesQVD files can be created in three ways. We will explore the first two methods in this course.• Explicitly created and named from script by means of the STORE command.
Simply state in the script that you want a previously read table or part of a resi-dent table to be exported to an explicitly named filename at a location that you choose.
• Automatically created and maintained from script. By preceding a LOAD or SELECT statement with the BUFFER prefix, QlikView will automatically create a QVD file which, during a later load, if certain conditions are met, will be used instead of the original data source when reloading data. The QVD file will have a cryptic name based on a hash of the LOAD/SELECT statement and normally reside in the Windows Application data folder.
• Explicitly named and created from layout or via Automation. Data exported from the QlikView layout via GUI commands or Automation macros. In the GUI you will find QVD as one of the possible export formats under the EXPORT... com-mand, found on the object menu of most sheet objects.
24.4 Manual creation of a QVD file in the scriptWe will now create a QVD file in our load script by using the store statement. This statement will create an explicitly named QVD file.
The syntax for the store statement is:
store [(*|<field_list>) from] <table> into <file_name>;
Reading the above script can be defined as:<table> is a script labeled, resident, table. <file_name> is interpreted similar to names in load statements, i.e. the directory statements apply. Fields in the <field list> may be renamed using the AS operator.
Do:1 Open the Edit Script dialog from the menu or toolbar.
2 Locate the Customers table load statement on the Main tab
132 ©1996 - 2008 QlikTech International
QLIKVIEW DATA (QVD) FILES
3 Following the Customers table LOAD statement, add the STORE statement as follows:
STORE Customers into datasources/customers.qvd;
4 Click OK and then save your file. Reload the script.
You will not notice any changes to the System sheet in your application. No new logical tables or fields exist. The STORE statement you just added has no effect on your current QlikView document, other than executing an addi-tional script statement. Once this statement has executed, however, a new data file exists that may be read by this QlikView document, or any QlikView document with access to the folder which we placed the custom-ers.qvd file. To test this, let’s temporarily replace the Customers select statement with a new load statement from the customers.qvd file we just created.
5 Re-open the Edit Script dialog from the menu or toolbar.
6 Comment the existing Customers SELECT statement and the STORE state-ment we just added.
7 Now, add a new Table Files LOAD statement using the Table Files Wizard. Locate the customers.qvd file in the Datasources folder, and open
©1996 - 2008 QlikTech International 133
8 Notice the Type is correctly indicated as QVD. Select Finish to close the dialog.
9 You can remove the Directory statement, and add the table label Customers to the new LOAD statement. Your script should now look as follows:
Customers:
LOAD Address, City, CompanyName, ContactName, Country, CustomerID, Fax, Phone, PostalCode, StateProvince,
FROM Datasources\Customers.qvd (qvd);
10 Click OK and then save your file. Reload the script.
Again, you will not notice any changes to the System sheet in your application, since we did not change any tables – only the location and type from where we read the data. In a normal environment, you would probably also notice a big difference in the time it takes to read the Customer table, since a QVD file is read into QlikView extremely fast.
Of course, the drawback to this technique is that when our Customers database data changes, it will not be read into our QlikView document. We will address that in the next section.
24.5 Automatic Creation of a QVD file in the script
QVD files can be also be created and maintained automatically via the buffer prefix. This prefix can be used on most load and select statements in the script. It indicates that a QVD file is used to cache/buffer the result of the statement. Some limitations exist, the most notable is that there must be either a file load or a select statement in “the bottom”. The name of the QVD file is a calculated name (a 160-bit hash of statement and other discriminating info, as hex) and is typically stored in the DATA folder:
C:\Document and Settings\%user%\Local Settings\Application Data\QlikTech\QlikView\Buffers
134 ©1996 - 2008 QlikTech International
QLIKVIEW DATA (QVD) FILES
TIP: To determine and/or change where QlikView will place QVD buffer files, as well as additional default folder locations, you can check under Settings... User Preferences... Folders
The prefix syntax can be either:
buffer [(option [,option])] load …or
buffer [(option [,option])] select …
where an option is either of the following:• incremental - this enables the ability to read only part of an underlying file. Pre-
vious size of the file is stored in the XML header in the QVD file. This is partic-ularly useful with log files. All records loaded at a previous occasion are read from the QVD file whereas the following new records are read from the original source and finally an updated QVD file is created.
• stale (after) amount [ (days | hours) ] - This is typically used with DB sources where there is no simple timestamp on the original data. Instead one specifies how old the QVD snapshot can be before it is replaced with a fresh read from the source file or database.
We will now revise our Customers table data load to use the automatic method of QVD file generation. We know from our project plan that Customers data is updated weekly, so we only need to read in updated data every 7 days. We will therefore change the script to add the correct QVD buffer prefix to our original Customers SELECT statement.
Do:1 Re-open the Edit Script dialog from the menu or toolbar.
2 Comment the Customers table LOAD statement from QVD we added in the previous section, and uncomment the original Customers LOAD statement.
3 Now, add the prefix buffer (stale after 7 days) to the Customers LOAD state-ment. Your script should now look as follows:
Customers: BUFFER (Stale After 7 days) LOAD Address, City,
©1996 - 2008 QlikTech International 135
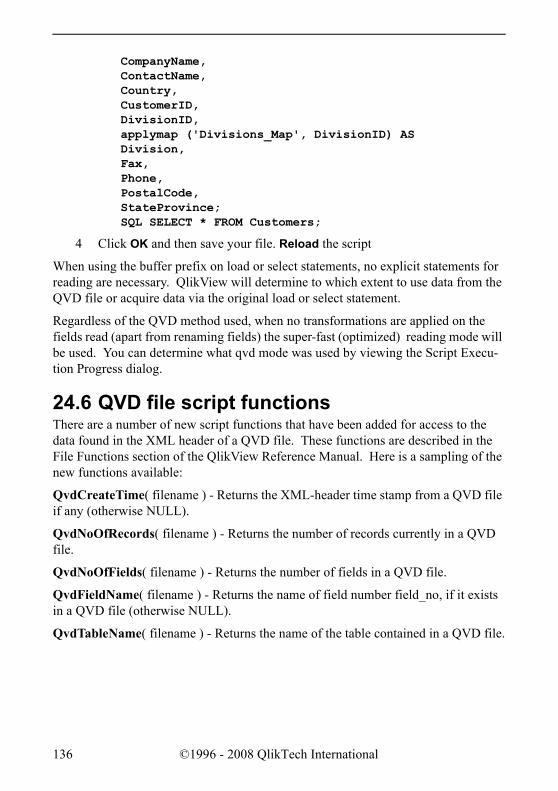
CompanyName, ContactName, Country, CustomerID, DivisionID, applymap ('Divisions_Map', DivisionID) AS Division, Fax, Phone, PostalCode, StateProvince; SQL SELECT * FROM Customers;
4 Click OK and then save your file. Reload the script
When using the buffer prefix on load or select statements, no explicit statements for reading are necessary. QlikView will determine to which extent to use data from the QVD file or acquire data via the original load or select statement.
Regardless of the QVD method used, when no transformations are applied on the fields read (apart from renaming fields) the super-fast (optimized) reading mode will be used. You can determine what qvd mode was used by viewing the Script Execu-tion Progress dialog.
24.6 QVD file script functionsThere are a number of new script functions that have been added for access to the data found in the XML header of a QVD file. These functions are described in the File Functions section of the QlikView Reference Manual. Here is a sampling of the new functions available:
QvdCreateTime( filename ) - Returns the XML-header time stamp from a QVD file if any (otherwise NULL).
QvdNoOfRecords( filename ) - Returns the number of records currently in a QVD file.
QvdNoOfFields( filename ) - Returns the number of fields in a QVD file.
QvdFieldName( filename ) - Returns the name of field number field_no, if it exists in a QVD file (otherwise NULL).
QvdTableName( filename ) - Returns the name of the table contained in a QVD file.
136 ©1996 - 2008 QlikTech International

NEW IN QLIKVIEW 8.5
25 NEW IN QLIKVIEW 8.5This chapter covers important new features deployed in QlikView Developer 8.5 and includes• Set Analysis• Dollar-Sign Expansion• Hierarchy Resolution
25.1 Set AnalysisSet Analysis is the most important new feature in the QlikView Developer 8.5 release.
QlikView has always been good at calculating aggregates for the current selection of data. However, when you wanted to compare results for different selections in the same chart, you needed to either prepare data in the script or resort to rather compli-cated expressions with if clauses.
Set analysis changes all that, by making it possible to modify any aggregation func-tion with an arbitrary selection set.
The set may be defined as a bookmark, as an on-the-fly selection in one or more fields, as a function of current selections, the inverse of current selections, previous selections, all data, etc., etc.
The possibilities are endless and yet the syntax is fairly simple and straightforward.
25.1.1 OverviewSets can be used in aggregation functions. Aggregation functions normally aggregate over the set of possible records defined by the current selection. But an alternative set of records can be defined by a set expression. Hence, a set is conceptually similar to a selection.
Note: A set expression is always enclosed in curly brackets when used, e.g.{BM01}.
©1996 - 2008 QlikTech International 137
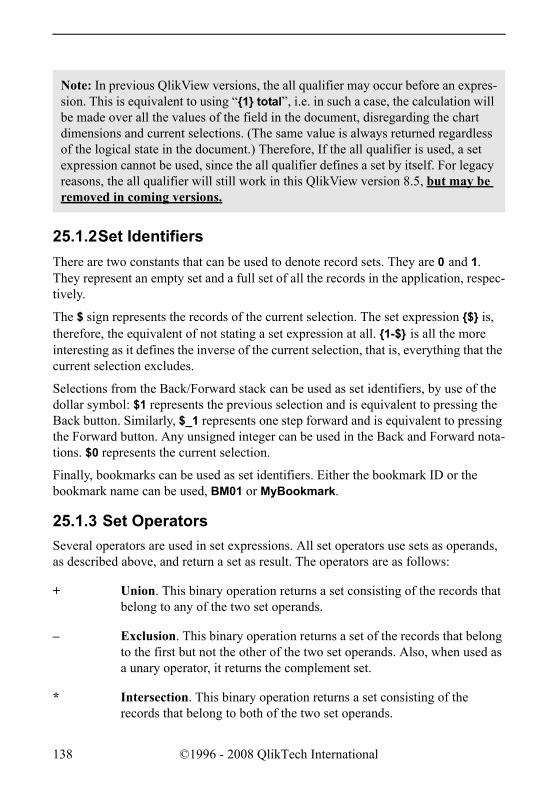
Note: In previous QlikView versions, the all qualifier may occur before an expres-sion. This is equivalent to using “{1} total”, i.e. in such a case, the calculation will be made over all the values of the field in the document, disregarding the chart dimensions and current selections. (The same value is always returned regardless of the logical state in the document.) Therefore, If the all qualifier is used, a set expression cannot be used, since the all qualifier defines a set by itself. For legacy reasons, the all qualifier will still work in this QlikView version 8.5, but may be removed in coming versions.
25.1.2Set IdentifiersThere are two constants that can be used to denote record sets. They are 0 and 1. They represent an empty set and a full set of all the records in the application, respec-tively.
The $ sign represents the records of the current selection. The set expression {$} is, therefore, the equivalent of not stating a set expression at all. {1-$} is all the more interesting as it defines the inverse of the current selection, that is, everything that the current selection excludes.
Selections from the Back/Forward stack can be used as set identifiers, by use of the dollar symbol: $1 represents the previous selection and is equivalent to pressing the Back button. Similarly, $_1 represents one step forward and is equivalent to pressing the Forward button. Any unsigned integer can be used in the Back and Forward nota-tions. $0 represents the current selection.
Finally, bookmarks can be used as set identifiers. Either the bookmark ID or the bookmark name can be used, BM01 or MyBookmark.
25.1.3 Set OperatorsSeveral operators are used in set expressions. All set operators use sets as operands, as described above, and return a set as result. The operators are as follows:
+ Union. This binary operation returns a set consisting of the records that belong to any of the two set operands.
– Exclusion. This binary operation returns a set of the records that belong to the first but not the other of the two set operands. Also, when used as a unary operator, it returns the complement set.
* Intersection. This binary operation returns a set consisting of the records that belong to both of the two set operands.
138 ©1996 - 2008 QlikTech International
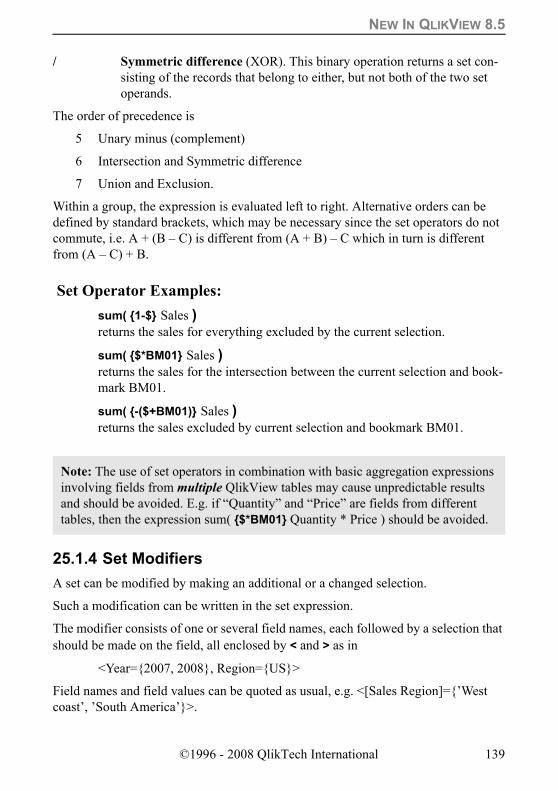
NEW IN QLIKVIEW 8.5
/ Symmetric difference (XOR). This binary operation returns a set con-sisting of the records that belong to either, but not both of the two set operands.
The order of precedence is
5 Unary minus (complement)
6 Intersection and Symmetric difference
7 Union and Exclusion.
Within a group, the expression is evaluated left to right. Alternative orders can be defined by standard brackets, which may be necessary since the set operators do not commute, i.e. A + (B – C) is different from (A + B) – C which in turn is different from (A – C) + B.
Set Operator Examples:sum( {1-$} Sales ) returns the sales for everything excluded by the current selection.
sum( {$*BM01} Sales ) returns the sales for the intersection between the current selection and book-mark BM01.
sum( {-($+BM01)} Sales ) returns the sales excluded by current selection and bookmark BM01.
Note: The use of set operators in combination with basic aggregation expressions involving fields from multiple QlikView tables may cause unpredictable results and should be avoided. E.g. if “Quantity” and “Price” are fields from different tables, then the expression sum( {$*BM01} Quantity * Price ) should be avoided.
25.1.4 Set ModifiersA set can be modified by making an additional or a changed selection.
Such a modification can be written in the set expression.
The modifier consists of one or several field names, each followed by a selection that should be made on the field, all enclosed by < and > as in
<Year={2007, 2008}, Region={US}>
Field names and field values can be quoted as usual, e.g. <[Sales Region]={’West coast’, ’South America’}>.
©1996 - 2008 QlikTech International 139
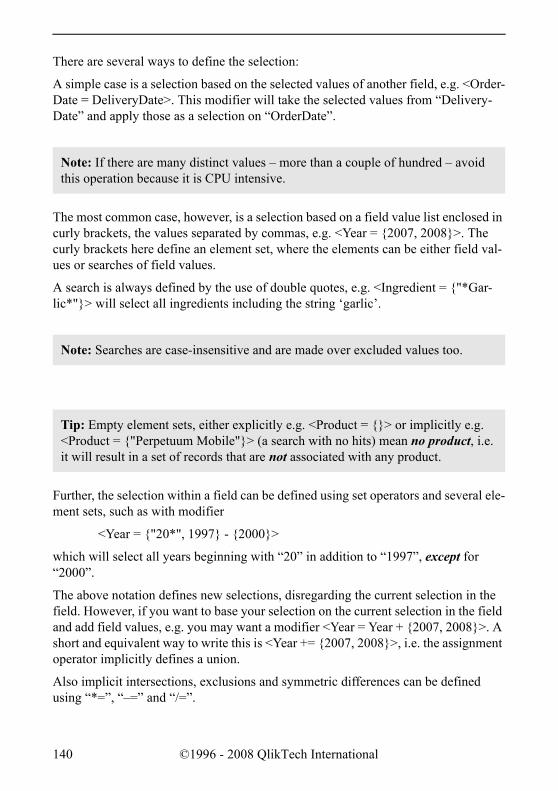
There are several ways to define the selection:
A simple case is a selection based on the selected values of another field, e.g. <Order-Date = DeliveryDate>. This modifier will take the selected values from “Delivery-Date” and apply those as a selection on “OrderDate”.
Note: If there are many distinct values – more than a couple of hundred – avoid this operation because it is CPU intensive.
The most common case, however, is a selection based on a field value list enclosed in curly brackets, the values separated by commas, e.g. <Year = {2007, 2008}>. The curly brackets here define an element set, where the elements can be either field val-ues or searches of field values.
A search is always defined by the use of double quotes, e.g. <Ingredient = {"*Gar-lic*"}> will select all ingredients including the string ‘garlic’.
Note: Searches are case-insensitive and are made over excluded values too.
Further, the selection within a field can be defined using set operators and several ele-ment sets, such as with modifier
<Year = {"20*", 1997} - {2000}>
which will select all years beginning with “20” in addition to “1997”, except for “2000”.
The above notation defines new selections, disregarding the current selection in the field. However, if you want to base your selection on the current selection in the field and add field values, e.g. you may want a modifier <Year = Year + {2007, 2008}>. A short and equivalent way to write this is <Year += {2007, 2008}>, i.e. the assignment operator implicitly defines a union.
Also implicit intersections, exclusions and symmetric differences can be defined using “*=”, “–=” and “/=”.
Tip: Empty element sets, either explicitly e.g. <Product = {}> or implicitly e.g. <Product = {"Perpetuum Mobile"}> (a search with no hits) mean no product, i.e. it will result in a set of records that are not associated with any product.
140 ©1996 - 2008 QlikTech International
NEW IN QLIKVIEW 8.5
Finally, for fields in and-mode, there is also the possibility of forced exclusion. If you want to force exclusion of specific field values, you will need to use “~” in front of the field name.
Note: A set modifier can be used on a set identifier or on its own. It cannot be used on a set expression. When used on a set identifier, the modifier must be writ-ten immediately after the set identifier, e.g. {$<Year = {2007, 2008}>}. When used on its own, it is interpreted as a modification of the current selection.
25.2 Dollar-Sign ExpansionDollar-sign expansions are definitions of text replacements used in the script or in expressions. This process is known as expansion - even if the new text is shorter. The replacement is made just before the script statement or the expression is evaluated. Technically, it is a macro expansion.
A macro expansion always begins with $( and ends with ) and the content between brackets defines how the text replacement will be done. To avoid confusion with script macros we will henceforth refer to macro expansions as dollar-sign expan-sions.
Note: Macro expansion is unrelated to script macros (VB or Java script defined in the script module).
25.2.1 Dollar-sign Expansion using a variableWhen using a variable for text replacement in the script or in an expression, the syn-tax
'$ (variablename)'
is used. $(variablename) expands to the value in variablename. If variablename does not exist the expansion will be the empty string.
For numeric variable expansions, the syntax
$ (variablename)
is used. $(variablename) always yields a legal decimal-point reflection of the numeric value of variablename, possibly with exponential notation (for very large/small numbers). If variablename does not exist or does not contain a numeric value, it will be expanded to 0 instead.
©1996 - 2008 QlikTech International 141
25.2.2 Dollar-Sign Expansion with ParametersParameters can be used in variable expansions. The variable must then contain for-mal parameters, such as $1, $2, $3 etc. When expanding the variable, the parameters should be stated in a comma separated list.
If the number of formal parameters exceeds the number of actual parameters, only the formal parameters corresponding to actual parameters will be expanded. If the number of actual parameters exceeds the number of formal parameters, the superflu-ous actual parameters will be ignored.
The parameter $0 returns the number of parameters actually passed by a call.
25.2.3 Dollar-Sign Expansion with an ExpressionExpressions can be used in dollar-sign expansions. The content between the brackets must then start with an equal sign:
$(=expression)
The expression will be evaluated and the value will be used in the expansion.
Example:
$(=Year(Today())) returns 2008
$(=Only(Year)-1)returns the year before the selected one
25.3 Set Analysis / Dollar-Sign Expansion Exercise
Do: Create a Straight Table chart that displays a comparison of annual sales by CompanyName based on the year selected by the user.
1 Open the QlikView file you have been working on in class.
2 Navigate to the Main sheet.
3 Right-click in a blank area on the Main sheet and choose Select Fields… from the context menu.
4 Add the Year field from the Available Fields column to the Fields Dis-played in Listboxes column and click OK.
5 Right-click in a blank area on the Main sheet and New Sheet Object then Chart from the context menu.
142 ©1996 - 2008 QlikTech International
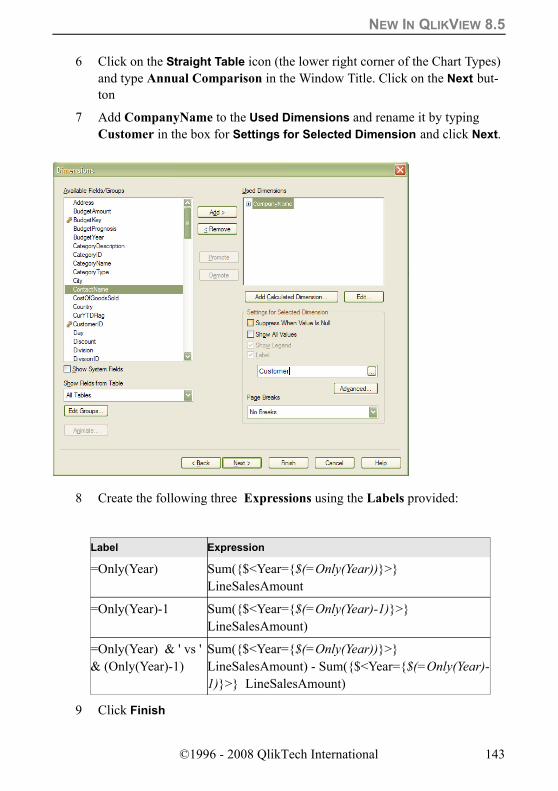
NEW IN QLIKVIEW 8.5
6 Click on the Straight Table icon (the lower right corner of the Chart Types) and type Annual Comparison in the Window Title. Click on the Next but-ton
7 Add CompanyName to the Used Dimensions and rename it by typing Customer in the box for Settings for Selected Dimension and click Next.
8 Create the following three Expressions using the Labels provided:
9 Click Finish
Label Expression
=Only(Year) Sum({$<Year={$(=Only(Year))}>} LineSalesAmount
=Only(Year)-1 Sum({$<Year={$(=Only(Year)-1)}>} LineSalesAmount)
=Only(Year) & ' vs ' & (Only(Year)-1)
Sum({$<Year={$(=Only(Year))}>} LineSalesAmount) - Sum({$<Year={$(=Only(Year)-1)}>} LineSalesAmount)
©1996 - 2008 QlikTech International 143
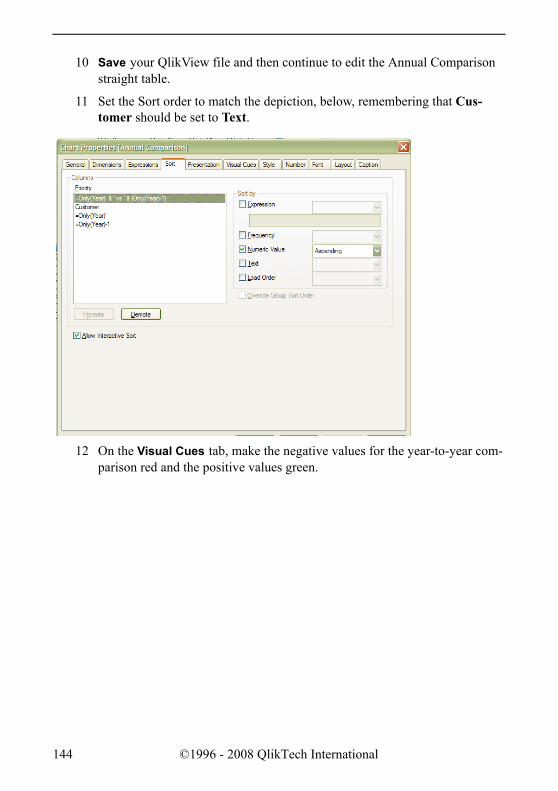
10 Save your QlikView file and then continue to edit the Annual Comparison straight table.
11 Set the Sort order to match the depiction, below, remembering that Cus-tomer should be set to Text.
12 On the Visual Cues tab, make the negative values for the year-to-year com-parison red and the positive values green.
144 ©1996 - 2008 QlikTech International
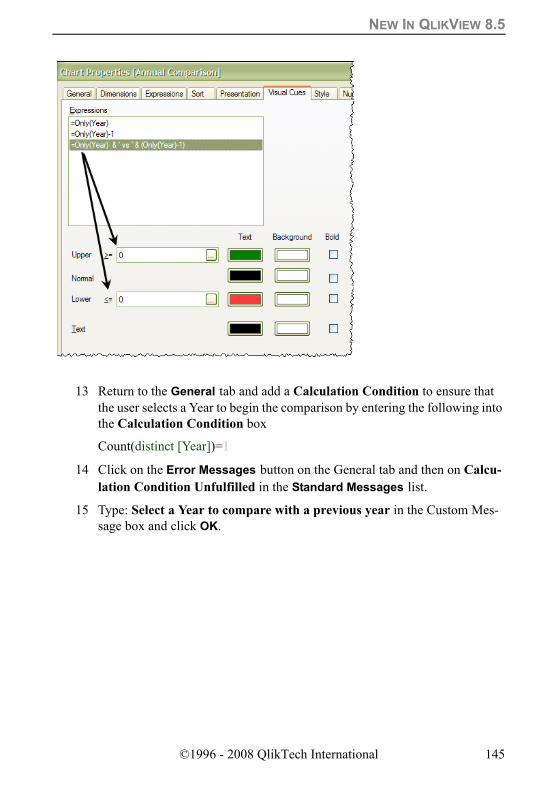
NEW IN QLIKVIEW 8.5
13 Return to the General tab and add a Calculation Condition to ensure that the user selects a Year to begin the comparison by entering the following into the Calculation Condition box
Count(distinct [Year])=1
14 Click on the Error Messages button on the General tab and then on Calcu-lation Condition Unfulfilled in the Standard Messages list.
15 Type: Select a Year to compare with a previous year in the Custom Mes-sage box and click OK.
©1996 - 2008 QlikTech International 145
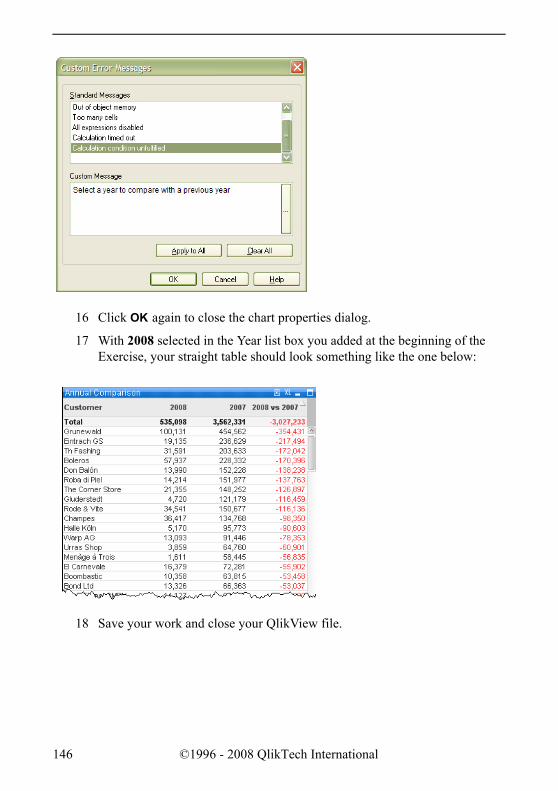
16 Click OK again to close the chart properties dialog.
17 With 2008 selected in the Year list box you added at the beginning of the Exercise, your straight table should look something like the one below:
18 Save your work and close your QlikView file.
146 ©1996 - 2008 QlikTech International
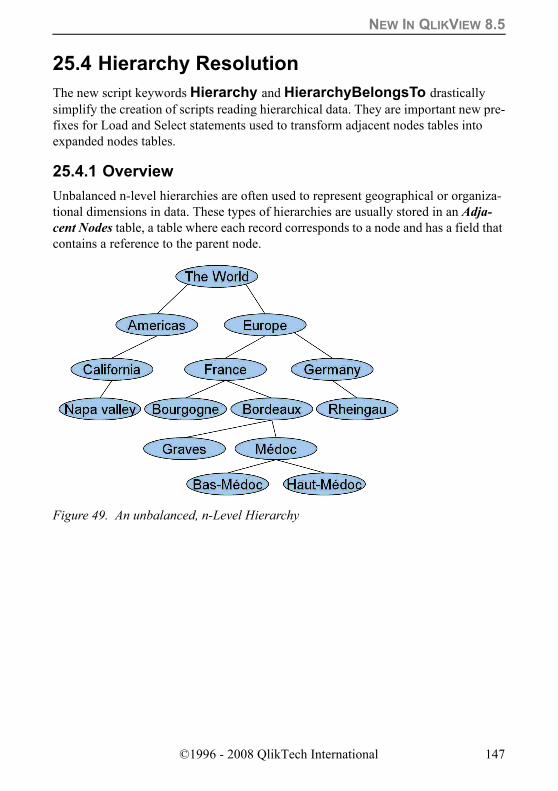
NEW IN QLIKVIEW 8.5
25.4 Hierarchy ResolutionThe new script keywords Hierarchy and HierarchyBelongsTo drastically simplify the creation of scripts reading hierarchical data. They are important new pre-fixes for Load and Select statements used to transform adjacent nodes tables into expanded nodes tables.
25.4.1 OverviewUnbalanced n-level hierarchies are often used to represent geographical or organiza-tional dimensions in data. These types of hierarchies are usually stored in an Adja-cent Nodes table, a table where each record corresponds to a node and has a field that contains a reference to the parent node.
Figure 49. An unbalanced, n-Level Hierarchy
©1996 - 2008 QlikTech International 147

25.4.2The Adjacent Nodes Table
In such a table the node is stored on one record only but can still have any number of children. The table may of course contain additional fields describing attributes for the nodes.
An Adjacent Nodes table is optimal for maintenance, but difficult to use in everyday work. Instead, in queries and analysis, other representations are used. The Expanded Nodes table is one common representation, where each level in the hierarchy is stored in a separate field. The levels in an Expanded Nodes table can easily be used in a pivot table or a in a tree structure. The hierarchy keyword can be used in the QlikView script to transform an Adjacent Nodes table to an Expanded Nodes table.
Figure 50. Adjacent Nodes Table
148 ©1996 - 2008 QlikTech International

NEW IN QLIKVIEW 8.5
25.4.3The Expanded Nodes Table
A problem with the Expanded Nodes table is that you cannot easily use the level fields for searches or selections, since you need à priori knowledge about which level you should search or select in. The Ancestors table is a different representation that solves this problem. This representation is also sometimes called a Bridge table.
25.4.4The Ancestors Table
Figure 51. Expanded Nodes Table
Figure 52. Ancestors Table
©1996 - 2008 QlikTech International 149
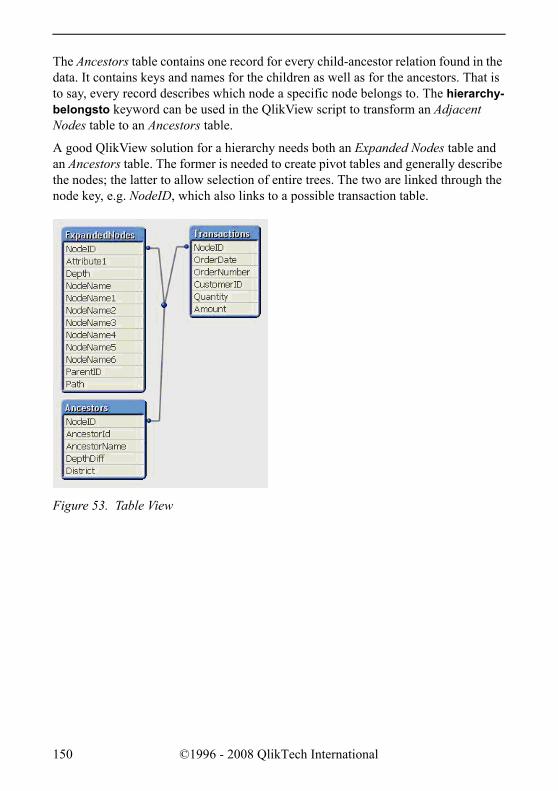
The Ancestors table contains one record for every child-ancestor relation found in the data. It contains keys and names for the children as well as for the ancestors. That is to say, every record describes which node a specific node belongs to. The hierarchy-belongsto keyword can be used in the QlikView script to transform an Adjacent Nodes table to an Ancestors table.
A good QlikView solution for a hierarchy needs both an Expanded Nodes table and an Ancestors table. The former is needed to create pivot tables and generally describe the nodes; the latter to allow selection of entire trees. The two are linked through the node key, e.g. NodeID, which also links to a possible transaction table.
Figure 53. Table View
150 ©1996 - 2008 QlikTech International
NEW IN QLIKVIEW 8.5
25.4.5 Script ExampleThe following script example shows the syntax for using Hierarchy and Hierarchy-BelongsTo to solve the problem of unbalanced n-level hiearchies.
X:
Hierarchy (NodeID, ParentID, NodeName)
LOAD NodeID,
ParentID,
NodeName,
Recno() as Attribute1
FROM [Winedistricts.xls] (biff, embedded labels, table is [AdjacentNodes$]);
Y:
HierarchyBelongsTo (NodeID, ParentID, District, AncestorName)
LOAD NodeID,
ParentID,
NodeName as District,
Recno() as Attribute2
FROM [Winedistricts.xls] (biff, embedded labels, table is [AdjacentNodes$]);
25.5 Hierarchy Resolution Exercise
Do: Open the sample QlikView and data files and examine them. Come up with examples of your own.
1 Navigate to the folder where you installed the training materials, sample files and data sources for this course.
2 Open the ExampleFiles folder.
©1996 - 2008 QlikTech International 151
3 Explore the use of Hierarchy and HierarchyBelongsTo in the .QVWs there, including:
• Whats New in QV85.qvw
• Hierarchies_Products_Example.qvw
• Hierarchies_Winedistricts_Example.qvw
4 Does your business have unbalanced n-level hierarchies? Sketch out an Excel version (as in the samples) and try your hand at loading the tables into QlikView. Or you can examine the examples and try to determine if, in fact, you do have unbalanced n-level hiearchies in your business after all.
152 ©1996 - 2008 QlikTech International
QLIKVIEW SECURITY
26 QLIKVIEW SECURITYComputer security is an important element of most organizations. In this Training we will go through some methods that can be used to limit the access to QlikView docu-ments. It is important though to realize that this chapter is not a general chapter on QlikView security, but only an introduction to some of the methods you can use directly in QlikView to limit the access in a QlikView document. Of course, it is pos-sible to use Windows file security with QlikView documents, but that would be an entirely different course.
In this chapter we will go through how you can work with QlikView security by handing every user a user id and a password. We will also go through how to use NT Name and NT Domain SID to allow single sign on to a QlikView document. Finally, we will look into how you can dynamically reduce the amount of data shown to a user.
26.1 Access controlA QlikView document is an encrypted file consisting of a database, script, layout, etc. The file format itself provides some intrinsic protection, since it is not possible to open the file if you do not have QlikView. It is also possible to include access levels in the load script.
26.2 Access levels Each user of the QlikView document can be assigned an access level: ADMIN or USER. An individual with ADMIN privileges can change everything in the document (subject to product limitations), whereas a person with USER privileges has restricted access. A user of QlikView Analyzer will be automatically restricted to USER privi-leges, regardless of SECTION ACCESS settings. If no access level is assigned to a user in SECTION ACCESS, the user cannot open the QlikView document.
For clarity, it may be useful to use other access levels, e.g. NONE. These will always be treated as “no access”.
26.3 Access control databaseAll access control is managed via text files, databases or INLINE clauses in the same way as data is normally handled by QlikView. The tables are loaded in the normal way, but first an ACCESS section is loaded in the script in a section declared by the statement, SECTION ACCESS.
©1996 - 2008 QlikTech International 153
QLIKVIEW SECURITY
TIP: Be aware that all field names and values will be automatically converted to upper case in SECTION ACCESS. This must be taken into consideration when using preceding LOAD or RESIDENT LOAD statements within SECTION ACCESS.
If an ACCESS section is declared in the load script, the part of the script that loads standard data must be preceded by the statement SECTION APPLICATION There are several protected field names in the access control database, including: USERID, PASSWORD, SERIAL, NTNAME, NTDOMAINSID, NTSID, and ACCESS. Other user-defined fields may be added, e.g., GROUP or DEPARTMENT, to facilitate dynamic data reduction or for administration, but QlikView does not use the extra fields for limiting access to the document. None, all or any combination of the secu-rity fields may be loaded in the SECTION ACCESS. If none of the security fields is loaded, all the users will have ADMIN rights.
As another example, it is not necessary to use USERID – a check can be made on SERIAL only. This fact can be used for command-line reloads of access-restricted documents. The protected field names are defined below:
ACCESS A field that defines what access the user should have.
USERID A field that should contain a user id that has the privilege specified in the field ACCESS.
PASSWORD A field that should contain an accepted password.
SERIAL A field that should contain a number corresponding to the QlikView Serial Number. Example: 4900 2394 7113 7304
NTNAME A field that should contain a string corresponding to a Windows NT Domain user name or group name.
NTDOMAINSID A field that should contain a string corresponding to a Windows NT Domain SID. Example: S-1-5-21-125976590-467238106-1092489882
NTSID A field that should contain a Windows NT SID. Example: S-1-5-21-125976590-467238106-1092489882-1378
OMIT A field that should contain a list of fields that should be omitted for this specific user. Wildcards may be used and the list may be empty.
©1996 - 2008 QlikTech International 154
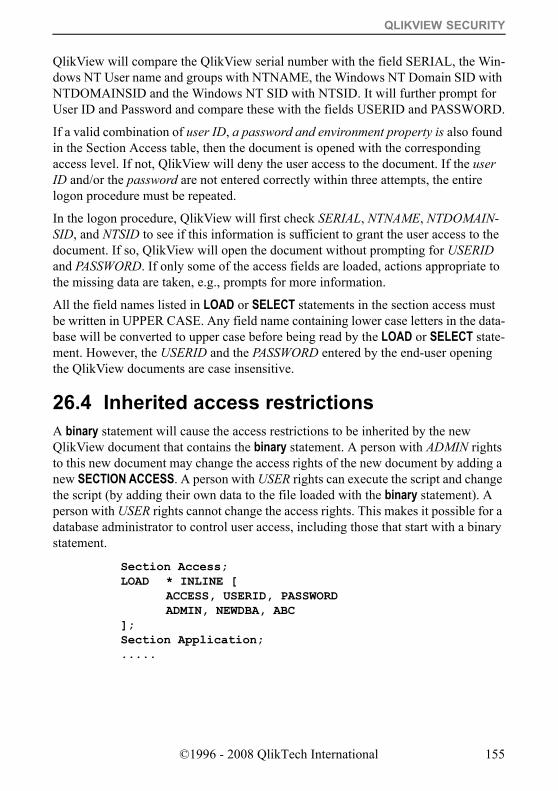
QLIKVIEW SECURITY
QlikView will compare the QlikView serial number with the field SERIAL, the Win-dows NT User name and groups with NTNAME, the Windows NT Domain SID with NTDOMAINSID and the Windows NT SID with NTSID. It will further prompt for User ID and Password and compare these with the fields USERID and PASSWORD.
If a valid combination of user ID, a password and environment property is also found in the Section Access table, then the document is opened with the corresponding access level. If not, QlikView will deny the user access to the document. If the user ID and/or the password are not entered correctly within three attempts, the entire logon procedure must be repeated.
In the logon procedure, QlikView will first check SERIAL, NTNAME, NTDOMAIN-SID, and NTSID to see if this information is sufficient to grant the user access to the document. If so, QlikView will open the document without prompting for USERID and PASSWORD. If only some of the access fields are loaded, actions appropriate to the missing data are taken, e.g., prompts for more information.
All the field names listed in LOAD or SELECT statements in the section access must be written in UPPER CASE. Any field name containing lower case letters in the data-base will be converted to upper case before being read by the LOAD or SELECT state-ment. However, the USERID and the PASSWORD entered by the end-user opening the QlikView documents are case insensitive.
26.4 Inherited access restrictionsA binary statement will cause the access restrictions to be inherited by the new QlikView document that contains the binary statement. A person with ADMIN rights to this new document may change the access rights of the new document by adding a new SECTION ACCESS. A person with USER rights can execute the script and change the script (by adding their own data to the file loaded with the binary statement). A person with USER rights cannot change the access rights. This makes it possible for a database administrator to control user access, including those that start with a binary statement.
Section Access; LOAD * INLINE [
ACCESS, USERID, PASSWORD ADMIN, NEWDBA, ABC
]; Section Application; .....
©1996 - 2008 QlikTech International 155
QLIKVIEW SECURITY
26.5 Hidden scriptA hidden script is a password protected hidden area of script code that is always exe-cuted prior to the standard script during a reload.
When choosing Edit Hidden Script from the File menu in the Edit Script dialog, you will be prompted for a password that will be required before giving access to the hid-den script. If it is the first time you access the hidden script in a document (thereby creating one), you will have to confirm the new password. After this, the Hidden Script tab will appear to the left of all other script tabs and remain there until you close the document. Keep in mind the following characteristics of hidden scripts if you choose to use them:• If a hidden script is used, the binary command cannot be used in the normal
script, since it must be the first statement executed in a document script.• Tables generated by the hidden part of the script will not be represented by name
in the $Table system field.• The Script Execution Progress dialog will not be updated during the execution of
a hidden script. No entries will be made in the log file, if used. Note that as of QlikView version 7, there is available a Document Security override to Show Progress for Hidden Script. The progress information will also be written to the script execution log, if applicable.
• If the hidden script contains a Section Access, such a section will not be permit-ted in the normal script nor in a script starting with a binary load of the QlikView file containing the hidden script.
26.6 Adding Section AccessWe will now add the necessary lines to our script to check the access rights of various users. It is generally good practice to place the script code for section access in the “hidden script” area.
Before you start working with security in QlikView, make sure to save a back up of your document without security. This is a safety measure so that you can start from the beginning again if the security section does not work.
Warning! IT IS STRONGLY SUGGESTED TO SAVE A DOCUMENT WITH SECTION ACCESSAS A NEW FILE NAME AFTER RELOAD, BUT BEFORE ATTEMPTING TO CLOSE AND REOPEN THE QlikView DOCUMENT. IF LOGICAL ERRORS EXIST IN SECTION ACCESS, IT MAY NO LONGER BE POSSIBLE TO OPEN THE DOCUMENT ONCE IT IS RELOADED.
©1996 - 2008 QlikTech International 156
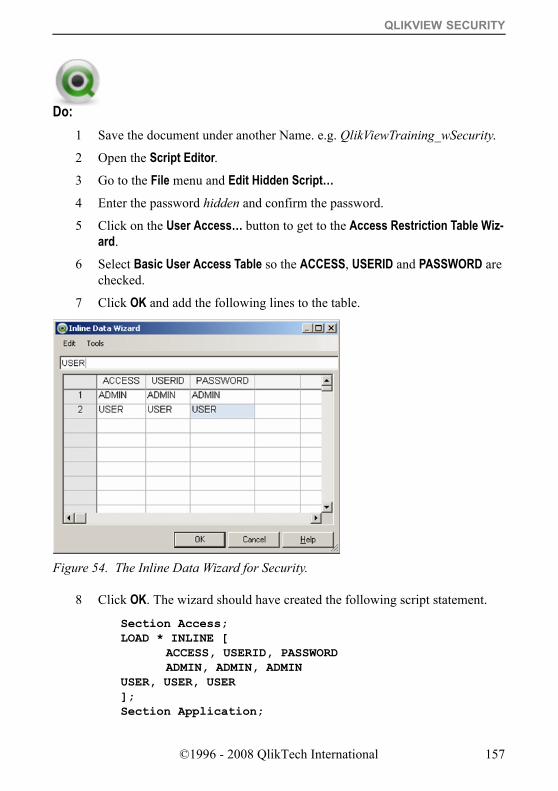
QLIKVIEW SECURITY
Do:1 Save the document under another Name. e.g. QlikViewTraining_wSecurity.
2 Open the Script Editor.3 Go to the File menu and Edit Hidden Script…4 Enter the password hidden and confirm the password.
5 Click on the User Access… button to get to the Access Restriction Table Wiz-ard.
6 Select Basic User Access Table so the ACCESS, USERID and PASSWORD are checked.
7 Click OK and add the following lines to the table.
8 Click OK. The wizard should have created the following script statement.
Section Access; LOAD * INLINE [ ACCESS, USERID, PASSWORD ADMIN, ADMIN, ADMIN USER, USER, USER ]; Section Application;
Figure 54. The Inline Data Wizard for Security.
©1996 - 2008 QlikTech International 157
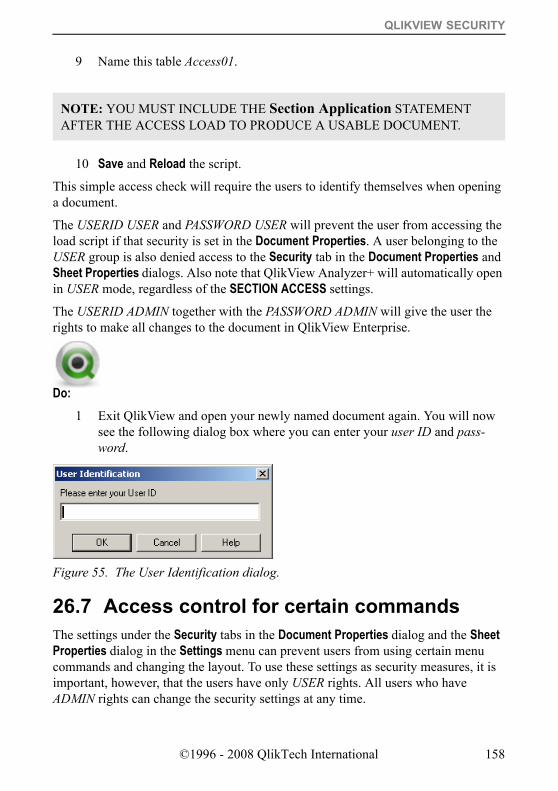
QLIKVIEW SECURITY
NOTE: YOU MUST INCLUDE THE Section Application STATEMENT AFTER THE ACCESS LOAD TO PRODUCE A USABLE DOCUMENT.
9 Name this table Access01.
10 Save and Reload the script.
This simple access check will require the users to identify themselves when opening a document.
The USERID USER and PASSWORD USER will prevent the user from accessing the load script if that security is set in the Document Properties. A user belonging to the USER group is also denied access to the Security tab in the Document Properties and Sheet Properties dialogs. Also note that QlikView Analyzer+ will automatically open in USER mode, regardless of the SECTION ACCESS settings.
The USERID ADMIN together with the PASSWORD ADMIN will give the user the rights to make all changes to the document in QlikView Enterprise.
Do:1 Exit QlikView and open your newly named document again. You will now
see the following dialog box where you can enter your user ID and pass-word.
26.7 Access control for certain commandsThe settings under the Security tabs in the Document Properties dialog and the Sheet Properties dialog in the Settings menu can prevent users from using certain menu commands and changing the layout. To use these settings as security measures, it is important, however, that the users have only USER rights. All users who have ADMIN rights can change the security settings at any time.
Figure 55. The User Identification dialog.
©1996 - 2008 QlikTech International 158
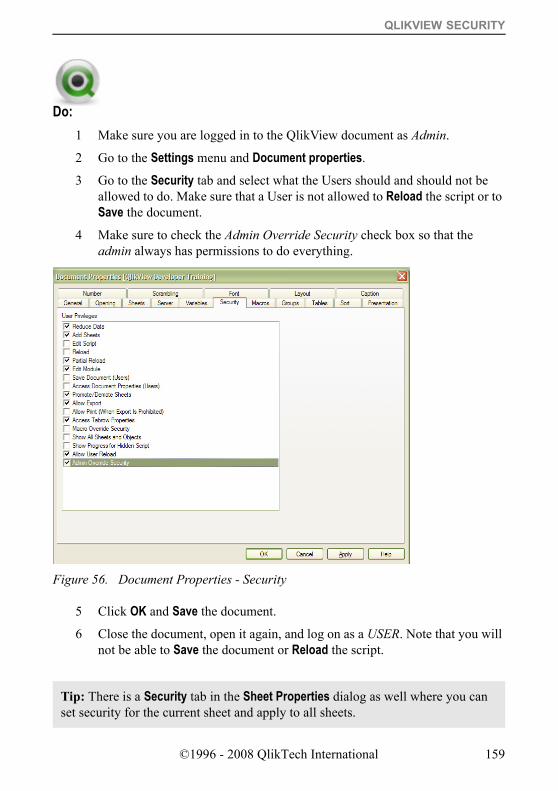
QLIKVIEW SECURITY
Do:
Tip: There is a Security tab in the Sheet Properties dialog as well where you can set security for the current sheet and apply to all sheets.
1 Make sure you are logged in to the QlikView document as Admin.
2 Go to the Settings menu and Document properties.
3 Go to the Security tab and select what the Users should and should not be allowed to do. Make sure that a User is not allowed to Reload the script or to Save the document.
4 Make sure to check the Admin Override Security check box so that the admin always has permissions to do everything.
5 Click OK and Save the document.
6 Close the document, open it again, and log on as a USER. Note that you will not be able to Save the document or Reload the script.
Figure 56. Document Properties - Security
©1996 - 2008 QlikTech International 159
QLIKVIEW SECURITY
26.8 Further access controlIt is easy to increase the security control for those users who we believe will require access to a specific document. By adding a field to the previously created INLINE table, we can connect it to a new, two-column table in which we specify the serial numbers that have access to the document. In this way, we can restrict access to a specific document even further.
The new, two-column table will be created in Notepad, or a similar text editor, and be called Access. We will save this new, tab-delimited text file in the DataSources direc-tory.
Do:1 Add another field called COMPUTER to the previously existing Access01
INLINE table. Include one or two identifiers for course computers (these will act as connected fields) as shown below.
Section Access; LOAD * INLINE [ ACCESS, USERID, PASSWORD, COMPUTER ADMIN, ADMIN, ADMIN, COURSE1 USER, USER, USER, COURSE2 ]; Section Application;
2 Open Notepad, or a similar text editor
3 Create a two-column table with the fields COMPUTER and SERIAL. Include your own serial number as a field value; you will find this number under the About QlikView menu in QlikView. An example is shown below.
COMPUTER SERIAL Course1 2300 2394 7111 8000 Course2 2300 2394 7111 8001
4 Save this file as Access02.txt.
It can be seen that only two license numbers have access to the document we have created, one with USER rights and one with ADMIN rights. Also, note that we are adding restrictions to existing USERIDs (USER), and not replac-ing current restrictions.
©1996 - 2008 QlikTech International 160
QLIKVIEW SECURITY
Open the load script and click on the Table Files button. Load the newly cre-ated table Access02.txt after the inline table, and prior to the SECTION APPLICATION statement, as shown below.
Access02: Load
COMPUTER, SERIAL
FROM Datasources\Access02.txt (ansi, txt, delimiter is '\t', embedded labels);
Section Application;
5 Save and Reload the document.
6 Close the document and open it again as a User.
Assuming that you have not entered your serial number in both records in the Access02.txt file, you may only log in as a USER or ADMIN. It would be easy to add a third line to the access control tables which always gave every serial number USER rights, assuming a valid user ID and password. To do this, we can add a third com-puter (e.g. Course3) and enter * as the value in the SERIAL field.
26.9 Unattended Command Line Reload Considerations
To create security access for a non-intervention command line reload process, you would enter the SERIAL registered to the user assigned to the reload process on the reload computer. Then connect this to USERID and PASSWORD with * as values (* here means all possible values, which would avoid the USERID and PASSWORD prompts). You should also set the ACCESS field to ADMIN for this user.
If you add the following record to the Access01 LOAD INLINE statement, this will allow the Course2 computer to be used for unattended reloads.
*,*,ADMIN,COURSE2]
26.10 Access restrictions on selected field values
QlikView secured access provides a feature to prevent users from viewing parts of the data in a document. This feature was primarily developed for QlikView Server, but can also be used in QlikView, with a few considerations.
©1996 - 2008 QlikTech International 161
QLIKVIEW SECURITY
The selection of values to be shown or hidden is controlled by having one or more fields with the same names in SECTION ACCESS and SECTION APPLICATION. When the user has logged in, QlikView will copy the (upper case) selected values in SEC-TION ACCESS to fields in SECTION APPLICATION with the same name. QlikView will permanently conceal, from the user, all the data excluded by this process.
All field names and values used to connect SECTION ACCESS and SECTION APPLI-CATION must be written in upper case, since all field names and field values are, by default, converted to upper case in SECTION ACCESS.
To use this feature, the option Initial Data Reduction Based on Section Access on the Opening page of the Document Properties dialog must be checked. If this feature is used in documents that are to be distributed by other means than via QlikView Server, the option Prohibit Binary Load, on the same page, must be selected to main-tain the integrity of data protection.
TIP: There is a known issue in Dynamic Data Reduction QlikView documents where a fully executed reload will override dynamic data reduction settings – allowing users to see “all” data. To mitigate this security risk, QlikView version 8 will prohibit data reloads in documents that have dynamic data reduction in effect.
26.11 Field value limitation in Section AccessWe will now show how to limit the amount of data shown in our QlikView document. We want to distribute the file to the employees involved in sales. Each salesperson will, however, not have access to data pertaining to their peers. Therefore, we will add a limitation to the script, which ensures that people only have access to their own data.
We will use two text files for this purpose. The first file will establish the SECTION ACCESS fields for each allowed user. The second text file will be loaded in SEC-TION APPLICATION and limit the application data that each allowed user will be able to view once they open the QlikView document. Both text files are located in the Datasources directory.
We must also bear in mind that we need an administrator to manage the document. One of the salespersons is also the Sales Manager of the company, and he should nat-urally have access to the entire document to be able to assess the performance of each salesperson. We also have a Sales Coordinator in Lund who should have access to the data on all salespersons. This access can be implemented through use of a null field value specified in the connecting field when loaded in the SECTION ACCESS sec-tion. You could use the * value for this field, as we used earlier for the USERID and
©1996 - 2008 QlikTech International 162
QLIKVIEW SECURITY
PASSWORD fields, but it is generally preferable to use null for connecting fields, since this will allow access to ALL data, regardless of whether it has a logical con-nection to the connecting field.
Do:1 Open the load script and File - Edit Hidden Script (note that you must have
Admin privileges to edit the hidden script). Verify that your cursor is posi-tioned on the Hidden Script tab.
2 Now, comment the previously loaded INLINE tables so that they will not interfere with our new SECTION ACCESS tables.
3 The first text file to load is SalesSecurity.txt, located in the Datasources directory. Label this logical table as Access01.
4 Then, add the SECTION APPLICATION statement.
5 Next, create a load statement for the SalesInitials.txt file, located in the Datasources directory. It is good practice to use the upper function against the connecting field (SP), since the value must be uppercase to match the value from SECTION ACCESS. The new statements should resemble the following.
Section Access; Access01: Load
[USERID], [ACCESS], SP /* Connecting field for data reduction */
FROM Datasources\SalesSecurity.txt (ansi, txt, delimiter is '\t', embedded labels); Section Application; Access_Application: Load
upper(SP) as SP, /* Connecting field for data reduction */
[SalesPerson] FROM Datasources\SalesInitials.txt (ansi, txt, delimiter is '\t', embedded labels);
6 Save and Reload the document.
7 Go to the Settings menu and to Document Properties.
©1996 - 2008 QlikTech International 163

QLIKVIEW SECURITY
8 Select the Opening tab and check Initial Data Reduction Based on Section Access. Make sure to uncheck Strict Exclusion. Also, check Prohibit Binary Load.
9 Go on to the Security tab and make sure that a User cannot edit or reload the script. Save should not be allowed either (uncheck the checkboxes Edit Script, Reload, Partial Reload, Save Document and Allow User Reload).
10 Save again and exit the document.
11 Open the document again and log on with Leif as USERID. Notice that you can view data for this user, as well as the Sales Persons, Tom Lindwall and Frank Roll.
12 Close the document and open it again, this time using James. You will now be able to see all data again.
©1996 - 2008 QlikTech International 164

REPORTING BUGS IN QLIKVIEW
27 REPORTING BUGS IN QLIKVIEWIf you discover a bug in QlikView, it is important to report this behavior to QlikTech or a certified QlikTech Partner. It is also critical to provide as much detailed informa-tion as possible to describe the error, and, hopefully, the ability for QlikTech develop-ers to reproduce the behavior. There are several things you can do to make the bug report an efficient and useful process.
Provide a clear description of the problem, including typical actions leading up to the error, along with any error messages that are displayed.
If it is possible to provide a sample QlikView document that can be used to demon-strate the error, this will be very helpful in resolving the issue.
If the error occurs during a reload, include the QlikView log file with the bug report. The log file is described in the preceding section of this course.
You should always create a System sheet in your QlikView documents to help deter-mine the integrity of your data structure. This sheet can easily be “hidden” from users in a production application using the Show Sheet setting on the General page of the Sheet Properties dialog.
©1996 - 2008 QlikTech International 165
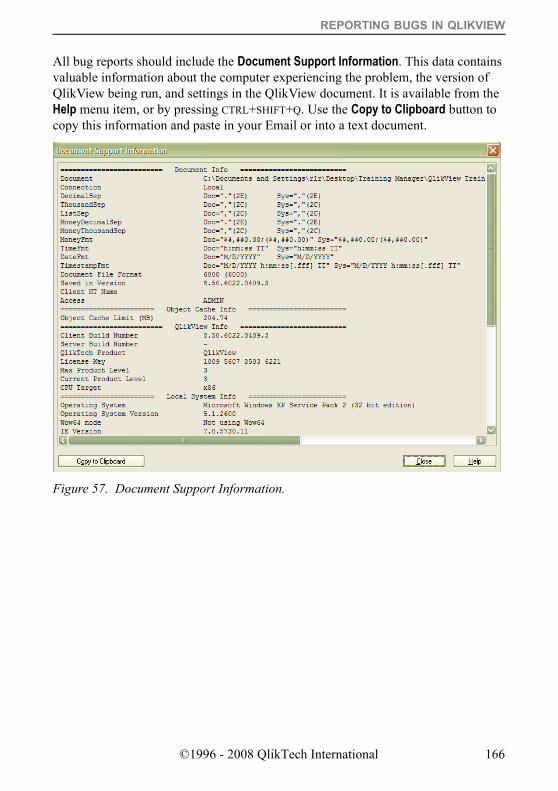
REPORTING BUGS IN QLIKVIEW
All bug reports should include the Document Support Information. This data contains valuable information about the computer experiencing the problem, the version of QlikView being run, and settings in the QlikView document. It is available from the Help menu item, or by pressing CTRL+SHIFT+Q. Use the Copy to Clipboard button to copy this information and paste in your Email or into a text document.
Figure 57. Document Support Information.
©1996 - 2008 QlikTech International 166
QLIKVIEW REFERENCE MATERIALS
28 QLIKVIEW REFERENCE MATERIALS
There are several QlikView Reference materials available to you. Many have been mentioned in this course already. It is important to familiarize yourself with these tools as you develop your skills to create efficient and effective QlikView documents.• QlikView Reference Manual: The Reference Manual documents are typically
installed on your computer during the QlikView installation process. These include a Tutorial Guide for new users, along with detailed reference guides for script and layout development. You can also contact your QlikTech or certified QlikView Partner representative about ordering hard copy manuals.
• QlikView Help Subsystem: The Help subsystem is available directly from most dialogs and menus. It includes a general content, an index of available informa-tion, and a full text search capability. If invoked off a dialog, it will open context specific information.
• QlikView Example Documents: These sample documents can be an invaluable source of information that demonstrates validated methods for developing QlikView documents. It can be quite useful to browse through these documents to get ideas of what can be accomplished through QlikView.
• QlikView Training Material: This course document, along with other course documents offered by QlikTech can be used as a valuable reference guide that you can always refer back to after training is completed.
©1996 - 2008 QlikTech International 167

168 ©1996 - 2008 QlikTech International

APPENDIX
169

170
A DATA TYPES IN QLIKVIEW QlikView can handle text strings, numbers, dates, times, timestamps and currencies. These can be sorted, shown in various formats and used in calculations. This means that dates, times and timestamps can be added and subtracted. This chapter is pro-vided as background and reference information concerning how QlikView handles data types.
A.1 Data storage in QlikView To understand how QlikView interprets data and formats numbers, you must first know how data is stored internally in the program. All the data loaded into QlikView is stored in two ways: as a text string and as numbers.
The text string is always used. This is shown in the list boxes and other sheet objects. In the formatting of data in list boxes (number formatting), only the text string is affected.
Numbers are only used when the data can be interpreted as a valid number. All forms of numerical calculation and sorting can be used.
If several pieces of data with the same numerical value are loaded in the same field, they will be treated as multiple occurrences of the same value and will together be assigned the first text string encountered. If the numbers 1.0, 1 and 1.000 are loaded in this order, they will be given the numerical value 1, and the original text string 1.0.
A.2 Data containing information on data type1 Fields that contain numbers of a defined data type, in a database loaded via
ODBC, will be handled according to their respective data type in QlikView.
QlikView will remember the original format of the fields, even if it is changed in one of the number format dialogs. It is always possible to restore the original format by clicking on the Default from Input button in the Number page of the Document Proper-ties dialog.
QlikView uses the following standard formats for each type of number: • Integers, floating-point numbers: standard format for numbers• Money: standard format for currencies• Time, date, timestamp: ISO standard
The standard settings for numbers and currencies are defined via variables, which are interpreted in the script, or via the settings of the operating system (Control Panel).
171
A.3 Data without information on data typeThe handling of data that have no specific formatting information (e.g. data from text files or ODBC data with a general format) is more complicated. The result depends on at least six factors.• The format of the data in the database• The settings of the operating system regarding numbers, time, date, etc. (Control
Panel)• The use of variables for interpretation in the script • The use of interpretation functions in the script• The use of formatting functions in the script• The use of number format dialogs in the document
QlikView tries to interpret the input data as numbers, dates, times, etc. As long as the standard system settings are used, QlikView will interpret and format the data auto-matically. Thus, the user need not change the script or the settings in QlikView. There is a simple way of checking if QlikView has interpreted the data correctly: numerical data are usually right aligned in list boxes, while text strings are left aligned.
The standard routine involves going through the following process until a suitable format is found. (Standard format includes, for example, decimal separator, the order of years, months and numbers, etc. in the operating system, i.e. in the Control Panel, or in some cases defined via the special variables for interpretation by the script.)
QlikView interprets data as:• a number according to the standard format for numbers • a date according to the standard format for dates• a timestamp according to the standard format for time and date• a time according to the standard format for time• a date according to the following format: yyyy-MM-dd• a timestamp according to the following format: yyyy-MM-dd hh:mm [:ss[.fff]]• a time according to the following format: hh:mm [:ss[.fff]]• currencies according to the standard format for currencies• a number with '.' as decimal separator and ',' as a separator for thousands, assum-
ing that neither the decimal separator nor the separator for thousands is set to ','• a number with ',' as decimal separator and '.' as a separator for thousands, assum-
ing that neither the decimal separator nor the separator for thousands is set to '.'• a text string. This final test never fails: if it is at all possible to load the data, it is
always possible to interpret it as a text string.
172
Interpretation problems may arise when data is loaded from text files. An incorrect decimal separator or thousands separator can lead to QlikView interpreting the num-bers incorrectly. The first thing you should do is to check that the variables for num-ber interpretation in the script are correctly defined, and that the system settings in the Control Panel are correct.
When QlikView has interpreted data as a date or time, it is possible to change the date and time format in the Properties dialog of the sheet object (under the Number tab). The overruling formatting is done on the document level in the Document Properties: Number tab.As there is no predefined format for data, a record can obviously contain values with different formats in a single field. For example, valid dates, integers and text may be found in one field. This data will not be formatted, but will be shown in list boxes in their original form.
When the number format dialog for such a field is opened for the first time, the for-mat will be Mixed. Once you have changed the format, it will be impossible for QlikView to revert to the original format for these field values, that is, if the Survive Reload box is checked when the script is run.
The Default from Input button is thus not activated for this kind of field after the num-ber format has been changed.
A.4 Dates and timesQlikView stores dates, times and timestamps as a date serial number for date. The serial number for dates is used for dates, times and timestamps and for arithmetical calculations based on units of date and time. Dates and times can thus be added and subtracted, and intervals can be compared, etc.
The numbers used for date and time are the values of the number of days that have passed since December 30, 1899. QlikView is thus compatible with the date system 1900 used by Microsoft Excel for Windows, Lotus 1-2-3 and other programs, between 1 March 1900 and 28 February 2100. Outside this time frame QlikView uses the same date system extrapolated with the aid of the Gregorian calendar, which is now a standard in the Western world.
The date serial number for time is a number between 0 and 1. The date serial number 0.00000 corresponds to 00:00:00, while 0.99999 corresponds to 23:59:59. Mixed numbers show both date and time: the date serial number 2.5 corresponds to 1 Janu-ary 1900, 12.00 hours.
173
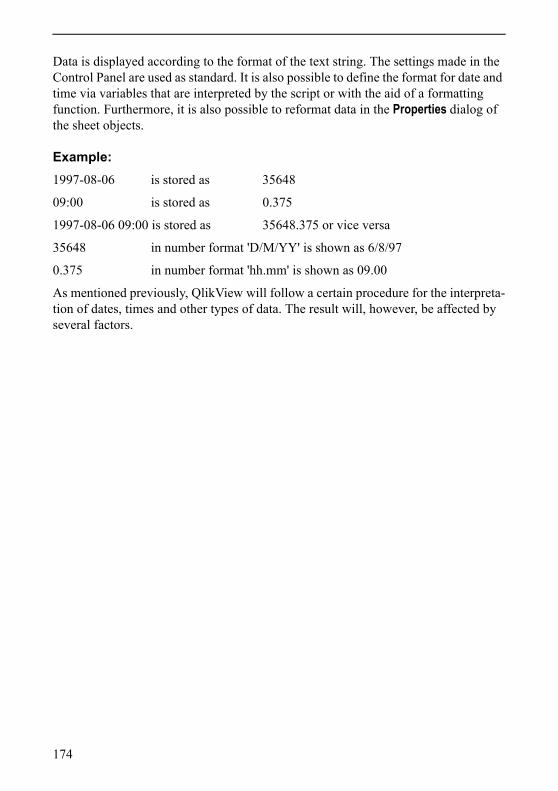
Data is displayed according to the format of the text string. The settings made in the Control Panel are used as standard. It is also possible to define the format for date and time via variables that are interpreted by the script or with the aid of a formatting function. Furthermore, it is also possible to reformat data in the Properties dialog of the sheet objects.
Example:1997-08-06 is stored as 35648
09:00 is stored as 0.375
1997-08-06 09:00 is stored as 35648.375 or vice versa
35648 in number format 'D/M/YY' is shown as 6/8/97
0.375 in number format 'hh.mm' is shown as 09.00
As mentioned previously, QlikView will follow a certain procedure for the interpreta-tion of dates, times and other types of data. The result will, however, be affected by several factors.
174
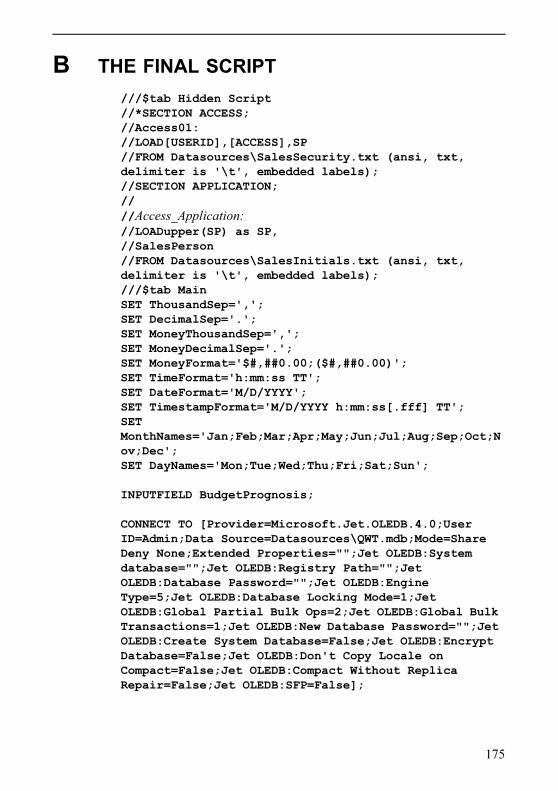
B THE FINAL SCRIPT///$tab Hidden Script //*SECTION ACCESS; //Access01: //LOAD[USERID],[ACCESS],SP //FROM Datasources\SalesSecurity.txt (ansi, txt, delimiter is '\t', embedded labels); //SECTION APPLICATION; // //Access_Application: //LOADupper(SP) as SP, //SalesPerson //FROM Datasources\SalesInitials.txt (ansi, txt, delimiter is '\t', embedded labels); ///$tab Main SET ThousandSep=','; SET DecimalSep='.'; SET MoneyThousandSep=','; SET MoneyDecimalSep='.'; SET MoneyFormat='$#,##0.00;($#,##0.00)'; SET TimeFormat='h:mm:ss TT'; SET DateFormat='M/D/YYYY'; SET TimestampFormat='M/D/YYYY h:mm:ss[.fff] TT'; SET MonthNames='Jan;Feb;Mar;Apr;May;Jun;Jul;Aug;Sep;Oct;Nov;Dec'; SET DayNames='Mon;Tue;Wed;Thu;Fri;Sat;Sun'; INPUTFIELD BudgetPrognosis; CONNECT TO [Provider=Microsoft.Jet.OLEDB.4.0;User ID=Admin;Data Source=Datasources\QWT.mdb;Mode=Share Deny None;Extended Properties="";Jet OLEDB:System database="";Jet OLEDB:Registry Path="";Jet OLEDB:Database Password="";Jet OLEDB:Engine Type=5;Jet OLEDB:Database Locking Mode=1;Jet OLEDB:Global Partial Bulk Ops=2;Jet OLEDB:Global Bulk Transactions=1;Jet OLEDB:New Database Password="";Jet OLEDB:Create System Database=False;Jet OLEDB:Encrypt Database=False;Jet OLEDB:Don't Copy Locale on Compact=False;Jet OLEDB:Compact Without Replica Repair=False;Jet OLEDB:SFP=False];
175
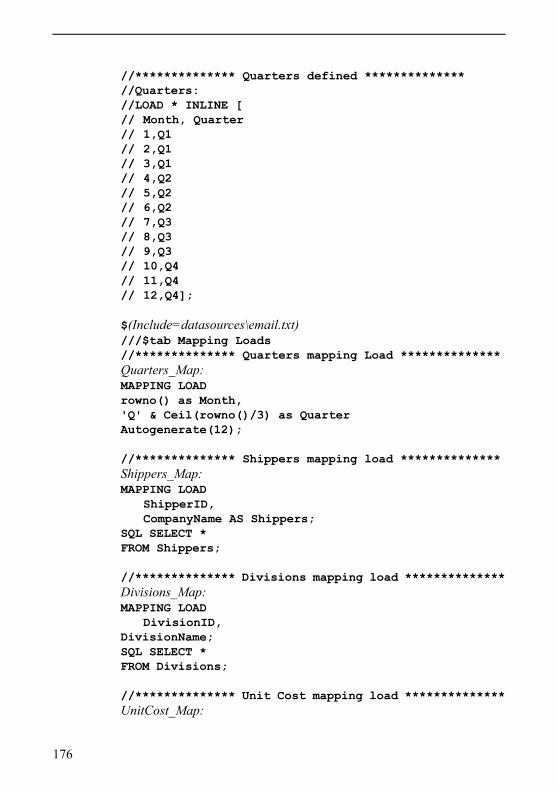
//************** Quarters defined ************** //Quarters: //LOAD * INLINE [ // Month, Quarter // 1,Q1 // 2,Q1 // 3,Q1 // 4,Q2 // 5,Q2 // 6,Q2 // 7,Q3 // 8,Q3 // 9,Q3 // 10,Q4 // 11,Q4 // 12,Q4]; $(Include=datasources\email.txt) ///$tab Mapping Loads //************** Quarters mapping Load ************** Quarters_Map: MAPPING LOAD rowno() as Month, 'Q' & Ceil(rowno()/3) as Quarter Autogenerate(12); //************** Shippers mapping load ************** Shippers_Map: MAPPING LOAD
ShipperID, CompanyName AS Shippers;
SQL SELECT * FROM Shippers; //************** Divisions mapping load ************** Divisions_Map: MAPPING LOAD
DivisionID, DivisionName; SQL SELECT * FROM Divisions; //************** Unit Cost mapping load ************** UnitCost_Map:
176
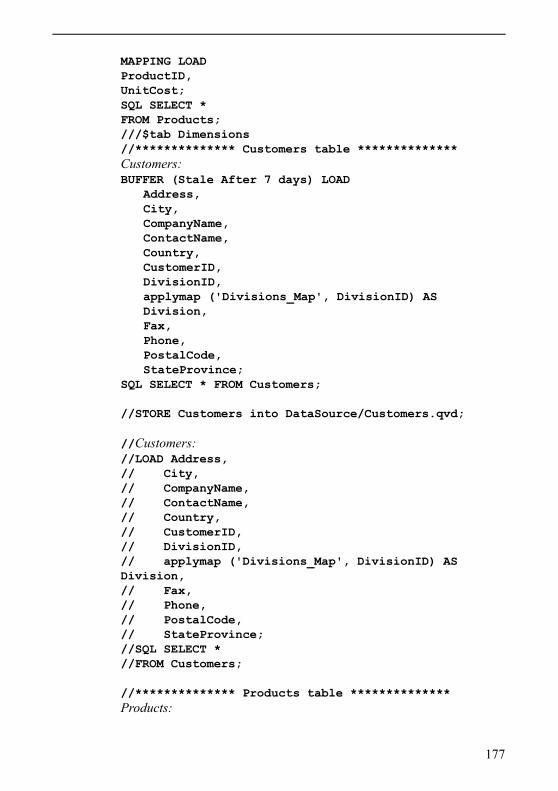
MAPPING LOAD ProductID, UnitCost; SQL SELECT * FROM Products; ///$tab Dimensions //************** Customers table ************** Customers: BUFFER (Stale After 7 days) LOAD
Address, City, CompanyName, ContactName, Country, CustomerID, DivisionID, applymap ('Divisions_Map', DivisionID) AS Division, Fax, Phone, PostalCode, StateProvince;
SQL SELECT * FROM Customers; //STORE Customers into DataSource/Customers.qvd; //Customers: //LOAD Address, // City, // CompanyName, // ContactName, // Country, // CustomerID, // DivisionID, // applymap ('Divisions_Map', DivisionID) AS Division, // Fax, // Phone, // PostalCode, // StateProvince; //SQL SELECT * //FROM Customers; //************** Products table ************** Products:
177
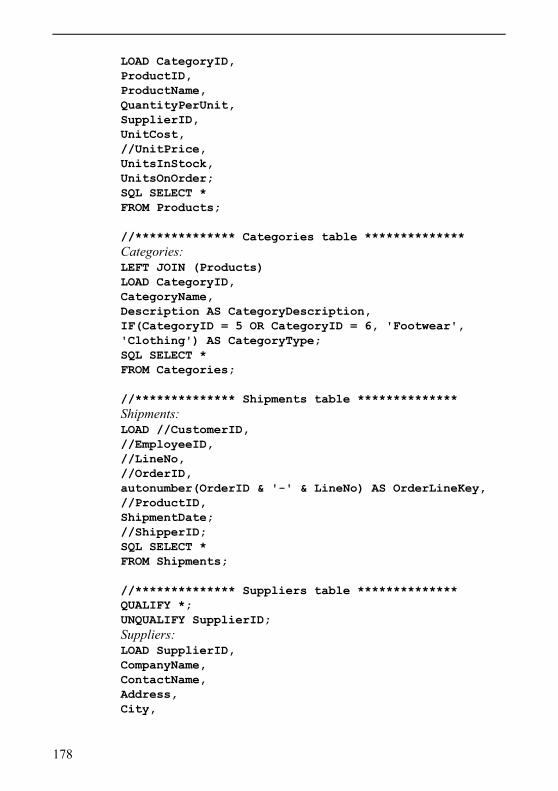
LOAD CategoryID, ProductID, ProductName, QuantityPerUnit, SupplierID, UnitCost, //UnitPrice, UnitsInStock, UnitsOnOrder; SQL SELECT * FROM Products; //************** Categories table ************** Categories: LEFT JOIN (Products) LOAD CategoryID, CategoryName, Description AS CategoryDescription, IF(CategoryID = 5 OR CategoryID = 6, 'Footwear', 'Clothing') AS CategoryType; SQL SELECT * FROM Categories; //************** Shipments table ************** Shipments: LOAD //CustomerID, //EmployeeID, //LineNo, //OrderID, autonumber(OrderID & '-' & LineNo) AS OrderLineKey, //ProductID, ShipmentDate; //ShipperID; SQL SELECT * FROM Shipments; //************** Suppliers table ************** QUALIFY *; UNQUALIFY SupplierID; Suppliers: LOAD SupplierID, CompanyName, ContactName, Address, City,
178
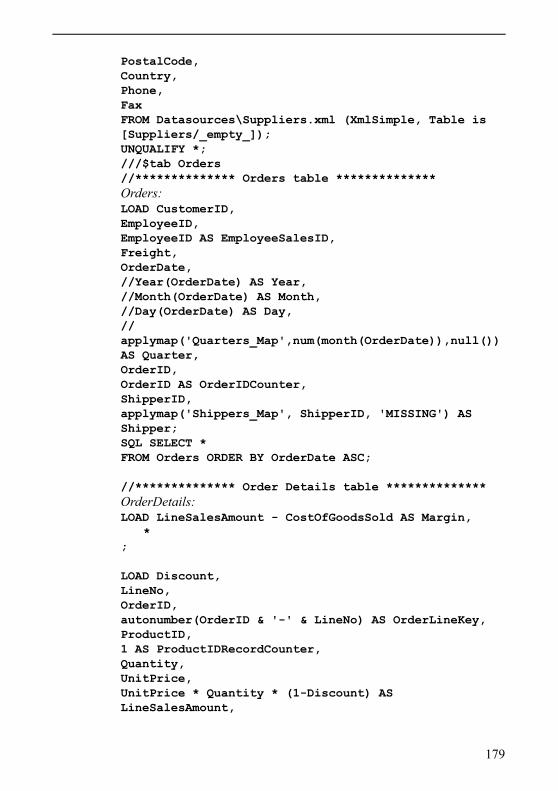
PostalCode, Country, Phone, Fax FROM Datasources\Suppliers.xml (XmlSimple, Table is [Suppliers/_empty_]); UNQUALIFY *; ///$tab Orders //************** Orders table ************** Orders: LOAD CustomerID, EmployeeID, EmployeeID AS EmployeeSalesID, Freight, OrderDate, //Year(OrderDate) AS Year, //Month(OrderDate) AS Month, //Day(OrderDate) AS Day, //applymap('Quarters_Map',num(month(OrderDate)),null()) AS Quarter, OrderID, OrderID AS OrderIDCounter, ShipperID, applymap('Shippers_Map', ShipperID, 'MISSING') AS Shipper; SQL SELECT * FROM Orders ORDER BY OrderDate ASC; //************** Order Details table ************** OrderDetails: LOAD LineSalesAmount - CostOfGoodsSold AS Margin,
* ; LOAD Discount, LineNo, OrderID, autonumber(OrderID & '-' & LineNo) AS OrderLineKey, ProductID, 1 AS ProductIDRecordCounter, Quantity, UnitPrice, UnitPrice * Quantity * (1-Discount) AS LineSalesAmount,
179
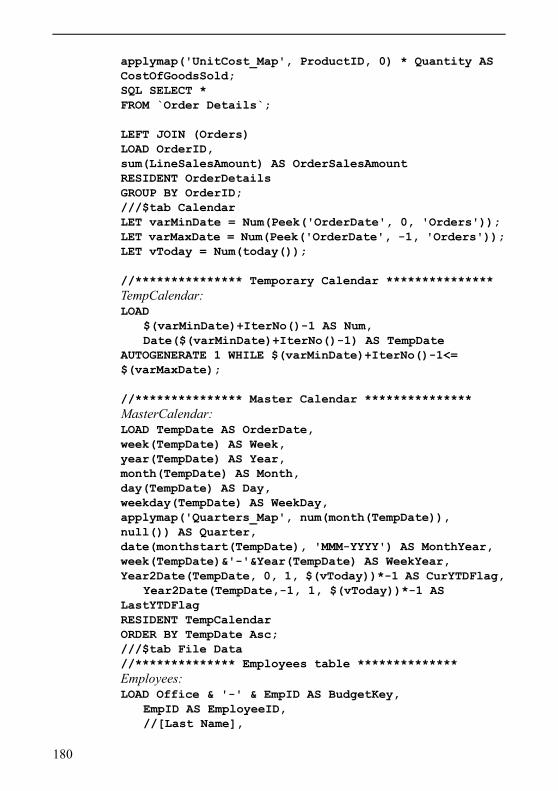
applymap('UnitCost_Map', ProductID, 0) * Quantity AS CostOfGoodsSold; SQL SELECT * FROM `Order Details`; LEFT JOIN (Orders) LOAD OrderID, sum(LineSalesAmount) AS OrderSalesAmount RESIDENT OrderDetails GROUP BY OrderID; ///$tab Calendar LET varMinDate = Num(Peek('OrderDate', 0, 'Orders')); LET varMaxDate = Num(Peek('OrderDate', -1, 'Orders')); LET vToday = Num(today()); //*************** Temporary Calendar *************** TempCalendar: LOAD
$(varMinDate)+IterNo()-1 AS Num, Date($(varMinDate)+IterNo()-1) AS TempDate
AUTOGENERATE 1 WHILE $(varMinDate)+IterNo()-1<= $(varMaxDate); //*************** Master Calendar *************** MasterCalendar: LOAD TempDate AS OrderDate, week(TempDate) AS Week, year(TempDate) AS Year, month(TempDate) AS Month, day(TempDate) AS Day, weekday(TempDate) AS WeekDay, applymap('Quarters_Map', num(month(TempDate)), null()) AS Quarter, date(monthstart(TempDate), 'MMM-YYYY') AS MonthYear, week(TempDate)&'-'&Year(TempDate) AS WeekYear, Year2Date(TempDate, 0, 1, $(vToday))*-1 AS CurYTDFlag,
Year2Date(TempDate,-1, 1, $(vToday))*-1 AS LastYTDFlag RESIDENT TempCalendar ORDER BY TempDate Asc; ///$tab File Data //************** Employees table ************** Employees: LOAD Office & '-' & EmpID AS BudgetKey,
EmpID AS EmployeeID, //[Last Name],
180
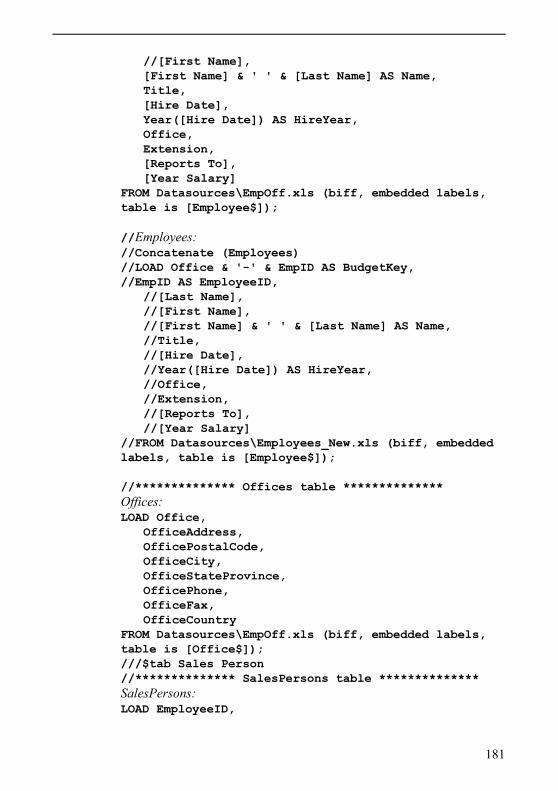
//[First Name], [First Name] & ' ' & [Last Name] AS Name, Title, [Hire Date], Year([Hire Date]) AS HireYear, Office, Extension, [Reports To], [Year Salary]
FROM Datasources\EmpOff.xls (biff, embedded labels, table is [Employee$]); //Employees: //Concatenate (Employees) //LOAD Office & '-' & EmpID AS BudgetKey, //EmpID AS EmployeeID,
//[Last Name], //[First Name], //[First Name] & ' ' & [Last Name] AS Name, //Title, //[Hire Date], //Year([Hire Date]) AS HireYear, //Office, //Extension, //[Reports To], //[Year Salary]
//FROM Datasources\Employees_New.xls (biff, embedded labels, table is [Employee$]); //************** Offices table ************** Offices: LOAD Office,
OfficeAddress, OfficePostalCode, OfficeCity, OfficeStateProvince, OfficePhone, OfficeFax, OfficeCountry
FROM Datasources\EmpOff.xls (biff, embedded labels, table is [Office$]); ///$tab Sales Person //************** SalesPersons table ************** SalesPersons: LOAD EmployeeID,
181
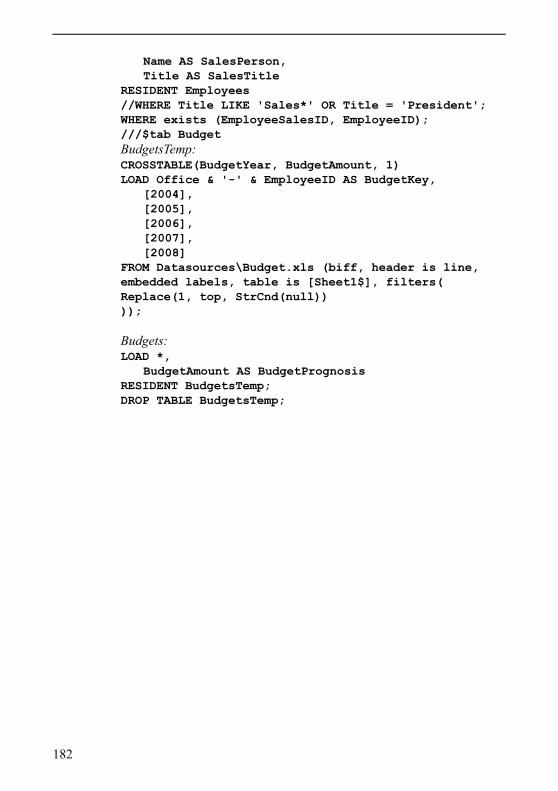
Name AS SalesPerson, Title AS SalesTitle
RESIDENT Employees //WHERE Title LIKE 'Sales*' OR Title = 'President'; WHERE exists (EmployeeSalesID, EmployeeID); ///$tab Budget BudgetsTemp: CROSSTABLE(BudgetYear, BudgetAmount, 1) LOAD Office & '-' & EmployeeID AS BudgetKey,
[2004], [2005], [2006], [2007], [2008]
FROM Datasources\Budget.xls (biff, header is line, embedded labels, table is [Sheet1$], filters( Replace(1, top, StrCnd(null)) )); Budgets: LOAD *,
BudgetAmount AS BudgetPrognosis RESIDENT BudgetsTemp; DROP TABLE BudgetsTemp;
182


