Quality is the suitability of either a drug substance or drug product for its intended use. This term includes attributes such as the identity, safety, strength, and purity.
Quality by design (QbD) is a systematic approach to development that begins with predefined objectives and emphasizes product and process understanding and process control, based on sound science and quality risk management.
ABSTRACT
Aim: The purpose of research work was to develop suitable UV spectrophotometric method of Secnidazole, study the risk assessment associated critical quality attributes (CQA), apply quality by design (QbD) principles to develop reverse phase high performance liquid chromatography (RP-HPLC) method for Secnidazole, and explore the applicability of the method for routine analysis of Secnidazole in tablet dosage form. Materials and Methods: RP-HPLC method was developed by implementing QbD methodology with mobile phase methanol:water (70:30% v/v). The flow rate used was 1.0 ml/min and UV detection was carried out at 310 nm. The retention time for Secnidazole was found to be 3.21 min. The study was done using Box-Behnken response surface design. In this study, interaction of three factors; mobile phase concentration, flow rate, and wavelength, varies at three levels. Effect of such critical process parameter on CQA of the method was studied. Responses in terms of retention times and number of theoretical plates and asymmetry factor (tailing factor) were evaluated throughout all the runs in design. The QbD approach has been successfully used to develop HPLC method for Secnidazole. Results: From the results of validation parameters, we concluded that the method is accurate, precise, simple, and robust. From the results of percentage recovery, we concluded that the method developed is useful for the estimation of the Secnidazole in marketed formulation. Moreover, the lower solvent consumption along with the short analytical run time of 7 min leads to a cost-effective and environment-friendly chromatographic procedure. Conclusion: Thus, the proposed methodology is rapid, selective, requires a simple sample preparation procedure, and represents a good procedure for the estimation of Secnidazole.
Keywords: Spectrophotometric, Box-Behnken, quality by design methodology, environment-friendly chromatographic
Quality by design approach to method development and validation of Secnidazole
This is an open access journal, and articles are distributed under the terms of the Creative Commons Attribution NonCommercial Share Alike 4.0 License, which allows others to remix, tweak, and build upon the work non-commercially, as long as appropriate credit is given and the new creations are licensed under the identical terms.
Department of Pharmaceutical Analysis, Shri Bhagwan College of Pharmacy, Aurangabad, Maharashtra, India
Correspondence: Vijayalaxmi Chavan, Department of Pharmaceutical Analysis, Shri Bhagwan College of Pharmacy, Aurangabad, Maharashtra, India. E-mail: [email protected]
How to cite this article: Korade K, Dharbale N, Chavan V. Quality by design approach to method development and validation of Secnidazole. Innov Pharm Pharmacother 2019;7(2):45-60.
Source of Support: Nil Conflicts of Interest: None declared.
Secnidazole is effective medicine to treat infections caused by protozoa. It is used to treat infections of the stomach intestine, the development and manufacture of pharmaceuticals. Secnidazole is the second-generation 5-nitroimidazole antimicrobial that is structurally related to nitroimidazoles including metronidazole and tinidazole but displays improved oral absorption and longer terminal elimination half-life than urinary tract and genital area.
High performance liquid chromatography (HPLC) is recently used techniques for quantitative and qualitative analysis. HPLC technique required very less time for analysis and required less quantity of sample. It is intended to establish the purity, potency, and identity of the drug.
QbD eliminates batch failures, it minimizes deviations and costly investigations, it also avoids regulatory compliance problems, and it is a better development decision and empowerment of technical staff.[1,2]
Original Article
Korade, et al. QbD approach and validation of Secnidazole
46 47Innovations in Pharmaceuticals and Pharmacotherapy | Apr-Jun 2019 | Vol 7 | Issue 2 Innovations in Pharmaceuticals and Pharmacotherapy | Apr-Jun 2019 | Vol 7 | Issue 2
The parameters for method validation as defined by the International Conference on Harmonization (ICH) guidelines are summarized as follows:
Accuracy, precision, specificity, limit of detection (LOD), limit of quantitation (LOQ), linearity, range, robustness, and ruggedness.[3-5]
Materials and Methods
Secnidazole (API) was procured from Ajanta Pharma Limited, Aurangabad; HPLC grade acetonitrile, methanol, and potassium dihydrogen phosphate buffer of Merck were used. All aqueous solutions were prepared with HPLC grade ready water obtained in-house Milli-Q water purification system (Millipore, USA), methanol and water (HPLC grade) were procured from Thermo Fischer Scientific which was used. Instrument: UV-visible double beam spectrophotometer Lab India.
Preliminary characterization identification of drug
Color, odor, and appearanceSecnidazole is evaluated for various pre-formulation parameters such as color, odor, and appearance and confirmed that they complied with official standards. Melting point of the Secnidazole was determined by open capillary method and compared with standard literature values and the reference melting point for Secnidazole is 174°C–176°C.
The IR spectrum of Secnidazole is recorded in the range of 400–4000 cm using Bruker’s instrument from UDCT DR. BAMU Aurangabad. The spectrum obtained was evaluated for different frequencies corresponding to functional group present.
Determination of solubilityThe solubility of Secnidazole is determined in methanol:water.
Experimental work
Preparation of the standard stock solutionStock solution was prepared, by dissolving 10 mg of Secnidazole were accurately weighed and transferred into 100 ml volumetric flask, about 70 ml methanol was added to flask and sonicated for 15 min to dissolve and degassing, diluted up to the mark with distilled water to obtain 100 μg/ml concentration of Secnidazole. Using this stock solution, various working standards were prepared by serial dilution with the mobile phase mixture to obtain the concentrations as per the need. The prepared serial dilutions of the drug were filtered through a 0.22 μm syringe filter and subjected to chromatographic analysis for preparing the calibration plot. Standard solution was scanned between 400 nm and 200 nm. By appropriate dilution of the standard solution of Secnidazole to 10 μg/ml was prepared and scanned for wavelength region in the spectrum mode and peak observed at 310 nm, was selected for the estimation of drugs.
Reverse phase (RP)-HPLC method development
Preliminary studiesInitially, the mobile phase composition of methanol:water 50:50 was selected for RP-HPLC trial runs. The separation carried out on C18
stationary phase (46 × 250 mm, 5 μ particle size). The results obtained were evaluated for retention time, peak area, number of theoretical plates, and tailing factor.
Another trial run was executed with composition of methanol:water in the ratio of 70:30 at flow rate of 1 ml/min. The detector was set at 310 nm. The chromatogram obtained was evaluated for retention time, peak area, number of theoretical plates, and tailing factor. Preliminary condition for RP-HPLC method development is shown in Table 1.
All reagents and chemicals used to their HPLC, and hence, further characterization was performed.
Validation according to ICH guidelines
LinearityFor quantitative analysis of Secnidazole, the calibration curves were plotted for each concentration range. The linearity ranges from 10–60 μg/ml.
LOD and LOQThe LOD and LOQ of TBL by the proposed methods were determined using calibration standards. LOD and LOQ values were calculated as 3.3 σ/S and 10 σ/S, respectively, where S is the slope of the calibration curve and σ is the standard deviation of y-intercept.
Method development for HPLC
HPLC analysis was carried out using a Thermo Fisher Scientific HPLC chromatograph equipped with an LC20 AT isocratic delivery system (pump), SPD-10Avp detector; the analytical column was C-18 column (3.9 × 300 mm, 10 μm particle size).
For mobile phase preparation, potassium dihydrogen phosphate buffer of 0.02 M solution was prepared by dissolving 1.3609 g of potassium dihydrogen phosphate and dilute with water (HPLC grade) to produce 500 ml. Then, check the pH for 5 min with pH meter, before this wash the electrode with 3–4 drops of 3 M KCL containing DM water. Adjust the pH 4.0 with phosphoric acid. Buffer solution was degassed with
Table 1: Preliminary condition for RP‑HPLC method development
Parameters Condition
Flow rate 1.0 ml/min
Wavelength 310 nm
Injection volume 10 µl
Run time 7.0 min
Mobile phase Methanol:water (70:30)
Column oven temperature 30°C
Korade, et al. QbD approach and validation of Secnidazole
46 47Innovations in Pharmaceuticals and Pharmacotherapy | Apr-Jun 2019 | Vol 7 | Issue 2 Innovations in Pharmaceuticals and Pharmacotherapy | Apr-Jun 2019 | Vol 7 | Issue 2
sonicator and filtered before use for HPLC analysis. Dissolve 70% of methanol solution in 30% of distilled water to produce mobile phase of methanol:water having a concentration of 70:30 v/v.
Secnidazole stock solution for optimization of experiments was prepared by accurately weighing 10 mg of Secnidazole in 100 ml volume makeup by mobile phase. Appropriate dilutions of Secnidazole were prepared and samples were scanned using UV spectrometer in the range of 200 nm–400 nm. An absorbance maximum was obtained at 310 nm.
Precision of injection volumeIt was determined by comparing peak area received with fixed 20 μl injection and calibrated dosage loop tolerance limit set was <1% relative standard deviation (RSD).
Injection carryoverInjection carryover was determined by running a blank test directly after an analysis and measuring possible absorption; there should not be any peak from the previous analysis.
Flow rate accuracyIt was determined by measuring the volumetric flow rate of mobile phase through the column over a previously set period of time 1.0 ml/min for 10 min, 2.0 ml/min for 5 min, and 2.5 ml/min for 10 min. RSD should be <1% or tolerance limit is ±3%.
Flow rate precisionA flow rate precision was determined by measuring the RSD of retention times. Limit set was <1.0% RSD.
Wavelength accuracyIt was done by scanning the compound with known specific maxima. Tolerance limit is specific maxima ±2 nm.
Linearity of detectorLinearity of detector was determined by injecting increasing concentration of test substance and tolerance limit set was R2 ≥0.999.
Risk assessment
Risk assessment helps to increase quality of method or process. Furthermore, it is determined for the effect of input variable on method or process. From risk assessment, one can recognize critical attributes that are going to affect final quality of product.
Method design
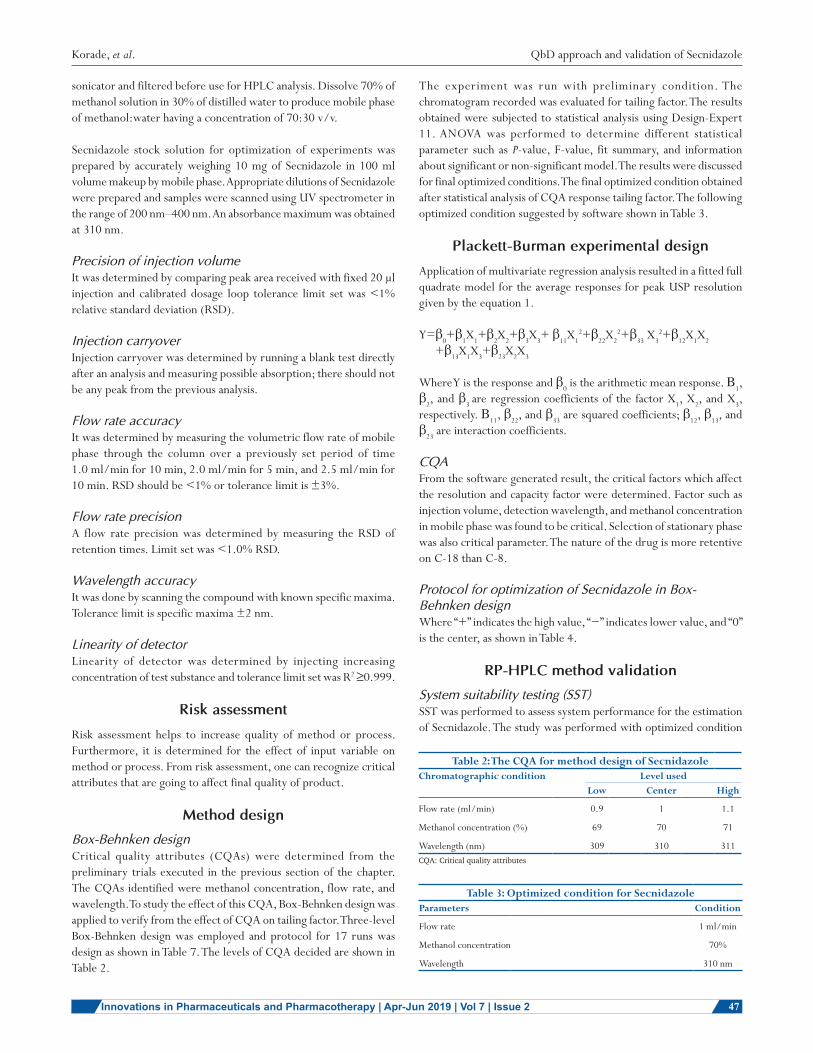
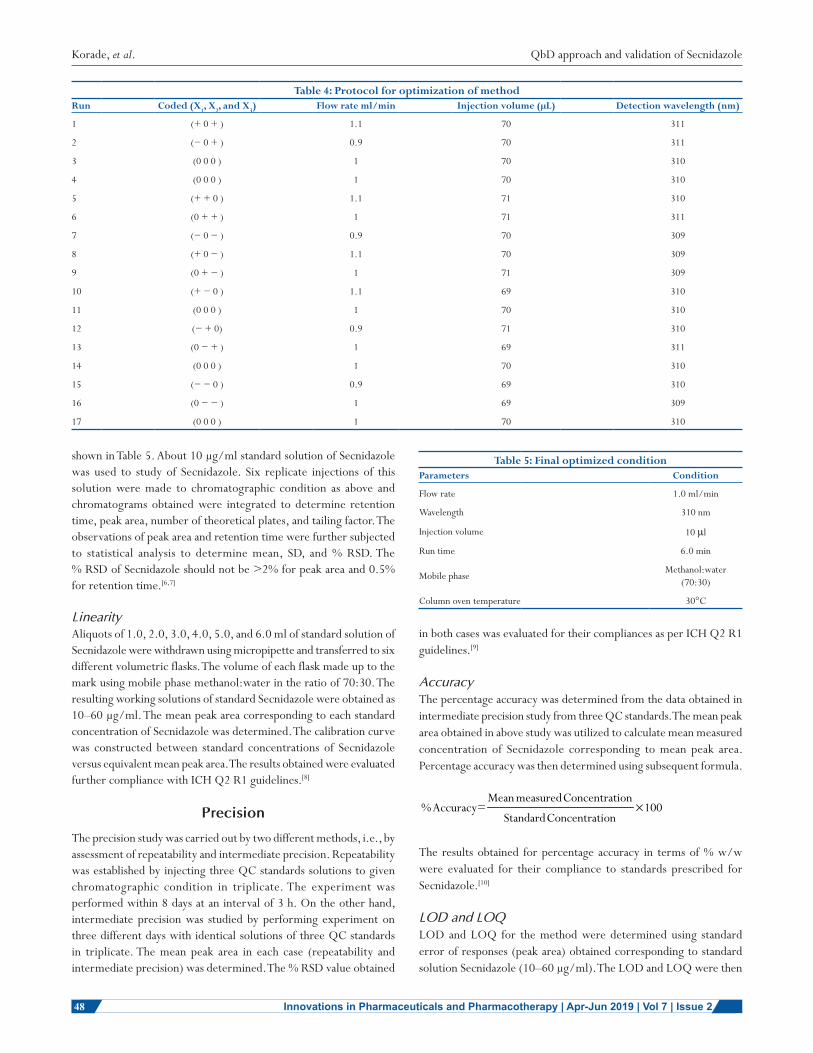
Box-Behnken designCritical quality attributes (CQAs) were determined from the preliminary trials executed in the previous section of the chapter. The CQAs identified were methanol concentration, flow rate, and wavelength. To study the effect of this CQA, Box-Behnken design was applied to verify from the effect of CQA on tailing factor. Three-level Box-Behnken design was employed and protocol for 17 runs was design as shown in Table 7. The levels of CQA decided are shown in Table 2.
The experiment was run with preliminary condition. The chromatogram recorded was evaluated for tailing factor. The results obtained were subjected to statistical analysis using Design-Expert 11. ANOVA was performed to determine different statistical parameter such as P-value, F-value, fit summary, and information about significant or non-significant model. The results were discussed for final optimized conditions. The final optimized condition obtained after statistical analysis of CQA response tailing factor. The following optimized condition suggested by software shown in Table 3.
Plackett-Burman experimental design
Application of multivariate regression analysis resulted in a fitted full quadrate model for the average responses for peak USP resolution given by the equation 1.
Y= β0+β1X1+β2X2+β3X3+ β11X12+β22X2
2+β33 X32+β12X1X2
+β13X1X3+β23X2X3
Where Y is the response and β0 is the arithmetic mean response. Β1, β2, and β3 are regression coefficients of the factor X1, X2, and X3, respectively. Β11, β22, and β33 are squared coefficients; β12, β13, and β23 are interaction coefficients.
CQAFrom the software generated result, the critical factors which affect the resolution and capacity factor were determined. Factor such as injection volume, detection wavelength, and methanol concentration in mobile phase was found to be critical. Selection of stationary phase was also critical parameter. The nature of the drug is more retentive on C-18 than C-8.
Protocol for optimization of Secnidazole in Box-Behnken designWhere “+” indicates the high value, “−” indicates lower value, and “0” is the center, as shown in Table 4.
RP-HPLC method validation
System suitability testing (SST)SST was performed to assess system performance for the estimation of Secnidazole. The study was performed with optimized condition
Table 2: The CQA for method design of SecnidazoleChromatographic condition Level used
Table 3: Optimized condition for SecnidazoleParameters Condition
Flow rate 1 ml/min
Methanol concentration 70%
Wavelength 310 nm
Korade, et al. QbD approach and validation of Secnidazole
48 49Innovations in Pharmaceuticals and Pharmacotherapy | Apr-Jun 2019 | Vol 7 | Issue 2 Innovations in Pharmaceuticals and Pharmacotherapy | Apr-Jun 2019 | Vol 7 | Issue 2
shown in Table 5. About 10 μg/ml standard solution of Secnidazole was used to study of Secnidazole. Six replicate injections of this solution were made to chromatographic condition as above and chromatograms obtained were integrated to determine retention time, peak area, number of theoretical plates, and tailing factor. The observations of peak area and retention time were further subjected to statistical analysis to determine mean, SD, and % RSD. The % RSD of Secnidazole should not be >2% for peak area and 0.5% for retention time.[6,7]
LinearityAliquots of 1.0, 2.0, 3.0, 4.0, 5.0, and 6.0 ml of standard solution of Secnidazole were withdrawn using micropipette and transferred to six different volumetric flasks. The volume of each flask made up to the mark using mobile phase methanol:water in the ratio of 70:30. The resulting working solutions of standard Secnidazole were obtained as 10–60 μg/ml. The mean peak area corresponding to each standard concentration of Secnidazole was determined. The calibration curve was constructed between standard concentrations of Secnidazole versus equivalent mean peak area. The results obtained were evaluated further compliance with ICH Q2 R1 guidelines.[8]
Precision
The precision study was carried out by two different methods, i.e., by assessment of repeatability and intermediate precision. Repeatability was established by injecting three QC standards solutions to given chromatographic condition in triplicate. The experiment was performed within 8 days at an interval of 3 h. On the other hand, intermediate precision was studied by performing experiment on three different days with identical solutions of three QC standards in triplicate. The mean peak area in each case (repeatability and intermediate precision) was determined. The % RSD value obtained
in both cases was evaluated for their compliances as per ICH Q2 R1 guidelines.[9]
AccuracyThe percentage accuracy was determined from the data obtained in intermediate precision study from three QC standards. The mean peak area obtained in above study was utilized to calculate mean measured concentration of Secnidazole corresponding to mean peak area. Percentage accuracy was then determined using subsequent formula.
Mean measuredConcentration%Accuracy= 100
StandardConcentration×
The results obtained for percentage accuracy in terms of % w/w were evaluated for their compliance to standards prescribed for Secnidazole.[10]
LOD and LOQLOD and LOQ for the method were determined using standard error of responses (peak area) obtained corresponding to standard solution Secnidazole (10–60 μg/ml). The LOD and LOQ were then
Table 4: Protocol for optimization of methodRun Coded (X1, X2, and X3) Flow rate ml/min Injection volume (μL) Detection wavelength (nm)
1 (+ 0 + ) 1.1 70 311
2 (− 0 + ) 0.9 70 311
3 (0 0 0 ) 1 70 310
4 (0 0 0 ) 1 70 310
5 (+ + 0 ) 1.1 71 310
6 (0 + + ) 1 71 311
7 (− 0 − ) 0.9 70 309
8 (+ 0 − ) 1.1 70 309
9 (0 + − ) 1 71 309
10 (+ − 0 ) 1.1 69 310
11 (0 0 0 ) 1 70 310
12 (− + 0) 0.9 71 310
13 (0 − + ) 1 69 311
14 (0 0 0 ) 1 70 310
15 (− − 0 ) 0.9 69 310
16 (0 − − ) 1 69 309
17 (0 0 0 ) 1 70 310
Table 5: Final optimized conditionParameters Condition
Flow rate 1.0 ml/min
Wavelength 310 nm
Injection volume 10 µl
Run time 6.0 min
Mobile phaseMethanol:water
(70:30)
Column oven temperature 30°C
Korade, et al. QbD approach and validation of Secnidazole
48 49Innovations in Pharmaceuticals and Pharmacotherapy | Apr-Jun 2019 | Vol 7 | Issue 2 Innovations in Pharmaceuticals and Pharmacotherapy | Apr-Jun 2019 | Vol 7 | Issue 2
determined by putting the values of Steyx and slope in the following formulae:
3.3×STEYXLOD =
Slope
10×STEYXLOQ=
Slope
The results obtained were compared with the standard as per ICH Q2 R1 guideline for their compliance.[11,12]
% Recovery
Preparation of standard stock solution of SecnidazoleAbout 10 μg/ml standard solution of Secnidazole was prepared. The three 10 μg/ml solutions were kept in three different volumetric flasks and ultrasonicated for degassing.
Preparation of sample solution from dosage formTwenty tablets were weighed and average weight was determined (mg). Powder equivalent to 300 mg of Secnidazole was weighed and transferred to 100 ml volumetric flask containing few ml of mobile phase. The volume was made up to the mark to attained consequential standard solution of 100 μg/ml of Secnidazole. The solution was filtered through 0.45 μ filter paper to remove particular matter if any. The solution was further ultrasonicate for 30 min in three cycles each of 10 min.
Aliquot of 0.8, 1.0, and 1.2 ml of sample stock solution of Secnidazole was pipetted out and transferred to three different 10 ml of volumetric flask. The content of the flask was diluted to 10 ml to obtained resulting sample solution as 8, 10, and 12 μg/ml. The solution was further ultrasonicated for 30 min in three cycles each of 10 min. These three sample solutions prepared from dosage form represent three levels of recovery study, namely, 80, 100, and 120%.
Preparation of test solutionAbout 10 μg/ml standard working solution of Secnidazole was spiked into each of sample solution, i.e., 8, 10, and 12 μg/ml to obtained test solution at three levels, namely, 80, 100, and 120%. The test solution at these three levels was injected to given set of chromatographic condition in triplicate. The obtained chromatogram was integrated to determined total peak area. The peak area corresponding to standard concentration of Secnidazole (10 μg/ml) was deducted from the above total peak area to get area corresponding to sample concentration. Percentage recovery was calculated from sample area, standard area, sample concentration, standard concentration, and percentage assay using subsequential formula.
Standard concentrationSample area% Recovery % Assay
Sample area Standard concentration= × ×
The percentage recovery values obtained were evaluated for their compliance with prepared standard prescribed for Secnidazole. Furthermore, the sample area was put in regression equation to determine to corresponding mean measured concentration. The optimized chromatographic method was validated according to the ICH Q2 (R1) guidelines for suitability, linearity, precision, accuracy, and LOD.
System suitabilitySix replicate injections of the system standard solution were analyzed before sample analysis. The acceptance criteria for Secnidazole were <2% RSD for peak area, retention time, asymmetry USP resolution factor, and number of theoretical plates >2000 for all peaks.
LinearityStandard calibration curves were prepared with five different concentrations by making serial volume to volume dilution of stock solution with methanol, over the range of 10, 20, 30, 40, 50, 60, and 70 μg/ml. Three replicate injections of each concentration were made to determine the linearity of tulobuterol over the concentration range. Linear concentration curves of peak area versus drug concentration were plotted using linear least squares regression and evaluated for linearity.
PrecisionPrecision of the method was evaluated for Secnidazole drug substance by analyzing standard samples prepared daily from stock solution. Three replicates of each low (15 μg/ml), intermediate (35 μg/ml), and high (55 μg/ml) standard were analyzed daily over 3 days as a part of validation and quality control. An acceptance criterion for precision is that the RSD of the standards should not be more than 2.
LOD and LOQThe LOD and LOQ of Secnidazole by the proposed methods were determined using calibration standards. LOD and LOQ values were calculated as 3.3 σ/S and 10 σ/S, respectively, where S is the slope of the calibration curve and σ is the standard deviation of y-intercept.
% RecoveryFrom standard solution of Secnidazole takes 0.8 ml, 1 ml, and 1.2 ml solution in 10 ml methanol:water (70:30), respectively, to make the 8, 10, and 12 μg/ml solution of Secnidazole for 80%, 100%, and 120% recovery study, respectively.
Standard concentrationSample area% Recovery= × % Assay
Sample area Sample concentration×
The percentage recovery values obtained were evaluated for their compliance with prepared standard prescribed for Secnidazole. Furthermore, the sample area was put in regression equation to determine to corresponding mean measured concentration.
Korade, et al. QbD approach and validation of Secnidazole
50 51Innovations in Pharmaceuticals and Pharmacotherapy | Apr-Jun 2019 | Vol 7 | Issue 2 Innovations in Pharmaceuticals and Pharmacotherapy | Apr-Jun 2019 | Vol 7 | Issue 2
Results and Discussion
Preliminary characterization identification of drug
Color, odor, and appearanceThe results are shown in Table 6.
Melting point determination
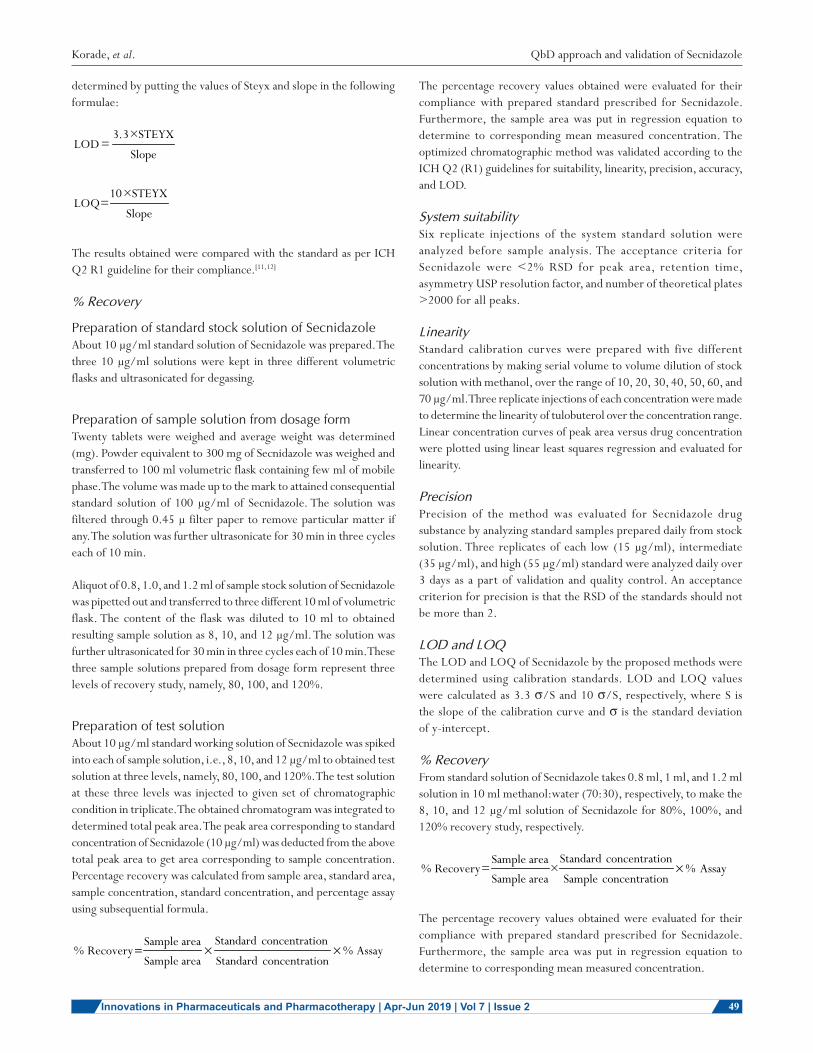
IR spectroscopic determination of SecnidazoleThe drug sample was subjected to IR analysis in the range of 400–4000 cm. The spectrum was obtained using Bruker IR instrument from Dr. BAMU Aurangabad. The IR spectrum is shown in Figure 1. The functional group corresponding to different wavenumbers whereas depicted in Table 8. The distinct peak corresponds to principle functional group such as amine (primary and secondary), hydroxyl, and amide was found in the spectrum; therefore, these confirmed the originality of the sample obtained. Therefore, it is concluded that the sample of Secnidazole is found to be pure.
UV Spectrometric determination of Secnidazole
Selection of sampling wavelength for analysis and preparation of standard calibration curveSolvent used: Methanol was used as solvent.
Preparation of standard stock solutionWeight accurately 10 mg of Secnidazole and transferred to 100 ml of volumetric flask and dissolve in 70 ml methanol and then make up the volume with distilled water up to 100 ml to obtain final concentration of 100 μg/ml.
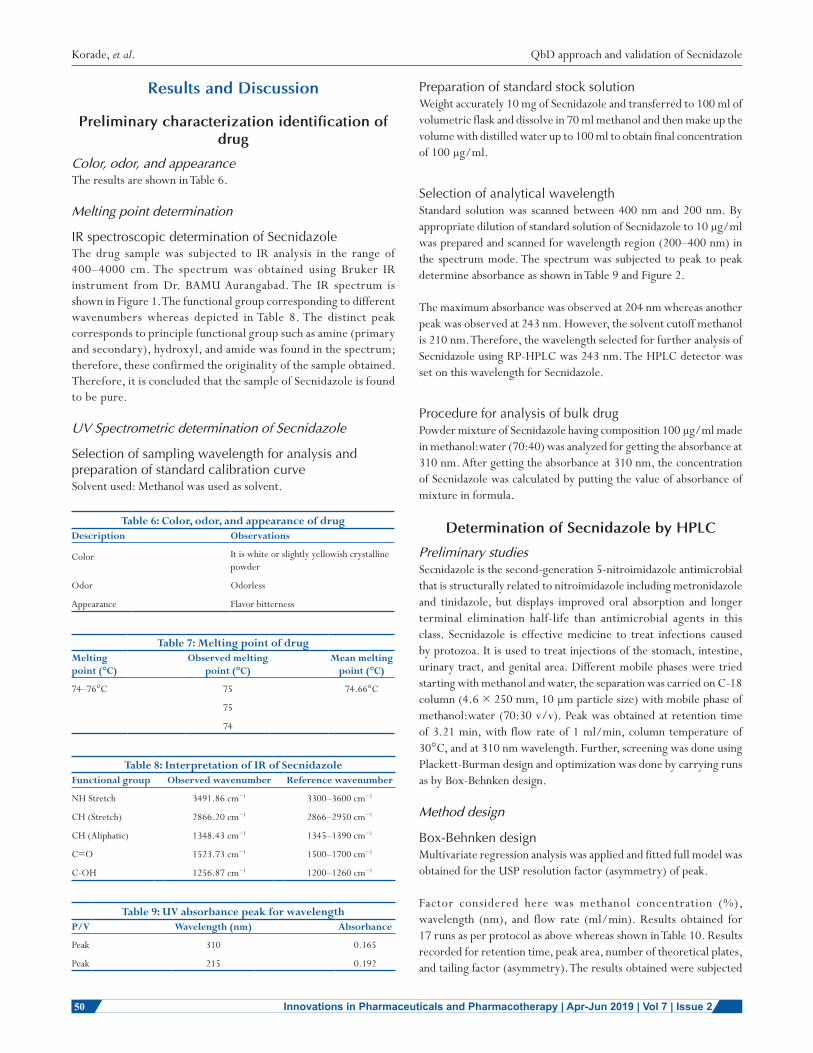
Selection of analytical wavelengthStandard solution was scanned between 400 nm and 200 nm. By appropriate dilution of standard solution of Secnidazole to 10 μg/ml was prepared and scanned for wavelength region (200–400 nm) in the spectrum mode. The spectrum was subjected to peak to peak determine absorbance as shown in Table 9 and Figure 2.
The maximum absorbance was observed at 204 nm whereas another peak was observed at 243 nm. However, the solvent cutoff methanol is 210 nm. Therefore, the wavelength selected for further analysis of Secnidazole using RP-HPLC was 243 nm. The HPLC detector was set on this wavelength for Secnidazole.
Procedure for analysis of bulk drugPowder mixture of Secnidazole having composition 100 μg/ml made in methanol:water (70:40) was analyzed for getting the absorbance at 310 nm. After getting the absorbance at 310 nm, the concentration of Secnidazole was calculated by putting the value of absorbance of mixture in formula.
Determination of Secnidazole by HPLC
Preliminary studiesSecnidazole is the second-generation 5-nitroimidazole antimicrobial that is structurally related to nitroimidazole including metronidazole and tinidazole, but displays improved oral absorption and longer terminal elimination half-life than antimicrobial agents in this class. Secnidazole is effective medicine to treat infections caused by protozoa. It is used to treat injections of the stomach, intestine, urinary tract, and genital area. Different mobile phases were tried starting with methanol and water, the separation was carried on C-18 column (4.6 × 250 mm, 10 μm particle size) with mobile phase of methanol:water (70:30 v/v). Peak was obtained at retention time of 3.21 min, with flow rate of 1 ml/min, column temperature of 30°C, and at 310 nm wavelength. Further, screening was done using Plackett-Burman design and optimization was done by carrying runs as by Box-Behnken design.
Method design
Box-Behnken designMultivariate regression analysis was applied and fitted full model was obtained for the USP resolution factor (asymmetry) of peak.
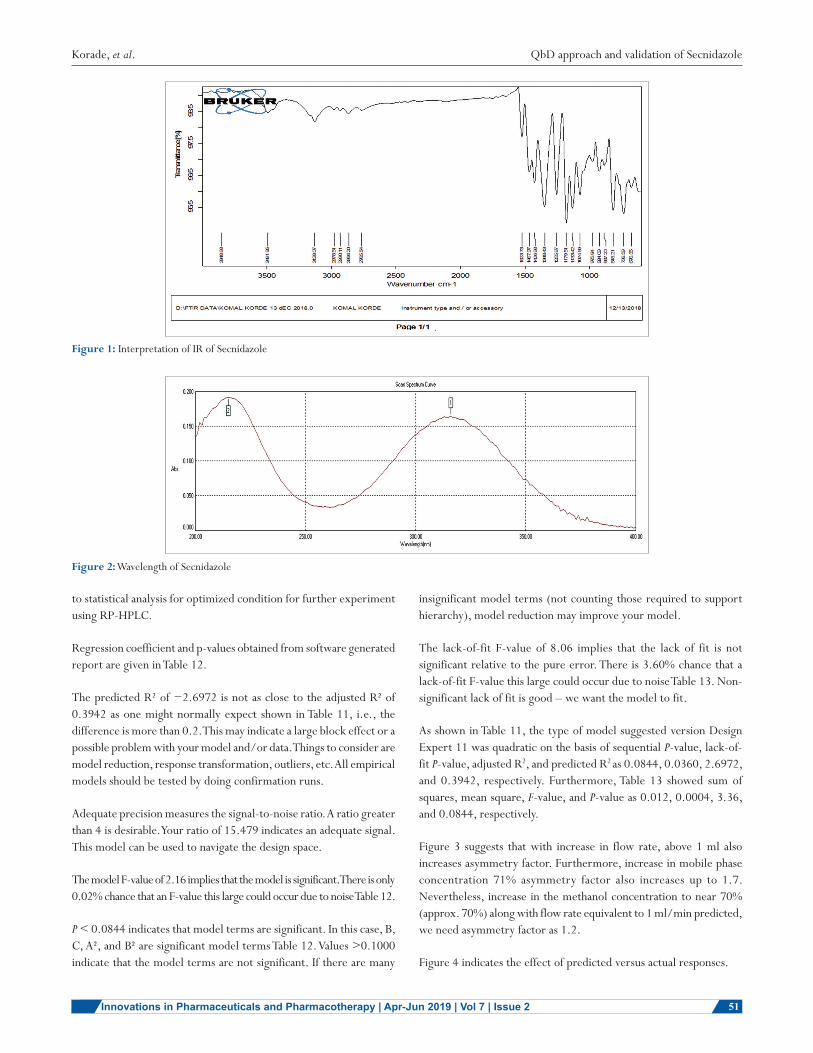
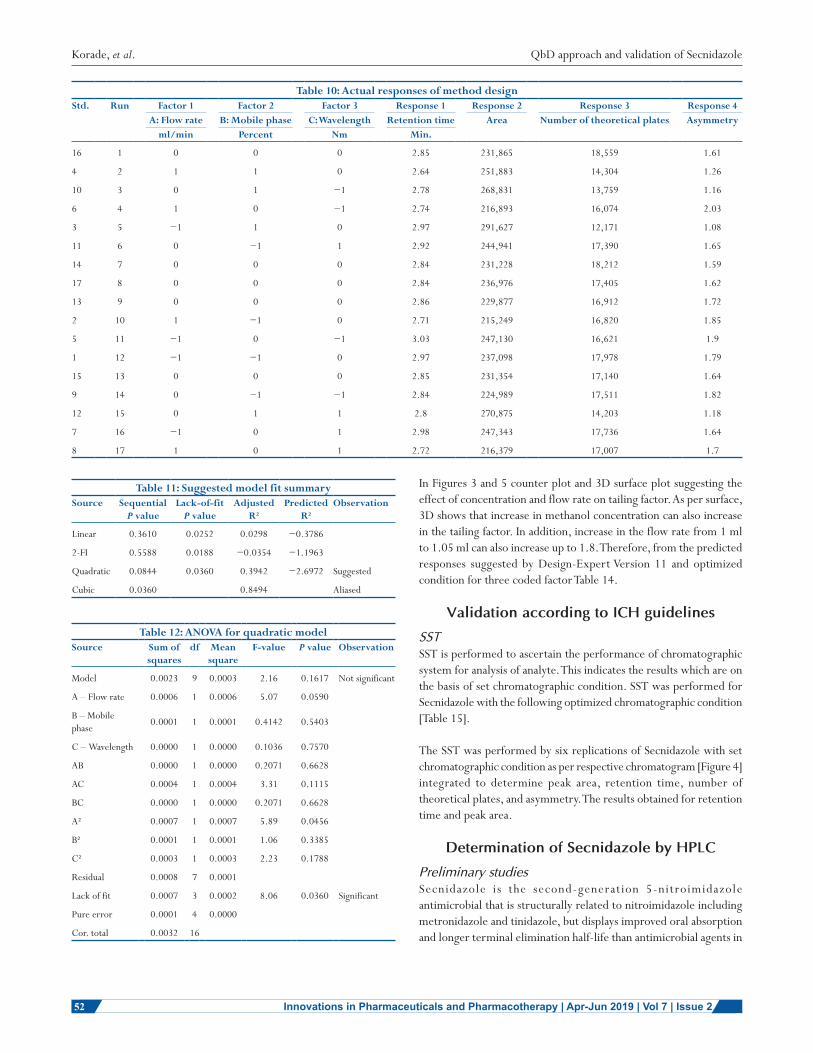
Factor considered here was methanol concentration (%), wavelength (nm), and flow rate (ml/min). Results obtained for 17 runs as per protocol as above whereas shown in Table 10. Results recorded for retention time, peak area, number of theoretical plates, and tailing factor (asymmetry). The results obtained were subjected
Table 6: Color, odor, and appearance of drugDescription Observations
Color It is white or slightly yellowish crystalline powder
Odor Odorless
Appearance Flavor bitterness
Table 7: Melting point of drugMelting point (°C)
Observed melting point (°C)
Mean melting point (°C)
74–76°C 75 74.66°C
75
74
Table 8: Interpretation of IR of SecnidazoleFunctional group Observed wavenumber Reference wavenumber
NH Stretch 3491.86 cm−1 3300–3600 cm−1
CH (Stretch) 2866.20 cm−1 2866–2950 cm−1
CH (Aliphatic) 1348.43 cm−1 1345–1390 cm−1
C=O 1523.73 cm−1 1500–1700 cm−1
C-OH 1256.87 cm−1 1200–1260 cm−1
Table 9: UV absorbance peak for wavelengthP/V Wavelength (nm) Absorbance
Peak 310 0.165
Peak 215 0.192
Korade, et al. QbD approach and validation of Secnidazole
50 51Innovations in Pharmaceuticals and Pharmacotherapy | Apr-Jun 2019 | Vol 7 | Issue 2 Innovations in Pharmaceuticals and Pharmacotherapy | Apr-Jun 2019 | Vol 7 | Issue 2
Figure 1: Interpretation of IR of Secnidazole
Figure 2: Wavelength of Secnidazole
to statistical analysis for optimized condition for further experiment using RP-HPLC.
Regression coefficient and p-values obtained from software generated report are given in Table 12.
The predicted R² of −2.6972 is not as close to the adjusted R² of 0.3942 as one might normally expect shown in Table 11, i.e., the difference is more than 0.2. This may indicate a large block effect or a possible problem with your model and/or data. Things to consider are model reduction, response transformation, outliers, etc. All empirical models should be tested by doing confirmation runs.
Adequate precision measures the signal-to-noise ratio. A ratio greater than 4 is desirable. Your ratio of 15.479 indicates an adequate signal. This model can be used to navigate the design space.
The model F-value of 2.16 implies that the model is significant. There is only 0.02% chance that an F-value this large could occur due to noise Table 12.
P < 0.0844 indicates that model terms are significant. In this case, B, C, A², and B² are significant model terms Table 12. Values >0.1000 indicate that the model terms are not significant. If there are many
insignificant model terms (not counting those required to support hierarchy), model reduction may improve your model.
The lack-of-fit F-value of 8.06 implies that the lack of fit is not significant relative to the pure error. There is 3.60% chance that a lack-of-fit F-value this large could occur due to noise Table 13. Non-significant lack of fit is good – we want the model to fit.
As shown in Table 11, the type of model suggested version Design Expert 11 was quadratic on the basis of sequential P-value, lack-of-fit P-value, adjusted R2, and predicted R2 as 0.0844, 0.0360, 2.6972, and 0.3942, respectively. Furthermore, Table 13 showed sum of squares, mean square, F-value, and P-value as 0.012, 0.0004, 3.36, and 0.0844, respectively.
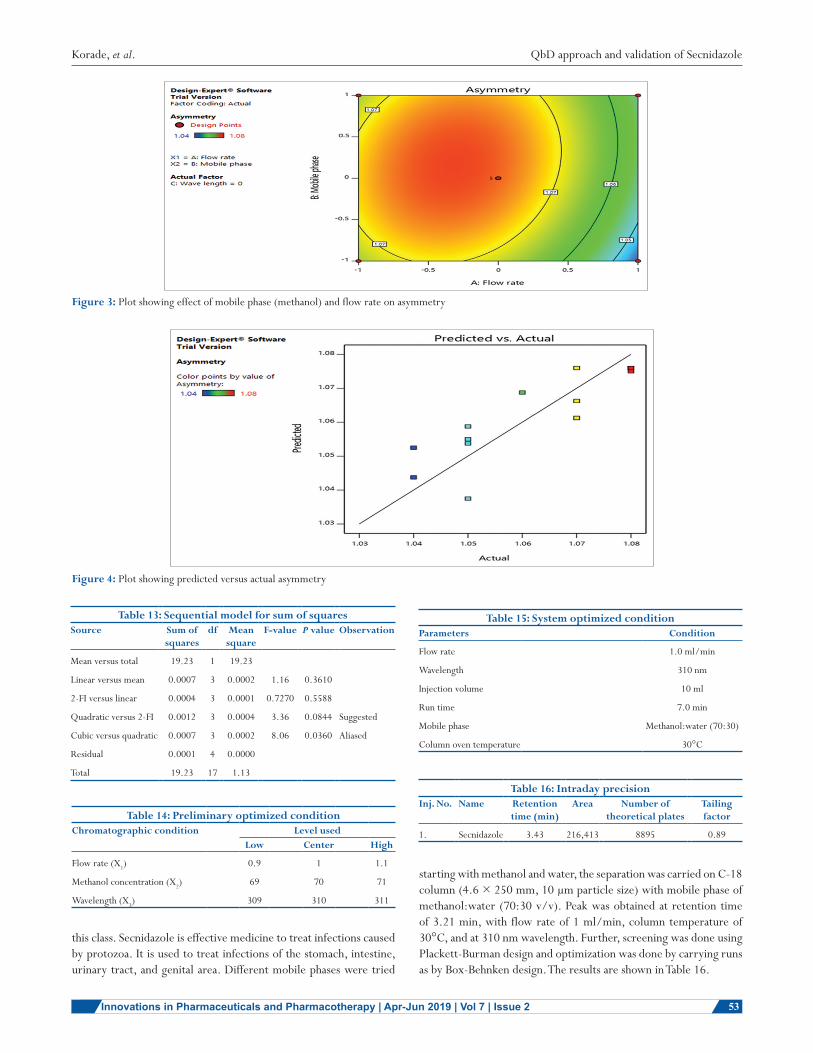
Figure 3 suggests that with increase in flow rate, above 1 ml also increases asymmetry factor. Furthermore, increase in mobile phase concentration 71% asymmetry factor also increases up to 1.7. Nevertheless, increase in the methanol concentration to near 70% (approx. 70%) along with flow rate equivalent to 1 ml/min predicted, we need asymmetry factor as 1.2.
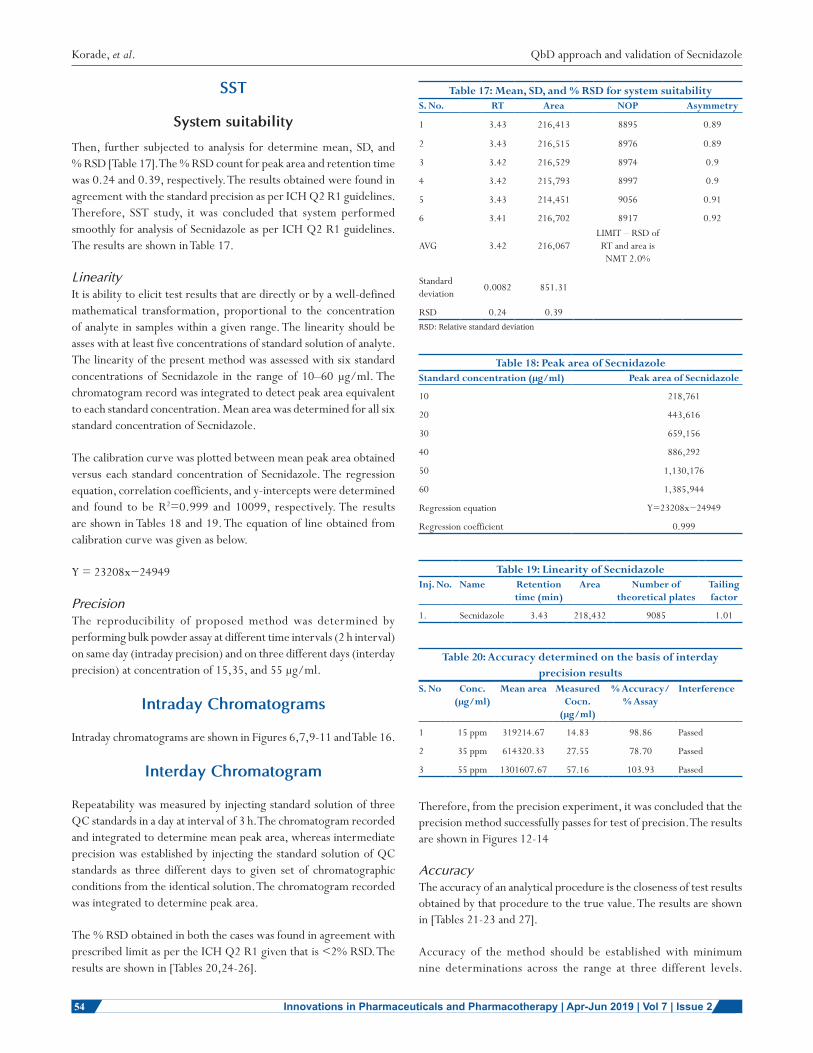
Figure 4 indicates the effect of predicted versus actual responses.
Korade, et al. QbD approach and validation of Secnidazole
52 53Innovations in Pharmaceuticals and Pharmacotherapy | Apr-Jun 2019 | Vol 7 | Issue 2 Innovations in Pharmaceuticals and Pharmacotherapy | Apr-Jun 2019 | Vol 7 | Issue 2
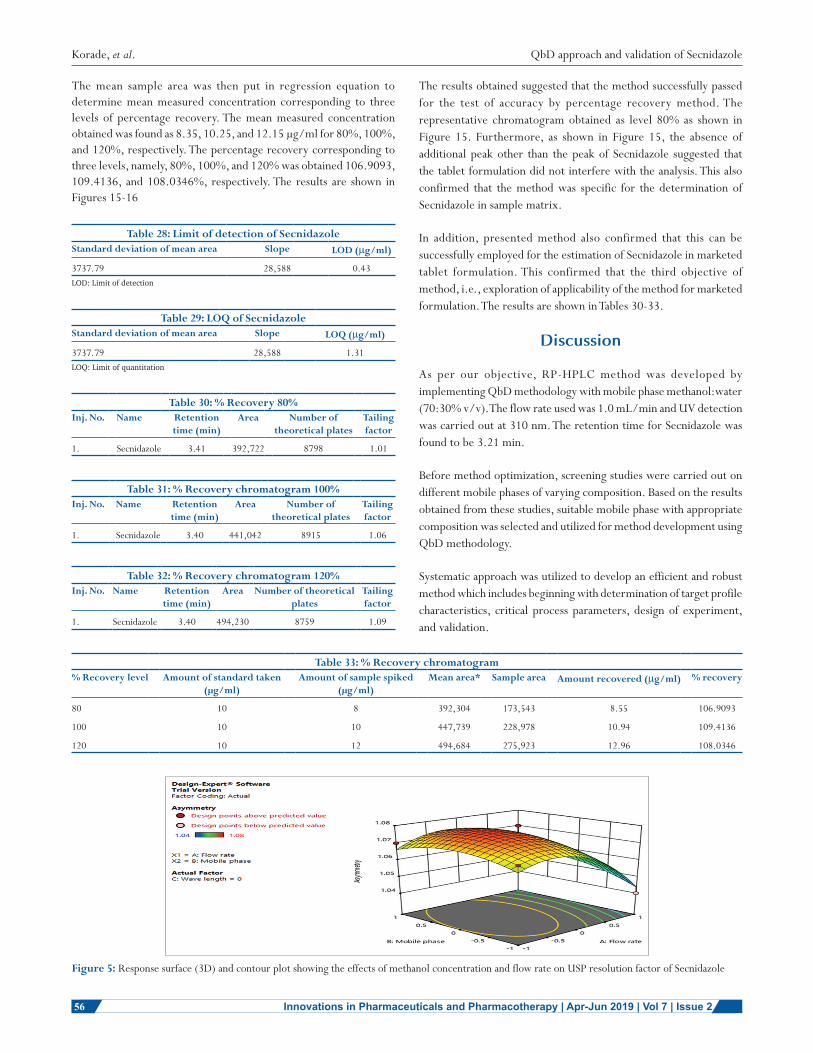
In Figures 3 and 5 counter plot and 3D surface plot suggesting the effect of concentration and flow rate on tailing factor. As per surface, 3D shows that increase in methanol concentration can also increase in the tailing factor. In addition, increase in the flow rate from 1 ml to 1.05 ml can also increase up to 1.8. Therefore, from the predicted responses suggested by Design-Expert Version 11 and optimized condition for three coded factor Table 14.
Validation according to ICH guidelines
SSTSST is performed to ascertain the performance of chromatographic system for analysis of analyte. This indicates the results which are on the basis of set chromatographic condition. SST was performed for Secnidazole with the following optimized chromatographic condition [Table 15].
The SST was performed by six replications of Secnidazole with set chromatographic condition as per respective chromatogram [Figure 4] integrated to determine peak area, retention time, number of theoretical plates, and asymmetry. The results obtained for retention time and peak area.
Determination of Secnidazole by HPLC
Preliminary studiesSecnidazole is the second-generation 5-nitroimidazole antimicrobial that is structurally related to nitroimidazole including metronidazole and tinidazole, but displays improved oral absorption and longer terminal elimination half-life than antimicrobial agents in
Table 10: Actual responses of method designStd. Run Factor 1 Factor 2 Factor 3 Response 1 Response 2 Response 3 Response 4
A: Flow rate B: Mobile phase C: Wavelength Retention time Area Number of theoretical plates Asymmetryml/min Percent Nm Min.
16 1 0 0 0 2.85 231,865 18,559 1.61
4 2 1 1 0 2.64 251,883 14,304 1.26
10 3 0 1 −1 2.78 268,831 13,759 1.16
6 4 1 0 −1 2.74 216,893 16,074 2.03
3 5 −1 1 0 2.97 291,627 12,171 1.08
11 6 0 −1 1 2.92 244,941 17,390 1.65
14 7 0 0 0 2.84 231,228 18,212 1.59
17 8 0 0 0 2.84 236,976 17,405 1.62
13 9 0 0 0 2.86 229,877 16,912 1.72
2 10 1 −1 0 2.71 215,249 16,820 1.85
5 11 −1 0 −1 3.03 247,130 16,621 1.9
1 12 −1 −1 0 2.97 237,098 17,978 1.79
15 13 0 0 0 2.85 231,354 17,140 1.64
9 14 0 −1 −1 2.84 224,989 17,511 1.82
12 15 0 1 1 2.8 270,875 14,203 1.18
7 16 −1 0 1 2.98 247,343 17,736 1.64
8 17 1 0 1 2.72 216,379 17,007 1.7
Table 11: Suggested model fit summarySource Sequential
P valueLack‑of‑fit
P valueAdjusted
R²Predicted
R²Observation
Linear 0.3610 0.0252 0.0298 −0.3786
2-FI 0.5588 0.0188 −0.0354 −1.1963
Quadratic 0.0844 0.0360 0.3942 −2.6972 Suggested
Cubic 0.0360 0.8494 Aliased
Table 12: ANOVA for quadratic modelSource Sum of
squaresdf Mean
squareF‑value P value Observation
Model 0.0023 9 0.0003 2.16 0.1617 Not significant
A – Flow rate 0.0006 1 0.0006 5.07 0.0590
B – Mobile phase
0.0001 1 0.0001 0.4142 0.5403
C – Wavelength 0.0000 1 0.0000 0.1036 0.7570
AB 0.0000 1 0.0000 0.2071 0.6628
AC 0.0004 1 0.0004 3.31 0.1115
BC 0.0000 1 0.0000 0.2071 0.6628
A² 0.0007 1 0.0007 5.89 0.0456
B² 0.0001 1 0.0001 1.06 0.3385
C² 0.0003 1 0.0003 2.23 0.1788
Residual 0.0008 7 0.0001
Lack of fit 0.0007 3 0.0002 8.06 0.0360 Significant
Pure error 0.0001 4 0.0000
Cor. total 0.0032 16
Korade, et al. QbD approach and validation of Secnidazole
52 53Innovations in Pharmaceuticals and Pharmacotherapy | Apr-Jun 2019 | Vol 7 | Issue 2 Innovations in Pharmaceuticals and Pharmacotherapy | Apr-Jun 2019 | Vol 7 | Issue 2
this class. Secnidazole is effective medicine to treat infections caused by protozoa. It is used to treat infections of the stomach, intestine, urinary tract, and genital area. Different mobile phases were tried
starting with methanol and water, the separation was carried on C-18 column (4.6 × 250 mm, 10 μm particle size) with mobile phase of methanol:water (70:30 v/v). Peak was obtained at retention time of 3.21 min, with flow rate of 1 ml/min, column temperature of 30°C, and at 310 nm wavelength. Further, screening was done using Plackett-Burman design and optimization was done by carrying runs as by Box-Behnken design. The results are shown in Table 16.
Table 14: Preliminary optimized conditionChromatographic condition Level used
Low Center High
Flow rate (X1) 0.9 1 1.1
Methanol concentration (X2) 69 70 71
Wavelength (X3) 309 310 311
Table 15: System optimized conditionParameters Condition
Flow rate 1.0 ml/min
Wavelength 310 nm
Injection volume 10 ml
Run time 7.0 min
Mobile phase Methanol:water (70:30)
Column oven temperature 30°C
Figure 3: Plot showing effect of mobile phase (methanol) and flow rate on asymmetry
Figure 4: Plot showing predicted versus actual asymmetry
Table 13: Sequential model for sum of squaresSource Sum of
squaresdf Mean
squareF‑value P value Observation
Mean versus total 19.23 1 19.23
Linear versus mean 0.0007 3 0.0002 1.16 0.3610
2-FI versus linear 0.0004 3 0.0001 0.7270 0.5588
Quadratic versus 2-FI 0.0012 3 0.0004 3.36 0.0844 Suggested
Cubic versus quadratic 0.0007 3 0.0002 8.06 0.0360 Aliased
Residual 0.0001 4 0.0000
Total 19.23 17 1.13
Table 16: Intraday precisionInj. No. Name Retention
time (min)Area Number of
theoretical platesTailing factor
1. Secnidazole 3.43 216,413 8895 0.89
Korade, et al. QbD approach and validation of Secnidazole
54 55Innovations in Pharmaceuticals and Pharmacotherapy | Apr-Jun 2019 | Vol 7 | Issue 2 Innovations in Pharmaceuticals and Pharmacotherapy | Apr-Jun 2019 | Vol 7 | Issue 2
SST
System suitability
Then, further subjected to analysis for determine mean, SD, and % RSD [Table 17]. The % RSD count for peak area and retention time was 0.24 and 0.39, respectively. The results obtained were found in agreement with the standard precision as per ICH Q2 R1 guidelines. Therefore, SST study, it was concluded that system performed smoothly for analysis of Secnidazole as per ICH Q2 R1 guidelines. The results are shown in Table 17.
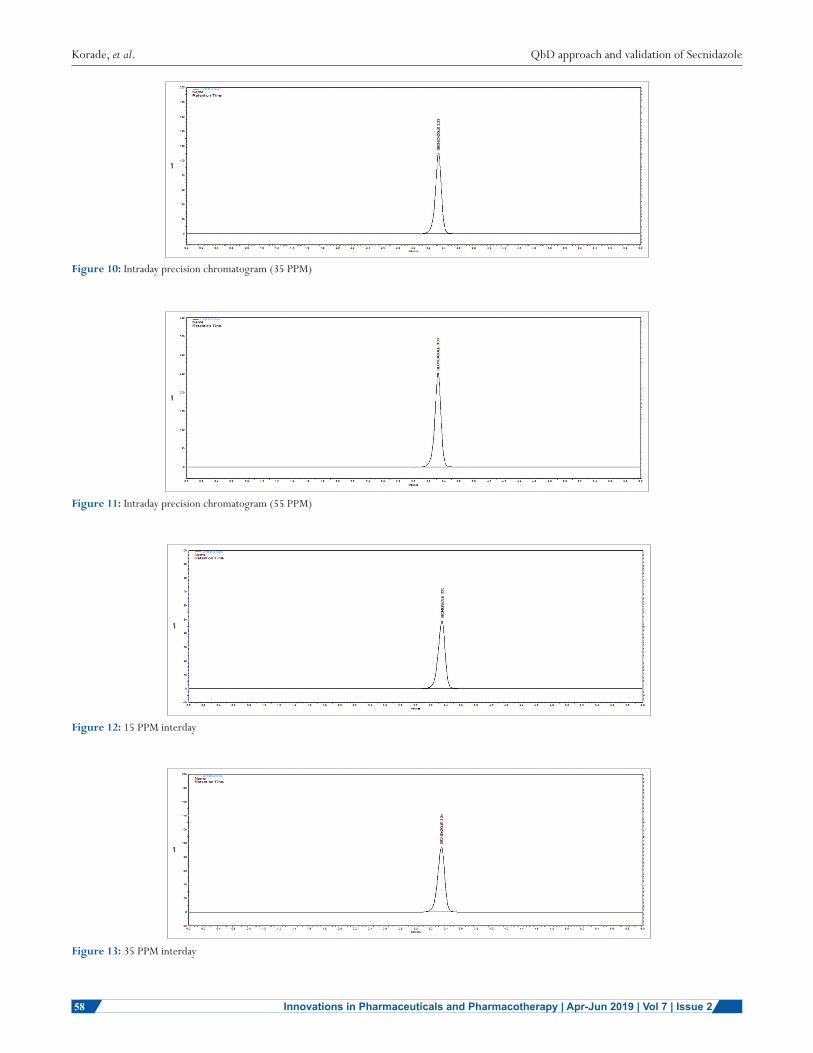
LinearityIt is ability to elicit test results that are directly or by a well-defined mathematical transformation, proportional to the concentration of analyte in samples within a given range. The linearity should be asses with at least five concentrations of standard solution of analyte. The linearity of the present method was assessed with six standard concentrations of Secnidazole in the range of 10–60 μg/ml. The chromatogram record was integrated to detect peak area equivalent to each standard concentration. Mean area was determined for all six standard concentration of Secnidazole.
The calibration curve was plotted between mean peak area obtained versus each standard concentration of Secnidazole. The regression equation, correlation coefficients, and y-intercepts were determined and found to be R2=0.999 and 10099, respectively. The results are shown in Tables 18 and 19. The equation of line obtained from calibration curve was given as below.
Y = 23208x−24949
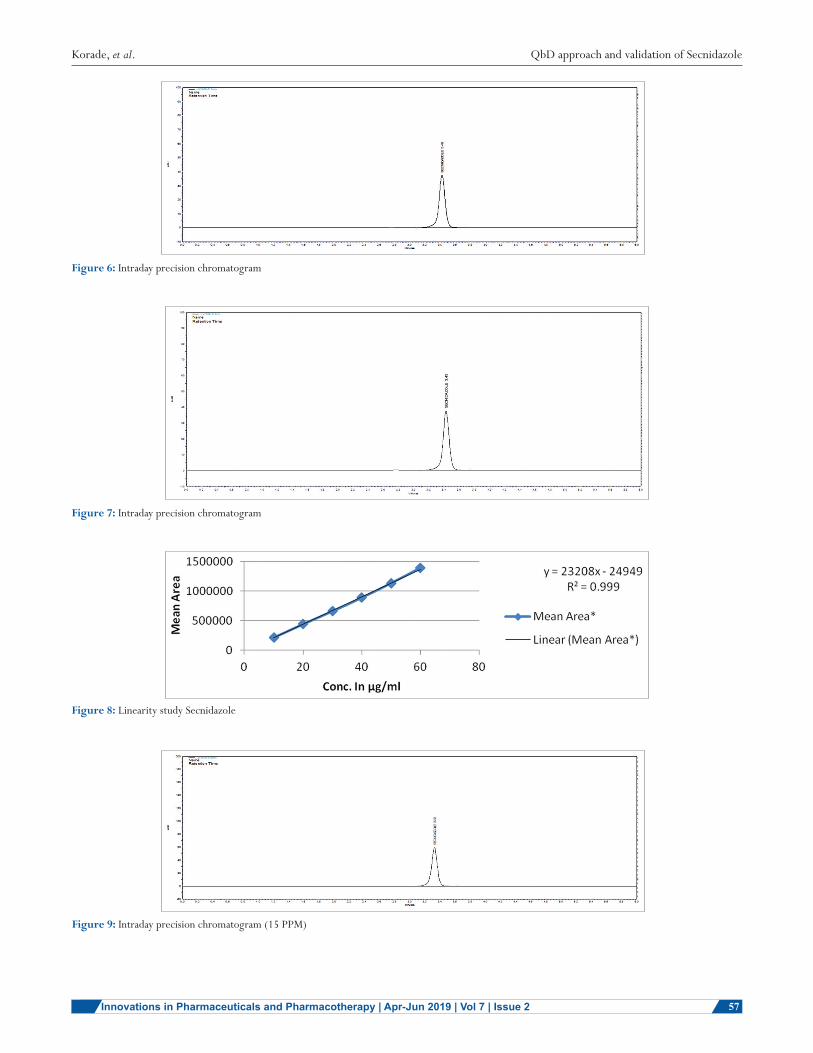
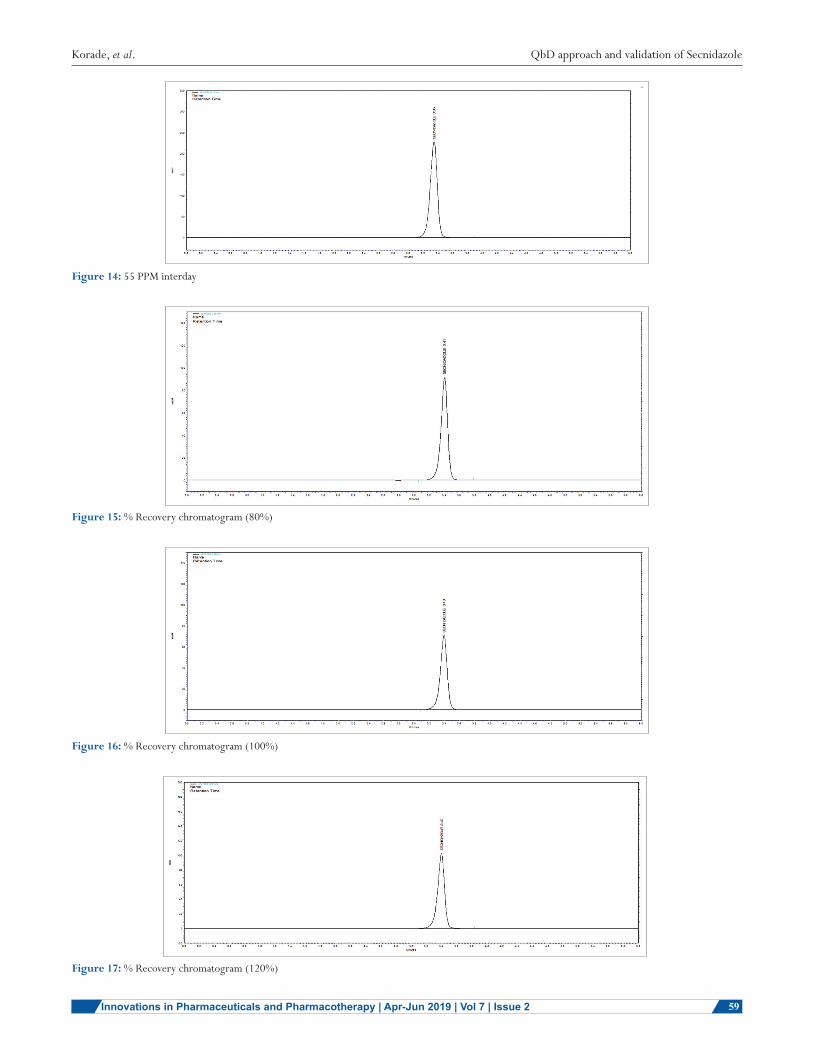
PrecisionThe reproducibility of proposed method was determined by performing bulk powder assay at different time intervals (2 h interval) on same day (intraday precision) and on three different days (interday precision) at concentration of 15,35, and 55 μg/ml.
Intraday Chromatograms
Intraday chromatograms are shown in Figures 6,7,9-11 and Table 16.
Interday Chromatogram
Repeatability was measured by injecting standard solution of three QC standards in a day at interval of 3 h. The chromatogram recorded and integrated to determine mean peak area, whereas intermediate precision was established by injecting the standard solution of QC standards as three different days to given set of chromatographic conditions from the identical solution. The chromatogram recorded was integrated to determine peak area.
The % RSD obtained in both the cases was found in agreement with prescribed limit as per the ICH Q2 R1 given that is <2% RSD. The results are shown in [Tables 20,24-26].
Table 17: Mean, SD, and % RSD for system suitabilityS. No. RT Area NOP Asymmetry
1 3.43 216,413 8895 0.89
2 3.43 216,515 8976 0.89
3 3.42 216,529 8974 0.9
4 3.42 215,793 8997 0.9
5 3.43 214,451 9056 0.91
6 3.41 216,702 8917 0.92
AVG 3.42 216,067LIMIT – RSD of RT and area is NMT 2.0%
Standard deviation
0.0082 851.31
RSD 0.24 0.39RSD: Relative standard deviation
Table 18: Peak area of SecnidazoleStandard concentration (μg/ml) Peak area of Secnidazole
10 218,761
20 443,616
30 659,156
40 886,292
50 1,130,176
60 1,385,944
Regression equation Y=23208x−24949
Regression coefficient 0.999
Table 19: Linearity of SecnidazoleInj. No. Name Retention
time (min)Area Number of
theoretical platesTailing factor
1. Secnidazole 3.43 218,432 9085 1.01
Therefore, from the precision experiment, it was concluded that the precision method successfully passes for test of precision. The results are shown in Figures 12-14
AccuracyThe accuracy of an analytical procedure is the closeness of test results obtained by that procedure to the true value. The results are shown in [Tables 21-23 and 27].
Accuracy of the method should be established with minimum nine determinations across the range at three different levels.
S. No Conc. (μg/ml)
Mean area Measured Cocn.
(μg/ml)
% Accuracy/ % Assay
Interference
1 15 ppm 319214.67 14.83 98.86 Passed
2 35 ppm 614320.33 27.55 78.70 Passed
3 55 ppm 1301607.67 57.16 103.93 Passed
Table 20: Accuracy determined on the basis of interday precision results
Korade, et al. QbD approach and validation of Secnidazole
54 55Innovations in Pharmaceuticals and Pharmacotherapy | Apr-Jun 2019 | Vol 7 | Issue 2 Innovations in Pharmaceuticals and Pharmacotherapy | Apr-Jun 2019 | Vol 7 | Issue 2
The present method consisted of the determination of accuracy by two different methods, namely, from the results obtained in precision experiment for three Qc standards (interday precision) and by percentage recovery method, as described in later section of this chapter.
The results obtained in the form of peak area in intermediate precision were used to determine mean measured concentration by putting the value in regression equation. The mean measured concentration obtained for three QC standards was 14.83, 27.55, and 57.16 μg/ml for 15, 35, and 55 μg/ml, respectively. The results obtained shown were within ±10%. Therefore, it was concluded that the precision method passed for accuracy from the data obtained precision experiment.
LOD and LOQ
LODIt is the lowest amount of analyte in a sample that can be detected, but not necessarily quantified, under the stated experimental conditions.
3.3*3737.79LOD=
28588
LOQIt is the lowest amount of analyte in a sample that can be determined with acceptable precision and accuracy under the stated experimental conditions.
10 *3737.79LOD
28588=
LOD and LOQ value calculated were 2 μg/ml and 6.06 μg/ml, respectively, for Secnidazole.
The LOD and LOQ of Secnidazole by the proposed methods were determined using calibration standards. LOD and LOQ values were calculated as 3.3 σ/S and 10 σ/S, respectively, where S is the slope of the calibration curve and σ is the standard deviation of y-intercept. LOD was found to be 0.43 μg/ml and LOQ was found to be 6.06 μg/ml. The result is shown in Figure 8.
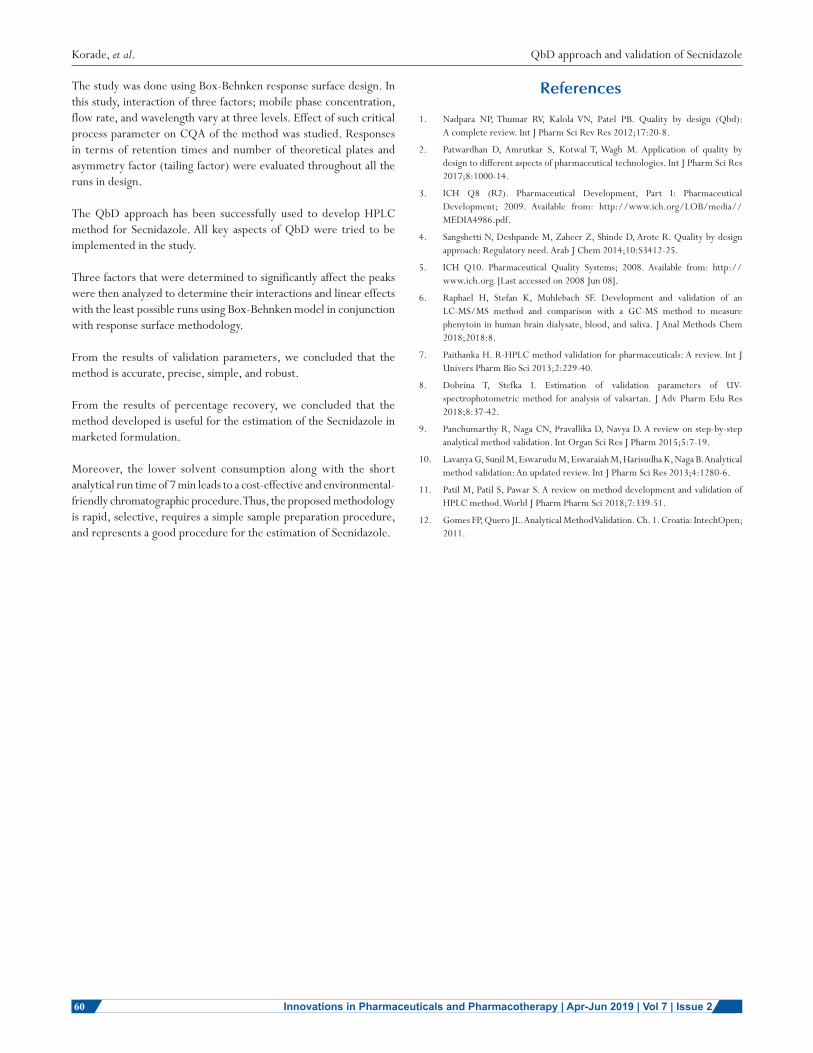
% RecoveryThe accuracy of an analytical procedure is the closeness of test results obtained by that procedure to the true value. Accuracy of the method was also determined by percentage recovery method. Percentage recovery was performed by spiked method. Three identical standard solutions of Secnidazole (10 μg/ml) were spiked to three sample solutions at different levels, namely, 80%, 100%, and 120%. These three test solutions were injected to given set of optimized chromatographic condition in triplicate and peak area corresponding to each test solution was determined.The results are shown in Tables 28 and 29.
Area found at each level was subjected to determine mean peak area. The area corresponding to standard solution of Secnidazole (previously determine) was subtracted from the mean peak area corresponds to each test concentration to determine sample area at each level. The percentage recovery was determined to form sample and standard area, sample and standard concentration, and assay. The percentage recovery values obtained from Secnidazole from dosage form were tabulated.
Table 21: 15 PPM intradayInj. No. Name Retention
time (min)Area Number of
theoretical platesTailing factor
1. Secnidazole 3.33 316,631 8750 1.00
Table 22: Intraday precision 35 ppmInj. No. Name Retention
time (min)Area Number of
theoretical platesTailing factor
1. Secnidazole 3.33 623,634 8525 1.01
Table 23: Intraday precision 55 PPMInj. No. Name Retention
time (min)Area Number of
theoretical platesTailing factor
1. Secnidazole 3.33 1,307,342 8885 1.01
Table 24: 15 PPM interdayInj. No. Name Retention
time (min)Area Number of
theoretical platesTailing factor
1. Secnidazole 3.35 318,310 8985 1.05
Table 25: 35 ppm interdayInj. No. Name Retention
time (min)Area Number of
theoretical platesTailing factor
1. Secnidazole 3.34 626,668 8939 1.08
Table 26: 55 PPM interdayInj. No. Name Retention
time (min)Area Number of
theoretical platesTailing factor
1. Secnidazole 3.35 1,296,587 8958 1.08
Table 27: Intraday and interday precision
Conc. (µg/ml) Day 1 Day 2 Day 3 Mean area Standard deviation % RSD Limit (%)
Korade, et al. QbD approach and validation of Secnidazole
56 57Innovations in Pharmaceuticals and Pharmacotherapy | Apr-Jun 2019 | Vol 7 | Issue 2 Innovations in Pharmaceuticals and Pharmacotherapy | Apr-Jun 2019 | Vol 7 | Issue 2
Figure 5: Response surface (3D) and contour plot showing the effects of methanol concentration and flow rate on USP resolution factor of Secnidazole
Table 28: Limit of detection of SecnidazoleStandard deviation of mean area Slope LOD (µg/ml)
3737.79 28,588 0.43LOD: Limit of detection
Table 29: LOQ of SecnidazoleStandard deviation of mean area Slope LOQ (µg/ml)
3737.79 28,588 1.31LOQ: Limit of quantitation
Table 30: % Recovery 80%Inj. No. Name Retention
time (min)Area Number of
theoretical platesTailing factor
1. Secnidazole 3.41 392,722 8798 1.01
Table 31: % Recovery chromatogram 100%Inj. No. Name Retention
time (min)Area Number of
theoretical platesTailing factor
1. Secnidazole 3.40 441,042 8915 1.06
Table 32: % Recovery chromatogram 120%Inj. No. Name Retention
time (min)Area Number of theoretical
platesTailing factor
1. Secnidazole 3.40 494,230 8759 1.09
The mean sample area was then put in regression equation to determine mean measured concentration corresponding to three levels of percentage recovery. The mean measured concentration obtained was found as 8.35, 10.25, and 12.15 μg/ml for 80%, 100%, and 120%, respectively. The percentage recovery corresponding to three levels, namely, 80%, 100%, and 120% was obtained 106.9093, 109.4136, and 108.0346%, respectively. The results are shown in Figures 15-16
The results obtained suggested that the method successfully passed for the test of accuracy by percentage recovery method. The representative chromatogram obtained as level 80% as shown in Figure 15. Furthermore, as shown in Figure 15, the absence of additional peak other than the peak of Secnidazole suggested that the tablet formulation did not interfere with the analysis. This also confirmed that the method was specific for the determination of Secnidazole in sample matrix.
In addition, presented method also confirmed that this can be successfully employed for the estimation of Secnidazole in marketed tablet formulation. This confirmed that the third objective of method, i.e., exploration of applicability of the method for marketed formulation. The results are shown in Tables 30-33.
Discussion
As per our objective, RP-HPLC method was developed by implementing QbD methodology with mobile phase methanol:water (70:30% v/v). The flow rate used was 1.0 mL/min and UV detection was carried out at 310 nm. The retention time for Secnidazole was found to be 3.21 min.
Before method optimization, screening studies were carried out on different mobile phases of varying composition. Based on the results obtained from these studies, suitable mobile phase with appropriate composition was selected and utilized for method development using QbD methodology.
Systematic approach was utilized to develop an efficient and robust method which includes beginning with determination of target profile characteristics, critical process parameters, design of experiment, and validation.
Table 33: % Recovery chromatogram% Recovery level Amount of standard taken
(μg/ml)Amount of sample spiked
(μg/ml)Mean area* Sample area Amount recovered (µg/ml) % recovery
80 10 8 392,304 173,543 8.55 106.9093
100 10 10 447,739 228,978 10.94 109.4136
120 10 12 494,684 275,923 12.96 108.0346
Korade, et al. QbD approach and validation of Secnidazole
56 57Innovations in Pharmaceuticals and Pharmacotherapy | Apr-Jun 2019 | Vol 7 | Issue 2 Innovations in Pharmaceuticals and Pharmacotherapy | Apr-Jun 2019 | Vol 7 | Issue 2
Korade, et al. QbD approach and validation of Secnidazole
58 59Innovations in Pharmaceuticals and Pharmacotherapy | Apr-Jun 2019 | Vol 7 | Issue 2 Innovations in Pharmaceuticals and Pharmacotherapy | Apr-Jun 2019 | Vol 7 | Issue 2
Figure 14: 55 PPM interday
Figure 15: % Recovery chromatogram (80%)
Figure 16: % Recovery chromatogram (100%)
Figure 17: % Recovery chromatogram (120%)
Korade, et al. QbD approach and validation of Secnidazole
60 PBInnovations in Pharmaceuticals and Pharmacotherapy | Apr-Jun 2019 | Vol 7 | Issue 2 Innovations in Pharmaceuticals and Pharmacotherapy | Apr-Jun 2019 | Vol 7 | Issue 2
The study was done using Box-Behnken response surface design. In this study, interaction of three factors; mobile phase concentration, flow rate, and wavelength vary at three levels. Effect of such critical process parameter on CQA of the method was studied. Responses in terms of retention times and number of theoretical plates and asymmetry factor (tailing factor) were evaluated throughout all the runs in design.
The QbD approach has been successfully used to develop HPLC method for Secnidazole. All key aspects of QbD were tried to be implemented in the study.
Three factors that were determined to significantly affect the peaks were then analyzed to determine their interactions and linear effects with the least possible runs using Box-Behnken model in conjunction with response surface methodology.
From the results of validation parameters, we concluded that the method is accurate, precise, simple, and robust.
From the results of percentage recovery, we concluded that the method developed is useful for the estimation of the Secnidazole in marketed formulation.
Moreover, the lower solvent consumption along with the short analytical run time of 7 min leads to a cost-effective and environmental-friendly chromatographic procedure. Thus, the proposed methodology is rapid, selective, requires a simple sample preparation procedure, and represents a good procedure for the estimation of Secnidazole.
References
1. Nadpara NP, Thumar RV, Kalola VN, Patel PB. Quality by design (Qbd): A complete review. Int J Pharm Sci Rev Res 2012;17:20-8.
2. Patwardhan D, Amrutkar S, Kotwal T, Wagh M. Application of quality by design to different aspects of pharmaceutical technologies. Int J Pharm Sci Res 2017;8:1000-14.
3. ICH Q8 (R2). Pharmaceutical Development, Part I: Pharmaceutical Development; 2009. Available from: http://www.ich.org/LOB/media//MEDIA4986.pdf.
4. Sangshetti N, Deshpande M, Zaheer Z, Shinde D, Arote R. Quality by design approach: Regulatory need. Arab J Chem 2014;10:S3412-25.
5. ICH Q10. Pharmaceutical Quality Systems; 2008. Available from: http://www.ich.org. [Last accessed on 2008 Jun 08].
6. Raphael H, Stefan K, Muhlebach SF. Development and validation of an LC-MS/MS method and comparison with a GC-MS method to measure phenytoin in human brain dialysate, blood, and saliva. J Anal Methods Chem 2018;2018:8.
7. Paithanka H. R-HPLC method validation for pharmaceuticals: A review. Int J Univers Pharm Bio Sci 2013;2:229-40.
8. Dobrina T, Stefka I. Estimation of validation parameters of UV-spectrophotometric method for analysis of valsartan. J Adv Pharm Edu Res 2018;8:37-42.
9. Panchumarthy R, Naga CN, Pravallika D, Navya D. A review on step-by-step analytical method validation. Int Organ Sci Res J Pharm 2015;5:7-19.
10. Lavanya G, Sunil M, Eswarudu M, Eswaraiah M, Harisudha K, Naga B. Analytical method validation: An updated review. Int J Pharm Sci Res 2013;4:1280-6.
11. Patil M, Patil S, Pawar S. A review on method development and validation of HPLC method. World J Pharm Pharm Sci 2018;7:339-51.