41
Quality by Design, Revolution or Evolution? Wim Oostra

Quality by Design, Revolution or Evolution?
Wim Oostra

1993
1998
2007
2009
2013
And many more..

Content
• Introduction
• A bit of history
• Examples
– A “New” product
– Legacy product
• Today?

The triggers…

The goal
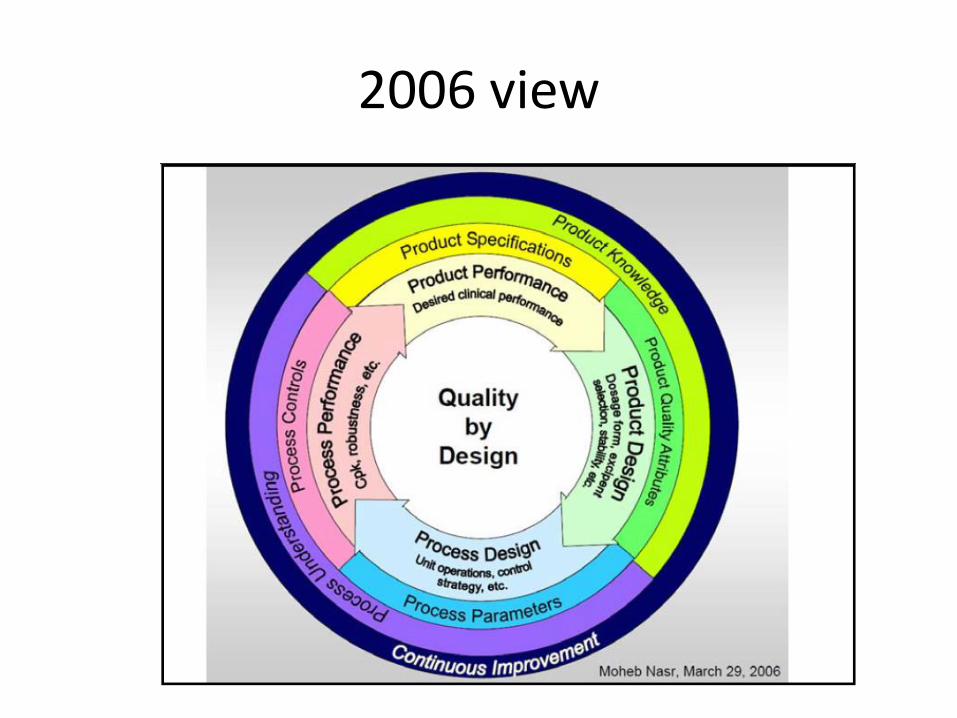
2006 view

Ajaz Hussain, 2005


9
Christine Moore at Workshop on “Operational Excellence: A Lifecycle Approach to
Assuring Product Quality” Bethesda, MD, April 5, 2011

Elements of QbD
• QTPP
• Risk assessments (should be management)
• CQA’s
• CPP’s
• Control strategy (may include PAT)
• Design space
• Continuous improvement
10

11
Development vs. operations
Multi site operations
Large Scale, complex equipment,
often multi purpose
Is this a good batch?
Skilled operators trained to
operate manufacturing equipment
Manufactured for 5+ years
One development site
Small, simplified equipment,
easily adapted to facilitate (new)
PAT equipment
Can we detect a bad batch?
Scientists, chemometricans
trained to operate analytical
equipment
Transferred to manufacturing after
2-4 years
Development Commercial production

Quality by Design Approach
A Quality by Design approach was applied in the development of the manufacturing
process of the drug product to:
• Deliver a robust manufacturing process on commercial scale
• Provide flexibility in the supply chain (e.g. site, scale)
• Facilitate post-approval changes
Quality by Design elements in the Application:
• Quality risk management
• Quality target product profile
• Comprehensive control strategy DP
• Design space for manufacturing process DP
• On-line NIR application for blend uniformity control
Specific Health Authorities guidance meetings on QbD:
• March 2007 FDA Type C Guidance Meeting
• June 2007 EMEA PAT team Scientific Advice Meeting
• March 2009 FDA Type C Guidance Meeting
Project was a pilot for Quality by Design within Organon/SP legacy

Boundary conditions
PRODUCTION SITES
Dev Operations 1 Operations 2
Mixing Class/subclass
Diffusion mixer, drum blenders/bin blenders
Convection mixer, orbiting screw blender
Diffusion mixer, bin blenders
Unit dosingClass/subclass
Tablet press, power assisted feeding
Tablet press, centrifugal feeding
Tablet press, power assisted feeding
CoatingClass/subclass
Pan coating, perforated coating system
Pan coating, perforated coating system
Equipment to be purchased (perforated coating system)

Strategy
►Use Quality by Design and Design Space concept to create desired flexibility in:– Equipment (mixing, compression)
– Batch size (mixing, coating)
– Manufacturing site
– Real time Release
While ensuring quality

15
A control strategy
MIXING
PSD Excipients
PSD Active
Moisture content
excipients
RH
Batch size
Mixer typeCritical
Mixing timeMixing speed
Blend uniformity
INPUTS Parameters

16
The desired control strategy
MIXING
PSD Excipients
PSD Active
Moisture content
excipients
RH
Batch size
Mixer type
Critical for this unit
operation
Mixing time Mixing speed
Blend uniformity
INPUTS Parameters
NIR
Critical for other unit
operationNot critical

Process control, dry mixing
Process Step Process Control Method Acceptance Criterion
Mixing Blend uniformity NIR •F-critical value corresponding to an α-error of 5%
•The minimum mixing time is 15 min1
•The acceptance range for total mixing time is
20 -180 minutes2
1 to prevent false positive results for the F-test.2 if the NIR control does not indicate a uniform blend after 180 minutes, the blending will be stopped manually and
stratified sampling of uncoated tablets post-compression will be conducted to confirm content uniformity using the
following criteria: RSD is less than 5% and mean content is 95.0 – 105.0% (n = 3, 20 locations).

Feedback EMA
► No major issues observed, 49 concerns
► Acceptance in dossier of:–NIR application for control of blend uniformity–Stratified sampling results in lieu of Uniformity of dosage unit tests–Clinically relevant dissolution specification of Active–Risk scoring and acceptance of all risks prior to commercial production–Design space containing two mixer types (diffusion and convection) and batch
size range–Comprehensive control strategy
►Based on assessment reports and day 120 final List of Questions

EMA Feedback, day 120
►In case of NIR failure, strategy will be to refer to pre-established blending times. Thus, it should be demonstrated that the set blending times adequately cover the potential interactions between relevant variable attributes (in particular nomegestrol acetate and excipients particle size) and/or parameters (in particular blend speed and shear force).

Summary
EMA FDA TGA
Design Space
☺ ☺
NIR control
☺ ☺
Batch size range, mixing ☺ ☺ ☺
Bin blender

21Journal of Pharmaceutical and Biomedical Analysis 114 (2015) 471–481

Time check….
- Go to conclusion and Q&A
- Discuss legacy products
22

LEGACY PRODUCTS

Lifecycle approach for legacy products
PDA TR 60-2 Process Validation, a lifecycle approach

Legacy product
• combines a slow release formulation of a calcium channel blocker, and an immediate release formulation of an angiotensin converting enzyme inhibitor
• Double layer tablet
• Approved 1996
• Product description

Problem definition
• Issues in a manufacturing site with dissolution stability, at release and during shelf life
• Manufacturing process cumbersome (granulator difficult to empty/clean, wet screening now and then “spaghetti”
• Problem not seen in all locations

Problem Definition
80706050403020100
70
60
50
40
30
BatchNr
Y-D
ata
Isoptin 4 h dissolution in production
4-hour dissolution of production samples over 2010-2012 as a function of batch order. The green, black and Red lines correspond to min, mean and max of 6 samples (or 12 in case a transgression of the upper specification limit was observed in the first 6)
Upper and lower specification
Variability
?
Upward trending
?

Elements of QbD
• QTPP
• Risk assessments (should be management)
• CQA’s
• CPP’s
• Control strategy
• Design space
• Continuous improvement
?
☺
?

4-hr dissolution of
coated tablets
EXCIPIENTS
Granulation Drying Blending / LubricationSizing Compression Coating
MCC
Povidone
Sodium alginate
PSD, PH type,
LOD
Viscosity: K-type
Sizing
Polishing
ingredients
Coating
ingredients
Granulation
ingredients
PROCESS
Points for investigation
Dissolution
method
media
Density
Temperature
pH
Hydrodynamics
Paddle speed
Variability Average ?Average ?
API PSD,, LOD
Focus of pilot batches

Commercial scale, dissolution
• Mean well centered, min-max close to spec
3801
BV02
0
1937
69Y RE
C
1546
29Y
1223
39Y
0934
59Y
0728
09Y 1)
0531
89Y
0129
79Y
9321
79Y
8602
09Y
70
60
50
40
30
Batch
Am
ou
nt
Dis
so
lve
d 4
th h
r (%
la
be
l cla
im)
36
56
Max Commercial
Max Confirmation
Max Prod Trial
Average Commercial
Average Confirmation
Average Prod Trial
Min Commercial
Min Confirmation
Min Prod Trial
Variable Group

Commercial scale, dissolution
55.052.550.047.545.042.540.037.5
70
60
50
40
30
20
10
0
55.052.550.047.545.042.540.037.5
3801BV020
Pe
rce
nt
3801BV011
PVP dry PVP dissolved
Mean = 45.2%s.d. = 3.5%
Mean = 46.7%s.d. = 4.8%
Cores s.d.: 0.8-1.5%

Cores vs. coated
• Significant differences were seen between standard deviation in cores and coated tablets (1% vs. 4-5%)
• Collected coating conditions of all sites
• Investigated effect of process and coat materials
– Heating
– Spraying, water, coat solution
– Type of coat PVA based, HPMC based
– Wax addition cold vs. Warm tablets

Cores vs coated
BV030 PVA coatBV020 coatedsprayed-40preheated-40BV030 coresBV020 cores
56
52
48
44
40
Da
ta
4 hr dissolution

Investigation of coat-disso relation
• Used OCT, NIR, THz
• Initial data suggested correlation between coat quality and dissolution, extended data set with more batches confirmed variability in coat thickness, (talc) and surface roughness but was inconclusive wrtcorrelation with dissolution

Results
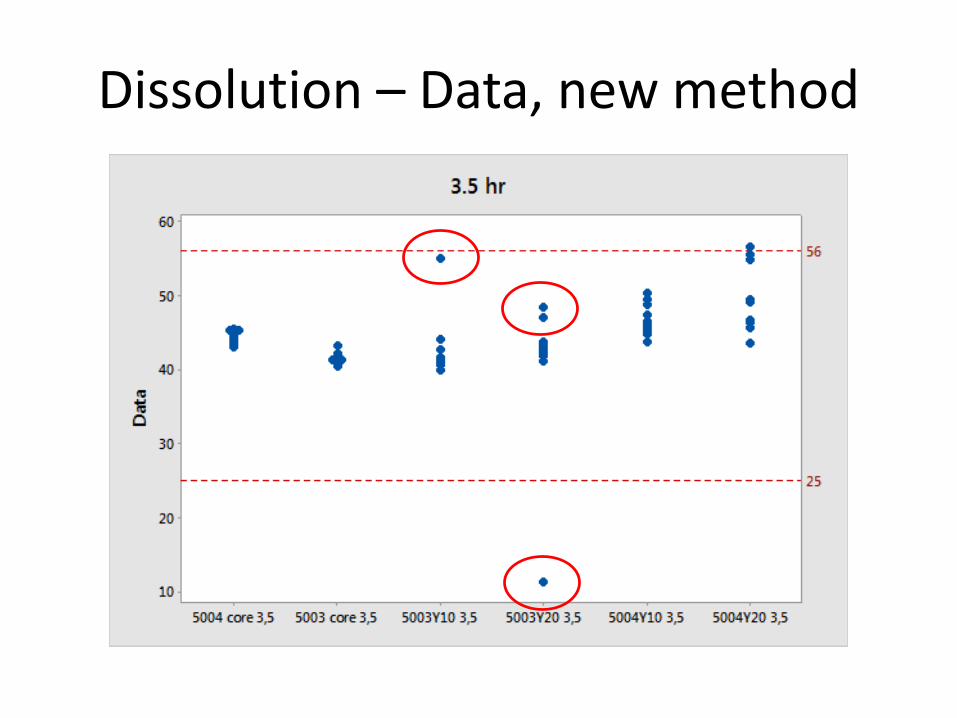
Dissolution – Data, new method

Elements of QbD
• QTPP
• Risk assessments (should be management)
• CQA’s
• CPP’s
• Control strategy
• Design space
• Continuous improvement
☺
☺
☺
☺
☺

Legacy products
• Generally not designed per QbD (but many stillvery well designed!), may lack QbD terminology
• Generally many years of manufacturing experience and data available, allowing a goodassessment of variability!
• Various “maintenance” activities can trigger product upgrade:• Introduction of new suppliers of ingredients
• Site transfers
• Product issues
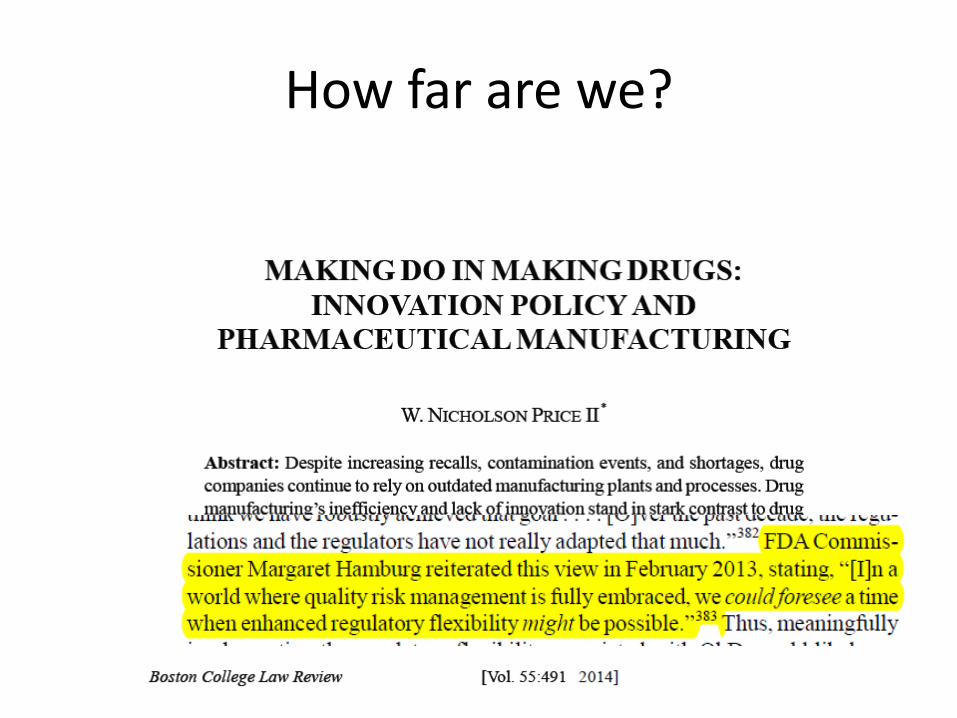
How far are we?

2015

2017
• Quality by Design, Revolution or Evolution?
– Discussion, questions….


