Eur. J. Mineral. 2008, 20, 447–463 Published online June 2008 Paper presented at the symposium “Granitic Pagmatites: the State of the Art”, Porto, May 2007 Quartz chemistry in polygeneration Sveconorwegian pegmatites, Froland, Norway Axel MÜLLER 1∗ ,Peter M. IHLEN 1 and Andreas KRONZ 2 1 Geological Survey of Norway, 7491 Trondheim, Norway *Corresponding author, e-mail: [email protected]2 Geowissenschaftliches Zentrum Göttingen, Goldschmidtstr. 1, 37073 Göttingen, Germany Abstract: Element concentrations in quartz, feldspar and biotite of Sveconorwegian (1.13–0.9 Ga) granitic pegmatites in Froland, Norway, were analysed by LA-ICP-MS, EPMA and XRF, respectively, in order to determine chemical variations between different pegmatite types and within individual pegmatitic bodies. A refined classification of the syn-, late- and post-orogenic granitic pegmatites of Froland is presented basing on the pegmatite structure, bulk composition and mineral chemistry. Syn-orogenic pegmatites (1.13–1.06 Ga) are relative primitive with respect to granite differentiation. Late-orogenic pegmatites linked to the Herefoss pluton (0.93 Ga) have the most primitive composition and contain Fe phlogopite. Post-orogenic zinnwaldite pegmatites (< 0.93 Ga) are the most evolved. Pegmatitic quartz has an astonishingly consistent trace element signature between and within syn-orogenic pegmatites. Average concentrations are in the range of 6–10 μgg −1 for Li, 34–44 μgg −1 for Al, 4–8 μgg −1 for Ti, and 0.9–1.8 μgg −1 for Ge. Al, Li, Fe, Ge, and Ti in quartz of late- and post-orogenic and contact-metamorphosed syn-orogenic pegmatites are more variable. Micro-mylonitisation and contact metamorphism caused the lowering of Li and Al and the increase of Ti and Ge in pegmatitic quartz of some syn-orogenic granites. Several generations of secondary quartz replaced pegmatitic quartz at the micro scale (< 1 mm) during retrograde fluid-driven overprint. Secondary quartz is depleted in Al, Ti and Li compared to the host quartz. In contrast to quartz, the feldspar and biotite chemistry depends largely on the differentiation degree of the pegmatites and varies significantly within structurally-zoned pegmatite bodies. Feldspar and biotite chemistry reflects changes in melt composition within pegmatites, which includes a decrease of Mg and Sr and increase of Li, Rb, and Ba. The syn-orogenic pegmatites were formed during the crustal accretion on the western margin of Fennoscandia under constant PTX-conditions causing the homogeneous trace element signature of quartz. Key-words: pegmatite, quartz, LA-ICP-MS, cathodoluminescence, Froland, trace elements. 1. Introduction The pegmatites in southern Norway have attracted the at- tention of mineralogists for more than a century due to their contents of rare-metal minerals (e.g., Brøgger, 1906), many of them being discovered and described for the first time in the world (e.g., Schetelig, 1922). However, few attempts have been made to give details of the most common peg- matite minerals quartz, feldspar and mica. The chemistry of quartz in the Froland pegmatite field, that developed during the Sveconorwegian orogeny (1.13–0.9 Ga) will be the ob- ject of this study. The 20 km NE-SW striking and 5-km wide Froland field is in the centre of the south Norwe- gian pegmatite cluster is framed by the fields of Glamsland- Lillesand, Evje-Iveland, Arendal, and Kragerø (Fig. 1a, b). The mineralogy, mineral chemistry, geochronology, struc- tures and genesis of the pegmatites in these fields have been studied by Andersen (1926, 1931), Bjørlykke (1937), Åmli (1975, 1977), Baadsgaard et al. (1984), Ihlen et al. (2001, 2002), Larsen (2002), Larsen et al. (2004), Henderson & Ihlen (2004), and Müller et al. (2005). The Froland peg- matites comprise simple abyssal pegmatites with variable contents of quartz, alkali feldspar, plagioclase, biotite, and minor white mica forming about 105 major granitic peg- matite bodies (Ihlen et al., 2001, 2002). REE minerals and other striking accessories are rare and thus the Froland field has been of minor interest for mineralogists, but of large in- terest for the procelain and glass industry. 76 of the Froland pegmatites were mined for feldspar and/or quartz since the 19th century. Some pegmatites were mined for flaky mica and REE minerals. Pegmatites can display both regional (e.g., ˇ Cerný, 1992; Malló et al., 1995; London, 1996) and internal composi- tional zoning (e.g., Cameron et al., 1949; Norton, 1983; London et al., 1989; London, 1996; Roda-Robles et al., 2004) on the basis of characteristic minerals and parage- nesis as well as the chemistry of minerals, such as feldspar, mica, tourmaline, garnet and accessory rare-metal miner- als. However, the chemistry of quartz has not been con- sidered until the beginning of the 21st century mainly 0935-1221/08/0020-1822 $ 7.65 DOI: 10.1127/0935-1221/2008/0020-1822 c 2008 E. Schweizerbart’sche Verlagsbuchhandlung, D-70176 Stuttgart
Transcript
Eur. J. Mineral.2008, 20, 447–463Published online June 2008 Paper presented at the symposium
“Granitic Pagmatites: the State of the Art”,Porto, May 2007
Quartz chemistry in polygeneration Sveconorwegian pegmatites,Froland, Norway
2 Geowissenschaftliches Zentrum Göttingen, Goldschmidtstr. 1, 37073 Göttingen, Germany
Abstract: Element concentrations in quartz, feldspar and biotite of Sveconorwegian (1.13–0.9 Ga) granitic pegmatites in Froland,Norway, were analysed by LA-ICP-MS, EPMA and XRF, respectively, in order to determine chemical variations between differentpegmatite types and within individual pegmatitic bodies. A refined classification of the syn-, late- and post-orogenic graniticpegmatites of Froland is presented basing on the pegmatite structure, bulk composition and mineral chemistry. Syn-orogenicpegmatites (1.13–1.06 Ga) are relative primitive with respect to granite differentiation. Late-orogenic pegmatites linked to theHerefoss pluton (0.93 Ga) have the most primitive composition and contain Fe phlogopite. Post-orogenic zinnwaldite pegmatites(< 0.93 Ga) are the most evolved. Pegmatitic quartz has an astonishingly consistent trace element signature between and withinsyn-orogenic pegmatites. Average concentrations are in the range of 6–10 μgg−1 for Li, 34–44 μgg−1 for Al, 4–8 μgg−1 for Ti,and 0.9–1.8 μgg−1 for Ge. Al, Li, Fe, Ge, and Ti in quartz of late- and post-orogenic and contact-metamorphosed syn-orogenicpegmatites are more variable. Micro-mylonitisation and contact metamorphism caused the lowering of Li and Al and the increase ofTi and Ge in pegmatitic quartz of some syn-orogenic granites. Several generations of secondary quartz replaced pegmatitic quartzat the micro scale (< 1 mm) during retrograde fluid-driven overprint. Secondary quartz is depleted in Al, Ti and Li comparedto the host quartz. In contrast to quartz, the feldspar and biotite chemistry depends largely on the differentiation degree of thepegmatites and varies significantly within structurally-zoned pegmatite bodies. Feldspar and biotite chemistry reflects changes inmelt composition within pegmatites, which includes a decrease of Mg and Sr and increase of Li, Rb, and Ba. The syn-orogenicpegmatites were formed during the crustal accretion on the western margin of Fennoscandia under constant PTX-conditions causingthe homogeneous trace element signature of quartz.
The pegmatites in southern Norway have attracted the at-tention of mineralogists for more than a century due to theircontents of rare-metal minerals (e.g., Brøgger, 1906), manyof them being discovered and described for the first time inthe world (e.g., Schetelig, 1922). However, few attemptshave been made to give details of the most common peg-matite minerals quartz, feldspar and mica. The chemistry ofquartz in the Froland pegmatite field, that developed duringthe Sveconorwegian orogeny (1.13–0.9 Ga) will be the ob-ject of this study. The 20 km NE-SW striking and 5-kmwide Froland field is in the centre of the south Norwe-gian pegmatite cluster is framed by the fields of Glamsland-Lillesand, Evje-Iveland, Arendal, and Kragerø (Fig. 1a, b).The mineralogy, mineral chemistry, geochronology, struc-tures and genesis of the pegmatites in these fields have beenstudied by Andersen (1926, 1931), Bjørlykke (1937), Åmli(1975, 1977), Baadsgaard et al. (1984), Ihlen et al. (2001,2002), Larsen (2002), Larsen et al. (2004), Henderson &
Ihlen (2004), and Müller et al. (2005). The Froland peg-matites comprise simple abyssal pegmatites with variablecontents of quartz, alkali feldspar, plagioclase, biotite, andminor white mica forming about 105 major granitic peg-matite bodies (Ihlen et al., 2001, 2002). REE minerals andother striking accessories are rare and thus the Froland fieldhas been of minor interest for mineralogists, but of large in-terest for the procelain and glass industry. 76 of the Frolandpegmatites were mined for feldspar and/or quartz since the19th century. Some pegmatites were mined for flaky micaand REE minerals.
Pegmatites can display both regional (e.g., Cerný, 1992;Malló et al., 1995; London, 1996) and internal composi-tional zoning (e.g., Cameron et al., 1949; Norton, 1983;London et al., 1989; London, 1996; Roda-Robles et al.,2004) on the basis of characteristic minerals and parage-nesis as well as the chemistry of minerals, such as feldspar,mica, tourmaline, garnet and accessory rare-metal miner-als. However, the chemistry of quartz has not been con-sidered until the beginning of the 21st century mainly
Fig. 1. a – Location of the pegmatite fields in southern Norway. b – Pegmatite occurrences and fields in southern Norway. c – Simplifiedgeologic map of the Froland area showing the distribution of major and sampled pegmatite occurrences. Sample localities: 1 – Våtåskammen,2 – Haukemyrliene, 3 – Lille Kleivmyr, 4 – Hellheia Middle, 5 – Hellheia North, 6 – Bjortjørn, 7 – Skåremyr, 8 – Sønnristjern, 9 – Løvland,10 – Vaselona, 11 – Fossheia West, 12 – Husefjell, 13 – Heimdal, 14 – Fossheia East, 15 – Metveit.
due to analytical limitations. Due to the increasing eco-nomic interest for quartz as raw material for high-T glassmoulds in the production of solar-grade silicon and otherhigh-tech end uses, the study of pegmatite quartz depositshas been intensified over the last years (e.g., Ihlen et al.,2001, 2002; Larsen et al., 2004; Müller et al., 2005). Thisis promoted by recent developments of micro-beam tech-niques enabling the precise determination of trace elementin quartz (Flem et al., 2002; Müller et al., 2003b).
The aim of this study is to reveal possible variationsin the quartz chemistry between different pegmatite typesand within individual pegmatites in Froland. For thatpurpose 14 pegmatite localities were investigated repre-senting different structural and compositional pegmatitetypes (Fig. 1c; Ihlen et al., 2001, 2002). Larger peg-matites (> 50 m) were sampled along several traversesacross different compositional zones. Quartz was investi-gated by scanning electron microscope cathodolumines-cence (SEM-CL) prior to trace element analyses in orderto reveal different quartz generations (primary and sec-ondary quartz) at micro-scale (0.001 to 10 mm). Traceelements in quartz (Li, Be, B, Ge, Na, Al, P, K, Ca, Ti,Fe) were analysed with laser ablation inductively coupledmass spectrometry (LA-ICP-MS). Al, Ti, K and Fe of sec-ondary quartz were analysed by electron probe micro anal-ysis (EPMA) due to small volumes of secondary quartz.The chemical signature of quartz is compared with thecomposition of feldspar and biotite to detect chemical re-lationships between these co-genetic minerals. This studyis a continuation of the work done by Larsen et al. (2004)who provided a general overview of the quartz and feldsparchemistry of the Evje and Froland pegmatite fields.
2. Geological setting
The Froland pegmatite field is situated in the Bamble-Lillesand block of southern Norway at the southwest-ern margin of the Fennoscandian shield (Andersen, 2005;Fig. 1a, b). The pegmatites form large tabular bodies anddykes emplaced in an isoclinally folded sequence of steeplydipping and NNE-SSW striking banded biotite-hornblendegneisses of volcano-sedimentary origin (Alirezaei, 2000).The gneisses are affected by amphibolite facies metamor-phism, possibly transitional to granulite facies as indicatedby orthopyroxene-bearing felsic gneisses (Elders, 1963)during the Sveconorwegian deformation in the period 1.14to ca. 0.9 Ga (e.g., Bingen et al., 1998). The precise ageof the pegmatites in Froland is uncertain, but U/Pb dat-ing elsewhere in the Bamble-Lillesand block yields ages inthe range 1128–1060 Ma (Baadsgaard et al., 1984; Coscaet al., 1998). This crustal block representing a segmentof the Sveconorwegian orogeny (1.13–0.9 Ga) comprisesan exhumed mid-crustal portion of a volcanic arc com-plex (Knudsen & Andersen, 1999), thrusted over the Tele-mark block along the Porsgrunn-Kristiansand Fault Zone(PKFZ) during the early Sveconorwegian (1.15–1.10 Ga;e.g., Bingen et al., 2001, 2002). The 5-km wide Frolandpegmatite field is situated in the hanging wall of the PKFZwhere it can be followed over a distance of ca. 20 km inNE-SW direction. The PKFZ is interpreted as a northwest-directed long-lived and polyphase fault zone initiated un-der amphibole facies conditions (Starmer, 1993; Henderson& Ihlen, 2004) when the injection of the majority of peg-matites occurred in the Froland and Glamsland-Lillesandfields (Henderson & Ihlen, 2004). These two pegmatite
Quartz chemistry in pegmatites 449
fields, that together comprise a belt of pegmatites with sim-ilar bulk compositions, are separated by the Herefoss gran-ite pluton (Ihlen et al., 2002). The circular Herefoss plu-ton (diameter 18 km) intruded at 0.93 Ga (Andersen, 1997;Andersen et al., 2002) into the central part of the olderGlamsland-Lillesand-Froland pegmatite belt (Fig. 1b). Thepluton carries mega-enclaves of gneisses (several km inlength) in its northern and central part where these gneisseshost similar compositional types of pegmatites as in theFroland pegmatite field to the north outside the pluton.
3. Classification of Froland pegmatites
The pegmatite field of Froland comprises different types ofgranitic pegmatites of the abyssal class, some transitionalto AB-HREE pegmatites (Cerný & Ercit, 2005). Represen-tative localities of the different pegmatite types which werestudied are characterised in Table 1, which is depositedand freely available on the EJM website at GeoScience-World (http://eurjmin.geoscienceworld.org/). For more de-tailed information see Müller et al. (2005).
The Froland pegmatites formed during the Sveconor-wegian orogeny, i.e. syn-orogenic (1.13–1.06 Ga), late-orogenic (0.93 Ga; syn-genetic in respect to the emplace-ment of the Herefoss pluton) and post-orogenic (< 0.93 Ga;Ihlen et al. 2002). The largest volume of pegmatites formedduring the syn-orogenic stage (Henderson & Ihlen, 2004).
Ihlen et al. (2002) subdivided the syn-orogenic peg-matites into a number of sub-groups on the basis of theirmajor mineral composition including pegmatitic granites(PGr), granite pegmatites (GP), plagioclase-dominant peg-matites (NaP, Fig. 2a), zoned granitic pegmatites (ZoP,Fig. 2b, c) and K-feldspar-dominant pegmatites (KP), andwhite mica pegmatites (MP1). Their injection is roughlycoeval, although several magma pulses can be distin-guished by cross-cutting relationships in the individual ar-eas. The distinction between these pegmatite types is notalways obvious, because transitional pegmatites also occur.Some of the ZoP (Vaselona and Fossheia West) which arein the contact aureole of the Herefoss pluton were affectedby contact metamorphism and micro-shearing (shearedzoned pegmatites – sZoP). PGr, GP, NaP, and ZoP arecrosscut by fine- to medium grained biotite granite dykes(BtGr).
The late-orogenic pegmatites form one structural type,i.e. zoned pegmatites linked to the Herefoss pluton em-placement. The Herefoss pluton itself consists of fourmajor granite facies (HGr1-4). HGr1 and HGr2 showdevelopment of pegmatite segregations in their interiorand frequently along their endocontacts. The pegmatite atHeimdal (HP1) is related to the megacrystic leucogran-ite HGr1 and the pegmatites at Fossheia East and Metveit(HP2) to the coarse-grained biotite quartz monzonite(HGr2; Fig. 1c).
The post-orogenic pegmatites are represented by zin-nwaldite pegmatites (MP2) which comprise < 1 m thickdykes. These straight MP2 dykes crosscut all older peg-matite generations. They contain comb quartz and K-feldspar and show internal banding similar to layered
pegmatites related to highly fractionated granites rich in Li,F and Mn (e.g., Morgan & London, 1999).
Laser ablation inductively coupled plasma mass spectrom-etry, LA-ICP-MS, was applied for the in situ determina-tion of Li, Be, B, Ge, Na, Al, K, Ti and Fe in quartz. TheICP-MS used in this study is a double focusing sector fieldinstrument (model-ELEMENT-1, Finnigan MAT, Bremen,Germany) combined with a Finnigan MAT UV laser probe.Operating conditions of the LA-ICP-MS are listed in Ta-ble 2. The 266-nm laser had a repetition rate of 20 Hz, andpulse energy of 1.5–1.6 mJ with continuous ablation on anarea of approximately 180 × 200 μm. The laser beam wasadjusted to give a spot size of approximately 20 μm.
External calibration was done using four silicate glassreference materials produced by the National Institute ofStandards and Technology (NIST SRM 610, NIST SRM612, NIST SRM 614, NIST SRM 616). In addition, thestandard reference material NIST 1830, soda-lime floatglass (0.1 wt.% Al2O3) from NIST, the high purity silicaBCS 313/1 reference sample from the Bureau of AnalysedSamples, UK, the certified reference material “pure sub-stance No. 1” silicon dioxide SiO2 from the Federal Insti-tute for Material Research and Testing, Berlin, Germanyand the Qz-Tu synthetic pure quartz monocrystal providedby Andreas Kronz from the Geowissenschaftliches Zen-trum Göttingen (GZG), Germany, were used. Each mea-surement consists of 15 scans of each isotope, with a mea-surement time varying from 0.15 s per scan of K in highresolution to 0.024 s per scan of, e.g. Li in low resolu-tion. An Ar-blank was run before each standard and samplemeasurement. The background signal was subtracted fromthe instrumental response of the standard before normali-sation against the internal standard. This was done to avoidmemory effects between samples. A weighted linear re-gression model including several measurements of the dif-ferent standard was applied for calculation of the calibra-tion curve for each element. 10 successive measurementson the Qz-Tu were used to estimate the limits of detections(LOD). LOD are based on 3 times standard deviation (3σ)of the 10 measurements divided by the sensitivity S. LODare 1.6 μgg−1 for Li, 0.3 for Be, 0.3 for B, 50 for Na, 4 forAl, 10 for P, 0.2 for Ge, 0.5 for Ti, 1 for K, and 0.2 for Fe.Flem et al. (2002) gave a more detailed description of themeasurement procedure.
4.2. Electron-microprobe analysis
Electron-microprobe analysis (EPMA) was applied to de-termine the Al, Ti, K and Fe distribution across domains ofsecondary quartz, since this method provides in situ traceelement data with a very good spatial resolution down to5 μm. The analysis spot of the LA-ICP-MS is too large
450 A. Müller, P.M. Ihlen, A. Kronz
Fig. 2. Three cross sections of representative pegmatites exposed by historical mining activity. The insets right below the cross sectionssimplify the pegmatite zoning. a – View of the SE-NW striking wall of the Hellheia Middle quarry. b – SW-NE striking wall of theSkåremyr quarry. c – SW-NE striking wall of the Sønnristjern quarry.
(180 × 200 × 80 μm) to be placed accurately inside sec-ondary quartz which normally forms domains < 100 μm.Moreover, the high number of fluid inclusions within thesecondary quartz would probably cause the adulterationof many of the LA-ICP-MS analyses by elements origi-nating from the trapped fluids (e.g., Na, K, B). The mi-croprobe analyses were performed with a JEOL 8900 RLelectron microprobe at the Geowissenschaftliches Zentrum
Göttingen, Germany. For high precision and sensitivity, abeam current of 80 nA, a beam diameter of 5 μm, andcounting times of 15 s for Si, and of 300 s for Al, Ti, K, andFe were used. Detection limits (3σ of single point back-ground) were 60 μgg−1 for Al, 18 μgg−1 for K, 33 μgg−1
for Ti, and 27 μgg−1 for Fe. Müller et al. (2003a, 2003b)gave a more detailed description of the measurement pro-cedure.
Quartz chemistry in pegmatites 451
Table 2. Operating parameters of the LA-ICP-MS and key methodparameters.
Plasma conditionsplasma power 1075 Wauxiliary gas flow 0.89 l/minsample gas flow 1.1–1.2 l/mincone high performance NiCD-1 guard electrode yesData collectionscan type E-scanno. of scans 15
4.3. Scanning electron microscopecathodoluminescence
Scanning electron microscope cathodoluminescence(SEM-CL) images were obtained from polished thin sec-tions coated with carbon using the LEO 1450VP analyticalSEM with an attached CENTAURUS BS BIALKALItype cathodoluminescence (CL) detector. The appliedacceleration voltage and current at the sample surface were20 kV and ∼ 3 nA, respectively. The BIALKALI tube hasa CL response range from 300 (violet) to 650 nm (red). Itpeaks in the violet spectrum range around 400 nm. The CLimages were collected from one scan of 43 s photo speedand a processing resolution of 1024 × 768 pixels and 256grey levels. The brightness and contrast of the collectedCL images were improved with the PhotoShop software.
SEM-CL has been applied to quartz in order to revealon micro-scale (< 1 mm) growth zonation, alteration struc-tures and different quartz generations. Grey-scale contrastsvisualised by SEM-CL are caused by the heterogeneousdistribution of lattice defects (e.g., oxygen and silicon va-cancies, broken bonds) and trace elements in the crystal lat-tice (e.g., Sprunt, 1981; Ramseyer et al., 1988; Perny et al.,1992; Stevens Kalceff et al., 2000; Götze et al., 2001; 2004,2005). Although the physical background of the quartz CLis not fully understood, the structures revealed by CL giveinformation about crystallisation, deformation and fluid-driven overprint.
5. Chemical characterisationof major pegmatite minerals
The scope of the study is to characterise the the trace el-ement composition of quartz in different pegmatite gen-erations to indentify processes that generate high purityquartz. In this context, the chemistry of feldspar and micais important in order to evaluate the degree of fractiona-tion of the pegmatitite melts and their precise crystallisa-tion conditions. One sample of K-feldspar, plagioclase, bi-otite and/or muscovite was taken per sample point, if themineral occurred less than 0.5 m away from the sampledquartz. Five of the larger pegmatites (Løvland, HellheiaMiddle, Skåremyr, Sønnristjern, Lille Kleivmyr) were mul-tiple sampled along longitudinal traverses crossing the peg-matite bodies in order to reveal possible distribution pat-terns among the elements. The distances between sample
points of the traverses were 4 to 65 m depending on peg-matite heterogeneties, structures, size of exposures, and di-mensions of the pegmatites.The longest sampling longitu-dinal traverse of 208 m was taken from the Sønnristjernpegmatite crossing the zoned core (ZoP) and the host gran-ite pegmatite (GP).
5.1. Composition of feldspars
Rb, Sr, and Ba in K-feldspar and plagioclase are sensi-tive to igneous differentiation and to the differentiation ofpegmatite-forming melts (Mehnert & Büsch, 1981; Long& Luth, 1986; Cox et al., 1996). Generally, Ba and Sr de-crease and Rb increases in feldspar during magmatic dif-ferentiation. However, granite magmas crystallise underequlibrium conditions whereas pegmatite melts crystalliseunder super-cooled conditions far from the equilibrium orgranite liquidus (e.g., Chakoumakos & Lumpkin, 1990;Morgan & London, 1999; Webber et al., 1999). Therefore,the crystal and, thus, the element fractionation is different(London, 2005), i.e. of Rb, Sr and Ba.
The composition of 79 pegmatitic feldspar crystals be-tween 0.1 and 2.5 m in size were determined. Con-centrations of major and trace elements are shown inFig. 3 to 5. The analytical results for feldspar arelisted in Table 3, which is deposited and freely avail-able on the EJM website at GeoScienceWorld (http://eurjmin.geoscienceworld.org/). The average bulk compo-sition of K-feldspar and plagioclase from syn- and late-orogenic pegmatites vary from Or79Ab21 to Or84Ab16and from Ab82An12Or6 to Ab75An21Or4, respectively.Feldspars from Hellheia North (locality 5) and Vaselona(locality 10) were presumably affected by albitisation re-sulting in a higher Ab content in K-feldspars (Ab23−25) andplagioclases (Ab87−88). ZoP, GP and PGr contain the mostpotassium rich K-feldspars (> 13 wt.% K2O) and, thus,the K2O content in K-feldspar seems to be related to thepegmatite type. High K2O (> 13 wt.%) is the requirementfor glass- and ceramic-grade K-feldspar and, thus, the K-feldspar of ZoP, GP, and PGr has high feldspar quality. Thebulk composition of K-feldspars from post-orogenic peg-matites and granites (HP) is more variable (Or75Ab24An1to Or83Ab16An1).
Ba, Rb, Sr, Ga, and Pb in K-feldspar and Sr and Rb in pla-gioclase show only slight variations between the differentpegmatite types and distinct variations within the individ-ual pegmatites (e.g., Hellheia Middle, Sønnristjern, LilleKleivmyr; Fig. 3). The element variation is higher for largeZoP and GP pegmatites than for small pegmatites.
K-feldspar of the Lille Kleivmyr locality cover the broad-est range of Rb/(Sr+Ba) ratios. Lille Kleivmyr is the largestof the investigated pegmatites. The variation of Rb/Sracross the pegmatites at Løvland (KP) and Våtåskammen(PGr) is minor which is in agreement with the composi-tional homogeneity of these pegmatites. The Rb/Sr ratios ofNaP plagioclase, e.g. Hellheia Middle, are almost constant.Plagioclase from Skåremyr (ZoP) shows a strong increasein differentiation from the SE towards the NW edge of thepegmatite (Fig. 2b). A similar scenario is also obtained
452 A. Müller, P.M. Ihlen, A. Kronz
Fig. 3. Concentration variation diagrams of major and trace elements in K-feldspar and plagioclase from Froland pegmatites. Grey arrowsindicate the general magmatic differentiation trend.
from Haukemyrliene PGr. A strong zoning in Rb/(Sr+Ba)of K-feldspar and of Rb/Sr in plagioclase is developedacross the Sønnristjern pegmatite (Fig. 4 and 5). The gran-ite pegmatite hosting the zoned core has feldspar with con-sistently low ratios. The ratios strongly increase within thezoned pegmatite core. Increasing ratios reflect higher frac-tionation of the residual melt from which the feldspar grew,as long as ratios are not disturbed by secondary feldsparalteration. Generally, the fractionation trends can be bet-ter obtained from the Rb/Sr ratios of plagioclase than byRb/(Sr+Ba) of K-feldspar.
Megacrystic feldspars (> 1 m) in the core of ZoP and GPcan show internal chemical zoning with higher Rb/Sr andRb/(Sr+Ba) in the core than at the margin. For example,the core of plagioclase (sample 2009411) from Sønnristjernhas a more primitive composition (Rb/Sr = 0.04) than thecrystal margin (Rb/Sr = 0.22). The core composition corre-sponds to the primitive composition of plagioclase from thepegmatite contact (e.g., sample 2009402 in Fig. 4). Gener-ally, feldspar megacrysts were sampled at their margins toproduce comparable data.
By summarizing, the following differentiation trends forthe Froland pegmatites can be revealed by feldspar chem-istry. Feldspars from MP dykes at Skåremyr and HellheiaMiddle, Løvland (KP), Hellheia North (NaP), Vaselona(sheared ZoP) have the most evolved chemistry. How-ever, the high degree of differentiation exhibited by theNaP Hellheia North is in conflict with its plagioclase-
dominance and biotite chemistry (see following chapters)and the primitive composition of the related and neighbour-ing Hellheia Middle pegmatite. The Hellheia North pla-gioclases were presumably affected by albitisation whichresulted in re-distribution of Sr, Ba and/or Rb. Sønnrist-jern (ZoP), Skåremyr (ZoP), Våtåskammen (PGr), LilleKleivmyr (GP), Vaselona (sheared ZoP), Bortjørn (NaP)contain feldspars of chemical composition reflecting mod-erate differentiation of the pegmatitic melt. Pegmatites re-lated to the Herefoss pluton (HP) exhibit a relative primi-tive differentiation reflected by high Ba and low Rb/Sr inthe feldspars. The chemically most primitive plagioclaseoccurs at Hellheia Middle (NaP). However, the trace ele-ment signature of feldspar in the Froland pegmatite fieldis relatively primitive compared to feldspars from othergranitic pegmatite fields elsewhere in the world (Sheareret al., 1992; Abad-Ortega et al., 1993; Larsen, 2002).
5.2. Composition of micas
The composition of 40 pegmatitic micas were determinedand plotted in Fig. 4, 6 and 7. The analytical resultsfor mica are listed in Table 4, which is deposited andfreely available on the EJM website at GeoScienceWorld(http://eurjmin.geoscienceworld.org/). Their compositionsare used to estimate the degree of fractionation of the
Quartz chemistry in pegmatites 453
Fig. 4. Sønnristjern pegmatite with outline of the 10-m deep quarry and access tunnel. The exploited zoned pegmatite core is hosted bygranite pegmatite which intruded hornblende gneisses. The black columns illustrate the relative values of Rb/(Ba+Sr), Rb/Sr, and (Mg-Li)/Fe# in K-feldspar, plagioclase and biotite, respectively. Columns are placed at the sampling point.
pegmatites since micas are useful monitors of PTX duringmagmatic processes (e.g., Cerný & Burt, 1984).
Generally, the biotites in the Froland pegmatites have arelatively homogeneous composition which is characteris-tically primitive in respect to granitic differentiation. All bi-otites plot in the Mg-siderophyllite and Fe-phlogopite fieldin the discrimination diagram of Tischendorf et al. (2001;Fig. 6). Biotites in different pegmatite types exhibit slightcompositional variations. The most primitive compositions(Fe-phlogopite) are comprised by the micas from peg-matites related to the Herefoss pluton. NaP has micas tran-sitional between Fe-phlogopite and Mg-siderophyllite. Bi-otites of GP and ZoP plot exclusively in the Fe-phlogopitefield reflecting a slightly evolved differentiation.
A number of pegmatites are crosscut by zinnwaldite peg-matites (MP1 and MP2). The mica of these dykes havezinnwaldite (Fe polylithionite) composition except for themica occurring in the Vaselona pegmatite that represents aLi-Fe muscovite with relative high Ti.
Sampling profiles across the Hellheia Middle, Skåremyr,Sønnristjern and Lille Kleivmyr pegmatite reveal no obvi-ous zonation across pegmatites due to the limited chemicalvariation of biotite (Fig. 4). In Fig. 7 Rb/Sr in plagioclaseand Rb/(Ba+Sr) in K-feldspar are plotted against Mg-Liof associated biotite. The plots reveal poorly defined tends
although the small Mg-Li variation. Mg-Li of biotite de-creases with increasing Rb/Sr and Rb/(Ba+Sr) of feldsparduring progressive fractionation. Thus, biotites of the fourlocalities show weak chemical zonation in pegmatites thatfollows the compositional zonation of feldspar.
5.3. Micro-textures in cathodoluminescence imagesof quartz
Late- to post-magmatic fluid-driven overprint causes small-scale quartz dissolution and precipitation (healing) alonggrain boundaries and micro-cracks resulting in the forma-tion of newly crystallised (secondary) quartz which appearsdark grey to black in SEM-CL images. If the CL inten-sity of the primary quartz is low or if the CL intensity de-creases during electron bombardment these structures arehard to detect. For this study the knowledge about differ-ent quartz generations and abundance of secondary quartzis a necessity in order to interpret the trace element analy-ses of quartz properly (e.g., Müller et al., 2002a). DifferentCL intensities may indicate variable trace element contents(e.g., Götze et al., 2001).
Henderson (2002) gave an overview of secondary mi-cro structures observed in pegmatitic quartz from Froland.
454 A. Müller, P.M. Ihlen, A. Kronz
Fig. 5. Stacked column diagram of Rb/(Ba+Sr) and Rb/Sr infeldspars (upper part) and of Al, Ti, Li and Ge in pegmatite quartzalong a 210 m long profile crossing the Sønnristjern pegmatite. Con-centrations of trace elements in quartz are the average of two LA-ICP-MS measurements. The numbers between the columns in thelower line corresponds to distance between two sample points inmeter. n.d. – not determined due to lack of feldspar at the samplepoint.
Fig. 6. Compositions of micas from the Froland pegmatite field plot-ted in classification diagram of Tischendorf et al. (2001). MP1 mi-cas of the Hellheia Middle, Hellheia North, Skåremyr, and Vaselonapegmatite plot in the Fe polylithionite and Li-Fe muscovite fields.tFe – Fe total.
Four major types of secondary quartz (sqz1 to sqz4) replac-ing primary pegmatitic quartz (pqz) can be distinguished.The features and abundance of the secondary quartz gen-erations are summarised for the different pegmatites in Ta-ble 5. The different types of secondary quartz are describedin the order from young to old:
Fig. 7. Minor element plots of biotite versus plagioclase (a) andK-feldspar (b). The dashed lines of exponential regression definespoorly differentiation trends.
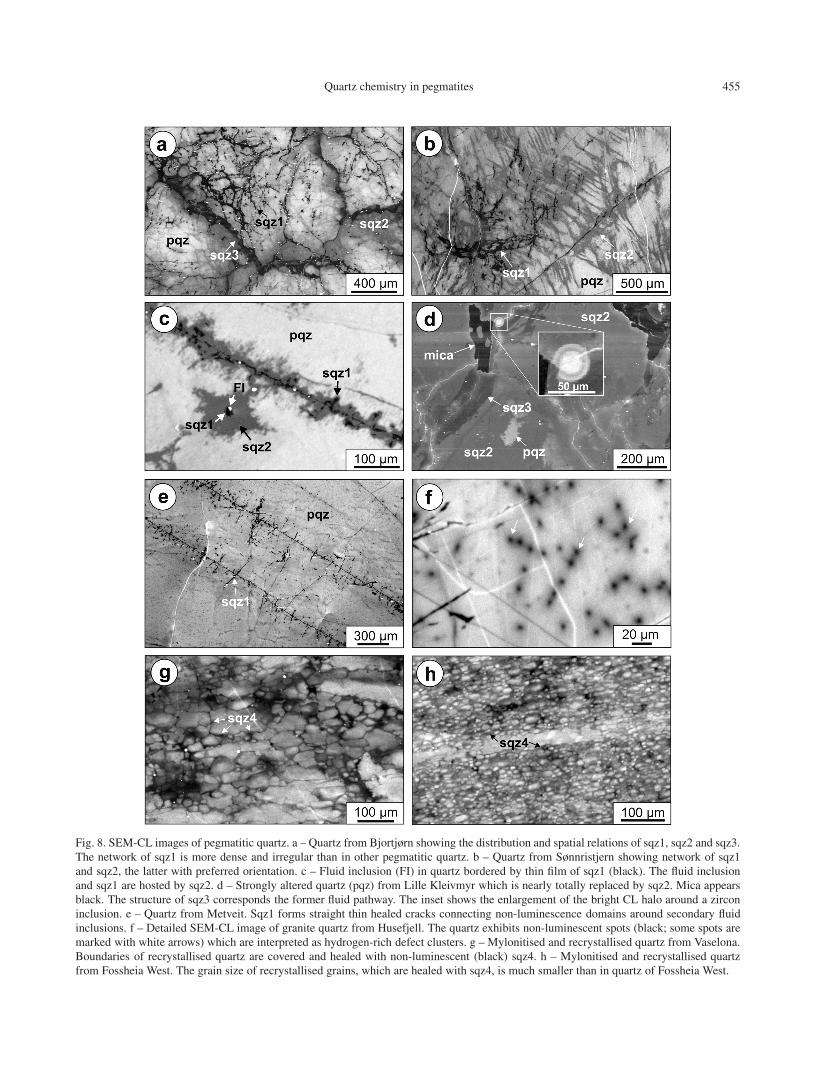
sqz1: Thin (< 5 μm), intra- and transgranular healedcracks connecting non-luminescent domains around sec-ondary fluid inclusions. These structures appear black inthe SEM-CL image (Fig. 8a, b, c, e).
sqz2: Irregular domains of low-luminescent quartz ex-tending from and commonly enveloping sqz1. Occasion-ally, the envelops extend outwards as preferentially ori-ented zones in certain directions which may correspond tothe crystallographic plans or sets of micro-fractures. Sim-ilar to sqz1, sqz2 originates in grain and sub-grain bound-aries (Fig. 8a, d), spz1-healed micro-fractures (Fig. 8b) orfluid inclusions (Fig. 8c). These structures appear grey inthe SEM-CL image.
sqz3: Diffuse alteration rims of relative constant widthparallel to grain and sub-grain boundaries and contacts tofeldspar and mica. In contrast to sqz1, sqz3 is not trans-granular and it exhibits sporadically diffusional, wavy zon-ing. However, in some cases sqz1 and sqz3 are hard to dis-tinguish. Sqz3 structures appear dark grey in the SEM-CLimage (Fig. 8a and d).
sqz4: Non-luminescent (black), thin crystal coatings andinterstitial fillings at triple-junction boundaries of recrys-tallised quartz (Fig. 8g and h). Sqz4 dominates the quartzsamples from the Fossheia West and Vaselona pegmatites.
Quartz chemistry in pegmatites 455
Fig. 8. SEM-CL images of pegmatitic quartz. a – Quartz from Bjortjørn showing the distribution and spatial relations of sqz1, sqz2 and sqz3.The network of sqz1 is more dense and irregular than in other pegmatitic quartz. b – Quartz from Sønnristjern showing network of sqz1and sqz2, the latter with preferred orientation. c – Fluid inclusion (FI) in quartz bordered by thin film of sqz1 (black). The fluid inclusionand sqz1 are hosted by sqz2. d – Strongly altered quartz (pqz) from Lille Kleivmyr which is nearly totally replaced by sqz2. Mica appearsblack. The structure of sqz3 corresponds the former fluid pathway. The inset shows the enlargement of the bright CL halo around a zirconinclusion. e – Quartz from Metveit. Sqz1 forms straight thin healed cracks connecting non-luminescence domains around secondary fluidinclusions. f – Detailed SEM-CL image of granite quartz from Husefjell. The quartz exhibits non-luminescent spots (black; some spots aremarked with white arrows) which are interpreted as hydrogen-rich defect clusters. g – Mylonitised and recrystallised quartz from Vaselona.Boundaries of recrystallised quartz are covered and healed with non-luminescent (black) sqz4. h – Mylonitised and recrystallised quartzfrom Fossheia West. The grain size of recrystallised grains, which are healed with sqz4, is much smaller than in quartz of Fossheia West.
456 A. Müller, P.M. Ihlen, A. Kronz
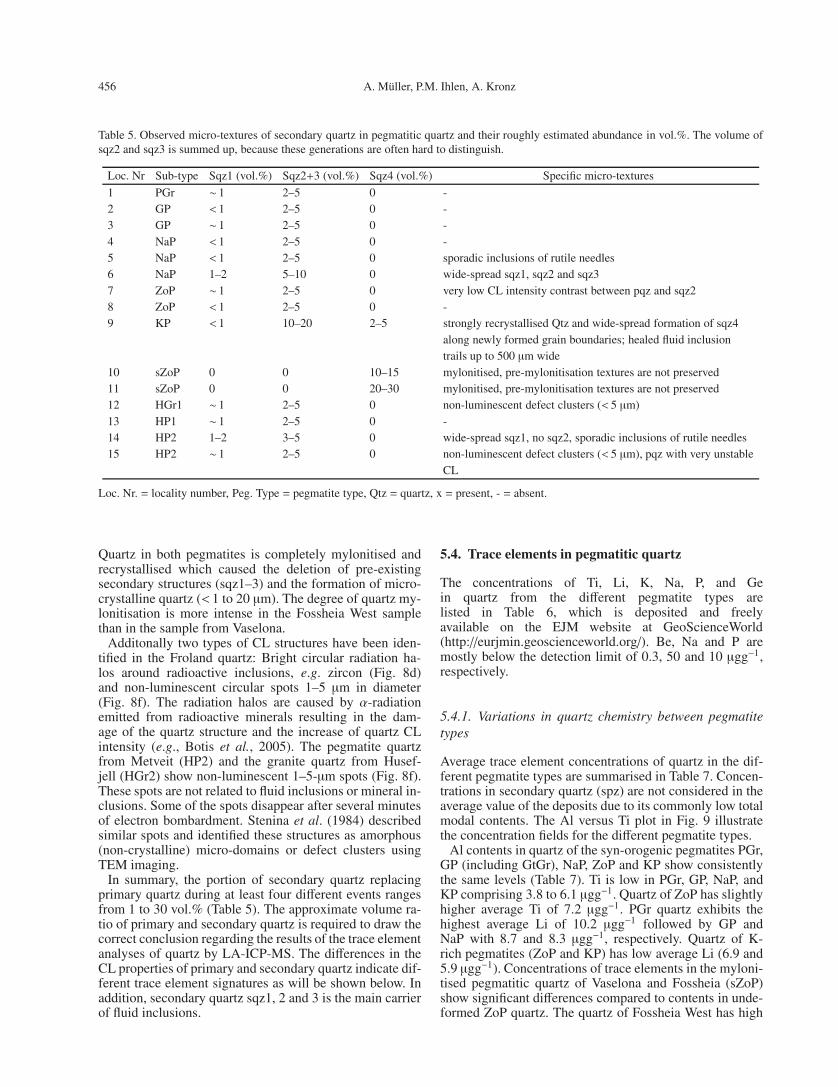
Table 5. Observed micro-textures of secondary quartz in pegmatitic quartz and their roughly estimated abundance in vol.%. The volume ofsqz2 and sqz3 is summed up, because these generations are often hard to distinguish.
Loc. Nr Sub-type Sqz1 (vol.%) Sqz2+3 (vol.%) Sqz4 (vol.%) Specific micro-textures
1 PGr ∼ 1 2–5 0 -2 GP < 1 2–5 0 -3 GP ∼ 1 2–5 0 -4 NaP < 1 2–5 0 -5 NaP < 1 2–5 0 sporadic inclusions of rutile needles6 NaP 1–2 5–10 0 wide-spread sqz1, sqz2 and sqz37 ZoP ∼ 1 2–5 0 very low CL intensity contrast between pqz and sqz28 ZoP < 1 2–5 0 -9 KP < 1 10–20 2–5 strongly recrystallised Qtz and wide-spread formation of sqz4
along newly formed grain boundaries; healed fluid inclusiontrails up to 500 μm wide
10 sZoP 0 0 10–15 mylonitised, pre-mylonitisation textures are not preserved11 sZoP 0 0 20–30 mylonitised, pre-mylonitisation textures are not preserved12 HGr1 ∼ 1 2–5 0 non-luminescent defect clusters (< 5 μm)13 HP1 ∼ 1 2–5 0 -14 HP2 1–2 3–5 0 wide-spread sqz1, no sqz2, sporadic inclusions of rutile needles15 HP2 ∼ 1 2–5 0 non-luminescent defect clusters (< 5 μm), pqz with very unstable
CL
Loc. Nr. = locality number, Peg. Type = pegmatite type, Qtz = quartz, x = present, - = absent.
Quartz in both pegmatites is completely mylonitised andrecrystallised which caused the deletion of pre-existingsecondary structures (sqz1–3) and the formation of micro-crystalline quartz (< 1 to 20 μm). The degree of quartz my-lonitisation is more intense in the Fossheia West samplethan in the sample from Vaselona.
Additonally two types of CL structures have been iden-tified in the Froland quartz: Bright circular radiation ha-los around radioactive inclusions, e.g. zircon (Fig. 8d)and non-luminescent circular spots 1–5 μm in diameter(Fig. 8f). The radiation halos are caused by α-radiationemitted from radioactive minerals resulting in the dam-age of the quartz structure and the increase of quartz CLintensity (e.g., Botis et al., 2005). The pegmatite quartzfrom Metveit (HP2) and the granite quartz from Husef-jell (HGr2) show non-luminescent 1–5-μm spots (Fig. 8f).These spots are not related to fluid inclusions or mineral in-clusions. Some of the spots disappear after several minutesof electron bombardment. Stenina et al. (1984) describedsimilar spots and identified these structures as amorphous(non-crystalline) micro-domains or defect clusters usingTEM imaging.
In summary, the portion of secondary quartz replacingprimary quartz during at least four different events rangesfrom 1 to 30 vol.% (Table 5). The approximate volume ra-tio of primary and secondary quartz is required to draw thecorrect conclusion regarding the results of the trace elementanalyses of quartz by LA-ICP-MS. The differences in theCL properties of primary and secondary quartz indicate dif-ferent trace element signatures as will be shown below. Inaddition, secondary quartz sqz1, 2 and 3 is the main carrierof fluid inclusions.
5.4. Trace elements in pegmatitic quartz
The concentrations of Ti, Li, K, Na, P, and Gein quartz from the different pegmatite types arelisted in Table 6, which is deposited and freelyavailable on the EJM website at GeoScienceWorld(http://eurjmin.geoscienceworld.org/). Be, Na and P aremostly below the detection limit of 0.3, 50 and 10 μgg−1,respectively.
5.4.1. Variations in quartz chemistry between pegmatitetypes
Average trace element concentrations of quartz in the dif-ferent pegmatite types are summarised in Table 7. Concen-trations in secondary quartz (spz) are not considered in theaverage value of the deposits due to its commonly low totalmodal contents. The Al versus Ti plot in Fig. 9 illustratethe concentration fields for the different pegmatite types.
Al contents in quartz of the syn-orogenic pegmatites PGr,GP (including GtGr), NaP, ZoP and KP show consistentlythe same levels (Table 7). Ti is low in PGr, GP, NaP, andKP comprising 3.8 to 6.1 μgg−1. Quartz of ZoP has slightlyhigher average Ti of 7.2 μgg−1. PGr quartz exhibits thehighest average Li of 10.2 μgg−1 followed by GP andNaP with 8.7 and 8.3 μgg−1, respectively. Quartz of K-rich pegmatites (ZoP and KP) has low average Li (6.9 and5.9 μgg−1). Concentrations of trace elements in the myloni-tised pegmatitic quartz of Vaselona and Fossheia (sZoP)show significant differences compared to contents in unde-formed ZoP quartz. The quartz of Fossheia West has high
Quartz chemistry in pegmatites 457
Table 7. Average concentration of trace elements in quartz of the different pegmatite and granite types. Analyses of secondary quartz arenot considered (see Table 6). Average concentrations of quartz from the Vaselona and Fossheia pegmatite are given separately due to theirdifferent degree of deformation. Na is below the detection limit of 50 μgg−1.
Type Sub-Type Locality name n Li Be B Al Ge Ti K FeSyn- PGr Våtåskammen 4 10.2 < 0.30 < 1.00 34.4 0.88 3.8 < 1 < 0.24orogenic GP Sønnristjern, Lille Kleivmyr, 44 8.7 < 0.30 < 1.41 40.3 1.37 6.1 < 1.8 < 0.24
Fig. 9. Al versus Ti plot of pegmatitic quartz grouped according topegmatite type. Increasing Ti in quartz indicates increasing crystalli-sation temperature (Wark & Watson, 2006) and, therefore, quartz inHerefoss quartz monzonites and pegmatites (HGr1 and HGr2) andhigh-temperature deformed pegmatites (sZoP) have the highest lev-els of Ti.
Ge (2.4 μgg−1) and Ti (29 μgg−1), and exceptional low Li(0.3 μgg−1) and Al (26.2 μgg−1). The Vaselona quartz hashighest Ge (2.8 μgg−1), high Ti (16.3 μgg−1), and relativelylow Li (4.3 μgg−1). The mylonitisation combined with con-tact metamorphism which affected the Fossheia West peg-matite more intensely may have caused the redistributionof trace elements whereby Ti and Ge were introduced tothe quartz lattice and Al and Li expelled.
The chemistry of the quartz in the biotite granite dykes(BtGr) crosscutting the pegmatites is characterised bylower average Al (18.3 μgg−1) and Ge (1.0 μgg−1) andslightly higher Ti (7.4 μgg−1) compared to that of their peg-matite hosts. However, the differences in concentration be-tween the syn-orogenic pegmatites and the biotite granitedykes are minor.
The two subtypes of zinnwaldite-bearing pegmatite dykesMP1 and MP2, subdivided on the basis of textural fea-tures (Table 1), show significant differences in their Li, Al,Ti, K and Fe content (Table 7). However, both of themhave high average Ge (2.0 and 2.1 μgg−1) compared to theother pegmatite types. The MP2 at Haukemyrliene exhibitsa very distinct element signature characterised by high Al(122 μgg−1), Ti (15.5 μgg−1), and K (18.2 μgg−1) and lowLi (3.6 μgg−1).
Quartz of the Herefoss leucogranite (HGr1) and quartzmonzonite (HGr2) is characterised by high average Ti (33.4and 24.6 μgg−1) and K (5.4 and 4.2 μgg−1) and low Ge(0.8 μgg−1). The Herefoss pluton related HP1 and HP2 peg-matitic quartz has high Ti (26.3 and 17.5 μgg−1) and K andrelative low Li compared to the syn-orogenic pegmatites.Similar Li, Al, K and Fe concentrations in the quartz ofHerefoss granites and related pegmatites underline theirgenetic relationship. The slightly lower Ti in the HPs isrelated to the lower formation temperature (Wark & Wat-son 2006) of the pegmatite quartz compared to the granitequartz.
Most syn-orogenic pegmatites (Løvland, Hellheia Mid-dle and North, Bjortjørn, Skåremyr Sønnristjern, LilleKleivmyr) represent quartz of medium quality in a raw ma-terial context (Harben, 2002; Müller et al., 2005) with rela-tively similar trace element concentrations independentlyof pegmatite type (Fig. 9). However, syn-orogenic peg-matites, which occur in the contact aureole of the Herefoss
458 A. Müller, P.M. Ihlen, A. Kronz
Fig. 10. Pegmatites with stacked columns of the Al, Ti, Li, andGe concentration (average of 2 analyses) in pegmatitic quartz, a –Skåremyr pegmatite, b – Sønnristjern pegmatite.
pluton and in mega enclaves within the Herefoss pluton(sZoP) are characterised by relative high Ti. Most of theHPs contain low quality quartz apart from the Fossheia Eastpegmatite which contains medium quality quartz.
5.4.2. Variations in quartz chemistry within pegmatites
Quartz samples were taken along traverses in the individ-ual pegmatite bodies in order to reveal possible distributionpatterns among the trace elements. Figure 5 and 10 illus-trates the distribution of Al, Ti, Li and Ge in pegmatitequartz in form of stacked concentration columns across theSønnristjern and Skåremyr pegmatites. Generally, the traceelement contents of quartz show small variations across thepegmatites. However, there are some exceptions. For exam-ple, analyses of sample 2209405 of the Løvland pegmatite
yield much lower Ti than the other samples (Table 6). Thissample contains more than 25 vol.% of secondary quartz,which causes the general lowering of the average trace el-ement concentration (see below). Summarising, there ap-pears to be no clear systematic variations of the trace ele-ment contents of quartz across the pegmatites. The resultstestify to a rather homogeneous distribution of the testedtrace elements Al, Ti, Li, Ge, Fe in quartz across differentpegmatite zones.
5.4.3. Quartz chemistry of primary versus secondaryquartz
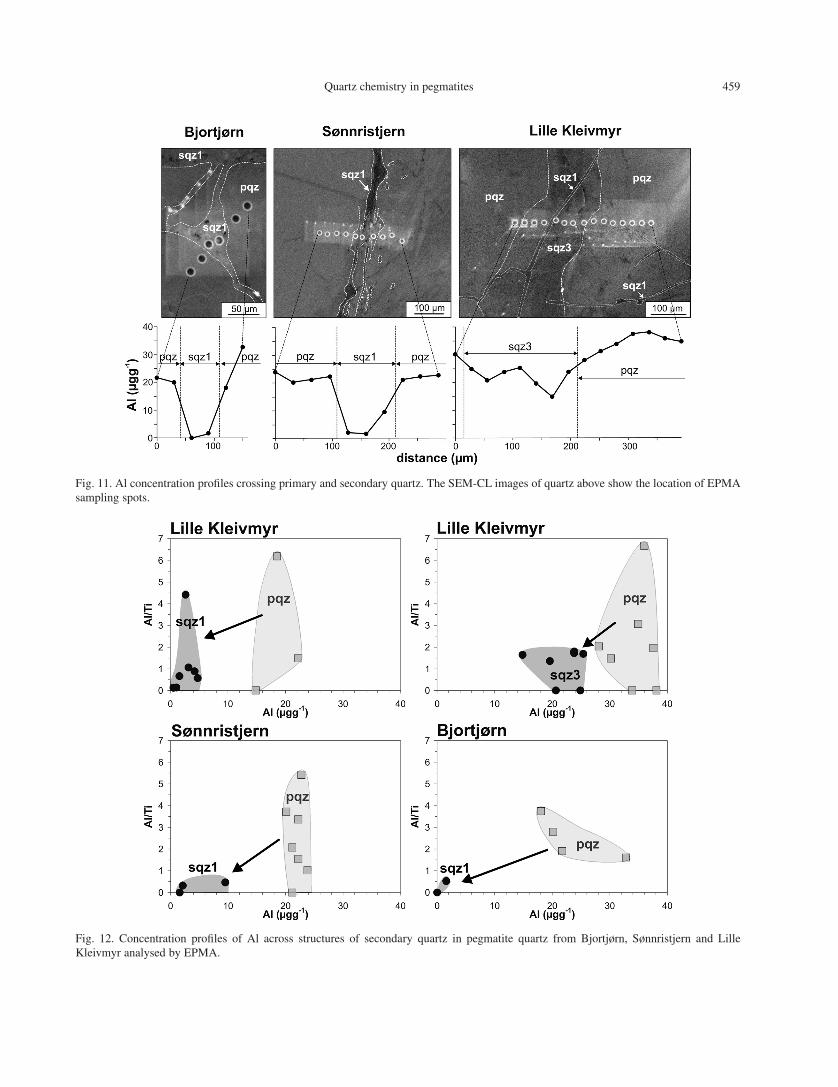
Al, Ti, K and Fe distribution across domains of secondaryquartz was determined by EPMA. Figure 11 shows 3 con-centration profiles of Al across structures of secondaryquartz in pegmatitic quartz from Bjortjørn, Sønnristjernand Lille Kleivmyr. Al is systemically depleted in sec-ondary quartz in relation to the primary quartz. The deple-tion is stronger in sqz1 (Bjortjørn and Sønnristjern) thanin sqz3 (Lille Kleivmyr). Beside Al the Ti concentrationin secondary quartz sqz1 and sqz3 is distinct lower than inthe primary host quartz (Fig. 12). The LA-ICP-MS analy-ses 2209405 (Løvland) and 1909401 (Skåremyr) which areplaced in primary quartz with high portion of secondaryquartz (sqz1 to sqz3) have lower Al, Ti and Li than pri-mary quartz in the same deposit. It can be concluded thatsecondary quartz sqz1 to sqz3 revealed by SEM-CL is de-pleted in Li, Al and Ti (Fig. 11 and 12). The films ofsqz4 around recrystallised quartz grains are too thin to beanalysed by LA-ICP-MS and EPMA. Bright luminescentquartz around radioactive inclusions shows no significantredistribution of trace elements (Botis et al., 2005).
Summarising, the presence of secondary quartz (sqz1 tosqz3) in primary quartz leads to a slight decrease in theaverage concentration of trace elements when using LA-ICP-MS analyses depending on the volume portion of sec-ondary quartz (Table 5).
6. Implications of quartz chemistryfor pegmatite crystallisation
The two major findings of this study are the insignificanttrace element variation in pegmatitic quartz of the syn-orogenic pegmatites on regional scale and the homoge-neous trace element content of quartz within these peg-matites, which are in part compositionally zoned.
The general explanations could be that the melts orig-inated from a relatively homogeneous source, pegmatitesemplaced at the same crustal level during a relatively shorttime period at similar PT conditions, the determined traceelements in quartz are not very sensitive to internal frac-tionation processes, and/or the water-enriched highly vis-cous pegmatitic melt enables the almost free diffusion ofLi, B, Al, Ge, and K (e.g., London, 2005). Different pop-ulations of pegmatitic quartz, e.g. quartz graphically inter-growth with primitive plagioclase at the pegmatite contacts
Quartz chemistry in pegmatites 459
Fig. 11. Al concentration profiles crossing primary and secondary quartz. The SEM-CL images of quartz above show the location of EPMAsampling spots.
Fig. 12. Concentration profiles of Al across structures of secondary quartz in pegmatite quartz from Bjortjørn, Sønnristjern and LilleKleivmyr analysed by EPMA.
460 A. Müller, P.M. Ihlen, A. Kronz
and massive quartz in the core zone have similar trace el-ement contents. The graphic quartz crystallised earlier (atleast some hours or days; e.g., Webber et al., 1999) than themassive quartz (e.g., Fig. 9b). In contrast, plagioclase coex-isting with the two quartz populations has different Rb/Srratios indicating the internal fractionation of these elementswithin the crystallising pegmatite melt. However, the up-take of the determined trace elements into the quartz latticeseems not to be affected by the internal melt fractionationdefined by decreasing Mg and Sr and increasing of Li, Rb,and Ba.
Wark & Watson (2006) proved the temperature depen-dence of the Ti4+–Si4+ substitution in the presence of ru-tile and established a geothermometer for the temperaturerange of 400 to 1000 ◦C at 1.0 GPa. The temperature de-pendence of Ti in quartz explains its constant values inquartz of syn-orogenic pegmatites, and the higher contentin the Herefoss pluton related (HP1 and HP2) and contact-metamorphosed pegmatites (sZoP). Systematic tempera-ture gradients from the contact to the core of pegmatiteswhich are described, e.g. for the Little Three pegmatite,California (Morgan & London, 1999) could not be demon-strated for the Froland pegmatites due to the small vari-ations in Ti content of quartz. The thermometer of Wark& Watson (2006) can be applied even in the absence ofrutile if the TiO2 activity of the system is known. How-ever, in the case of the Froland pegmatites the TiO2 activ-ity is difficult to determine due to uncertainties of the peg-matite bulk composition. The bulk composition howeverof the syn-orogenic pegmatitic granite from Våtåskammencould be determined due to the homogeneous rock struc-ture formed of 1 to 10 cm large crystals. The TiO2 activityof the Våtåskammen melt was aTiO2 = 0.68 based on a newTiO2 saturation model for granitic melts (Hayden et al.,2005). The crystallisation temperatures of quartz in thesyn-orogenic pegmatites are in the range of 444–600 ◦C.However, there is an uncertainty in the activity of Ti in thepegmatitic melts and the data from Våtåskammen are prob-ably not representative for all syn-orogenic pegmatites. Thepresence of secondary quartz slightly lowers the total Tidetermined by LA-ICP-MS resulting in the underestima-tion of the primary crystallisation temperature. The ob-tained temperatures are not unexpected lower than thosedetermined for the granulite facies peak metamorphism at700–800 ◦C in the Bamble-Lillesand block (Touret, 1971a,1971b; Nijland & Maijer, 1993). However, the tempera-tures fall well within amphibolite-greenschist facies con-ditions when the pegmatitites successively were emplacedduring progressive crustal shortning and tectonic uplift ofthe Bamble-Lillesand block, leading to early syn-orogenicfolded dykes and late weakly deformed dykes (Henderson& Ihlen, 2004).
Processeses which control the uptake of Al into the quartzlattice seem to be more complex (e.g., Müller et al., 2000,2002a, 2003b). Al3+ substituting Si4+ may either be pairedwith P5+ or with the monovalent ions Li+, Na+, K+ and H+
and, thus, Al may form different defect centres in the quartzlattice. Jacamon & Larsen (2006) simply suggest that Alin igneous quartz increases with increasing aluminium sat-uration index. Li in quartz is presumably buffered by Li-
bearing phases coexisting with quartz which are micas inthe Froland pegmatites. Similar mineral assemblages of theFroland pegmatites and their insignificant regional frac-tionation explains the constant Li content in quartz. Geshows a incompatible character and becomes enriched ingranitic and pegmatitic quartz during fractionation (Schrönet al., 1988; Larsen et al., 2004; Jacamon & Larsen, 2006).Consequently, Larsen et al. (2004) detected significant Gevariations in pegmatitic quartz from the Froland and Evjepegmatite field which have different fractionation trendsand stages. Due to the similar fractionation degree of thesyn-orogenic Froland pegmatites Ge is almost constant.
Fluid-driven, post-crystallisation overprint resulted in re-placement of bright luminescent primary quartz by low tonon-luminescent secondary quartz during at least four dif-ferent events. Micro-fractures providing the pathways forfluids can be related to external deviatoric stress, but alsoto internal stress at grain scale as a consequence of strongthermal contraction of quartz (Vollbrecht et al., 1991,1994). Structures formed during these sub-solidus pro-cesses include fracture-bound replacement that are com-prised by secondary quartz, usually as several generations.Thermal contraction triggered probably the development ofsqz1 and sqz2 because these structures are common in ig-neous quartz elsewhere (e.g., Sprunt & Nur, 1979; Behr& Frentzel-Beyme, 1989; Van den Kerkhof & Hein, 2001;Van den Kerkhof et al., 2001, 2004; Müller et al., 2000,2002b). Sqz3 may result from diffusional processes alongexisting grain boundaries (Müller et al., 2005). In the caseof sqz4 the systems of micro-fractures were formed byshearing and tensional strain. Secondary quartz sqz1, 2and 3 is systematic depleted in Al, Ti and K compared tothe primary quartz hosting them. The trace element deple-tion has been described previously (Müller et al., 2002a,2002b; 2003a, Van den Kerkhof et al., 2004) and the pro-cess of quartz purification during retrograde, fluid-drivenoverprint seems to be a common phenomena in igneousand pegmatitic rocks (e.g., Ihlen & Müller, 2007). How-ever, the influence of the chemistry of secondary quartz onthe bulk quartz composition is minor in the case of the Frol-and quartz due to the commonly low volume (< 5 vol.%) ofsecondary quartz. In samples, in which the volume of sec-ondary quartz exceeds 10 vol.%, the average trace elementconcentration is significantly lowered, e.g. sample 2209405from Løvland.
Summarising, the PTX-conditions during formation ofthe syn-orogenic pegmatites were constant and stable forthe time of the pegmatite emplacement over an area ofat least 100 km2. Henderson & Ihlen (2004) showed thatthe syn-orogenic pegmatites are structurally related to Sve-conorwegian fold geometries associated with peak meta-morphism between 1.14 and 1.12 Ga and are kineticallyrelated to overthrust geometries associated with the initialoverthrusting phase of the Porsgrumm-Kristiansand Faultwhen the Bamble complex docked with the underlyingTelemark block. The thrusting lead to amphibolite faciestransitional to granulite facies conditions causing the par-tial anatexis of biotite-hornblende gneisses. The melts wereextracted at short periods of brittle fracturing interspersingductile deformation (Henderson & Ihlen, 2004) resulting
Quartz chemistry in pegmatites 461
in thrust related pegmatite injection during a relative shortperiod, probably less 1 million years.
7. Conclusions
1) The classification of the Sveconorwegian Froland peg-matites by Ihlen et al. (2002), who based their peg-matite classification on dominant mineral assemblages,bulk compositions and time relationships, could be refinedby mineral chemistry results. Despite the relative homoge-neous and primitive bulk composition of the Froland peg-matites, biotite and feldspar show distinct minor elementchemistries which vary slightly between pegmatite types.The differentiation of syn-orogenic pegmatites from primi-tive to more evolved composition include the following se-quence: NaP→ PGr→ GP+ZoP→ KP→MP1. The late-orogenic pegmatites related to the Herefoss pluton (HP1and HP2) contain biotite and feldspar with the most prim-itive composition in respect to granite differentiation. Thepost-orogenic MP2 have the most evolved mineral compo-sition.
2) This study documents a rather homogeneous distri-bution of trace elements in quartz across compositionallyheterogeneous pegmatites including NaP, GP and ZoP. Theresult is remarkable since feldspar and biotite show chem-ical zonation across these pegmatites that are recognisedby variations of Rb/(Ba+Sr) in K-feldspar, Rb/Sr in pla-gioclase, and Mg-Li in biotite. Feldspars and biotites inthe pegmatite cores are more fractionated than those alongthe pegmatite contact. Feldspar megacrysts occurring in thecentral blocky zone of these pegmatites have a more prim-itive minor element composition in the core of the crystalthan at their margin. Feldspar and biotite chemistry reflectschanges in melt composition within pegmatites, which in-clude a smooth decrease of Mg and Sr and increase of Li,Rb, and Ba.
3) The homogeneity of the trace element contents in peg-matitic quartz of syn-orogenic pegmatites confirmes thesupposition by Henderson & Ihlen (2004) that these peg-matites emplaced within a short time period during Sve-conorwegian thrusting and crustal accretion on the westernmargin of Fennoscandia.
4) The average quartz chemistry of the pegmatites variesslightly with the compositional types; but is more variablebetween pegmatites of different relative age (syn-, late- ver-sus post-orogenic). Variations in Ti are principally causedby different crystallisation temperatures of quartz.
5) Trace element concentrations in mylonitised peg-matitic quartz (sZoP) show lower Li and Al and highTi and Ge compared to undeformed ZoP quartz. Thus,the micro-scale mylonitisation of quartz together withhigh-temperature overprint during contact metamorphismcaused the introduction of Ti and Ge into the quartz latticeand the expelling of Al and Li from the lattice. The over-print is also reflected by the high Ti of the Vaselona mus-covite compared to the zinnwaldite from Hellheia Middle,Hellheia North, Bjortjørn, and Skåremyr.
6) Four populations of secondary quartz sqz1 to sqz4(1 μm to several millimetres in size) with low CL inten-
sity replaced primary pegmatitic quartz. Populations sqz1to sqz3 contain lower Al, Ti and Li than the primary hostquartz. Sqz4 could not be analysed due to the small struc-ture size of < 5 μm. Secondary quartz which can form upto 30 vol.% in some samples lowers the bulk trace elementcontent of quartz. Secondary quartz sqz1, 2, and 3 is themain carrier of fluid inclusions.
7) Several economic aspects can be postulated from thisstudy. Most of the syn-orogenic pegmatites contain quartzof medium quality with relatively consistent trace elementconcentrations almost independently of the compositionalpegmatite type. However, the syn-orogenic pegmatites,which occur at the contact of the Herefoss pluton con-tain high-Ti quartz of low quality. Late- and post-orogenicpegmatites have commonly quartz of low quality. Sec-ondary overprint and the associated replacement of pri-mary quartz by secondary quartz results in the reductionof trace element content and thus improves the chemicalquality of quartz. Syn-orogenic ZoP, GP and PGr consistof K-rich alkali feldspars (> 13 wt.% K2O) and, therefore,they are suitable for glass- and ceramic production. Thebulk composition of K-feldspars from post-orogenic peg-matites (HP) is more variable and, thus, must be checkedin each case. Plagioclase of the Froland pegmatites has noeconomic potential.
Acknowledgements: The authors are grateful to J. Touret,T. G. Nijland and F. Hatert for their constructive reviews.We greatly appreciate the critical comments and languageimprovement of I. Henderson.
References
Abad-Ortega, M.D.M., Hach-Alí, P.F., Martin-Ramos, J.D., Ortega-Huertas, M. (1993): The feldspars of the Sierra Albarranagranitic pegmatites, Cordoba, Spain. Can. Mineral., 31, 185-202.
Alirezaei, S. (2000): Geochemical investigation of the lower crustalrocks in Bamble Shear belt, southern Norway: implications forthe source of gold in lode gold deposits. Unpublished Ph.D. the-sis, University of Ottawa, 343 p.
Ålmi R. (1975): Mineralogy and rare earth geochemistry of apatiteand xenotime from the Gloserheia granite pegmatite, Froland,southern Norway. Am. Mineral., 60, 607-620.
— (1977): Internal structure and mineralogy of the Gloserheia gran-ite pegmatite, Froland, southern Norway. Norsk Geol. Tidsskr.,57, 243-262.
Andersen, O. (1926): Feltspat I. Norges Geologiske Undersøkelse,128a, 1-142. (in Norwegian)
— (1931): Feltspat II. Norges Geologiske Undersøkelse, 128b, 1-109 (in Norwegian).
Andersen, T. (1997): Radiogenic isotope systematics of the HerefossGranite, South Norway; an indicator of Sveconorwegian(Grenvillian) crustal evolution in the Baltic Shield. Chem. Geol.,135, 139-158.
— (2005): Terrane analysis, regional nomenclature and crustalevolution in the Southwest Scandinavian Domain of theFennoscandian Shield. GFF, 127, 159-168.
462 A. Müller, P.M. Ihlen, A. Kronz
Andersen, T., Andresen, A., Sylvester, A.G. (2002): Timing of late-to post-tectonic Sveconorwegian granitic magmatism in SouthNorway. Norges Geol. Unders. Bull., 440, 5-18.
Behr, H.-J., Frentzel-Beyme, K. (1989): Permeability and pale-oporosity in crystalline bedrocks of the Central Europeanbasement-studies of cathodoluminescence. in “Exploration ofthe deep continental crust. Deep drilling in crystalline bedrockVolume 2.” A. Boden, K.G. Eriksson, eds. Springer, BerlinHeidelberg New York, 477-497.
Bingen, B., Boven, A., Punzalan, L., Wijbrans, J.R., Demaiffe,D. (1998): Hornblende 40Ar/39Ar geochronology across ter-rane boundaries in the Sveconorwegian Province of S. Norway.Precamb. Res., 90, 159-185.
Bingen, B., Nordgulen, Ø., Sigmund, E.M.O. (2001): Correlationof supracrustal sequences and origin of terranes in theSveconorwegian orogen of SW Scandinavia: SIMS data on zir-con clastic metasediments. Precamb. Res., 108, 293-318.
Bingen, B., Mansfeld, J., Sigmond, E.M.O., Stein, H. (2002):Baltica-Laurentia link during the Mesoproterozoic: 1.27 Ga de-velopment of continental basins in the Sveconorwegian orogen,South Norway. Can. J. Earth Sci., 39, 1425-1440.
Bjørlykke, H. (1937): The granite pegmatites of southern Norway.Am. Mineral., 22, 241-255.
Botis, S., Nokhrin, S.M., Pan, Y., Xu, Y., Bonli, T. (2005): Naturalradiation-induced damage in quartz. I. Correlations betweencathodoluminescence colors and paramagnetic defects. Can.Mineral., 43, 1565-1580.
Brøgger, W.C. (1906) Die Mineralien der südnorwegischenGranitpegmatitgänge. Videnskaps-Selskape i Christiana, 1/6, 1-162.
Cameron, E.N., Jahns, R.H., McNair, A.H., Page, L.R. (1949):Internal structure of granitic pegmatites. Econ. Geol. Monogr.,2, 115 p.
Cerný, P. (1992): Regional zoning of pegmatite populations and itsinterpretation. Mitt. Österr. Mineral. Ges., 137, 99-107.
Cerný, P. & Burt, D.M. (1984): Paragensis, crystallochemical prop-erties, and chemical evolution of micas in granite pegmatites. in“Micas” S.W. Bailey, ed., Reviews in Mineralogy, 13, 257-297.
Cerný, P. & Ercit, T.S. (2005): The classification of granitic peg-matites. Can. Mineral., 43, 2005-2026.
Chakoumakos, B.C. & Lumpkin, G.R. (1990): Pressure-temperatureconstraints on the crystallization of the Harding pegmatite, TaosCounty, New Mexico. Can. Mineral., 28, 287-298.
Cosca, M.A., Mezger, K., Essene, E.J. (1998): The Baltica-Laurentia connection: Sveconorwegian (Grenvillian) metamor-phism, cooling, and unroofing in the Bamble sector, Norway. J.Geology, 106, 539-552.
Cox, R.A., Dempster T.Y., Bell B.R., Rogers, G. (1996):Crystallization of the Shap Granite: Evidence from zoned K-feldspar megacrysts. J. Geol. Soc. London, 153, 625-635.
Elders, W.A. (1963): On the form and mode of emplacement of theHerefoss granite. Norwegian Geol. Surv. Bull., 214, 1-50.
Flem, B., Larsen, R.B., Grimstvedt, A., Mansfeld, J. (2002): In situanalysis of trace elements in quartz by using laser ablation in-ductively coupled plasma mass spectrometry. Chem. Geol., 182,237-247.
Götze, J., Plötze, M., Habermann, D. (2001): Origin, spectral char-acteristics and practical applications of the cathodolumines-
cence (CL) of quartz – a review. Mineral. Petrol., 71, 225-250.Götze, J., Plötze, M., Graupner, T., Hallbauer, D.K., Bray, C.J.
(2004): Trace element incorporation into quartz: A com-bined study by ICP-MS, electron spin resonance, cathodolu-minescence, capillary ion analysis, and gas chromatography.Geochim. Cosmochim. Acta, 68, 3741-3759.
Götze, J., Plötze, M., Trautmann, T. (2005): Structure and lumines-cence characteristics of quartz from pegmatites. Am. Mineral.,90, 13-21.
Harben, P.W. (2002): The industrial mineral handybook – a guideto markets, specifications and prices. 4th edition, IndustrialMineral Information, Worcester Park, United Kingdom, 412 p.
Hayden, L.A., Watson, E.B., Wark, D.A. (2005) Rutile satu-ration and TiO2 diffusion in hydrous siliceous melts. EOS(Transactions, American Geophysical Union), v. 86, Fall meet-ing supplement, abs. MR13A-0076.
Henderson, I. (2002): CL mikroteksturer i tilknytning til polypfasekvarts i pegmatitter i Frolandsområde. in “Potensielle ressurserav kvarts- og feldspat- råstoffer på Sørlandet, II: Resultaterav undersøkelsene i Frolandsområdet i 2001” P.M. Ihlen, I.Henderson, R.B. Larsen, R. Lynum eds., Norwegian GeologicalSurvey Report 2002.009, Trondheim, 65-72 (in Norwegian).
Henderson, I. & Ihlen, P.M. (2004): Emplacement of polygenerationpegmatites in relation to Sveco-Norwegian contractional tecton-ics: examples from southern Norway. Precamb. Res., 133, 207-222.
Ihlen, P.M. & Müller, A. (2007): Hydrothermal formation of high-purity quartz deposits along the Hardangerfjord Fault Zone.NGF Abstracts and Proceedings of the Geological Society ofNorway, Stavanger, 8–10. January 2007, 1, 46-47.
Ihlen, P.M., Lynum, R., Henderson, I., Larsen, R.B. (2001):Potensielle ressurser av kvarts- og feldspat- råstoffer påSørlandet, I: Regional prøvetaking av utvalgte feltspatbruddi Frolandsområdet. Norwegian Geological Survey Report2001.044, Trondheim, 46 p. (in Norwegian).
Ihlen, P.M., Henderson, I., Larsen, R.B., Lynum, R. (2002):Potensielle ressurser av kvarts- og feldspat- råstoffer påSørlandet, II: Resultater av undersøkelsene i Frolandsområdeti 2001. Norwegian Geological Survey Report 2002.009,Trondheim, 100 p. (in Norwegian).
Jacamon, F. & Larsen, R.B. (2006): Trace element evolution inquartz during fractional crystallisation of the high T and Pcharnockitic Kleivan granite, south-western Norway. in “Thesignificance of textures and trace element chemistry of quartzwith regard to the petrogenesis of granitic rocks”, F. Jacamon,PhD thesis, NTNU Norwegian University of Science andTechnology, Trondheim, 1-34.
Knudsen, T.-L. & Andersen, T. (1999): Petrology and geochemistryof the Tromøy gneiss complex, South Norway, an alleged exam-ple of Proterozoic depleted lower continental crust. J. Petrol.,40, 909-933.
Larsen, R.B. (2002): The distribution of rare-earth elements in K-feldspars as an indicator of petrogenetic processes in graniticpegmatites: Examples from two pegmatite fields in southernNorway. Can. Mineral., 40, 137-151.
Larsen, R.B., Henderson, I., Ihlen, P.M., Jacamon, F. (2004):Distribution and petrogenetic behaviour of trace elements ingranitic quartz from South Norway. Contrib. Mineral. Petrol.,147, 615-628.
London, D. (1996): Granitic pegmatites. Trans. Royal Soc.Edinburgh, 87, 305-319.
Quartz chemistry in pegmatites 463
— (2005): Granitic pegmatites: an assessment of current conceptsand directions for the future. Lithos, 80, 281-303.
London, D., Morgan, G.B.VI, Hervig, R.L. (1989): Vapor-undersaturated experiments in the system macusanite-H2O, at200 MPa, and the internal differentiation of granitic pegmatites.Contrib. Mineral. Petrol., 102, 1-17.
Long, P.E. & Luth, W.C. (1986): Origin of K-feldspar megacrysts ingranitic rocks: Implication of a partitioning model for barium.Am. Mineral., 71, 367-375.
Malló, A., Fontan, F., Melgarejo, J. C., Mata, J. M. (1995): TheAlbera zoned pegmatite field, Eastern Pyrenees, France. J.Mineral. Petrol., 55, 103-116.
Mehnert, K.R. & Büsch, W. (1981): The Ba content of K-feldsparmegacrysts in granites: a criterion for their formation. N. Jb.Miner. Abh., 140, 221-252.
Morgan, G.B. & London, D. (1999): Crystallization of theLittle Three layered pegmatite-aplite dike, Ramona District,California. Contrib. Mineral. Petrol., 136, 310-330.
Müller, A., Seltmann, R., Behr, H.J. (2000): Application of cathodo-luminescence to magmatic quartz in a tin granite – case studyfrom the Schellerhau Granite Complex, Eastern Erzgebirge,Germany. Mineral. Deposita, 35, 169-189.
Müller, A., Kronz, A., Breiter, K. (2002a): Trace elements andgrowth patterns in quartz: a fingerprint of the evolution ofthe subvolcanic Podlesí Granite System (Krušne Hory, CzechRepublic). Bull. Czech Geol. Surv., 77/2, 135-145.
Müller, A., Lennox, P., Trzebski, R. (2002b): Cathodoluminescenceand micro-structural evidence for crystallisation and deforma-tion processes of granites in the Eastern Lachlan Fold Belt (SEAustralia). Contrib. Mineral. Petrol., 143, 510-524.
Müller, A., Rene, M., Behr, H.-J., Kronz, A. (2003a): Trace elementsand cathodoluminescence of igneous quartz in topaz granitesfrom the Hub Stock (Slavkovský Les Mts., Czech Republic).Mineral. Petrol., 79, 167-191.
Müller, A., Wiedenbeck, M., van den Kerkhof, A.M., Kronz,A., Simon, K. (2003b): Trace elements in quartz – a com-bined electron microprobe, secondary ion mass spectrometry,laser-ablation ICP-MS, and cathodoluminescence study. Eur. J.Mineral., 15, 747-763.
Müller, A., Ihlen, P.M., Kronz, A. (2005): Potential resources ofquartz and feldspar raw material in Sørland IV: Relationshipsbetween quartz, feldspar and mica chemistry and peg-matite type. Norwegian Geological Survey Report 2005.075,Trondheim, 94 p.
Nijland, T.G., Maijer, C. (1993): The regional amphibolite to gran-ulite facies transition at Arendal, Norway: Evidence for a ther-mal dome. N. Jb. Miner. Abh., 165, 191-221.
Norton, J.J. (1983): Sequence of mineral assemblages in differenti-ated granitic pegmatites. Econ. Geol., 78, 854-874.
Perny, B., Eberhardt, P., Ramseyer, K., Mullis, J., Pankrath, R.(1992): Microdistribution of aluminium, lithium and sodiumin a quartz: possible causes and correlation with shored livedcathodoluminescence. Am. Mineral., 77, 534-544.
Ramseyer, K., Baumann, J., Matter, A., Mullis, J. (1988):Cathodoluminescence colours of α-quartz. Mineral. Mag., 52,669-677.
Roda-Robles, E., Pesquera, A., Gil, P. P., Torres-Ruiz, J., Fontan,F. (2004): Tourmaline from the rare-element Pinilla pegmatite,(Central Iberian Zone, Zamora, Spain): chemical variation andimplications for pegmatitic evolution. J. Mineral. Petrol., 81,249-263.
Schetelig, J. (1922): Thortveitite. Nor. Geol. Tidsskr,. 6, 233-243.Schrön, W., Schmädicke, E., Thomas, R., Schmidt, W. (1988):
Geochemische Untersuchungen an Pegmatitquarzen. Z. geol.Wiss., 16, 229-244.
Shearer, C.K., Papike, J.J., Jolliff, B.L. (1992): Petrogenetic linksamoung granites and pegmatites in the Harney Peak rare-element granitic pegmatite system, Black Hills, South Dakota.Can. Mineral., 30, 785-809.
Sprunt, E.S. (1981): Causes of quartz cathodoluminescence colors.Scanning Electron Microscopy, 1981, 525-535.
Sprunt, E.S. & Nur, A. (1979): Microcracking and healing in gran-ites: New evidence from cathodoluminescence. Science, 205,495-497.
Starmer, I.C. (1993): The Sveconorwegian Orogeny in SouthernNorway, relative to deep crustal structures and eventsin theNorth Atlantic Proterozoic supercontinent. Norsk Geol. Tidsskr.,73, 109-132.
Stenina, N.G., Bazarov, L.S., Shcherbakova, M.Y., MashkovtsevR.I., 1984. Structural state and diffusion of impurities in naturalquartz of different genesis. Phys. Chem. Minerals 10, 180-186.
Stevens Kalceff, M.A., Phillips, M.R., Moon, A.R., Kalceff, W.(2000): Cathodoluminescence microcharacterization of silicondioxide polymorphs. in “Cathodoluminescence in Geosciences”M. Pagel, V. Barbin, P. Blanc, D. Ohnenstetter, eds. Springer,Berlin, 193-279.
Tischendorf, G., Förster, H.-J., Gottesmann, B. (2001): Minor- andtrace-element composition of trioctahedral micas: a review.Mineral Mag., 65, 249-276.
Touret, J. (1971a): La facies granulite en Norvege meridionale. I Lesassociations minéralogiques. Lithos, 4, 239-249.
— (1971b): La facies granulite en Norvege meridionale. II Les in-clusions fluides. Lithos, 4, 423-436.
Van den Kerkhof, A.M. & Hein, U. (2001): Fluid inclusion petrog-raphy. Lithos, 55, 27-47.
Van den Kerkhof, A.M., Kronz, A., Simon, K. (2001): Trace elementredistribution in metamorphic quartz and fluid inclusion modi-fication: observations by cathodoluminescence. XVI ECROFI,Porto 2001, Departomento Geologica Memória, 7, 447-450.
Van den Kerkhof, A.M., Kronz, A., Simon, K., Scherer, T. (2004):Fluid-controlled quartz recovery in granulite as revealed bycathodoluminescence and trace element analysis (Bamble sec-tor, Norway). Contrib. Mineral. Petrol., 146, 637-652.
Vollbrecht, A., Rust, S., Weber, K. (1991): Development of micro-cracks in granites during cooling and uplift: examples from theVariscan basement in NE Bavaria, Germany. J. Struct. Geol., 13,787-799.
Vollbrecht, A., Olesen, N.O., Schmidt, N.H., Weber, K. (1994):Crystallographic microcrack orientation in quartz from a gran-ite – a combined ECP/U stage study. in “Textures of GeologicalMaterials”, H.J. Bunge, S. Siegesmund, W. Skrotzki, K. Weber,eds. DGM Informationsgesellschaft Verlag, Oberursel, 345-352.
Webber, K.L., Simmons, W.B., Falster, A.U., Foord, E.E. (1999):Cooling rates and crystallization dynamics of shallow levelpegmatite-aplite dikes, San Diego County, California. Am.Mineral., 84, 708-717.
Received 25 June 2007Modified version received 31 January 2008Accepted 3 March 2008