VANCOUVER 2015 1 | Page RAPID RAMP-UP OF THE TROPICANA HPGR CIRCUIT *Fred Kock 1 , Leigh Siddall 1 and Ivka-Anna Lovatt 1 , Mark Giddy 2 , and Mike DiTrento 3 1 Orway Mineral Consultants WA Pty Ltd (OMC) Level 4, 1 Adelaide Terrace East Perth, Western Australia 6004 (*Corresponding author: [email protected]) 2 Lycopodium Minerals Pty Ltd Level 5, 1 Adelaide Terrace East Perth, Western Australia 6004 3 AngloGold Ashanti Australia Limited GPO Box B91 Perth, Western Australia 6838
Transcript
VANCOUVER 2015
1 | P a g e
RAPID RAMP-UP OF THE TROPICANA HPGR CIRCUIT
*Fred Kock1, Leigh Siddall1and Ivka-Anna Lovatt1, Mark Giddy2, and Mike DiTrento3
1Orway Mineral Consultants WA Pty Ltd (OMC) Level 4, 1 Adelaide Terrace
East Perth, Western Australia 6004 (*Corresponding author: [email protected])
2Lycopodium Minerals Pty Ltd
Level 5, 1 Adelaide Terrace East Perth, Western Australia 6004
3AngloGold Ashanti Australia Limited
GPO Box B91 Perth, Western Australia 6838
VANCOUVER 2015
2 | P a g e
RAPID RAMP-UP OF THE TROPICANA HPGR CIRCUIT
ABSTRACT The 5.5 Mtpa Tropicana Gold Project in Western Australia adopted a HPGR ball mill
comminution circuit due to the high cost of power generation and to reduce its energy footprint in line with its environmental operating licence. In order to maximise the benefit from the HPGR, closed circuit operation with wet screening at 4 mm was selected. The process plant was commissioned in the third quarter of 2013 with ramp up to design throughput in only a few weeks. Throughput has been maintained at or above nameplate following the transition from finer, near surface oxides to more competent primary and transition ore. This remarkably efficient ramp up to full production can be ascribed to an engineering design focus that took account of the major issues hampering project ramp up elsewhere and inclusion of some innovative features to enhance circuit availability. A robust design, along with a focus on continuous improvement post commissioning resulted in a successful comminution circuit, continuously exceeding design targets. Reliable modelling and resultant appropriate equipment selection was critical for balanced operation of this single stream circuit. This paper discusses the key design features that resulted in the successful start up of the project, post commissioning improvements and presents the ongoing plant operating data.
INTRODUCTION The Tropicana Joint Venture (TJV) is operated by Anglogold Ashanti Australia Ltd (Anglogold),
which holds a 70% interest in the project. Independence Group NL (IGO) controls the remaining 30% interest. The project is situated in a remote location, approximately 330km east north-east of Kalgoorlie, Western Australia. The Tropicana deposit was discovered in 2005, and was regarded as the most significant gold find in Australia for over a decade. The deposit lies along a collision zone between the Yilgarn Craton and the Albany-Fraser Province.
The Tropicana Gold Project (TGP) process plant is designed to treat 5.8Mt/a of blended feed ore
(5.5Mt/a of primary ore) per annum. Lycopodium Minerals Pty Ltd (Lycopodium) was appointed to provide feasibility studies and EPCM services for the greenfield project. Forming part of consultancy services provided by Lycopodium, Orway Mineral Consultants (OMC), a subsidiary of Lycopodium, was involved in the design, commissioning, ramp up and ongoing post commissioning support of the comminution circuit.
Development of the project was approved in November 2010, with construction commencing in
June 2011. The project was completed ahead of schedule, with first gold pour occurring in September 2013. Ramp-up of the plant achieved nameplate throughput within two months of first gold pour.
This paper examines the engineering design considerations that were made by the owner and
engineer in the early and detailed design phases of the project which allowed the rapid ramp up and ongoing success of the project. Factors that influenced the selection of the circuit type are examined and discussed in the context of current performance of the comminution circuit.
VANCOUVER 2015
3 | P a g e
COMMINUTION TESTWORK AND CIRCUIT SELECTION
Ore Characteristics
The Tropicana start-up reserves comprise two main mineralized zones, the Tropicana zone to the north and the Havana zone to the south. Two mineralisation styles are identifiable based on sulfide mineral occurrence and host rock type. They are: (a) pyrite-dominant disseminations, bands and crackle breccia veins within altered quartzo-feldspathic gneiss and rare garnet gneiss divisions; and (b) patchy and vein style pyrite-pyrrhotite selectively replacing thin intervals of the meta-sedimentary facies at the base of and interleaved with the hanging wall garnet gneiss.
Economic gold concentrations are limited to intervals of quartzo-feldspathic gneiss within the
favourable horizon. Higher gold grades are associated with close-spaced anastomosing biotite-sericite fracture fills and crackle breccia zones that suggest a dominantly brittle deformation style during mineralisation. Sulfides within the mineralised zones consist dominantly of pyrite (2-8%, <0.2mm). Visible gold has not been observed in drill core or chips. Quartz veining and pervasive carbonate alteration are notably absent.
Each of the two mineralised zones was classified into three weathered states, oxide (saprolite),
transition (saprock) and primary ore. The approximate amount of each in the combined resource is presented in Table 1.
Table 1 – Original Tropicana Resource by Material Type
Regolith Type %
Oxide 4.1 Transition 10.4 Primary 85.5
The nameplate throughput for the plant is 5.5Mt/a for 100% primary ore. In total, 49 samples
were subjected to comminuting testing, 15 from the Tropicana zone and 34 from the Havana Zone. A summary of the design (85th percentile) and average comminution testwork parameters is given in Tables 2 and 3 for the oxide/transition and primary ores respectively.
VANCOUVER 2015
4 | P a g e
Table 2 – Summary of Oxide/Transition Ore Comminution Testwork Parameters
Parameter Unit Design Average StDev
Crushing Work Index kWh/t 11.3 7.0 3.7 Bond Rod Work Index kWh/t 15.7 11.6 4.9 Bond Ball Work Index kWh/t 15.3 13.2 3.0 Abrasion Index g 0.137 0.114 0.09 JKDW Axb
70.9 194.3 194.4
JKDW Ta
0.97 1.90 1.36 SMC Axb
138.7 174.6 58.7
SMC DWi kWh/m3 0.79 2.02 1.51
Table 3 – Summary of Primary Ore Comminution Testwork Parameters
Parameter Unit Design Average StDev
UCS MPa 108.8 76.7 15.2 Crushing Work Index kWh/t 19.1 16.1 3.0 Bond Rod Work Index kWh/t 21.5 19.4 2.1 Bond Ball Work Index kWh/t 18.2 17.6 1.6 Abrasion Index g 0.325 0.291 0.06 JKDW Axb
31.5 36.1 6.0
JKDW Ta
0.32 0.40 0.19 SMC Axb
33.1 41.4 16.6
SMC DWi kWh/m3 8.6 7.21 1.5 Flowsheet Selection
The weathered components are relatively soft and were predicted to require little to moderate grinding energy. The primary ore, which forms the design basis is significantly more competent, particularly when considering the resistance to impact breakage (CWi and Axb). In contrast, the BWi although also relatively high, was not as extreme as the Axb value when compared to the OMC testwork database. This relationship indicates that SAG milling of this particular ore will not be the most energy efficient option. With energy efficiency being a key driver in the circuit selection, an economic option study was conducted during the pre-feasibility stage. Options initially considered were SABC, SS SAG, HPGR–ball milling, HPGR–pebble milling, AG-pebble milling and tertiary crush–ball milling. The preliminary studies indicated that the primary crush–SABC and HPGR–Ball milling should be investigated further.
A summary of the comparative power utilisation figures for the SABC and HPGR – ball options is
presented in Table 4.
VANCOUVER 2015
5 | P a g e
Table 4 – Comparative power utilisation used in the study phase, kWh/t
Total 29.9 23.4 *Conveyors, screens, lube packs etc. The power utilisation comparison showed the SABC option has fSAG
1 values of 1.3-1.4, highlighting the low power efficiency for this circuit. This option was subsequently found to be the more energy intensive. The HPGR-ball option was the most energy efficient, and when subjected to a full cost benefit analysis, was found to be the most cost effective option for the TGP. Numerous flowsheet variations for the HPGR-ball circuit option were then assessed to refine the final concept.
The total capital cost of the comminution circuit from feed preparation to ball mill classification at project completion was AUD133M, which was 53% of the overall plant direct capital cost (excluding construction indirect costs).
PROCESS FLOW DESCRIPTION
The TGP comminution flowsheet selected has primary crushing followed by a coarse ore stockpile. Primary crushing is conducted in a single FLSmidth TSU 1400 x 2100 gyratory crusher, with 600kW installed power. The crusher achieves a P80 of 150mm-170mm, and is designed to treat 2,500t/h.
The coarse ore is reclaimed from the stockpile via two reclaim apron feeders and conveyed to the
secondary screen feed bins. The secondary screens are two parallel 3.0m x 6.1m double deck banana screens (duty/standby) operating with a 90mm top deck aperture and 45mm bottom deck aperture. The oversize from both decks combines to feed the secondary cone crushers while the -45mm reports to the HPGR circuit. The secondary crushing stage comprises 2 x FLSmidth XL900 Raptor cone crushers (duty/standby) which operate in closed circuit with the secondary screens.
The secondary crushed product reports to the HPGR feed bin, which has 18 minutes live capacity.
A belt feeder is used to maintain choke feed conditions to the HPGR. A single Köppern Ø2.0m x 1.85m HPGR is used for the tertiary crushing stage. This is fitted with 2 x 2,200kW variable speed motors. The HPGR operates in closed circuit with wet screens. The design includes the ability to continuously cut a fraction from the HPGR discharge in order to create a HPGR fines emergency stockpile. This stockpile is then reclaimed using a front end loader to feed the wet screens when the HPGR or secondary crushing
1 The power necessary for the flowsheet is compared to the Bond Ball Mill Work Index based power that is theoretically needed to effect comminution from a feed to product. The ratio of the two is referred to as fSAG. The F80 and P80 are standardised to 150mm and 75µm respectively, to allow for direct comparison of circuits.
VANCOUVER 2015
6 | P a g e
plant is off line. This stream is dry screened at 4mm prior to stockpiling, with +4mm material returned to the HPGR screen feed conveyor.
There are two parallel wet screens that classify the HPGR discharge. HPGR discharge reports to
the wet screen feed bins, which have a combined live capacity of 46 minutes. Belt feeders feed the screen pulping boxes, which de-agglomerate flake before reporting to the screens. The wet screens are 4.2m x 8.5m double deck banana screens which are designed for 8mm top deck and 4mm bottom deck apertures. The combined screen oversize is conveyed back to the HPGR, with the ability to bypass the HPGR via actuation of a flop gate during metal detect events and periods of overly wet feed to protect the HPGR.
The -4mm screen undersize reports to the ball mill discharge hopper along with the ball mill
discharge stream. This is pumped to the cyclone cluster for classification, which is fitted with 12 x GMAX26 hydrocyclones. The cyclone overflow exits the grinding circuit, reporting to the trash screens and leach feed thickener, while the cyclone underflow reports to the closed circuit Ø7.32m x 13.12m EGL, overflow discharge ball mill for further size reduction. . The Outotec ball mill is equipped with 2 x 7.0MW RCD SER drives, allowing variable speed operation and 15MW of total input power. The final P80 target is 75µm for the cyclone overflow.
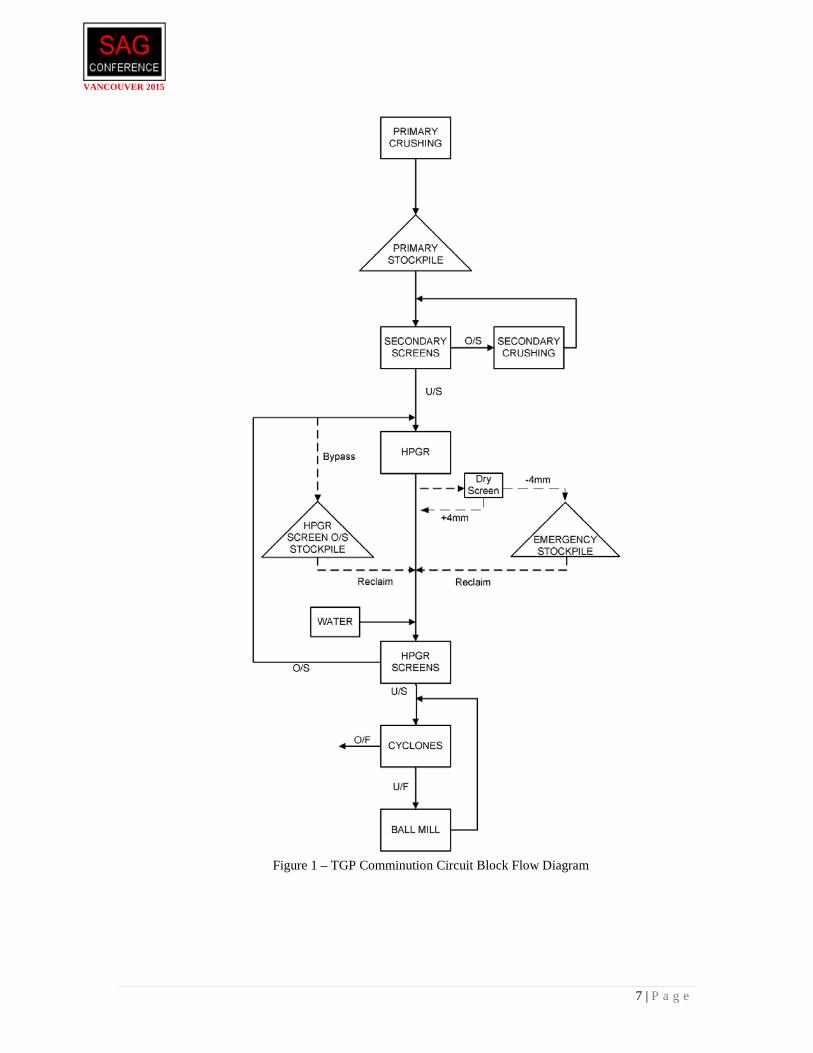
A block flow diagram of the TGP comminution circuit is shown in Figure 1.
FLOWSHEET DESIGN HPGR technology has now been implemented in a number of hard rock applications in mineral
processing plants, however the circuits are generally considered to be more complex to operate and maintain than conventional SAG-ball circuits. HPGR circuits fill a niche requirement for extremely hard ores where energy savings result in more favorable project economics. During the preliminary design phase for the TGP, consultation occurred with key parties involved in the design and operation of existing HPGR circuits in order to gain an understanding of the potential pitfalls. Lessons learnt from a number of existing operations were taken into consideration during the refinement of the Tropicana flowsheet. The primary areas identified as issues from other operations are as follows:
• Adequate top size control to the HPGR • Circuit availability mis-match between the various crushing and milling stages • Circuit stability and surge control – pulse feeding to the HPGR • Higher than predicted HPGR roll wear rates • Feed segregation – uneven roll wear and skew • Management of HPGR feed moisture levels • Water addition control for the HPGR screens and milling circuit • Adequate flake de-agglomeration over the wet screens • Under-sizing of the recycle conveying system around the HPGR circuit • Lack of adequate screening capacity with high recycle suggesting poor HPGR performance
The followings items were implemented in the flowsheet selection and engineering design with
the view to mitigate the detrimental effects caused by the above issues.
Adequate Secondary Crushing Capacity Design of the secondary crushing circuit has been demonstrated to be critical for the successful
operation of a HPGR circuit. Adequate capacity must be allowed to operate the crushers in closed circuit with the screens to ensure control of the top size fed to the HPGR at a steady production rate. The acceptable top size to the HPGR is a function of the operating gap, which is in turn a function of the roll diameter, surface type of the roll and ore characteristics (Daniel & Morrell, 2004). The feed top size should not exceed the operating gap of the HPGR, and failure to control this increases the likelihood of a number of issues including trips due to high skew of the rolls, stud breakage and collapse of the particle bed through the compression zone, causing inefficient crushing.
The secondary crushing circuit at Tropicana was selected with the primary objective being to
control the top size to the HPGR at 45mm. A Split-Online particle size analyser system is installed on the screen undersize conveyor to allow for continuous monitoring of the new feed top size to the HPGR. This allows for early detection of holed panels and excessively worn apertures. The operating gap of the HPGR since commissioning has been 52mm on average (50mm design).
The secondary crushing circuit was designed to be on-line with the HPGR and ball milling
circuits, to avoid the expense of a secondary crushed stockpile. This stockpile would need to be covered to contain dust at this crush size. To address the availability differences between the crushing and HPGR/ball mill operations, duty and standby crushers and screens were included for the secondary crushing and screening stages to ensure steady feed to the HPGR. This allows for routine liner maintenance and gap adjustment to occur on a crusher while maintaining feed to the HPGR/milling circuit.
The flow sheet was configured in a pre-scalp layout, where the new feed to the secondary cone crushers is screened prior to crushing to remove fines and limit the likelihood of volumetric overloading/packing and subsequent ring bounce of the bowl adjust crushers.
VANCOUVER 2015
9 | P a g e
Selection of the HPGR Closed Circuit Screening Approach
The selection of the HPGR screen aperture is typically a trade-off exercise between maximising the power efficiency of the circuit, and practical constraints including moisture limits for the HPGR feed to prevent excessive wear rates resulting from wash out of the autogenous layer. The selection of the HPGR closed circuit screening approach for the TGP circuit was a point of contention and was given significant consideration. Discussion with external consultants was geared towards dry screening as the recommended mode of screening, due to operational issues experienced at other HPGR circuits with wet screens. This would facilitate a split between the HPGR and milling operations with a large dry storage facility, but would limit the screen aperture to around 8mm. The argument put forward was the use of wet screening results in excessive recycled moisture to the HPGR causing excessive wear rates on the rolls and also reducing the throughput rate due to slippage of wet material through the rolls. It was suggested that with the proposed screen aperture size of 4mm, the slippage could be so severe that comminution through the HPGR would reduce to a single particle thickness bed. Other operations also experienced significant ball mill downtime due to shortfalls in feed as a result of the HPGR inspection and maintenance schedule. OMC argued that in order to make the HPGR circuit option viable, fine screening (sub 6mm) would be required to maximise the overall power efficiency of the circuit. To achieve efficient screening below 6mm, wet screening would be required. It was discussed that the detrimental effects seen in wet screening applications in HPGR circuits were exacerbated by the screen selection, and that the risk could be significantly reduced with improved screen design. Provision of sufficient live storage between the HPGR and mill to address the potential downtime added significant cost to the circuit, making this an uneconomic choice. Wet screening at 4mm was thus adopted for the TGP flowsheet with the proviso that the screens would be adequately sized. HPGR Circuit Selection
A number of HPGR testwork campaigns were conducted on a series of composite samples. This
included testing with both studded and Hexadur® roll surfaces at a pilot scale and under a range of operating conditions. The testwork was used to determine the m-dot (specific throughput constant - ts/hm3), specific energy required, likely product PSD and to test the effects of moisture and oxide content. The data was used to scale-up throughput for the HPGR and closed circuit screening design specifications. The estimated recirculating load varied significantly between the testwork campaigns, mainly due to the work done per pass and subsequent difference in product size distributions between studded and Hexadur® rolls. Examination of the testwork results between the two surface types showed that when the differences in operating pressure and work done per pass were accounted for, there was good agreement between the net energy inputs for size reduction by each unit. This indicated that although the Hexadur® roll surfaces allow more work per pass, resulting in operation at a lower recirculating load, this requires a higher applied pressure. The lower pressure studded surface operation results in a higher recirculating load, but the overall power efficiency of the two surface types is the same.
Given the above findings and that studded rolls were always intended for the design due to
superior wear properties, the higher recirculating load was selected for design. This also provided contingency for surging operation (non steady state) identified as problematic at other operations.
A conservative approach was taken when selecting the wet screens. This was based on the higher
recirculating load and 40% additional capacity for effective dewatering of the oversize to protect the HPGR autogenous layer from high moisture washout. The HPGR design maximum feed moisture was set at 6% w/w total moisture above which operating concerns were indicated by the testwork. The screen oversize moisture has typically been between 3 and 5% w/w with HPGR feed moisture being 2.7% on average.
VANCOUVER 2015
10 | P a g e
The conservative design also allowed for a finer screen aperture to be used if found to be required in the future. Shortly after commissioning, the HPGR screen aperture was reduced from 4mm to 3mm to better balance the HPGR power with the milling circuit and achieve higher than design throughput.
Inclusion of Emergency Fines Stockpile
It was noted in other operations that the availability of the HPGR and associated auxiliary equipment including conveyors may not be capable of matching typical milling circuit availabilities of 91-97%. The emergency stockpile is a dead storage of HPGR product to ensure mill feed can be maintained during periods of downtime. This is a compromise since significant rehandle is required, but the operating periods are relatively short. The advantage of a dead stockpile with manual rehandle is that it is very flexible and could be used to feed fine near surface oxides into the plant as well as screened HPGR product.
The emergency stockpile is created by cutting a controlled fraction of the HPGR discharge from within a transfer chute, dry screening this to make a nominally -4mm product and conveying this to a stockpile during normal operation. When the HPGR is offline, the mill can be fed from the emergency stockpile by reclaiming using a front end loader (FEL). The HPGR feed bin and HPGR screen feed bin combined live capacity was designed to be 1 hour, allowing adequate time for the FEL to mobilise without stopping the mill in the transition to emergency feed. The moisture content of the HPGR discharge assists in reducing the dust generation during stockpiling to a radial stockpile. The capacity of the stockpile is designed to allow for over 48 hours of mill feed, which is sufficient to cover most short term process interruptions.
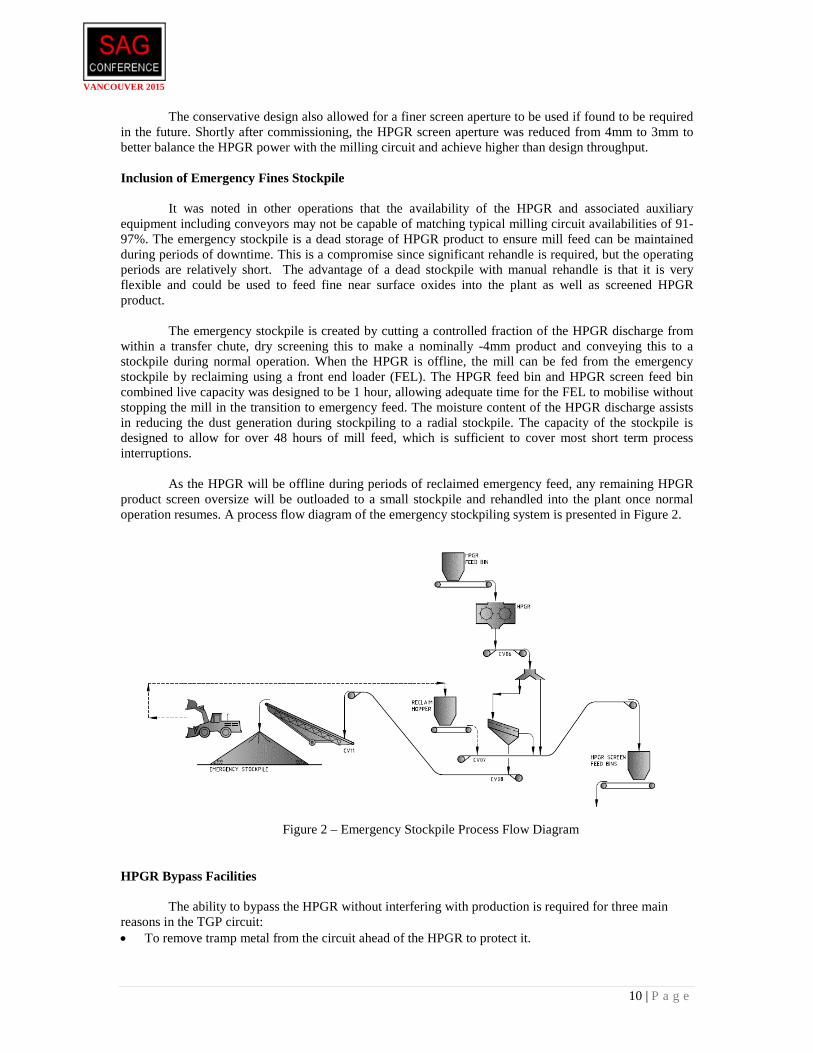
As the HPGR will be offline during periods of reclaimed emergency feed, any remaining HPGR product screen oversize will be outloaded to a small stockpile and rehandled into the plant once normal operation resumes. A process flow diagram of the emergency stockpiling system is presented in Figure 2.
Figure 2 – Emergency Stockpile Process Flow Diagram
HPGR Bypass Facilities
The ability to bypass the HPGR without interfering with production is required for three main reasons in the TGP circuit: • To remove tramp metal from the circuit ahead of the HPGR to protect it.
VANCOUVER 2015
11 | P a g e
• To bypass oxide material which is not suitable for HPGR crushing and does not require fine crushing prior to milling
• To reduce incidences of extended pulse feeding (periods of just screen oversize recycle ) passing through the HPGR, which is high in moisture content and subsequently promotes incidences of autogenous layer washout as well as increasing slippage of the rolls. Both contribute to increased wear of the rolls while the latter also reduces the capacity of the HPGR.
The ability to bypass the HPGR was allowed in two key places in the HPGR circuit. The first is in
the HPGR feed chute, where a diverter gate can be used to bypass the feed directly onto the HPGR discharge conveyor. A metal detector is positioned on the HPGR belt feeder, and the gate is automatically actuated when metal is detected. This gate is also used to bypass the HPGR during periods of 100% oxide feed, which was important during initial operation. Attempting to treat oxide material through the HPGR causes a number of issues including severe roll slippage resulting in volumetrically constrained throughput, and conversely periods of very low re-circulating load occur which makes maintaining choke fed conditions difficult. Without choke fed conditions, the HPGR feed hopper is subject to excessive wear. Where the blend cannot be controlled to ensure sufficient primary ore is present to allow for normal operation of the HPGR, the rolls are bypassed. During extended periods of predominately oxide feed, the HPGR screen panel apertures are opened to 8mm (bottom deck screen panels removed) to minimise the amount of oversize generated when the HPGR is offline.
The second bypass point is installed on the HPGR screen oversize conveyor at a transfer point. A
diverter gate is used to redirect the screen oversize to a stockpile if required, rather than retuning to the HPGR feed. This is also linked to a metal detector, which automatically actuates the gate on metal detection. The gate can also be actuated when the secondary crushing circuit is temporarily offline, which starves the HPGR of new feed. During these periods, only HPGR screen oversize reports to the HPGR feed bin, creating a layer of very moist feed. The feeding of slugs of this material through the HPGR can cause high moisture washout of the autogenous layer, which can take hours of operation to recover. Bleeding the oversize out of the circuit at these times is necessary to prevent this damage.
The integrity of the autogenous layer is frequently monitored during operation via visual
inspection, and automatic bypass controls are in place to prevent pulse feeding using measurements from online moisture analysers. This system, coupled with routine inspection and replacement of broken studs, has led to the life of the rolls exceeding the design predicted life of 7,500h for the first set of rolls. At the time of writing, the Tropicana HPGR is still operating on the first set of rolls since commissioning (+10,000 hrs). The rolls exhibit only a mild bathtub wear profile, with the wear fairly evenly distributed across the width of the rolls (Figure 3).
VANCOUVER 2015
12 | P a g e
.
Figure 3 – Tropicana Rolls at 10,000 Load Hours
Screen Pulping Box Design
HPGR testing of the TGP ore at a laboratory scale showed that the primary ore produces little flake, which is easily broken up with the addition of water. As the oxide/transition ore component increases, the size and competency of the flake increases with the oxide material acting as a binding agent. The flake was not competent enough to require an additional de-agglomeration stage such as scrubbing the ore prior to screening. Additional de-agglomeration was however predicted to be required for some feed blends, beyond simply submersing the ore in water. To achieve this, the HPGR screen pulping boxes were designed to provide increased retention time and also to impart some additional energy to break up the flake.
The design consists of three flooded troughs, with water jets agitating the troughs and directly impacting the flakes. As the ore is pulped, it must cascade from one trough to the next. There are four points of impact that the screen feed is subjected to before screening; increasing the amount of tumbling energy applied to the flake. High pressure spray bars on the top and bottom decks of the screens are used to wash the fines off the oversize.
This design was found to work well at Tropicana with good feed preparation ahead of the screen
and minimal flake reporting back to the HPGR. The design also promotes adequate pulping with reduced water input, which is important at TGP to manage the water balance. The design of the pulping box is shown in Figure 4.
VANCOUVER 2015
13 | P a g e
Figure 4 – Pulping Box Design
Mill Selection
The ball milling energy requirement evolved during the development of the project. This was
primarily due to more information progressively becoming available from operating plants with HPGR circuits and large ball mills. The true energy benefit of HPGR crushed feed in full scale production is still being investigated, however it is now believed by the authors to be significantly less than that which was suggested by testwork and generally accepted by the industry at the time of the Tropicana project studies and design. In conjunction with this, the performance of large diameter ball mills is now suspected to not comply with conventional power modelling approaches and efficiency predictions. In light of this data becoming available, the HPGR benefit to ball mill energy requirement was reduced by about 50% from the original to the final design.
A variable speed drive was selected for the mill to allow for increased flexibly in accommodating feed variability expected during the early years of operation. This allows the circuit to maintain the required grind and reduce the mill starting load on the power station. It was always intended that the crushing plant selection should ensure adequate feed for the ball mill at all times and this has been the case to date, but with some of the most competent primary ores that have been processed recently, the HPGR circulating load is building up to above design levels, indicating that margins applied to unit selections were appropriate and not excessive.
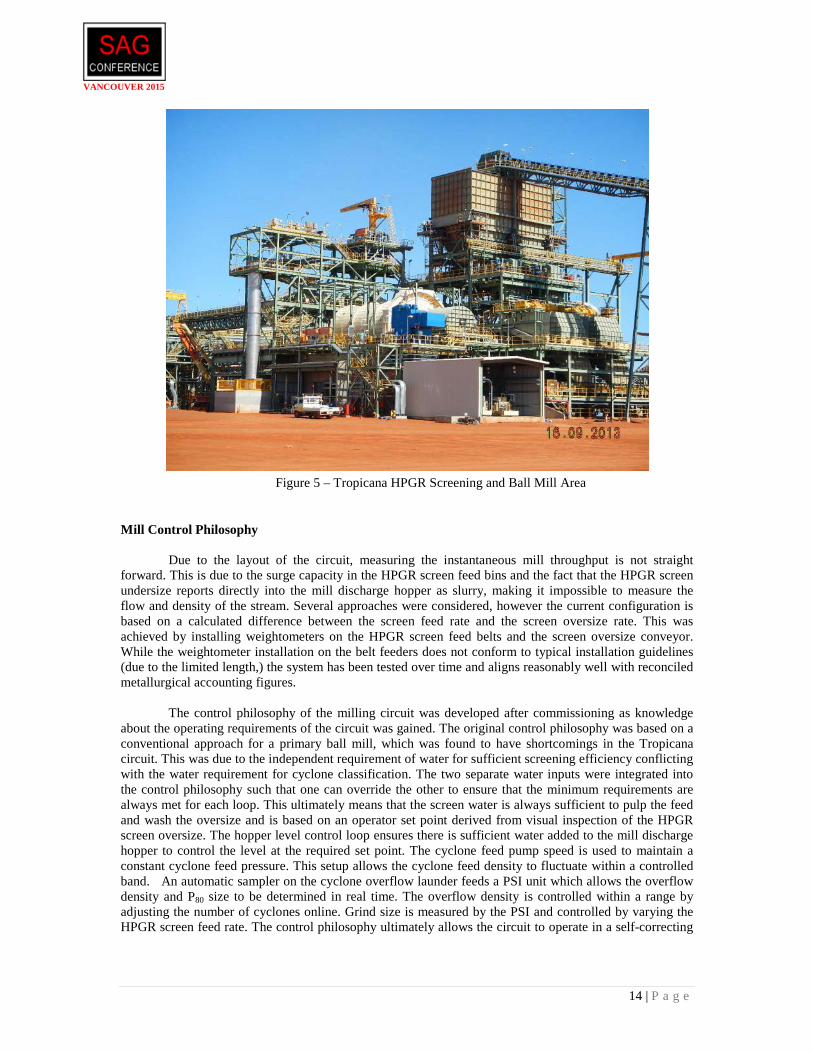
Figure 5 shows the TGP HPGR screening and ball mill area.
VANCOUVER 2015
14 | P a g e
Figure 5 – Tropicana HPGR Screening and Ball Mill Area
Mill Control Philosophy
Due to the layout of the circuit, measuring the instantaneous mill throughput is not straight forward. This is due to the surge capacity in the HPGR screen feed bins and the fact that the HPGR screen undersize reports directly into the mill discharge hopper as slurry, making it impossible to measure the flow and density of the stream. Several approaches were considered, however the current configuration is based on a calculated difference between the screen feed rate and the screen oversize rate. This was achieved by installing weightometers on the HPGR screen feed belts and the screen oversize conveyor. While the weightometer installation on the belt feeders does not conform to typical installation guidelines (due to the limited length,) the system has been tested over time and aligns reasonably well with reconciled metallurgical accounting figures.
The control philosophy of the milling circuit was developed after commissioning as knowledge
about the operating requirements of the circuit was gained. The original control philosophy was based on a conventional approach for a primary ball mill, which was found to have shortcomings in the Tropicana circuit. This was due to the independent requirement of water for sufficient screening efficiency conflicting with the water requirement for cyclone classification. The two separate water inputs were integrated into the control philosophy such that one can override the other to ensure that the minimum requirements are always met for each loop. This ultimately means that the screen water is always sufficient to pulp the feed and wash the oversize and is based on an operator set point derived from visual inspection of the HPGR screen oversize. The hopper level control loop ensures there is sufficient water added to the mill discharge hopper to control the level at the required set point. The cyclone feed pump speed is used to maintain a constant cyclone feed pressure. This setup allows the cyclone feed density to fluctuate within a controlled band. An automatic sampler on the cyclone overflow launder feeds a PSI unit which allows the overflow density and P80 size to be determined in real time. The overflow density is controlled within a range by adjusting the number of cyclones online. Grind size is measured by the PSI and controlled by varying the HPGR screen feed rate. The control philosophy ultimately allows the circuit to operate in a self-correcting
VANCOUVER 2015
15 | P a g e
way; if the re-circulating load increases, some water is displaced with slurry from the mill discharge as water is backed off to the hopper to keep a constant level. The cyclone feed density increases, which in turn results in the grind coarsening, so the PSI controller reduces feed tonnes and the re-circulating load reaches equilibrium with the cyclone cutpoint and the achievable grind size.
HPGR feed rate and roll speed is adjusted to maintain the wet screen feed bin level. The new feed
rate to the secondary crusher screens is controlled to maintain the HPGR feed bin level within a range. The operator can manually override grind size control of mill feed rate if there are downstream constraints which require the throughput to be limited. There are also other control loops in place that can override this due to other constraints on the plant. Overall, the philosophy works well in maximising plant throughput, minimising over grinding and reducing process variability.
It was found that as the percentage of primary ore in the feed increased, the amount of water on
the HPGR screens could be reduced, which assisted in stabilising the operation. Excessive water on the HPGR screens affects the water balance around the cyclones and consequently restricts the grind to finer sizes which can be throughput limiting. It is important that the HPGR screen water addition is continuously optimised and the maximum set point adjusted when feed changes occur to prevent flooding the circuit with too much water. Construction and Commissioning
The construction of the plant commenced in the first quarter of 2011 with commissioning completed in October 2013.
A time line of key events for the project is presented in Figure 6.
Figure 6 – Tropicana Project Timeline
The plant was started on oxide ore, therefore the HPGR was bypassed to allow commissioning of
the rest of the plant. The HPGR was commissioned just after the first gold pour in September 2013, when more competent feed became available. Immediately following the HPGR commissioning, optimisation of grinding circuit commenced including control loop tuning while ramping up the plant to meet nameplate throughput. The design throughput was achieved within two months of the HPGR commissioning. Optimisation continued beyond reaching design throughput and first gold pour, with the focus shifting to grinding circuit operation including HPGR performance, control philosophy, screening efficiency and thickening.
CURRENT OPERATION
This section provides a summary of the general operating parameters of the plant and examines
how the performance of the plant is tracking to date. The average monthly throughput and grind since commissioning is presented in Figure 7.
VANCOUVER 2015
16 | P a g e
Figure 7 – Mill Throughput and Cyclone Overflow (COF) P80
Plant performance was affected by raw water availability from the bore fields during the second half of 2014; which constrained throughput rates during that time. This issue was resolved by the start of 2015 and is no longer a constraint. The plant has still managed to achieve above design production figures on average. The HPGR and ball mill utilisation (based on total run time and including downtime caused by external factors to the HPGR/ball mill circuit) is shown in Figure 8.
The primary crusher has operated at higher than design availability, where design was originally based on an 8 hour operating day. The increased run time has been necessary as the design throughput of 2,500t/h has not been achievable on a sustainable basis. The root cause of this reduced throughput has been attributed to a combination of issues:
• Cooling system of the primary crusher preventing sustained ability to draw the installed power. • Wear profile of the mantle and concave liners has detrimentally impacted crushing efficiency. • The crusher size was reduced during the feasibility study; therefore operation during both day and
nightshift is required. The secondary crushing stage performs well with good feed size control to the HPGR, but the
operating availability has been less than design. The decision to omit a secondary crushed stockpile significantly reduced the overall CAPEX, however this in turn requires adequate design of the secondary crushing stage to operate in duty/standby mode to ensure design availability is achieved. The current design and selected equipment does not allow for the duty/standby mode of operation as was originally intended, which should be given more consideration and capital allowance for future designs if the secondary crushed stockpile is to be omitted.
The HPGR has outperformed expectations in terms of power consumption and consequently
throughput. The recirculating load has been just below 100% on average, well below the design number from testwork scale-up of 140%. This has allowed significantly increased capacity in the HPGR, and has resulted in the HPGR wet screen bottom deck aperture being reduced to a 3mm aperture to better balance the load between the HPGR and ball mill. It is anticipated that as the feed to the HPGR transitions further into harder primary ore, the recirculating load will increase and the 4mm screen panel apertures may need to be reinstated.
While operation of the HPGR has generally been free of the issues experienced on other HPGR
plants, maintaining choke fed conditions has been a problem at times due to the unreliability of the radar level sensor in the HPGR feed chute. This resulted in increased wear in the feed chute to the HPGR, however the primary cause is believed to be selection of liner materials which has since been effectively resolved. It is still however recommended that load cells are considered in conjunction with the radar level sensor for HPGR feed chute designs in future.
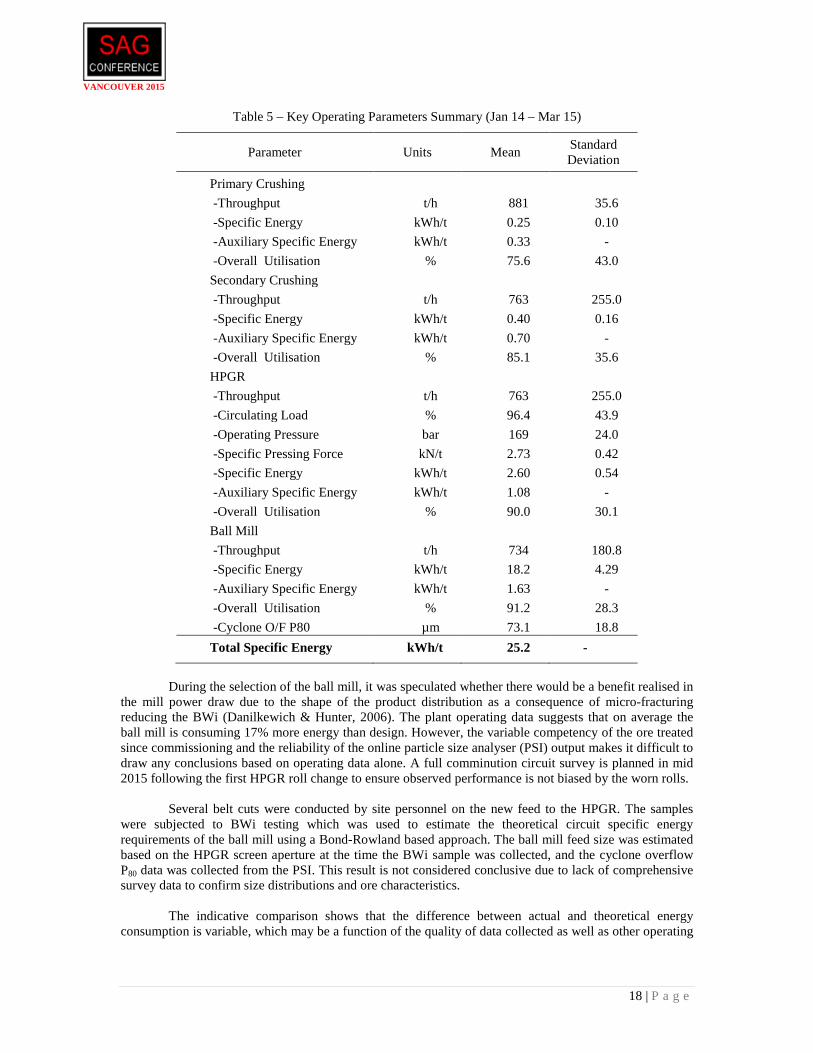
Table 5 provides a summary of the average operating values from January 2014 to March 2015.
The initial two month operating period, where predominantly oxide was as treated, has been excluded from the operating data summary. The feed processed since then has been varying blends of transition and primary ore.
-Throughput t/h 881 35.6 -Specific Energy kWh/t 0.25 0.10 -Auxiliary Specific Energy kWh/t 0.33 - -Overall Utilisation % 75.6 43.0 Secondary Crushing
-Throughput t/h 763 255.0 -Specific Energy kWh/t 0.40 0.16 -Auxiliary Specific Energy kWh/t 0.70 - -Overall Utilisation % 85.1 35.6 HPGR
-Throughput t/h 763 255.0 -Circulating Load % 96.4 43.9 -Operating Pressure bar 169 24.0 -Specific Pressing Force kN/t 2.73 0.42 -Specific Energy kWh/t 2.60 0.54 -Auxiliary Specific Energy kWh/t 1.08 - -Overall Utilisation % 90.0 30.1 Ball Mill
-Throughput t/h 734 180.8 -Specific Energy kWh/t 18.2 4.29 -Auxiliary Specific Energy kWh/t 1.63 - -Overall Utilisation % 91.2 28.3 -Cyclone O/F P80 µm 73.1 18.8 Total Specific Energy kWh/t 25.2 -
During the selection of the ball mill, it was speculated whether there would be a benefit realised in
the mill power draw due to the shape of the product distribution as a consequence of micro-fracturing reducing the BWi (Danilkewich & Hunter, 2006). The plant operating data suggests that on average the ball mill is consuming 17% more energy than design. However, the variable competency of the ore treated since commissioning and the reliability of the online particle size analyser (PSI) output makes it difficult to draw any conclusions based on operating data alone. A full comminution circuit survey is planned in mid 2015 following the first HPGR roll change to ensure observed performance is not biased by the worn rolls.
Several belt cuts were conducted by site personnel on the new feed to the HPGR. The samples
were subjected to BWi testing which was used to estimate the theoretical circuit specific energy requirements of the ball mill using a Bond-Rowland based approach. The ball mill feed size was estimated based on the HPGR screen aperture at the time the BWi sample was collected, and the cyclone overflow P80 data was collected from the PSI. This result is not considered conclusive due to lack of comprehensive survey data to confirm size distributions and ore characteristics.
The indicative comparison shows that the difference between actual and theoretical energy consumption is variable, which may be a function of the quality of data collected as well as other operating
VANCOUVER 2015
19 | P a g e
parameters in the circuit. However, the available data does suggest that on average, the actual energy consumption is slightly greater (5.2%) than that predicted by the Bond-Rowland method when no benefit is applied for the HPGR feed preparation. The range over five field tests was 0% to 8% higher power consumption when compared to the theoretical prediction. Confirmation of the performance along with further investigation of the milling circuit efficiency will occur following the circuit survey later in 2015. This is planned to occur on 100% primary material, to test the plant performance on design ore. Consumables
A summary of the TGP comminution circuit consumable usage rates for the past year is presented
in Table 6.
Table 6 – Reagents and Media Consumption Summary
Consumable Usage Rate
Gyratory -Mantle 2,200hrs -Concave 4,400hrs
Secondary Crusher Liners 765hrs
HPGR Rolls +10,000hrs*
Mill Liners +10,000hrs* Mill Media 0.76kg/t
* Commissioning set pending replacement mid 2015 (≈ 11,300hrs)
The plant operating costs for the period April 2014 to February 2015 (processing and maintenance) of the circuit are summarised in Table 7. Mining and non plant related costs are excluded from all figures.
VANCOUVER 2015
20 | P a g e
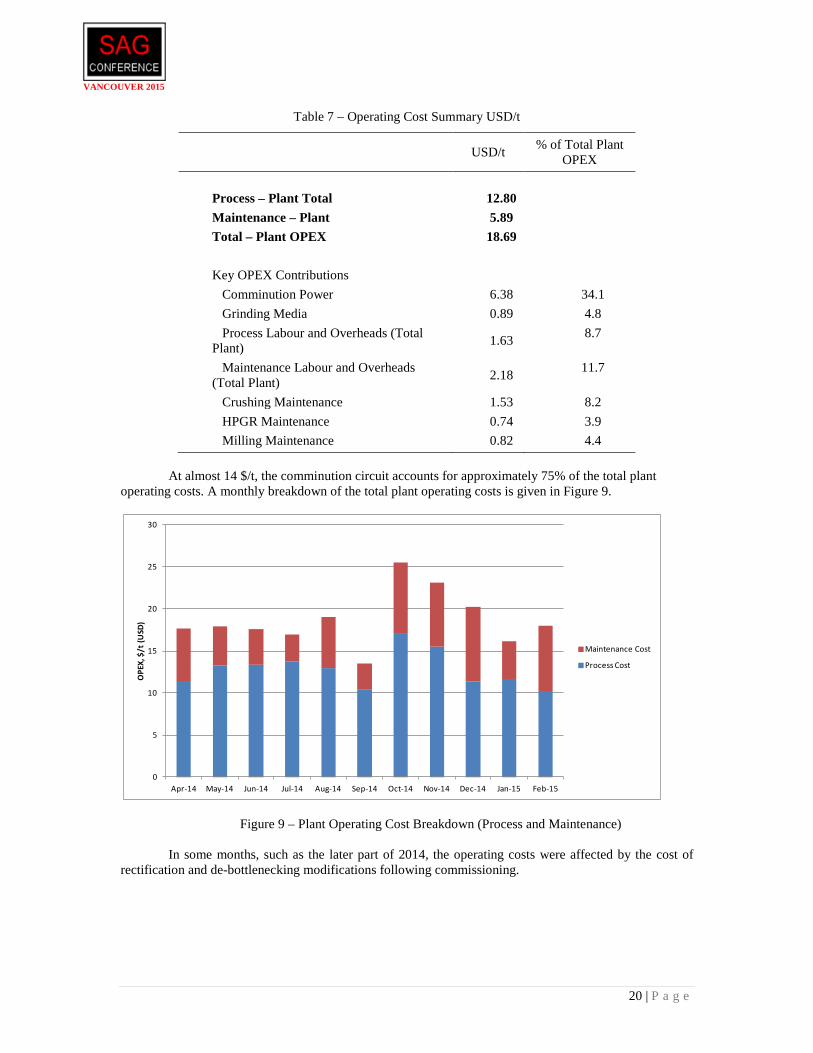
Table 7 – Operating Cost Summary USD/t
USD/t % of Total Plant
OPEX
Process – Plant Total 12.80 Maintenance – Plant 5.89 Total – Plant OPEX 18.69
Key OPEX Contributions Comminution Power 6.38 34.1 Grinding Media 0.89 4.8 Process Labour and Overheads (Total Plant) 1.63 8.7
Maintenance Labour and Overheads (Total Plant) 2.18 11.7
At almost 14 $/t, the comminution circuit accounts for approximately 75% of the total plant
operating costs. A monthly breakdown of the total plant operating costs is given in Figure 9.
Figure 9 – Plant Operating Cost Breakdown (Process and Maintenance)
In some months, such as the later part of 2014, the operating costs were affected by the cost of rectification and de-bottlenecking modifications following commissioning.
CONCLUSIONS AND LESSONS LEARNED Construction of the TGP commenced in the first quarter of 2011, with commissioning completed
in the third quarter of 2013. The design throughput was achieved within two months of HPGR commissioning, and has since been sustained. The ease of commissioning the circuit and rapid ramp up of the plant was achieved by taking onboard the lessons learned from other earlier projects which adopted HPGR circuits. The key design aspects which have allowed for the ongoing successful operation of the comminution circuit are summarised as follows:
• Secondary crusher design must allow for adequate capacity in closed circuit operation to control feed
top size to the HPGR. Design should allow for sufficient margin in the secondary screen and crusher capacity to achieve a product finer than the maximum tolerated by the HPGR, to allow for screen wear. This has been fundamental to the success of the TGP circuit, where pressure spikes and high skew trips are extremely rare.
• The circuit must have enough flexibility to bypass the HPGR to protect the rolls. These facilities are used extensively on the TGP HPGR circuit to cope with a range of feed types, bypass overly moist feed and remove tramp metal. This has minimised stud breakage and allowed for protection of the autogenous layer on the HPGR.
• The availability difference between the HPGR circuit and ball mill circuit must be accounted for in the design of the plant to ensure nameplate throughput can be maintained. The HPGR requires stoppages for inspections, stud replacement and chute repairs. The ability to stockpile HPGR crushed fines has lead to the milling circuit design availability being achieved on average for the year. The design availability is not however achieved every month, and this is a function of greater than anticipated downtime experienced upstream of the mill, particularly in relation to maintenance of the secondary crushing stage bins and feeders. Upgrading of the dry screen on the emergency feed system is currently underway to increase the capacity of this system.
• Diligent monitoring of the roll conditions is recommended to prevent difficult to repair occurrences. Rolls are inspected weekly for broken studs, which are recorded and changed during opportunistic downtime maintenance. Edge carbides were scheduled for change immediately after commissioning to prevent damaging the dovetail grooves and avoid extensive repairs. This has resulted in all studs still being intact at the +10,000h operating mark for the commissioning rolls. The rolls have thus lasted significantly longer than forecast. Roll life was estimated during the study at 7,500 h/set.
• Design of the HPGR wet screens needs to factor in sufficient dewatering capacity, account for partial pegging and ensure adequate de-agglomeration of flake ahead of the screens. These factors have not been issues at Tropicana, allowing the screen aperture to be reduced to balance the milling and HPGR circuits. Conveyor design must match the full capacity of the screens and HPGR to ensure that major plant equipment can be fully utilised.
• The design of the HPGR screen pulping boxes is important to ensure efficient water usage to prevent flooding the downstream circuit, and also providing sufficient pulping action. Control of the water balance is important as excess water compromises the performance of the cyclones.
• The control philosophy for the milling circuit must balance the conflicting water demands for the HPGR screens and the mill classification circuit. It is recommended that mill throughput is automated using online particle size analysis to promote maximum throughput at the required grind target. Measurement of instantaneous throughput for control and operational purposes can be achieved by using weightometers on the HPGR screen feed belts.
• As an additional benefit, the fine mill feed size creates a very stable milling circuit and also alleviates the need for a high cost steel lining systems. The optimum grinding media size is relatively small, leading to a longer mill lining service life.
The following aspects of the design require further consideration in future HPGR circuit designs:
VANCOUVER 2015
22 | P a g e
• The HPGR choke feeding control loop should be based on a load cell in conjunction with a level sensor in the HPGR feed chute.
• If designing the secondary stage for operation in duty/ standby mode, the configuration of the equipment selected must be suitable to ensure this mode of operation can be achieved. Alternatively, sufficient surge capacity such as a stockpile should be allowed in the design between the secondary crushers and HPGR circuit. Modifications are currently underway at TGP to change the tramp metal removal system on the HPGR screen oversize return conveyor to allow for generation of an additional stockpile to feed the HPGR when the secondary crushers are offline.
• It is the current view of the authors that ball mill design for large HPGR circuits should not allow for any reduction in milling power draw following feed preparation using an HPGR (whether attributed to the effects of microcracking or PSD), particularly for large ball mills. This is being investigated further, but no energy benefit should be applied for design purposes given current evidence from the TGP.
ACKNOWLEDGMENTS
The authors wish to acknowledge the support and contribution of the AGA Tropicana operations
and maintenance teams.
REFERENCES Daniel M.J., Morrell S., (May 2004). HPGR Model Verification and Scale-up, Minerals Engineering, 22:
pp.1149-1161. Danilkewich H., & Hunter I., (2006). HPGR Challenges and Growth Opportunities, Department of Mining
Engineering, University of British Columbia, Vancouver, Vol 4: pp.27-44. Hart S., Parker B., Rees T., Manesh A., & Mcgaffin I., (2011). Commissioning and Ramp Up of the HPGR
Circuit at Newmont Boddington Gold, SAG 2011. Hart S., Rees T., Tavani S., Valery W., & Jankovic A., (2011). Process Integration and Optimisation of the
Boddington HPGR Circuit, SAG 2011. Koski S., Vanderbeek J., & Enriquez J., (2011). Process Integration and Optimisation of the Boddington
HPGR Circuit, SAG 2011. Vanderbeek J.L., Linde T.B., Brack W.S., & Marsden J.O., (2006). HPGR Implemenation at Cerro Verde,
Department of Mining Engineering, University of British Columbia, Vancouver, vol iv. pp. 45 – 61.