9
PROCEEDINGS of the 3 rd Internaonal Conference on Chemical Technology www.icct.cz April 13 - 15, 2015 Mikulov, Czech Republic

PROCEEDINGSof the 3rd Internati onal Conference on Chemical Technology
www.icct.cz
April 13 - 15, 2015Mikulov, Czech Republic

3rd International Conference on Chemical Technology | ICCT 2015
[500]
ASPEN HYSYS MODELLING IN SAFETY ANALYSIS AUTOMATION Janošovský J., Labovský J., Jelemenský Ľ. Institute of Chemical and Environmental Engineering, Slovak University of Technology, Bratislava, Slovakia [email protected] Introduction During the last decade chemical industry has undergone a considerable change. Economic pressure caused the requirement of higher yields and led to the modification of chemical processes towards extreme temperatures and pressures. The demand for detailed process hazard analysis is growing due to extreme conditions in which modern chemical productions are being operated. The necessity of appropriate process safety analysis is well recognized after occurrence of several tragic accidents that could have been avoided. There are several process hazard analysis methods including What-If, Checklist, Failure Modes and Effects Analysis (FMEA) and Hazard and Operability (HAZOP). HAZOP is one of the most used process hazard analysis technique. HAZOP study is a highly disciplined procedure based on combinations of guide words and process variables. When the guide word (more, less, none …) is applied to a process variable, a deviation is generated. The objective of the HAZOP study is to monitor the causes, propagation and consequences of process variable deviations. Conventional final HAZOP report represents a list of all possible deviations, their causes and consequences, analysis of such consequences, existing level of protection and recommended actions1. HAZOP analysis was used and modified in many hazard identification procedures including determination of the required safety instrument level, blended hazard identification methodology and HAZOP analysis based on structural model2,3,4. The disadvantages of a conventional HAZOP study are its time-consuming character and high cost. The lack of time and experiences of human expert team is often the major obstacle of a HAZOP execution in chemical industry. The most frequently proposed solution of these inconveniences is automation of HAZOP analysis. A literature review of the HAZOP-related research proved that nearly 40 % of published literature is focused on automating HAZOP (Figure 1)5. There are two preferred approaches in HAZOP automation: knowledge-based and model-based. The knowledge-based approach is based on systems using a knowledge base containing information about the failure mode, causes and consequences of various process units and/or pieces of equipment. Typical knowledge-based expert systems proposed particularly in the 20th century are HAZOPExpert, TOPHAZOP and AHA6,7,8.
Figure 1. HAZOP-related publication review The knowledge-based approach has one significant disadvantage: in the age of constant development of technology in chemical industry and pushing the limits of process variables to extreme values, it is questionable, if the identification of all possible hazardous events is sufficient using only large databases of experience. Together with development of computer technology in 21st century, these are the reasons, why the model-based approach has gained more importance. The main benefits of the use of mathematical modelling in hazard identification are presented in various case studies e.g. reactive distillation in MTBE production or fixed bed catalytic reactor with parallel reactions9. The model-based HAZOP study is based on the implementation of a detailed mathematical model of a chemical process. The conventional HAZOP study does
3rd International Conference on Chemical Technology | ICCT 2015
[501]
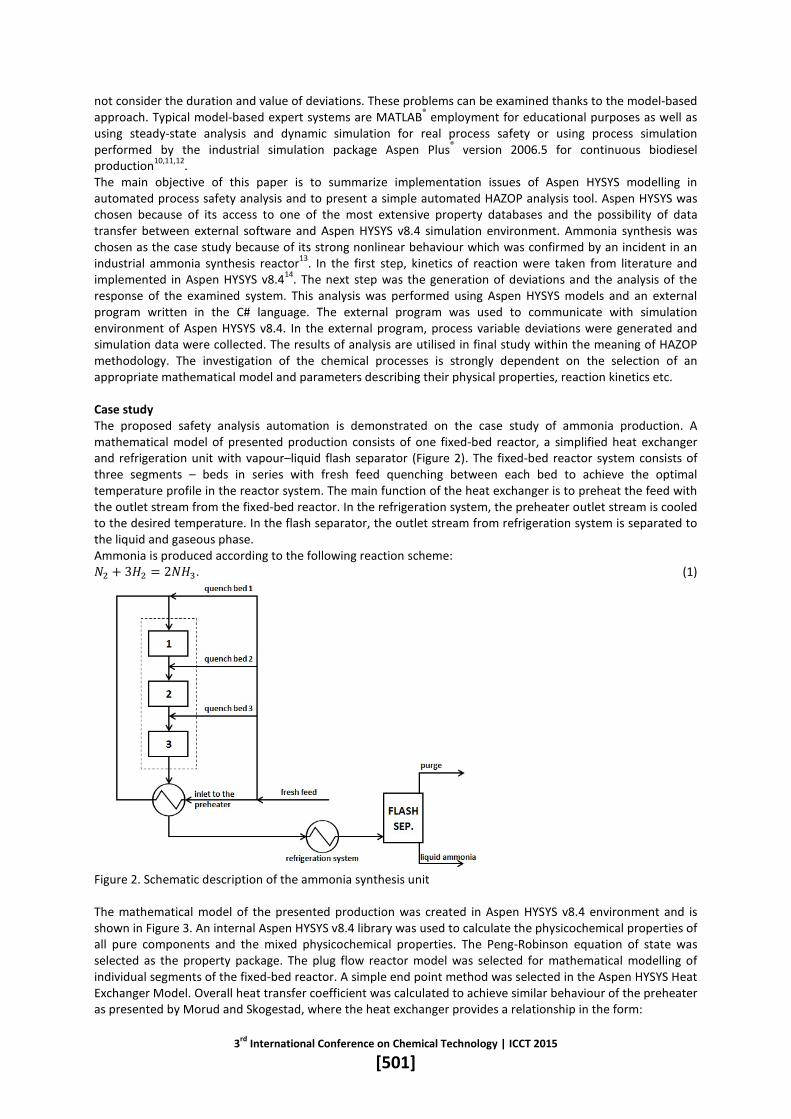
not consider the duration and value of deviations. These problems can be examined thanks to the model-based approach. Typical model-based expert systems are MATLAB® employment for educational purposes as well as using steady-state analysis and dynamic simulation for real process safety or using process simulation performed by the industrial simulation package Aspen Plus® version 2006.5 for continuous biodiesel production10,11,12. The main objective of this paper is to summarize implementation issues of Aspen HYSYS modelling in automated process safety analysis and to present a simple automated HAZOP analysis tool. Aspen HYSYS was chosen because of its access to one of the most extensive property databases and the possibility of data transfer between external software and Aspen HYSYS v8.4 simulation environment. Ammonia synthesis was chosen as the case study because of its strong nonlinear behaviour which was confirmed by an incident in an industrial ammonia synthesis reactor13. In the first step, kinetics of reaction were taken from literature and implemented in Aspen HYSYS v8.414. The next step was the generation of deviations and the analysis of the response of the examined system. This analysis was performed using Aspen HYSYS models and an external program written in the C# language. The external program was used to communicate with simulation environment of Aspen HYSYS v8.4. In the external program, process variable deviations were generated and simulation data were collected. The results of analysis are utilised in final study within the meaning of HAZOP methodology. The investigation of the chemical processes is strongly dependent on the selection of an appropriate mathematical model and parameters describing their physical properties, reaction kinetics etc. Case study The proposed safety analysis automation is demonstrated on the case study of ammonia production. A mathematical model of presented production consists of one fixed-bed reactor, a simplified heat exchanger and refrigeration unit with vapour–liquid flash separator (Figure 2). The fixed-bed reactor system consists of three segments – beds in series with fresh feed quenching between each bed to achieve the optimal temperature profile in the reactor system. The main function of the heat exchanger is to preheat the feed with the outlet stream from the fixed-bed reactor. In the refrigeration system, the preheater outlet stream is cooled to the desired temperature. In the flash separator, the outlet stream from refrigeration system is separated to the liquid and gaseous phase. Ammonia is produced according to the following reaction scheme: 𝑁2 + 3𝐻2 = 2𝑁𝐻3. (1)
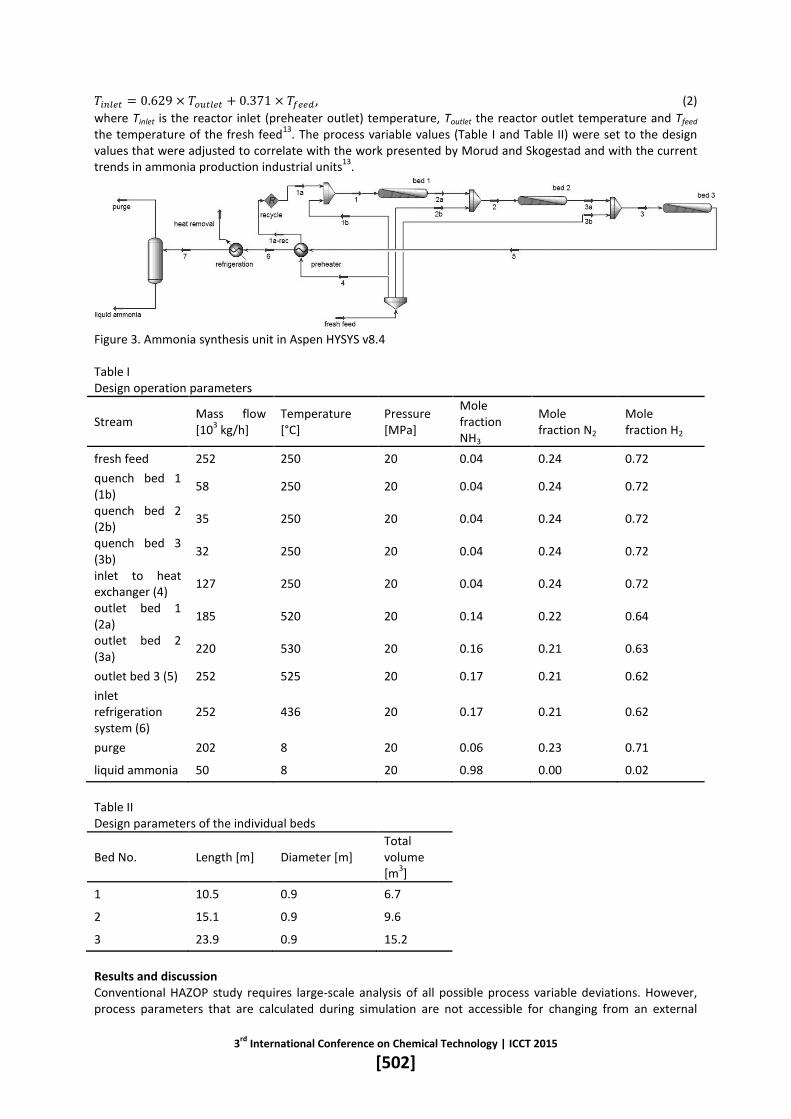
Figure 2. Schematic description of the ammonia synthesis unit The mathematical model of the presented production was created in Aspen HYSYS v8.4 environment and is shown in Figure 3. An internal Aspen HYSYS v8.4 library was used to calculate the physicochemical properties of all pure components and the mixed physicochemical properties. The Peng-Robinson equation of state was selected as the property package. The plug flow reactor model was selected for mathematical modelling of individual segments of the fixed-bed reactor. A simple end point method was selected in the Aspen HYSYS Heat Exchanger Model. Overall heat transfer coefficient was calculated to achieve similar behaviour of the preheater as presented by Morud and Skogestad, where the heat exchanger provides a relationship in the form:
3rd International Conference on Chemical Technology | ICCT 2015
[502]
𝑇𝑖𝑛𝑙𝑒𝑡 = 0.629 × 𝑇𝑜𝑢𝑡𝑙𝑒𝑡 + 0.371 × 𝑇𝑓𝑒𝑒𝑑, (2) where Tinlet is the reactor inlet (preheater outlet) temperature, Toutlet the reactor outlet temperature and Tfeed the temperature of the fresh feed13. The process variable values (Table I and Table II) were set to the design values that were adjusted to correlate with the work presented by Morud and Skogestad and with the current trends in ammonia production industrial units13.
Figure 3. Ammonia synthesis unit in Aspen HYSYS v8.4 Table I Design operation parameters
Stream Mass flow [103 kg/h]
Temperature [°C]
Pressure [MPa]
Mole fraction NH3
Mole fraction N2
Mole fraction H2
fresh feed 252 250 20 0.04 0.24 0.72 quench bed 1 (1b) 58 250 20 0.04 0.24 0.72
quench bed 2 (2b) 35 250 20 0.04 0.24 0.72
quench bed 3 (3b) 32 250 20 0.04 0.24 0.72
inlet to heat exchanger (4) 127 250 20 0.04 0.24 0.72
outlet bed 1 (2a) 185 520 20 0.14 0.22 0.64
outlet bed 2 (3a) 220 530 20 0.16 0.21 0.63
outlet bed 3 (5) 252 525 20 0.17 0.21 0.62 inlet refrigeration system (6)
252 436 20 0.17 0.21 0.62
purge 202 8 20 0.06 0.23 0.71
liquid ammonia 50 8 20 0.98 0.00 0.02 Table II Design parameters of the individual beds
Bed No. Length [m] Diameter [m] Total volume [m3]
1 10.5 0.9 6.7
2 15.1 0.9 9.6
3 23.9 0.9 15.2 Results and discussion Conventional HAZOP study requires large-scale analysis of all possible process variable deviations. However, process parameters that are calculated during simulation are not accessible for changing from an external
3rd International Conference on Chemical Technology | ICCT 2015
[503]
environment. This fact complicates the manipulation with output streams. Therefore, only deviations of input parameters can be examined. The fresh feed stream was selected for process hazard analysis. The list of typical process variable deviations based on conventional combining guide words with selected feed parameters is presented in Table III. However, the consideration of the value of the deviation is allowed in a model-based HAZOP study by mathematical modelling. Detailed simulations of the presented system were carried out in order to perform the parametric sensitivity analysis of the reaction conditions and to evaluate the effect of selected deviations on the analysed reactor system. Table III Process variable deviations generated by a conventional HAZOP study Guide word
Process variable Deviation Deviation applied to the fresh feed stream
More Temperature Higher temperature The fresh feed temperature higher than a design value
Less Temperature Lower temperature The fresh feed temperature lower than a design value
More Pressure Higher pressure The fresh feed pressure higher than a design value
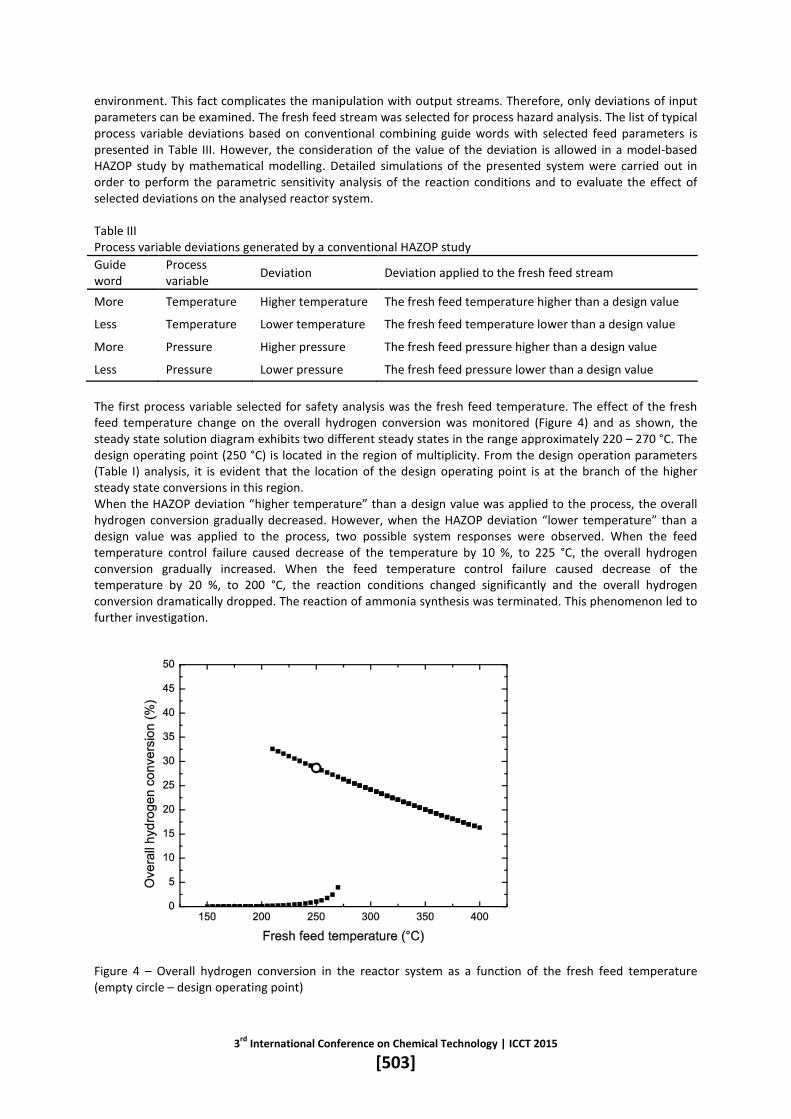
Less Pressure Lower pressure The fresh feed pressure lower than a design value The first process variable selected for safety analysis was the fresh feed temperature. The effect of the fresh feed temperature change on the overall hydrogen conversion was monitored (Figure 4) and as shown, the steady state solution diagram exhibits two different steady states in the range approximately 220 – 270 °C. The design operating point (250 °C) is located in the region of multiplicity. From the design operation parameters (Table I) analysis, it is evident that the location of the design operating point is at the branch of the higher steady state conversions in this region. When the HAZOP deviation “higher temperature” than a design value was applied to the process, the overall hydrogen conversion gradually decreased. However, when the HAZOP deviation “lower temperature” than a design value was applied to the process, two possible system responses were observed. When the feed temperature control failure caused decrease of the temperature by 10 %, to 225 °C, the overall hydrogen conversion gradually increased. When the feed temperature control failure caused decrease of the temperature by 20 %, to 200 °C, the reaction conditions changed significantly and the overall hydrogen conversion dramatically dropped. The reaction of ammonia synthesis was terminated. This phenomenon led to further investigation.
Figure 4 – Overall hydrogen conversion in the reactor system as a function of the fresh feed temperature (empty circle – design operating point)
3rd International Conference on Chemical Technology | ICCT 2015
[504]
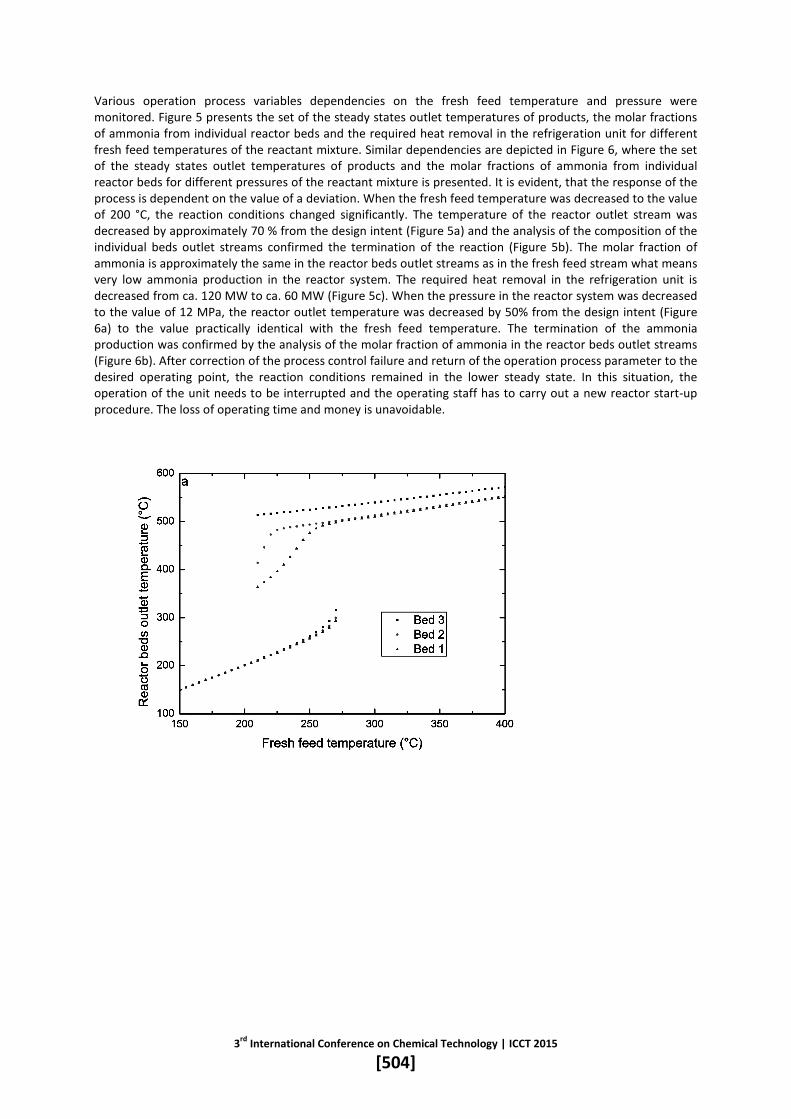
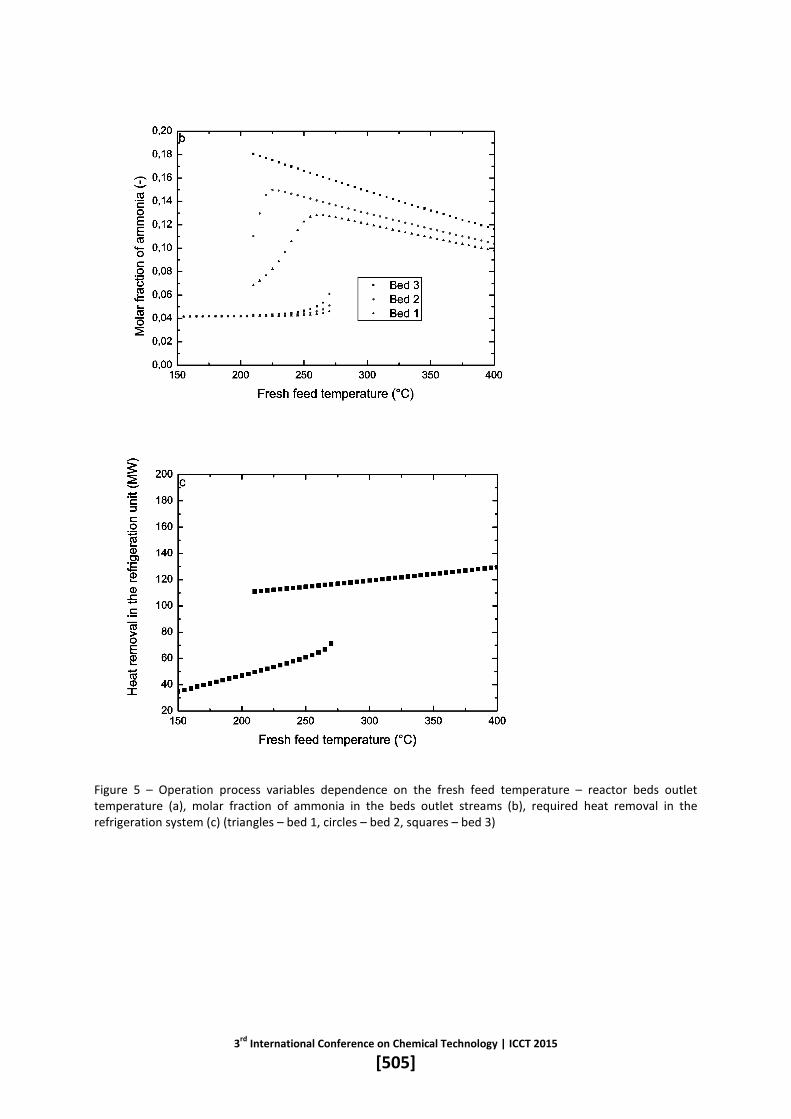
Various operation process variables dependencies on the fresh feed temperature and pressure were monitored. Figure 5 presents the set of the steady states outlet temperatures of products, the molar fractions of ammonia from individual reactor beds and the required heat removal in the refrigeration unit for different fresh feed temperatures of the reactant mixture. Similar dependencies are depicted in Figure 6, where the set of the steady states outlet temperatures of products and the molar fractions of ammonia from individual reactor beds for different pressures of the reactant mixture is presented. It is evident, that the response of the process is dependent on the value of a deviation. When the fresh feed temperature was decreased to the value of 200 °C, the reaction conditions changed significantly. The temperature of the reactor outlet stream was decreased by approximately 70 % from the design intent (Figure 5a) and the analysis of the composition of the individual beds outlet streams confirmed the termination of the reaction (Figure 5b). The molar fraction of ammonia is approximately the same in the reactor beds outlet streams as in the fresh feed stream what means very low ammonia production in the reactor system. The required heat removal in the refrigeration unit is decreased from ca. 120 MW to ca. 60 MW (Figure 5c). When the pressure in the reactor system was decreased to the value of 12 MPa, the reactor outlet temperature was decreased by 50% from the design intent (Figure 6a) to the value practically identical with the fresh feed temperature. The termination of the ammonia production was confirmed by the analysis of the molar fraction of ammonia in the reactor beds outlet streams (Figure 6b). After correction of the process control failure and return of the operation process parameter to the desired operating point, the reaction conditions remained in the lower steady state. In this situation, the operation of the unit needs to be interrupted and the operating staff has to carry out a new reactor start-up procedure. The loss of operating time and money is unavoidable.
3rd International Conference on Chemical Technology | ICCT 2015
[505]
Figure 5 – Operation process variables dependence on the fresh feed temperature – reactor beds outlet temperature (a), molar fraction of ammonia in the beds outlet streams (b), required heat removal in the refrigeration system (c) (triangles – bed 1, circles – bed 2, squares – bed 3)

3rd International Conference on Chemical Technology | ICCT 2015
[506]
Figure 6 – Operation process variables dependence on the fresh feed pressure – reactor beds outlet temperature (a), molar fraction of ammonia in the beds outlet streams (b) (triangles – bed 1, circles – bed 2, squares – bed 3) The process behaviour between the higher and lower solution branches is described by the unstable steady states. When the reaction system is forced by process variable deviation to change its steady state to an unstable one, the reaction conditions stabilize in a stable steady state located on the higher or lower solution branch depending on the value and duration of the deviation. The ammonia synthesis modelling in Aspen HYSYS v8.4 environment was unable to identify these unstable steady states15. Conclusions A mathematical model suitable for the identification and accurate prediction of nonlinear behaviour of ammonia synthesis was proposed in this work. The case study was focused on the investigation of multiple steady states present in an ammonia synthesis fixed-bed reactor system. As presented, a reaction system can be operated in different regimes (temperature, conversion, pressure …) under the same feed conditions. In the analysed reactor system, an approximately 20 % decrease of the fresh feed temperature or 40 % decrease of the pressure in the reactor system led to dramatic change of the reaction conditions. The reactor outlet temperature significantly dropped and a decrease of the reaction rate what resulted in very low ammonia production was observed. After returning the operation conditions to the desired operating point, the reaction

3rd International Conference on Chemical Technology | ICCT 2015
[507]
conditions remained in a stable steady state located on the lower solution branch. Therefore, a new reactor start-up is required. Knowledge of the multiple steady states phenomenon is crucial for stable and safe operation as well as for design phase of the ammonia synthesis unit. Consequences revealed in this work are unlikely to be detected by a conventional HAZOP analysis and therefore, the performance of a model-based HAZOP study is necessary to avoid overlooking nonlinear character of process and its possible hazard consequences. Switching between different steady states can lead to an operational problem or a dangerous event. A failure of a single process variable (the fresh feed temperature and pressure control failures were presented) can cause operation regime change of the reaction conditions. The identification of unstable steady states as well as manipulation with some internal variables was not allowed by Aspen HYSYS v8.4 modelling. Therefore, a simulation tool optimised for safety engineering purposes has to be developed. Acknowledgments This work was supported by the Slovak Scientific Agency, Grant No. VEGA 1/0749/15 and by the OP Research and Development of the project University Science Park STU Bratislava, ITMS 26240220084 , co-financed by the Fund of European Regional Development. Literature 1. Kletz T. A.: Reliab. Eng. Syst. Saf. 55, 263-266 (1997). 2. Dowell III A. M.: ISA Trans. 37, 155 (1998). 3. Seligmann B. J., Németh E., Hangos K. M., Cameron I. T.: J. Loss Prev. Process Ind. 25, 746 (2012). 4. Boonthum N., Mulalee U., Srinophakun T.: Reliab. Eng. Syst. Saf. 121, 152 (2014). 5. Dunjó J., Fthenakis V., Vílchez J. A., Arnaldos J.: J. Hazard. Mater. 173, 21 (2010). 6. Venkatasubramanian V., Vaidhyanathan R.: AIChE J. 40, 496 (1994). 7. Khan F. I., Abbasi S. A.: J. Loss Prev. Process Ind. 10, 333 (1997). 8. Kang B., Lee B., Kang K., Suh J., Yoon E.: Expert Syst. Appl. 16, 183 (1999). 9. Labovský J., Švandová Z., Markoš J., Jelemenský Ľ.: Chem. Eng. Sci. 62, 4915-4919 (2007). 10. Eizenberg S., Shacham M., Brauner N.: J. Loss Prev. Process Ind. 19, 754 (2006). 11. Labovský J., Švandová Z., Markoš J., Jelemenský Ľ.: J. Loss Prev. Process Ind. 20, 230 (2007). 12. Jeerawongsuntorn C., Sainyamsatit N., Srinophakun T.: J. Loss Prev. Process Ind. 24, 412 (2011). 13. Morud J., Skogestad S.: AIChE J. 44, 889 (1998). 14. Froment G. F., Bischoff K. B., in book: Chemical Reactor Analysis and Design, 2nd edition. p. 433. Wiley,
New York 1990. 15. Labovská Z., Labovský J., Jelemenský Ľ., Dudáš J., Markoš J.: J. Loss Prev. Process Ind. 29, 157-158 (2014).


