37
Registration Satisfaction Survey FAS Report, Fall 2010-11 Presented by: K. El Hassan, PhD. Director, OIRA.
| Date post: | 23-Dec-2015 |
| Category: |
Documents |
| Upload: | jerome-copeland |
| View: | 214 times |
| Download: | 1 times |
Registration Satisfaction Survey FAS Report, Fall 2010-11
Presented by:K. El Hassan, PhD.
Director, OIRA.

Outline
Objectives Instrument Sample Administration and Analysis Results Conclusion
Objectives To measure students’ level of satisfaction with
the registration process as a whole, and with its different processes.
To evaluate the effect of changes initiated this year on student satisfaction with the process.
To identify existing problems, if any, and recommend changes.
To identify changes in student satisfaction with various registration processes, as compared with previous surveys.
To provide some specific information on nationality background and socio-economic status of AUB students.
Instrument119 item paper survey, 88 on registration: Biographical data. The nine registration steps: Items measuring level of
student satisfaction with specific aspects of each phase of the process.
Global items measuring students’ overall satisfaction with the process,
Other related issues like Drop & Add, Financial Aid, etc.
Comments section Items soliciting student opinion and perception of the
quality of AUB programs, classrooms and laboratories Items soliciting information on nationality and socio-
economic status to meet strategic planning committees’ needs

Sample The sample initially consisted of 840
undergraduate students from all faculties representing 13% the population;
It was filled out by only 645 students (76% response rate).
Cluster sampling was used. The sample came from 29 undergraduate
classrooms representative of fall undergraduate population
Most of sample came from FAS courses.

Course SampleCourse # Sect. Enrollment Course # Sect. Enrollment
ARAB 201B 02 25 MATH 201 02 31
ENMG 502 01 36 MATH 201 01 93
PHYS 211 02 35 EECE 421 01 38
HIST 101 01 24 SOAN 201 01 30
CHEM 200 02 30 BIOL 200 04 13
ENGL 102 01 24 BUSS 200 01 28
ACCT 215 01 25 ENGL 203 01 25
ARAB 201B 02 25 NFSC 221 01 47
CMPS 209 01 59 CHEM 202 01 35
CMPS 209 02 19 ECON 203 01 27
ENGL 203 01 27 EDUC 222 01 14
ENGL 203 01 25 NURS 402 01 26
EECE 330 01 36 PHYS 200 01 35
ENGL 236 01 15 AROL 226 01 27
ENGL 203 01 26
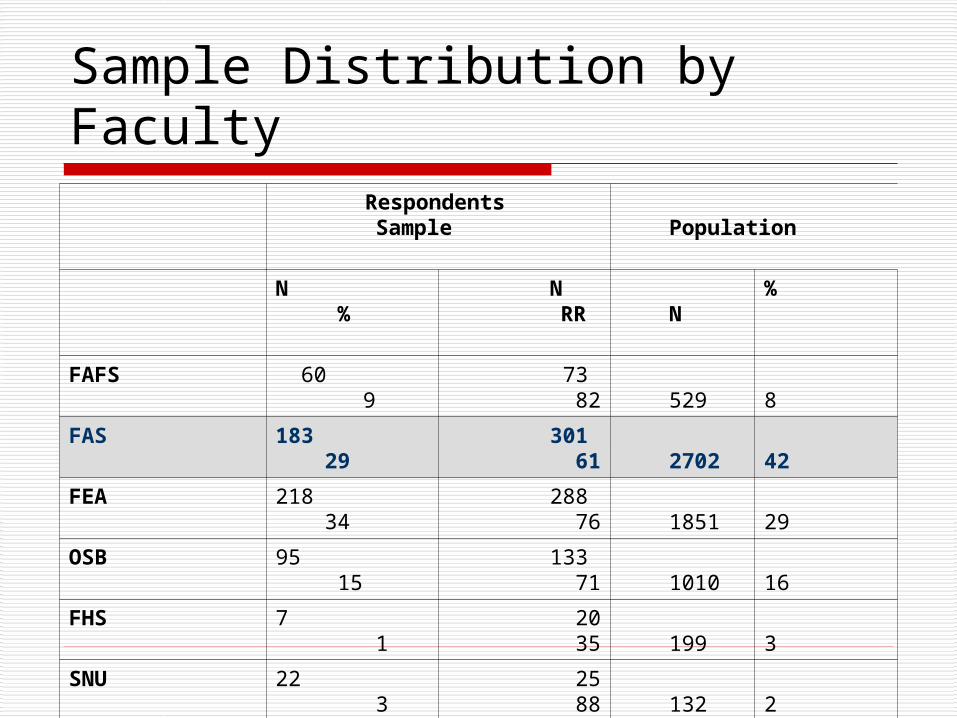
Sample Distribution by Faculty Respondents
Sample Population
N %
N RR
N %
FAFS 60 9 73 82 529 8
FAS 183 29 301 61 2702 42
FEA 218 34 288 76 1851 29
OSB 95 15 133 71 1010 16
FHS 7 1 20 35 199 3
SNU 22 3 25 88 132 2
Missing 58 9
Total 645 100
840 6423 100
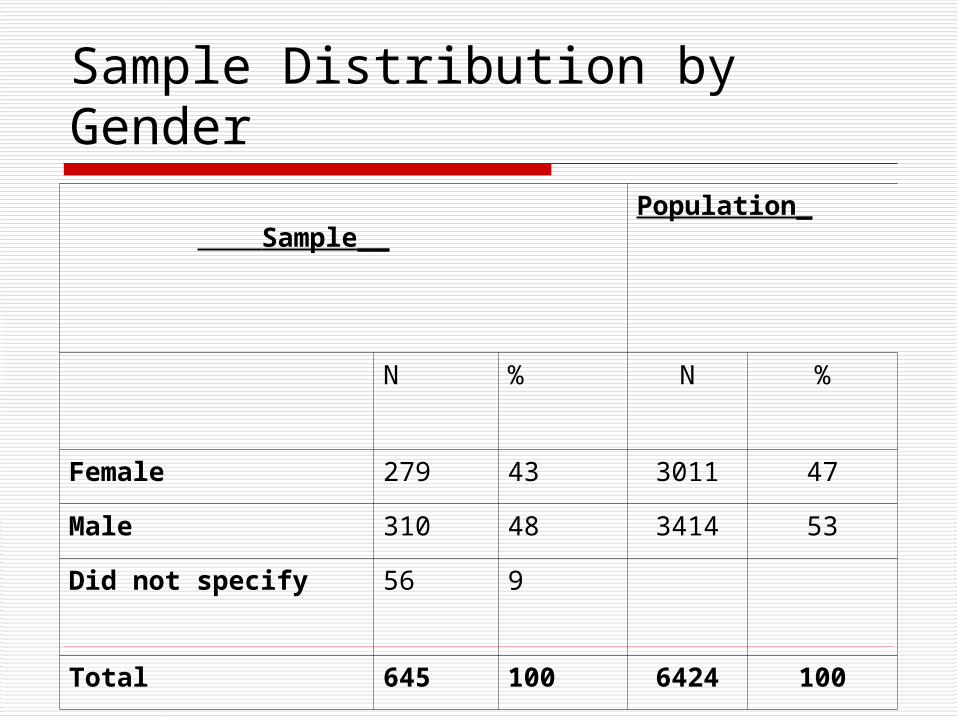
Sample Distribution by Gender Sample__
Population_
N % N %
Female 279 43 3011 47
Male 310 48 3414 53
Did not specify 56 9
Total 645 100 6424 100
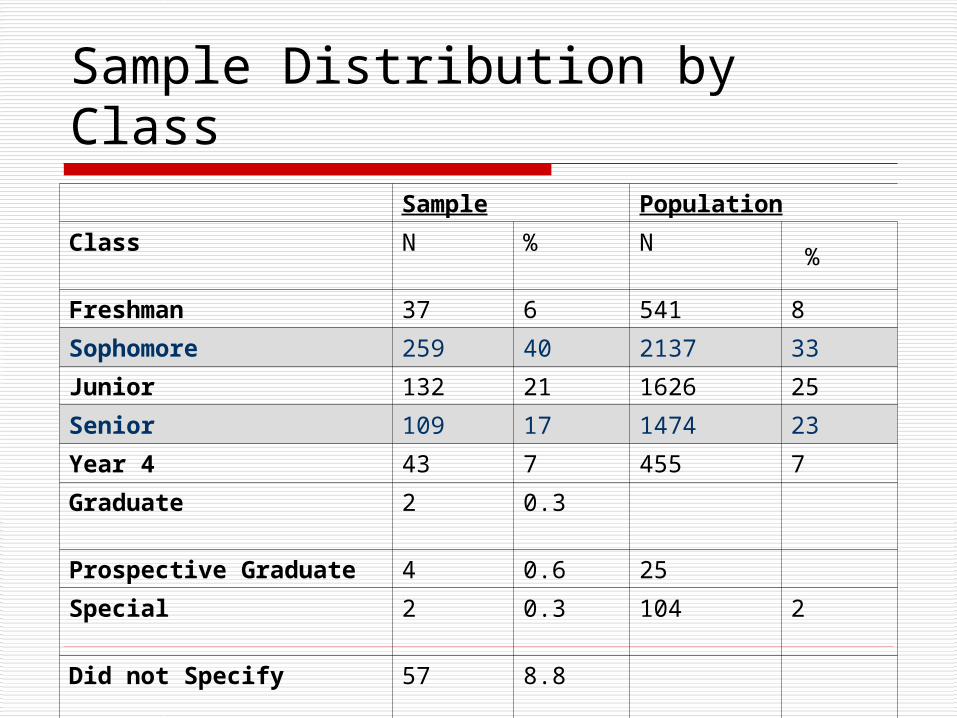
Sample Distribution by ClassSample Population
Class N % N %
Freshman 37 6 541 8
Sophomore 259 40 2137 33
Junior 132 21 1626 25
Senior 109 17 1474 23
Year 4 43 7 455 7
Graduate
2 0.3
Prospective Graduate 4 0.6 25
Special
2 0.3 104 2
Did not Specify
57 8.8
OthersTotal 645 100
6 36425
1100

Administration and AnalysisAdministration Surveys were administered in classrooms. Instructors of selected course sections were contacted
and their support was solicited. OIRA staff member administered the survey either at
beginning or end of class section, depending on instructor request.
Analysis Frequencies and descriptives were used to report the
results for the whole sample and by faculty and class. The Kruskall Wallis Test was used to test for
significant differences in responses to different items between faculties and between classes.
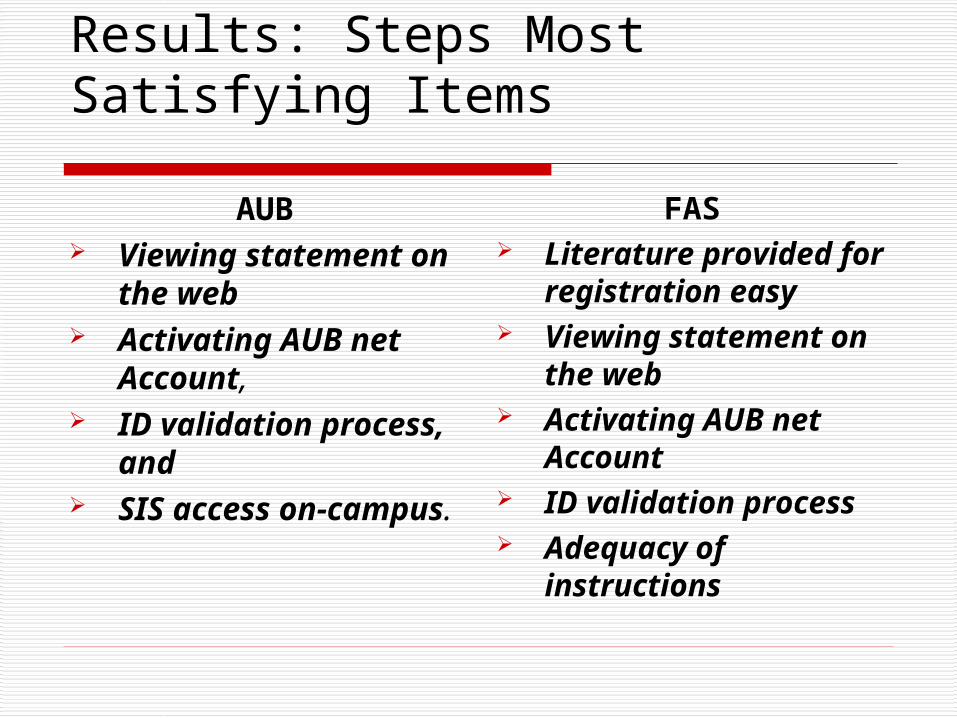
Results: Steps Most Satisfying Items
AUB Viewing statement
on the web Activating AUB net
Account, ID validation
process, and SIS access on-
campus.
FAS Literature provided
for registration easy Viewing statement
on the web Activating AUB net
Account ID validation
process Adequacy of
instructions
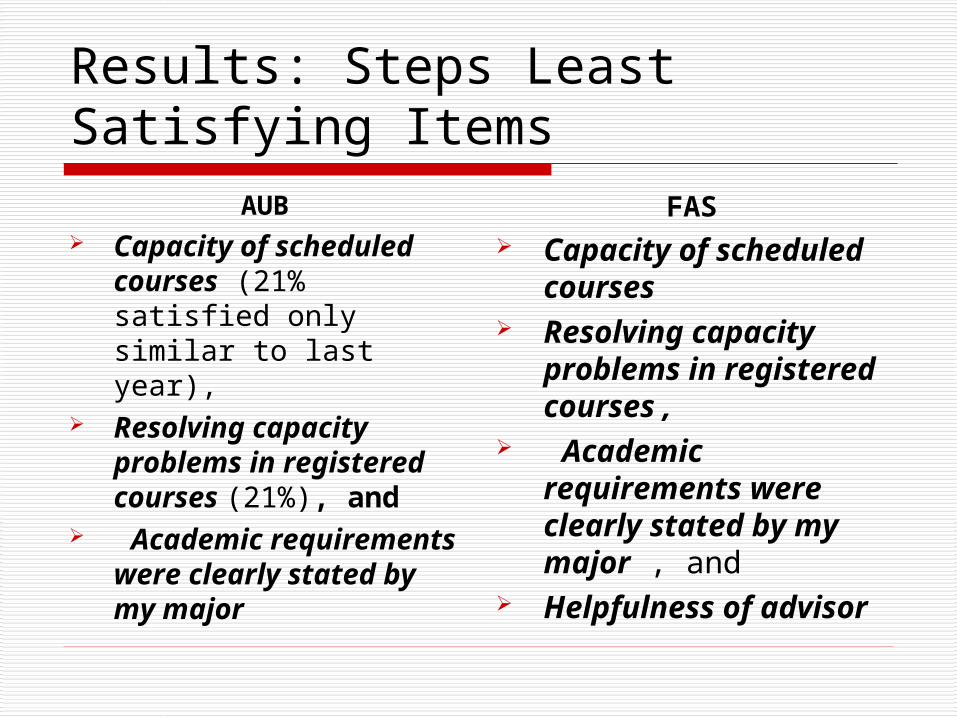
Results: Steps Least Satisfying Items
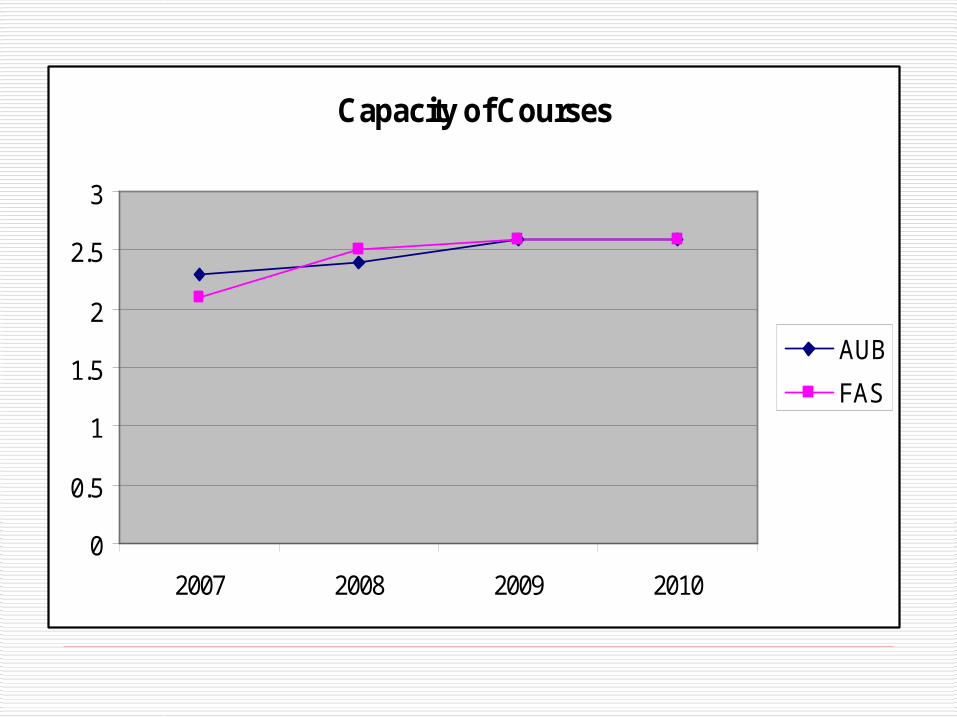
AUB Capacity of scheduled
courses (21% satisfied only similar to last year),
Resolving capacity problems in registered courses (21%), and
Academic requirements were clearly stated by my major
FAS Capacity of
scheduled courses Resolving capacity
problems in registered courses ,
Academic requirements were clearly stated by my major , and
Helpfulness of advisor

Results: Processes Most Satisfying Items
AUB AUB has high
quality academic programs (x=3.9 with 69% satisfaction vs. x=4.1, 81% in 2009)
Campus Security Staff (x = 3.7, 661%), and
AUB has high quality classroom & lab facilities (x=3.6, 58%).
FAS AUB has high
quality academic programs
Campus Security Staff
AUB has high quality classroom & lab facilities, and
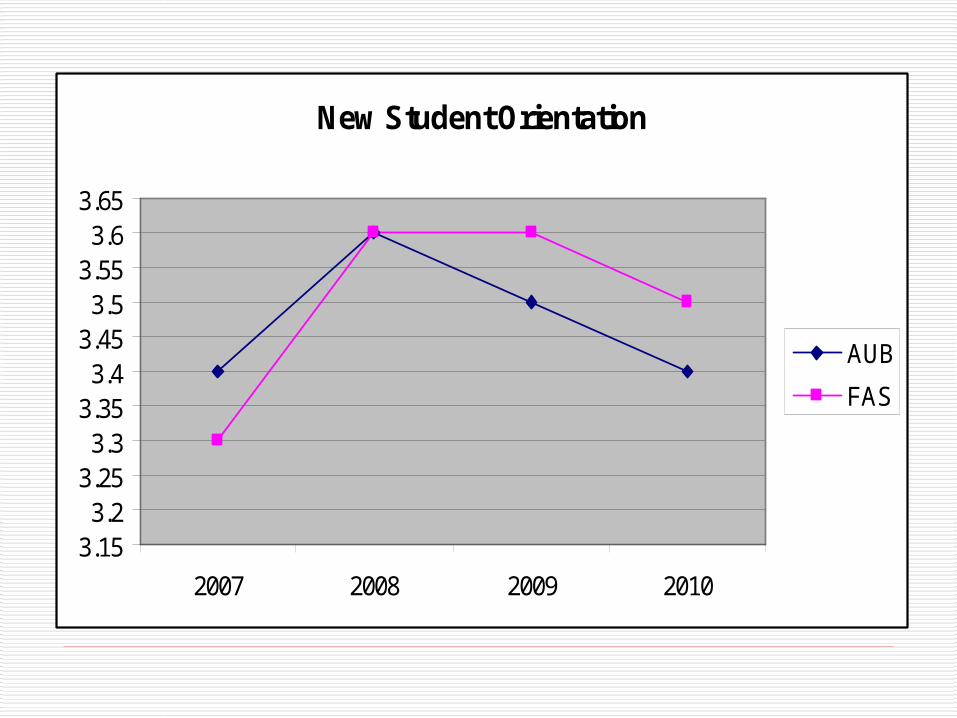
New Student Orientation
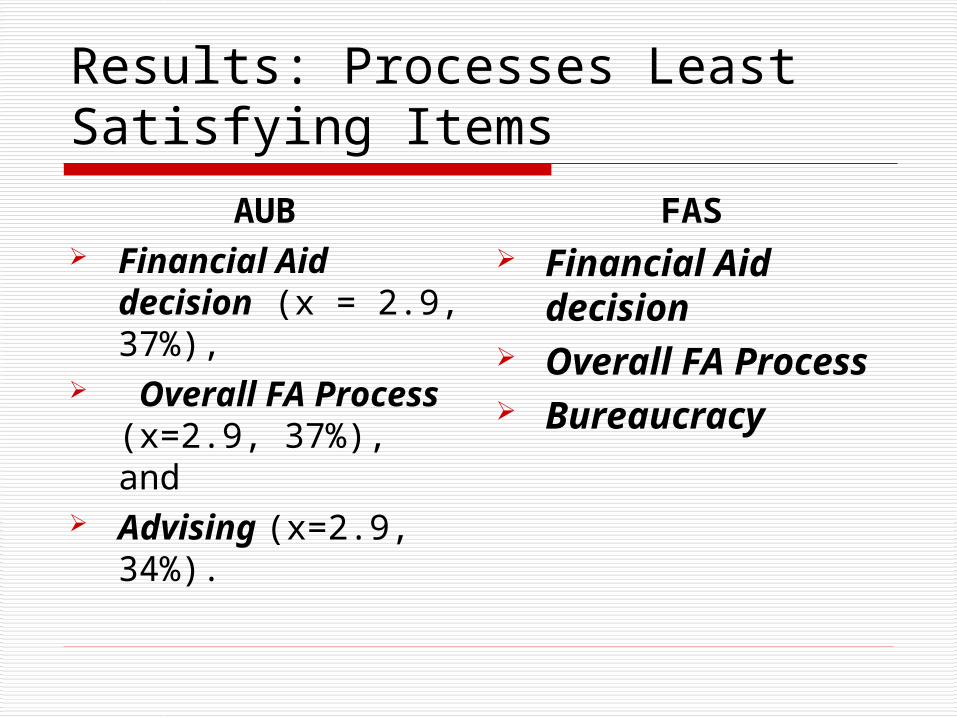
Results: Processes Least Satisfying Items
AUB Financial Aid
decision (x = 2.9, 37%),
Overall FA Process (x=2.9, 37%), and
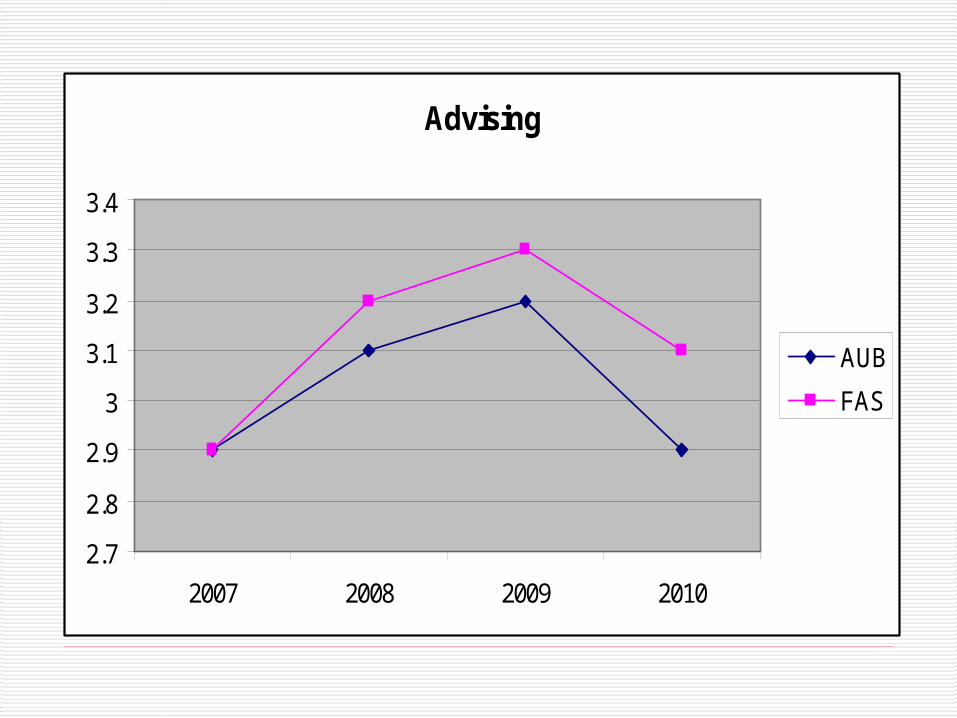
Advising (x=2.9, 34%).
FAS Financial Aid
decision Overall FA
Process Bureaucracy

Comparison with 2009AUB
Most of the items showed a drop with exception of those related to placement testing.
Highest drop was in • Academic
requirements were clearly stated by may major (-.4)
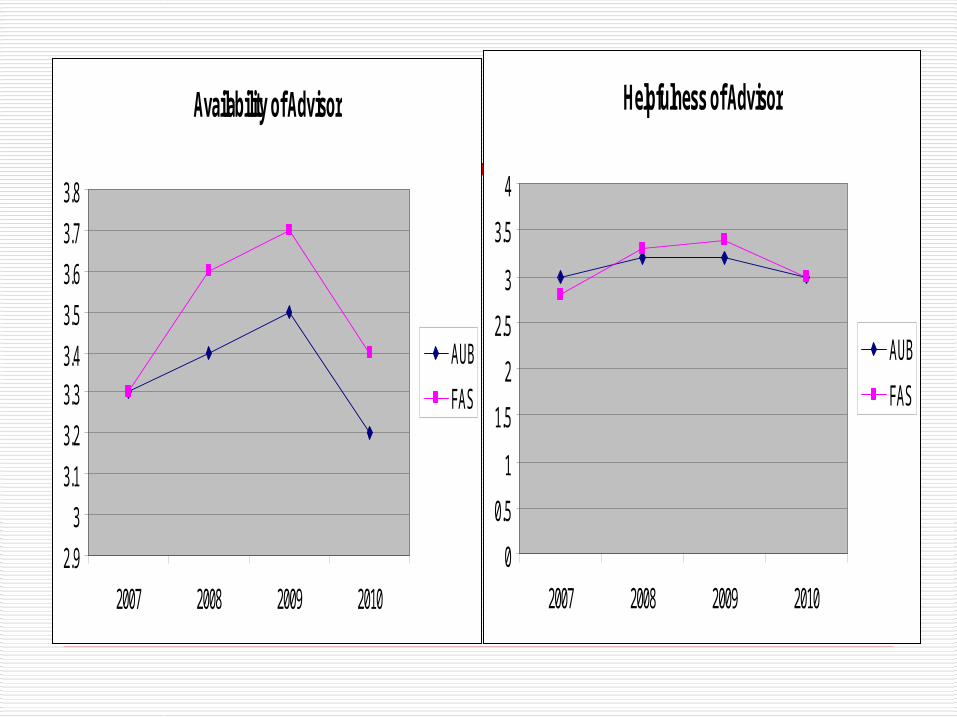
• Availability of advisor (-.3).
Improvement was in AUB EN administration (+.4)
FAS Equal number of items
went up or down (13-14) 6 items remained same. Highest drop in
• Academic requirements were clearly stated by my major (-.5)
• Helpfulness of adviser (-.4)
• Availability of advisor (-.3)
Highest improvement in placement testing.
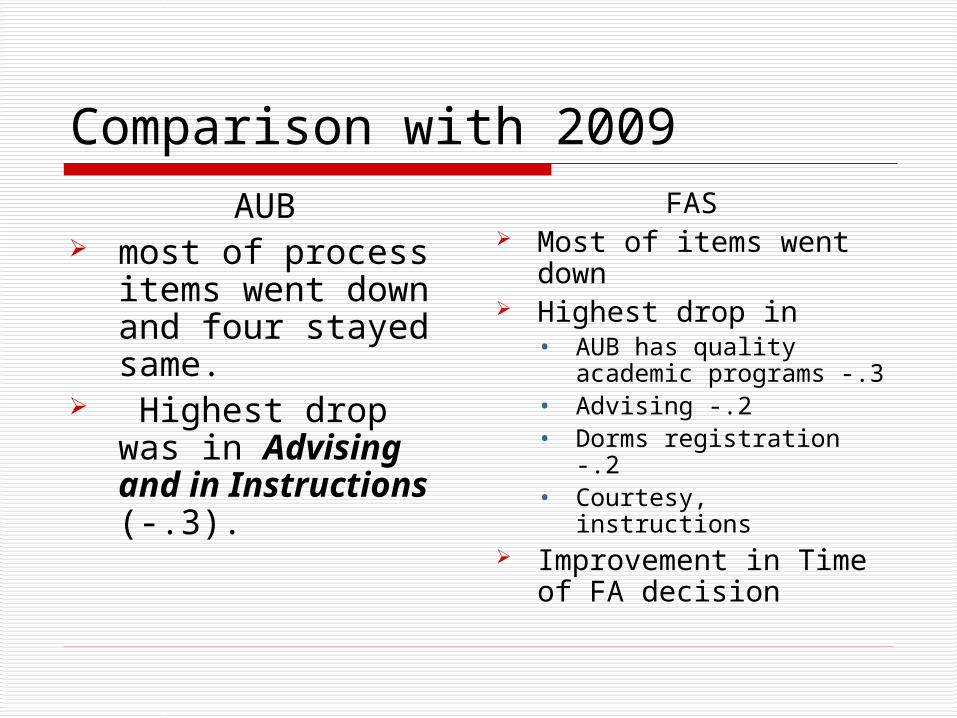
Comparison with 2009
AUB most of process
items went down and four stayed same.
Highest drop was in Advising and in Instructions (-.3).
FAS Most of items went
down Highest drop in
• AUB has quality academic programs -.3
• Advising -.2• Dorms registration -.2• Courtesy, instructions
Improvement in Time of FA decision

Other Findings
New Student Orientation FAS OSB FHS FEA FAFS HSON Attendance (% Yes) 44 37 86 39 35 23 ISOP 14 14 14 6 60 4.5 FROP 10 8 100 3 5 100 NSOP 20 16 43 26 22 14 OSB has gone up from 26%, while SNU went down from 75%

Other Findings Advising (%Yes): FAS OSB FHS FEA FAFS HSON Advisor assigned on time 89 95 100 86 92 91 Did you meet with advisor 87 79 100 40 78 100 FHS and HSON went up on assignment of advisor, while FEA and FAFS went down on meeting advisor.

Difficulty in on-line registration
Difficulty in on-line registration FAS OSB FHS FEA FAFS HSON (%Yes): 53 56 57 57 52 55 59% 63% 5% 72% 70%

Difficulty in on-line registration Reasons for difficulty: FAS OSB FHS FEA FAFS HSON # of courses offered 10 7 14 11 15 5 Course sections 20 26 14 28 25 23 Capacity 44 42 57 47 37 46 There are differences from 2009 as below # of courses offered 21 24 22 37 12 Course sections 40 49 39 57 46 Capacity 54 56 56 67 66 25

Type of Course Difficulty was Found
Type of course, difficulty was found: FAS OSB FHS FEA FAFS HSON Lower Level 22 19 43 20 15 9 Upper level 19 25 100 26 23 100 University required 36 37 14 26 30 32 Electives 30 36 71 39 38 64
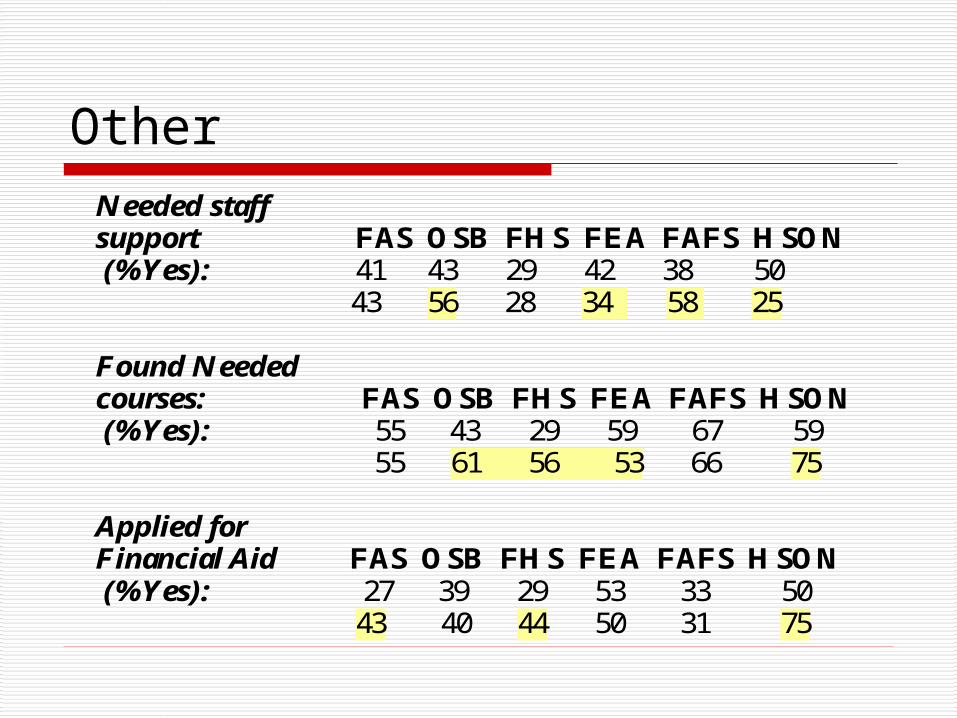
Other Needed staff support FAS OSB FHS FEA FAFS HSON (%Yes): 41 43 29 42 38 50 43 56 28 34 58 25 Found Needed courses: FAS OSB FHS FEA FAFS HSON (%Yes): 55 43 29 59 67 59 55 61 56 53 66 75 Applied for Financial Aid FAS OSB FHS FEA FAFS HSON (%Yes): 27 39 29 53 33 50 43 40 44 50 31 75

Student Satisfaction by Class
Higher mean ratings and satisfaction for freshmen on most of the steps and processes
Lowest were exhibited by juniors and sometimes senior and 4th year students.

Registration Overall Process
2.8
2.9
3
3.1
3.2
3.3
3.4
3.5
2007 2008 2009 2010
AUB
FAS
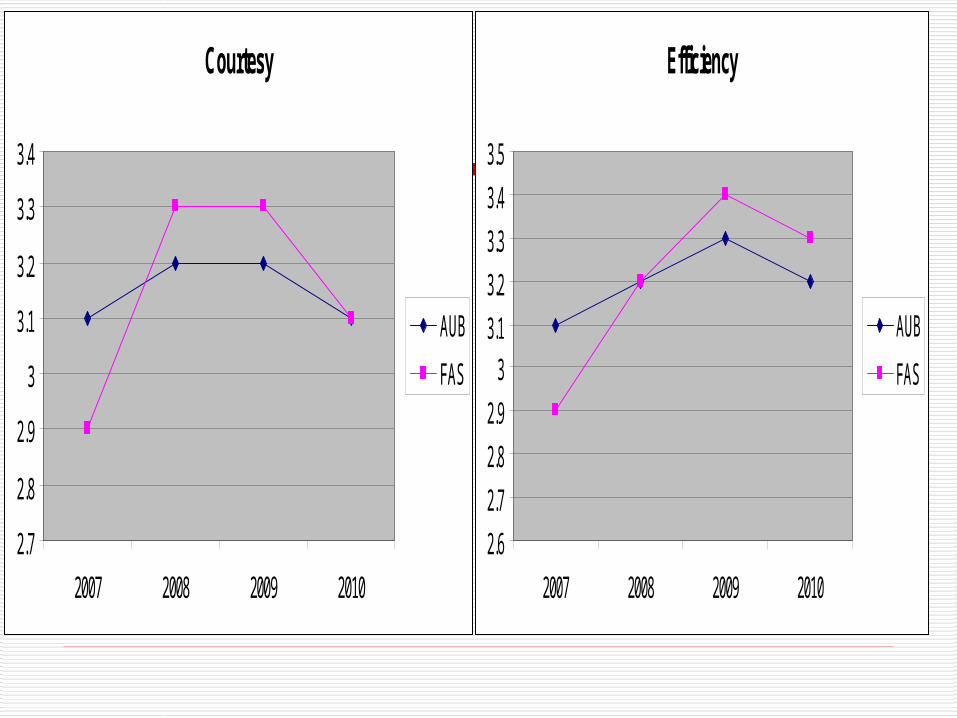
Efficiency
2.6
2.7
2.8
2.9
33.1
3.2
3.3
3.4
3.5
2007 2008 2009 2010
AUB
FAS
Courtesy
2.7
2.8
2.9
3
3.1
3.2
3.3
3.4
2007 2008 2009 2010
AUB
FAS
Advising
2.7
2.8
2.9
3
3.1
3.2
3.3
3.4
2007 2008 2009 2010
AUB
FAS
Availability of Advisor
2.9
3
3.1
3.2
3.33.4
3.5
3.6
3.7
3.8
2007 2008 2009 2010
AUB
FAS
Helpfulness of Advisor
0
0.5
1
1.5
2
2.5
3
3.5
4
2007 2008 2009 2010
AUB
FAS
Capacity of Courses
0
0.5
1
1.5
2
2.5
3
2007 2008 2009 2010
AUB
FAS
New Student Orientation
3.153.23.253.33.353.43.453.53.553.63.65
2007 2008 2009 2010
AUB
FAS

Staff Professionalism
3.053.13.153.23.253.33.353.43.453.53.55
2007 2008 2009 2010
AUB
FAS

Overall process FA
2.8
2.85
2.9
2.95
3
3.05
3.1
3.15
2007 2008 2009 2010
AUB
FAS

Dorms Registration
3
3.1
3.2
3.3
3.4
3.5
3.6
3.7
2007 2008 2009 2010
AUB
FAS
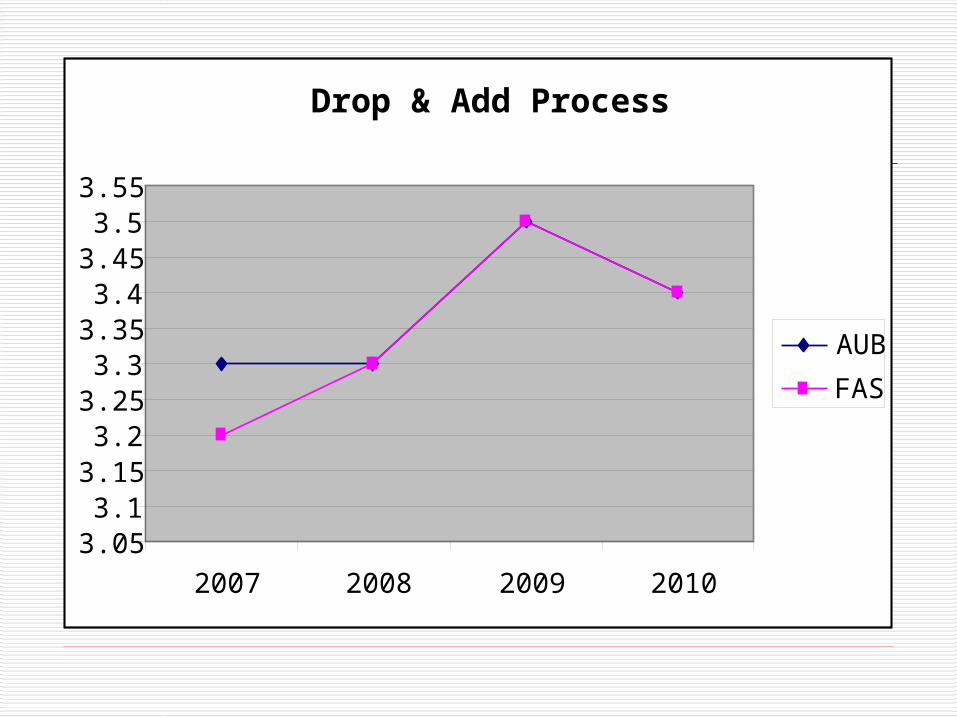
Drop & Add Process
3.053.13.153.23.253.33.353.43.453.53.55
2007 2008 2009 2010
AUB
FAS
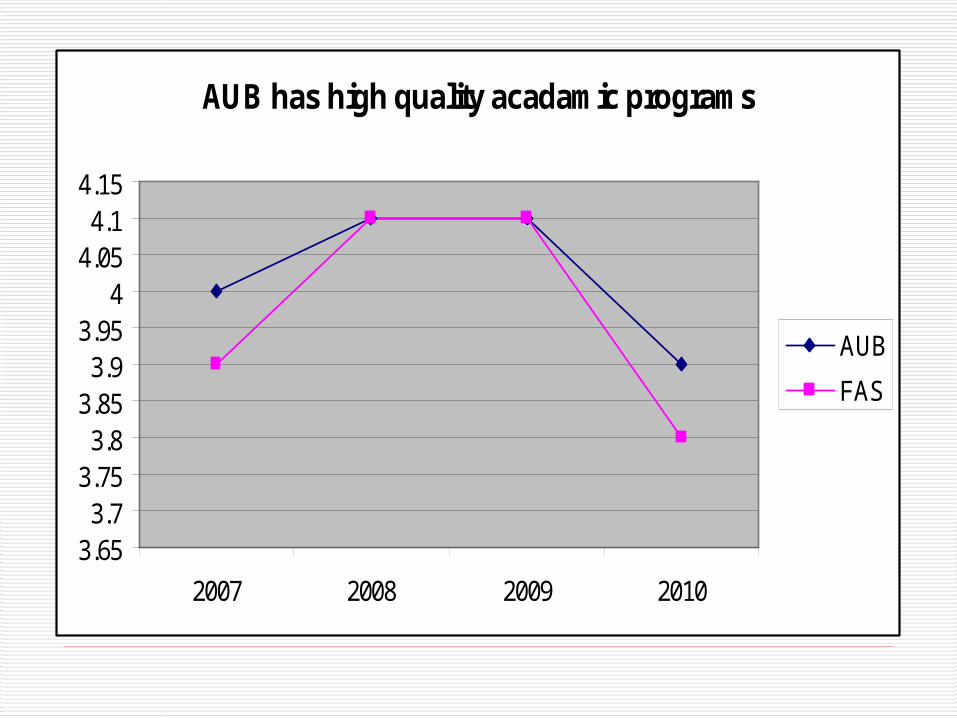
AUB has high quality acadamic programs
3.653.73.753.83.853.93.954
4.054.14.15
2007 2008 2009 2010
AUB
FAS
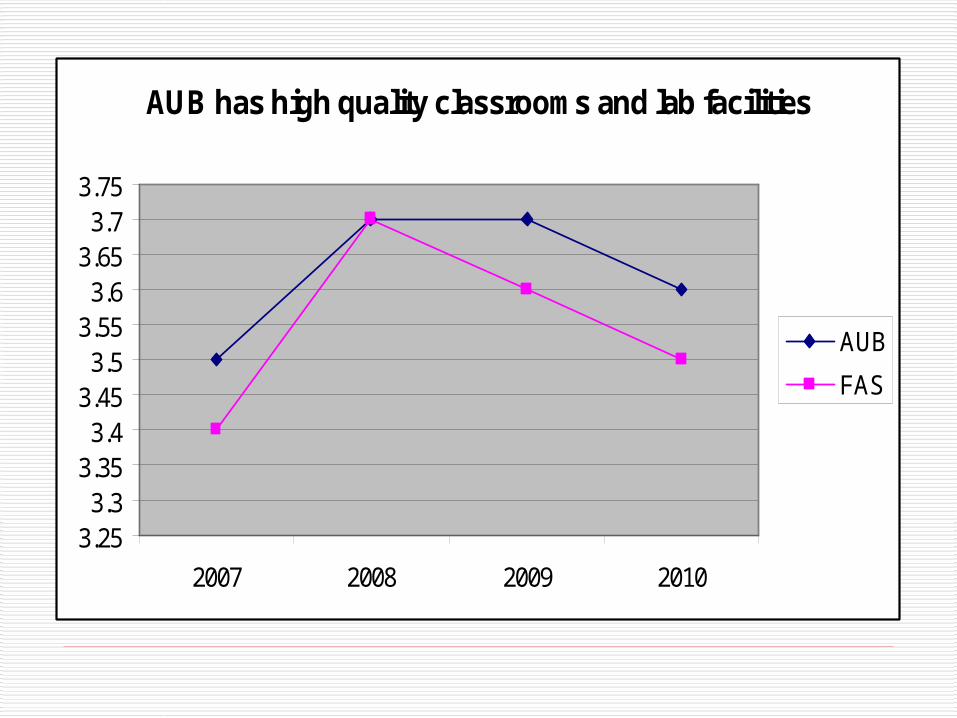
AUB has high quality classrooms and lab facilities
3.253.33.353.43.453.53.553.63.653.73.75
2007 2008 2009 2010
AUB
FAS
Conclusion Despite drop this
year, FAS has shown improvement over past 4 years on most of measures.
Overall satisfaction needs to improve.
Special attention needs to be given to advising, capacity and staff support.

Thank You.
www.aub.edu.lb/oira/assessment/institutional/Pages/registration.aspx


