Regus plc Annual report and accounts 2000 www.regus.com Regus plc (formerly known as Regus Business Centres plc) 3000 Hillswood Drive Chertsey Surrey KT16 0RS United Kingdom Registered number: 3548821 Sponsors of the 2001 Ryder Cup Regus plc Annual report and accounts 2000
Transcript
Regus plcAnnual report and accounts 2000
www.regus.com
Regus plc(formerly known as Regus Business Centres plc)3000 Hillswood DriveChertseySurrey KT16 0RSUnited Kingdom
Registered number: 3548821
Sponsors of the 2001 Ryder Cup
Reg
us plc A
nnual repo
rt and acco
unts 2000
Regus plc Annual report and accounts 2000 1
2 Regus at a glance4 Chairman’s statement6 Review of operations
12 Financial review16 Directors and advisers18 Directors’ report20 Corporate governance22 Remuneration report25 Auditor’s report26 Consolidated profit and loss account27 Balance sheets28 Consolidated cash flow statement
29 Consolidated statement of totalrecognised gains and lossesReconciliation of movements in Group shareholders’ funds
30 Accounting policies33 Notes to the financial statements53 Principal Group companies55 Shareholder information56 Five-year summary
Financial calendar
Contents
Regus is a provider of high-quality business services
to the global economy. Its international network of
adaptable business centres allows Regus customers
to outsource completely or in part their workspace
requirements. By December 2000, Regus operated
64,070 workstations in 335 centres across 48 countries.
South AfricaSpainSwedenSwitzerlandTanzaniaThailandTunisiaTurkeyUkraineUnited KingdomUSAVietnam
Regus around the globe
Regus plc Annual report and accounts 2000 3
Regus at a glance
2 Regus plc Annual report and accounts 2000
Turnover 2000 by region(£m)
Americas Rest of the World
Rest of Europe UK and Ireland
86.5
27.1
188.6
118.9
Turnover by year(£m)
300
100
200
040
050
0
1997
58.8
1998
111.
6
1999
200.
6
2000
421.
1
Centre contribution(£m)
200
-40
1997
1998
1999
2000
-20
6040
8010
0
9.8
-1.3
-8.6
23.0
-24.
6
41.7
8.0
92.3
Established New
2000
EBIT before exceptional items(£m)
-20
-30
-50
-40
0-1
020
10
1997
1362
2
1998
-15.
2
1999
-43.
0
-4.6
12.4
Total workstations 2000 by region(thousands)
Americas Rest of the World
Rest of Europe UK and Ireland
19.4
5.0
19.9
19.8
EBITDA before exceptional items(£m)
0-1
0-3
0-2
040
2010
3060
50
1997
1362
2
2000
1998
-5.8
1999
-23.
0
-0.2
53.0
Operating cash flow before exceptional items (£m)
300
100
200
200
040
050
0
1997
12.1
1998
15.7
1999 17
.7
2000
117.
9
Total workstations by year(thousands)
5030
1020
400
6070
80
1997 11
.8
1998
20.7
1999
40.1
2000
64.1
Financial highlights
• Successful flotation raised £239 million (net)
• Number of workstations increased 60%
to 64,000
• Turnover up 110% from 1999
• US experienced growth of 503% in turnover
• First operating profit recorded in history
of Regus plc
• Centre contribution (gross profit)
increased 486%
• Operating cash flow up 721% to £117 million
• Substantially improved covenants, with cash of
£170 million and net assets of £203 million
Chairman’s statement
4 Regus plc Annual report and accounts 2000
2000 was a landmark year for Regus. We enjoyedmany successes, including simultaneous listingson the London Stock Exchange and NASDAQ in October. The offer was several times over-subscribed, raised £239 million (net) for the Group and resulted in a high-quality investor base.We repaid the £100 million multi-currency securedloan facility, which we raised in 1999, from the proceeds. These actions have positioned uswell to continue the rapid development of Regus.
The business grew during the year at aspectacular rate: we added another 93 centres to our portfolio and increased the number ofcountries in which we operate to 48 (1999: 45).We added 23,934 workstations, our key measureof volume, bringing the year-end total to 64,070.As a result, the Group recorded its first-everoperating profit before exceptional items. In linewith our strategy of expanding in establishedmarkets, enhancing national networks, increasingcustomer awareness and attracting key nationalaccounts, the bulk of the growth was in the US,where we added 10,945 workstations, with thebalance mainly in the major towns and cities inwhich we already operate.
ResultsRevenue for the year was up 110% at£421.1 million. Overall centre contribution increased486% to £100.3 million, with established centrescontinuing to return a margin of 31%.
Administrative expenses before exceptional itemsfell as a percentage of turnover to 21% (1999:30%) and we recorded an operating profit beforeexceptional items of £12.4 million (1999: loss of£43.0 million). The exceptional item of £9.5 million relates to the cost associated withreducing the Reward Options exercise price from£1.455 to £0.05.
After exceptional items the Group’s operatingprofit for the year was £2.9 million (1999: loss of£48.1 million). The Group’s EBITDA for the yearwas £43.5 million. (1999: negative £28.1 million).
The BoardUpon the Initial Public Offering (“IPO”), Mark Dixonrelinquished his role as Executive Chairman,remaining as Chief Executive, and I was appointedNon-executive Chairman. From the end of March2001 Robert Kuijpers will have resigned hisposition of non-executive director and will become CEO, International. There were no other changes to the Board.
Regus plc Annual report and accounts 2000 5
During the year, we established an auditcommittee, a nomination committee and aremuneration committee.
Our people2000 was a particularly busy year for ourmanagement and team members. On behalf ofthe directors and shareholders I would like tothank all Regus people, who ensured that thebusiness ran smoothly and grew rapidly, for theirdedication and hard work.
The futureTrends in performance continue to beencouraging, and we believe the Company has anexciting future. With flexible office space accountingfor less than 2% of the global office market wesee no near-term constraint on our growth potential.The IPO provided the resources for us to growthrough acquisition as well as organically.
We will continue to focus resources on our coremarkets, particularly in the US. In non-coremarkets we seek to enter into profit-sharing dealsincluding joint ventures, management contractsand franchising. Strategic alliances, joint venturesand acquisitions will enable us to expand therange of services we offer throughout the network.
An exciting prospect for 2001 is our sponsorshipof the Ryder Cup golf tournament, which will beheld in September 2001 at The Belfry in the UK.This is the largest global sporting event of 2001,which will have major television coverage, and will give the Regus brand excellent exposureworldwide.
Our clear strategy, focused management andhighly-motivated workforce will, we believe, keepus at the forefront of the flexible office spacemarket, and puts us in an ideal position tocapitalise on changing work practices worldwide.
George Gray 26 February 2001
During 2000, the business grew at a spectacular rate.
Revenue was up 110%, Ninety-three centres were added
to our portfolio and we now operate in 48 countries.
In addition, we listed on the London Stock Exchange
and NASDAQ.
6 Regus plc Annual report and accounts 2000
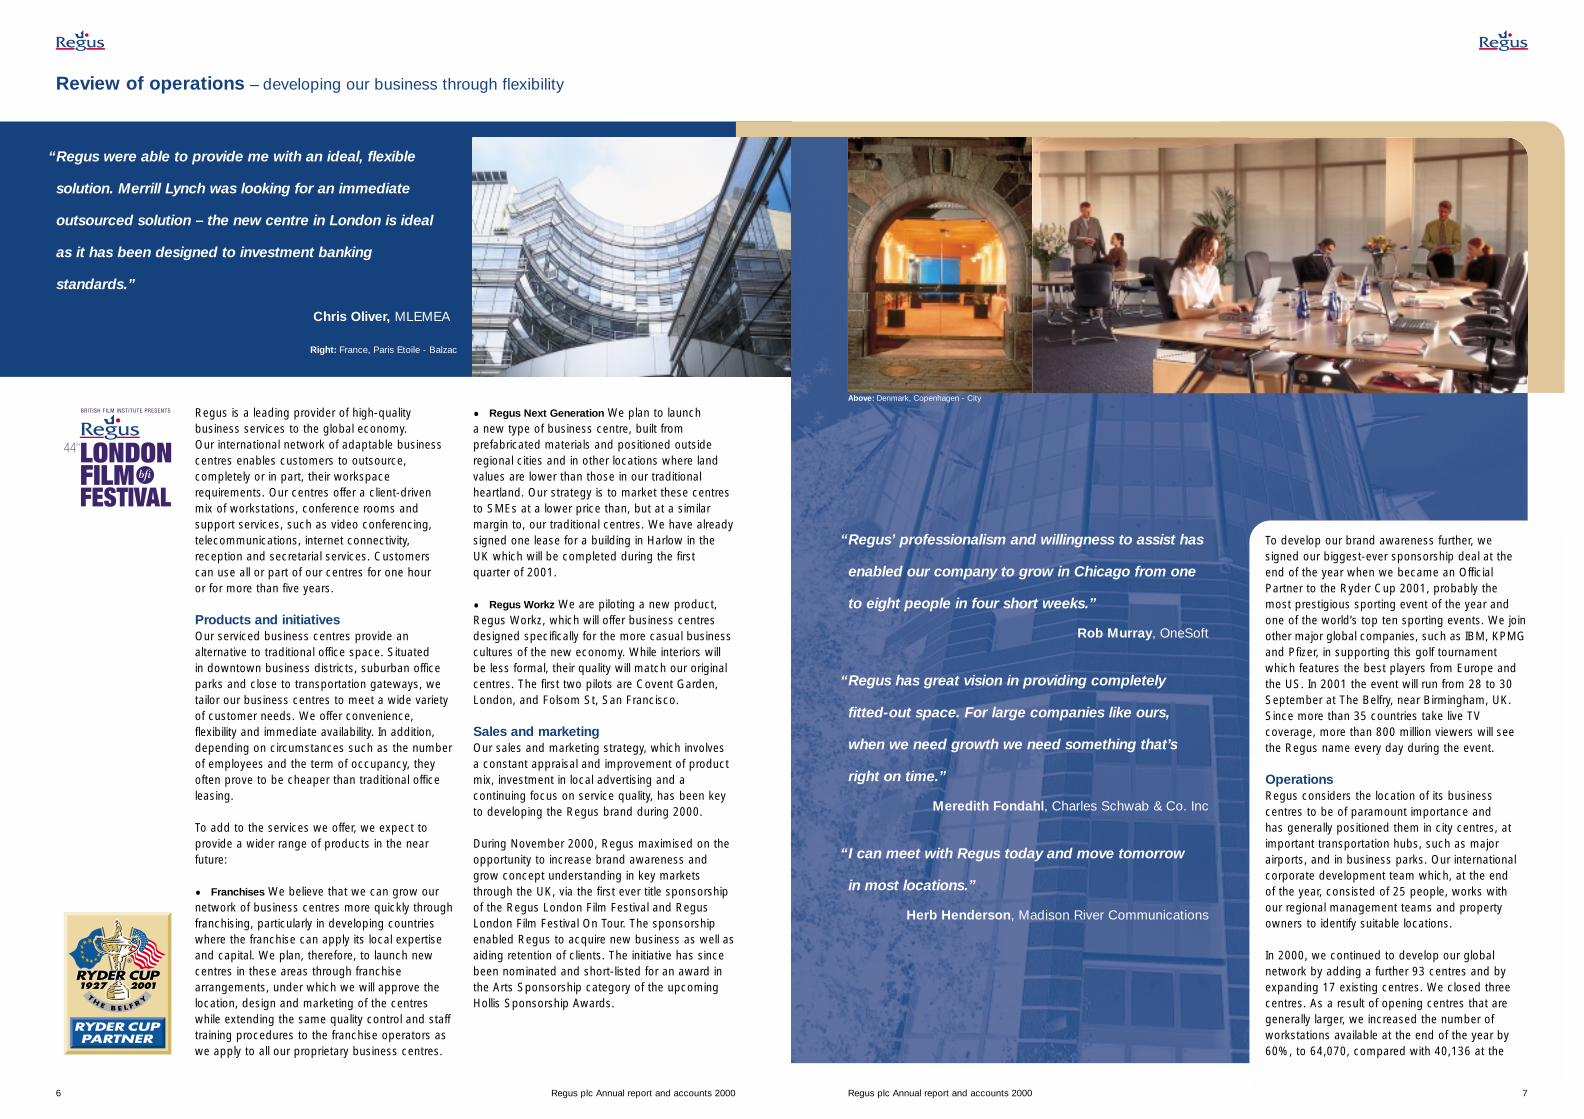
Review of operations – developing our business through flexibility
“Regus were able to provide me with an ideal, flexible
solution. Merrill Lynch was looking for an immediate
outsourced solution – the new centre in London is ideal
as it has been designed to investment banking
standards.”
Chris Oliver, MLEMEA
“Regus’ professionalism and willingness to assist has
enabled our company to grow in Chicago from one
to eight people in four short weeks.”
Rob Murray, OneSoft
“Regus has great vision in providing completely
fitted-out space. For large companies like ours,
when we need growth we need something that’s
right on time.”
Meredith Fondahl, Charles Schwab & Co. Inc
“I can meet with Regus today and move tomorrow
in most locations.”
Herb Henderson, Madison River Communications
To develop our brand awareness further, wesigned our biggest-ever sponsorship deal at theend of the year when we became an OfficialPartner to the Ryder Cup 2001, probably themost prestigious sporting event of the year andone of the world’s top ten sporting events. We joinother major global companies, such as IBM, KPMGand Pfizer, in supporting this golf tournamentwhich features the best players from Europe andthe US. In 2001 the event will run from 28 to 30September at The Belfry, near Birmingham, UK.Since more than 35 countries take live TVcoverage, more than 800 million viewers will seethe Regus name every day during the event.
OperationsRegus considers the location of its businesscentres to be of paramount importance and has generally positioned them in city centres, atimportant transportation hubs, such as majorairports, and in business parks. Our internationalcorporate development team which, at the end of the year, consisted of 25 people, works withour regional management teams and propertyowners to identify suitable locations.
In 2000, we continued to develop our globalnetwork by adding a further 93 centres and byexpanding 17 existing centres. We closed threecentres. As a result of opening centres that aregenerally larger, we increased the number ofworkstations available at the end of the year by60%, to 64,070, compared with 40,136 at the
Regus is a leading provider of high-qualitybusiness services to the global economy. Our international network of adaptable businesscentres enables customers to outsource,completely or in part, their workspacerequirements. Our centres offer a client-driven mix of workstations, conference rooms andsupport services, such as video conferencing,telecommunications, internet connectivity,reception and secretarial services. Customers can use all or part of our centres for one hour or for more than five years.
Products and initiativesOur serviced business centres provide analternative to traditional office space. Situated in downtown business districts, suburban officeparks and close to transportation gateways, wetailor our business centres to meet a wide varietyof customer needs. We offer convenience,flexibility and immediate availability. In addition,depending on circumstances such as the numberof employees and the term of occupancy, theyoften prove to be cheaper than traditional officeleasing.
To add to the services we offer, we expect toprovide a wider range of products in the nearfuture:
• Franchises We believe that we can grow ournetwork of business centres more quickly throughfranchising, particularly in developing countrieswhere the franchise can apply its local expertiseand capital. We plan, therefore, to launch newcentres in these areas through franchisearrangements, under which we will approve thelocation, design and marketing of the centreswhile extending the same quality control and stafftraining procedures to the franchise operators aswe apply to all our proprietary business centres.
• Regus Next Generation We plan to launch a new type of business centre, built fromprefabricated materials and positioned outsideregional cities and in other locations where landvalues are lower than those in our traditionalheartland. Our strategy is to market these centresto SMEs at a lower price than, but at a similarmargin to, our traditional centres. We have alreadysigned one lease for a building in Harlow in the UK which will be completed during the firstquarter of 2001.
• Regus Workz We are piloting a new product,Regus Workz, which will offer business centresdesigned specifically for the more casual businesscultures of the new economy. While interiors willbe less formal, their quality will match our originalcentres. The first two pilots are Covent Garden,London, and Folsom St, San Francisco.
Sales and marketingOur sales and marketing strategy, which involves a constant appraisal and improvement of productmix, investment in local advertising and acontinuing focus on service quality, has been keyto developing the Regus brand during 2000.
During November 2000, Regus maximised on theopportunity to increase brand awareness andgrow concept understanding in key marketsthrough the UK, via the first ever title sponsorshipof the Regus London Film Festival and RegusLondon Film Festival On Tour. The sponsorshipenabled Regus to acquire new business as well asaiding retention of clients. The initiative has sincebeen nominated and short-listed for an award inthe Arts Sponsorship category of the upcomingHollis Sponsorship Awards.
Regus plc Annual report and accounts 2000 7
Above: Denmark, Copenhagen - City
Right: France, Paris Etoile - Balzac
8 Regus plc Annual report and accounts 2000
Review of operations – developing our business through global growth
“The location of the Cape Town Regus Centre in Safmarine
House, one of the city’s most prestigious buildings, was a
major factor in its favour when we were deciding on
branch office space. The centre projects the kind of
international, upmarket image we must have.”
Paul Grinups, Mobil Oil South Africa
.
Total workstations by year(thousands)
5030
1020
400
6070
80
1997 11
.8
1998
20.7
1999
40.1
2000
64.1
During 2000 we initiated several pilot projects toincrease IT services to meet our clients’ needs.These included Engineer Services – providing for avariety of break fix and local support – and en@bleServices – a selection of ASP services. We willextend these pilots in 2001 to four key regionalmarkets, and will use their success to determinethe roll-out programme.
Collaboration with other IT partners has enabled us to develop “RegusNet”, which provides a high-speed secure internet access, together with a widerange of value-added IT services, for our clients.
A principal objective of our e-business programmeis to drive increased revenues and margins,primarily through increased efficiency. By deliveringan integrated, internet-enabled systems platformacross the Group, customers may make bookings,receive bills and make electronic payments fromtheir own PCs. Because data is captured onlyonce, accuracy and speed are improved andcosts are reduced.
The applications, built around PeopleSoft software,include financials, human resources, billing, e-procurement, purchase order and expenses,and form the backbone of our ManagementInformation System. We have also implementedPivotal customer relationship management. Theseapplications employ the latest web technologyand operate on a platform of Windows 2000 andRegusNet.
Mobil Oil South Africa (“Mobil SA”) is part of the
world’s third-largest oil company, and is always
looking for beneficial working relationships.
It is company policy to outsource as much as possible,
and this includes the management of its branch office
facilities and support staff wherever feasible.
Mobil SA was so satisfied with Regus’ service and
facilities to date that it recently signed up for another
year’s lease.
Staff at Mobil SA’s Cape Town branch also make
extensive use of the meeting rooms in the Regus
centre, and of the skilled secretarial support services.
Paul Grinups, Mobil Oil South Africa
end of 1999. This rate of growth is set to continuewith a further 53 leases signed at the year end,all of which are due to open during 2001.
In 2000 we focused on the strategically importantUS market and expanded within existing countriesof operation; we added only three new countriesin the year. In the US we added a further 37centres – 10,945 workstations – to the 25 centresin existence at the end of 1999. Twenty-six ofthese new centres are Regus owned while 11 arejoint ventures.
In the UK and Ireland we opened 17 new centres,including four in central London. In mainlandEurope, we opened 27 centres, including eight inBenelux, two in France, eight in Germany andthree in Spain. In the rest of the world, we openedthree centres in Australia and two in Japan. For the first time, we opened centres in Egypt,Azerbaijan and Tunisia. The past year also saw the signing of our largest centre to date: theAmsterdam Teleport Towers centre, which openedin January 2001, has some 1,028 workstationsand is ideally placed to reap the rewards from the thriving Benelux market.
Property and supplier relationshipsThe corporate development team actively managesour relationships with major property ownersthroughout the world. Their objective is to positionRegus as the partner of choice for any propertyowner. Regus can offer property owners a menuof deal structures, ranging from conventional leasesthrough participation leases and managementcontracts to franchise, depending upon the propertyowner’s appetite for risk and reward. Once wehave decided to lease a property, our team ofdesigners, contractors and suppliers works tobuild out the workstations and conference roomsto our consistently high standards.
We have established 50/50 joint ventures withArlington Securities and Teesland Group plc in the UK, with Equity Office Properties Trust andCrescent in the US, Milano Centrale in Italy andGesco in India. In each case we operate businesscentres in our partners’ buildings on a profit-sharearrangement through which we are paid amanagement fee by the joint-venture companyand share in the business centres’ profits.
We have partnerships with Jones Lang LaSalle,the world’s largest chartered surveyors andinternational property consultants, and DIFA,Germany’s third-largest property fund. |n addition,we work closely with the owners of our buildingsand with our partners who are involved in newproducts and initiatives.
As the business has grown and matured, we havestrengthened our relationships with our principalsuppliers, on a mutually beneficial basis, and haveachieved significant purchasing discounts oncertain products. As a result, approximately 80%of our capital expenditure on new centres isplaced with only 16 suppliers.
We continue to develop non-exclusivepartnerships with “best-in-class” companies tofacilitate entry into new and/or existing markets.These enable us to introduce new products moreefficiently and quickly and to reduce the risk ofdoing so.
E-businessWe have always been determined that our clientsshould benefit from advances in technology. Ourrelationships with Hewlett Packard, Microsoft,Cisco and Ericsson continue to deliver improvedefficiency, create new revenue streams andmaintain a global standard.
Regus plc Annual report and accounts 2000 9
Above: Finland, Espoo - Spectri Business Park
10 Regus plc Annual report and accounts 2000
Review of operations – developing our business through infrastructure
“As organisations such as Regus help companies take
advantage of opportunities on both sides of the Atlantic,
our transatlantic business links will become even more
intimate and advantageous for companies and consumers
in both countries.”
Richard Fursland, British American Chamber of Commerce
Stage 1 of this project was completedsuccessfully in the second half of 2000.Committed expenditure on applications alone isaround £10 million. We have already begun toexperience some benefits, but expect financialand operational savings to come through in thesecond half of 2001.
PeopleWe recognise that the success of the Regusbusiness depends to a large extent on the calibreand motivation of the people we employ. We havepromoted a dynamic, high-work ethic with astrong culture of delivering excellent service tocustomers. We regard all our employees as “teammembers”, irrespective of their functional title orstatus. We keep them informed of developmentsthrough a tri-weekly electronic newsletter throughour intranet, RegusSmart, and an annualconference. Professionalism is further enhancedthrough our training and development programmeat the Regus Academy, where 551 team membershave been trained this year, and 95 teammembers have been promoted.
We have also developed The Regus OpenLearning Institute, known as ROLI, which is a newweb-based learning programme providing trainingfor all Regus team members from their ownlaptop, anywhere, anytime. ROLI comprises threelevels of distance learning on each functional areaof the Regus business, from induction (basic level)to intermediate and advanced levels, to developRegus experts in their chosen field. ROLI is ofsignificant benefit in the development of teammembers’ careers. Once they have completed thebasic, intermediate and senior programmes withintheir functional arena, they can develop significantexpertise in other functional areas, in the directionof becoming a Regus expert in all areas of ourbusiness toward overall general management.
At the end of 2000, we employed 2,615 people:818 in the UK and Ireland; 908 in the rest ofEurope; 512 in the Americas; 254 in the rest ofthe world; and 123 at Regus headquarters. In the US, Intel has chosen Regus to solve
a major commute problem for some 300employees based in Silicon Valley. Reguscentres in San Francisco’s financial districtand Bay Area at San Ramon are nowdedicated to Intel staff “hotdesking” – savingup to four hours commute time daily in somecases. With unemployment below 1% in thispart of the US, Intel’s initiative is seen as aninnovative way of maintaining staff loyalty. Intel is also a major client at Regus centres in Lima, Kiev, Santiago, Tel Aviv, Stockholm,Brussels and London.
In Europe, Regus has launched a pilot schemewith Siemens that sets an exciting precedentfor the way companies – and people – work. AtMunich Airport, Regus is now running the firstof several planned tailor-made businesscentres in Germany exclusively for Siemens.Further such fully-serviced centres are plannedfor Erlangen and Berlin, and may also expandto Dusseldorf and Frankfurt. Siemens chosethe Regus option because of our flexibility;strength and breadth of international network;market experience; and proven high servicestandards.
Regus plc Annual report and accounts 2000 11
Above: The Netherlands, Amsterdam - The Atrium
Above: Belgium, Brussels - Park Atrium
Revenues(£m)
060
3090
120
Q1
00
77.2
Q2
00
98.7
Q3
00
115.
0
Q4
00
130.
2
150
12 Regus plc Annual report and accounts 2000
In mainland Europe, revenue increased 61% to £118.9 million (1999: £73.7 million), withworkstations increasing 43% to 17,565. REVPAWincreased to £6,771 (1999: £6,004).
Revenue in the Americas increased 455% to£86.5 million (1999: £15.6 million), primarily as a result of a 239% increase in workstations.
Revenue in the Rest of the World increased 224%to £27.1 million (1999: £8.4 million), primarily as a result of a 119% increase in workstations.
Centre contribution (gross profit)Centre contribution on a global basis increased486% to £100.3 million (1999: £17.1 million). This increase is principally as a result of a 110%increase in revenue, offset in part by a 75%increase in cost of sales to £320.8 million (1999:£183.5 million). In our most important markets,particularly the UK, western Europe and the US,there was strong demand which resulted in newcentres filling more quickly, in opportunities forprice increases and in comparatively high levels of occupancy.
Contribution from established centres increased122% to £92.3 million, primarily as a result of an84% increase in workstations, to 30,941. Thecontribution margin (contribution as a percentageof revenue) from established centres remainedstable at 31%. Contribution from new centresincreased to £8.0 million (1999: loss of£24.6 million), reflecting our strategy of focusingour new centre opening programme on countriesin which we already operate. As a result, start-upcosts of new centres were substantially reduced.
Centre contribution in the UK and Irelandincreased 196% to £59.6 million (1999:£20.2 million). Contribution margin in the UK and
Ireland increased to 32% (1999: 20%), primarily asa result of higher occupancy and prices. The UKand Ireland continue to benefit from favourableeconomic conditions and a comparative shortageof office space, particularly in central London.
Centre contribution in mainland Europe increased170% to £29.2 million, with margin increasing to25% (1999: 15%). By focusing on opening newcentres only in countries where we had existingcentres, the region benefited from reduced start-up costs compared with the previous year, as wellas from particularly strong markets in westernEuropean capital cities.
Contribution in the Americas increased to £13.9 million(1999: loss of £6.0 million). This was principallyattributable to the maturing of existing centres.
Losses in the Rest of the World decreased to £2.4 million (1999: loss of £7.9 million), primarilyas a result of reducing the number of new centreopenings from 13 in 1999 to nine in 2000.
Administrative expensesTotal administrative expenses increased 45% to£86.9 million, largely as a result of our substantialinvestment in sales, marketing and administrativeinfrastructure needed to support our expandingnetwork. As a percentage of revenues, however,administrative expenses decreased to 21% for theyear (1999: 30%), reflecting increased efficienciesarising from our strategy of focusing on countriesand markets in which we had existing operations. Sales and marketing costs increased 28% to£43.5 million (1999: £34.0 million). Regional andcentral overheads increased 66% to £43.4 million(1999: £26.1 million). This was principallyattributable to an increase in the number ofemployees in our headquarters and regionalnetwork, from 258 in 1999 to 292 in 2000.
Regus plc Annual report and accounts 2000 13
Financial review
The Group recorded an operating profit of £12.4 million
(1999: loss of £43.0 million) on turnover of £421.1 million
(1999: £200.6 million). The operating profit is stated before
exceptional charges of £9.5 million relating to the Team
Member Share Plan. EBITDA after exceptional items for
2000 was £43.5 million (1999: negative £28.1 million).
Year ended 31 December 2000 Year ended 31 December 1999Weighted Weighted
average averageRevenue Contribution workstations Revenue Contribution workstations
Results of operations £m £m Number £m £m Number
UK and Ireland 188.6 59.6 17,568 102.9 20.2 12,324Rest of Europe 118.9 29.2 17,565 73.7 10.8 12,276Americas 86.5 13.9 10,900 15.6 (6.0) 3,218Rest of the World 27.1 (2.4) 4,300 8.4 (7.9) 1,959
421.1 100.3 50,333 200.6 17.1 29,777
Year ended 31 December 2000 Year ended 31 December 1999Weighted Weighted
average averageRevenue and contribution Revenue Contribution workstations Revenue Contribution workstationsfrom centres £m £m Number £m £m Number
Established centres 293.6 92.3 30,941 134.0 41.7 16,772 New centres 127.5 8.0 19,392 66.6 (24.6) 13,005
421.1 100.3 50,333 200.6 17.1 29,777
IPORegus came to the market in October 2000, witha dual listing on the LSE and NASDAQ. The IPOraised £239 million (net), from which we repaid a £100 million senior multi-currency secured loanfacility. Regus shares were offered at £2.60 each.At 31 December 2000 the share price stood at£3.62, giving a market capitalisation of more than£2.1 billion and putting us in 121st position in theFTSE 350.
RevenueRevenue on a global basis increased 110% to £421.1 million (1999: £200.6 million), withweighted average workstations increasing 69% to 50,333 (1999: 29,777). As a result, totalrevenue per available workstation (“REVPAW”)increased to £8,367 (1999: £6,737).
Revenue from established centres increased119% to £293.6 million while weighted averageworkstations in established centres increased 84% to 30,941. Accordingly, REVPAW inestablished centres increased to £9,488 (1999:£7,990), principally due to an increase in bothpricing and occupancy. Revenue from newcentres increased 92% to £127.5 million andworkstations in new centres increased 49% to19,392. REVPAW in new centres increased to£6,578 (1999: £5,121) because we opened newcentres in higher-priced markets and achievedfaster fill rates.
Revenue in the UK and Ireland increased 83% to £188.6 million (1999: £102.9 million), withworkstations increasing 43% to 17,568. REVPAWincreased to £10,736 (1999: £8,350).
REVPAW – established centres(£)
1,00
050
00
1,50
02,
000
2,50
03,
000
Q2
00
2,19
6
Q1
00
1,98
7
Q3
00
2,45
9
Q4
00
2,61
4
Weighted average workstations
3020
100
4050
60
Q2
00
24,8
0322
,882
Q1
00
19,1
1324
,600
Q3
00
27,0
0725
,263
Q4
00
31,2
4726
,418
Established New
Centre contribution(£m)
105
-50
1520
3025
Q1
00
-1.1
11.7
Q3
00
6.3
22.9
Q4
00
10.5
27.0
Established New
Q2
0015
.6
7.4
Regus plc Annual report and accounts 2000 15
Financial review continued
14 Regus plc Annual report and accounts 2000
Currency transaction exposures Currencytransaction exposure arises where sales andpurchases are transacted by a business unit in a currency other than its own functional currency.The majority of the Group’s businesses, however,sell to clients and pay suppliers in their localmarkets in their own functional currencies andtherefore have limited transaction exposure.Where this is not the case, it is our policy to cover material transactions as soon as they arecommitted and to use forward currency contractsto do so.
Funding and deposits The Group is currently netcash positive, with substantial cash balances.During the year, the major debt facility was repaidin full and cancelled on receipt of proceeds fromthe successful IPO. Outstanding borrowingscomprise office equipment financed throughfinance and operating leases and specific loansfrom certain property owners advanced oncommercial terms. Wherever possible, theseborrowings are matched to the local currency of the borrower or, in the case of lease finance, to the life of the asset financed.
During 2001 we will arrange sufficient bank creditfacilities on normal commercial terms to providefurther liquidity or capital for growth. Surplus fundsare deposited in investment grade instrumentsthat carry low credit risk and which are readilyrealisable in major currencies.
Counter-party risk The Group actively manages itsrelationships with a panel of high-quality financialinstitutions. Cash assets, borrowings and otherfinancial instruments are distributed againstpredetermined limits approved by the Board tocontrol exposure to any particular institution.
Interest rate risk The Group’s current policy is to borrow and invest surplus funds on a floatingrate basis. Group Treasury is, however, currentlyundertaking a review of policy in light of theincrease in surplus funds resulting from the IPOand the potential arrangement of debt facilities in2001. This will consider the appropriateness offixing interest rates using forward rate or interestrate swap agreements.
Finance systemsDuring 2000, we began the global implementationof PeopleSoft financial software. At the core of oure-business strategy, PeopleSoft will bring benefitsin training, speed of processing and data analysis.We aim to have upgraded worldwide to the fullyweb-enabled PeopleSoft Version 8 by the end of2001.
Hyperion Enterprise was maintained as theGroup’s financial reporting software and continuedto be developed. Towards the end of the year we embarked on the development of a globalbudgeting and forecasting system using Applixsoftware, to be used in conjunction with HyperionEnterprise. Applix will be rolled out across theGroup by March 2001 and is expected to bringgreater flexibility, accuracy and speed ofproduction to the forecasting and budgetingprocess.
Exceptional itemThe £9.5 million exceptional item relates to the costs associated with the reduction of theexercise price of the Reward Options granted in the Team Member Share Plan. The originalexercise price was £1.455 per share, which was written down to £0.05 per share following the successful IPO.
Net interest payableInterest payable is principally affected by theinterest payable on our £100 million senior multi-currency secured loan facility. This facility wasrepaid from the proceeds of the IPO.
Interest income comprised interest on cash held in deposits generated from organic growth of ourbusiness and the excess portion of debt drawndown from our multi-currency secured loan facility.
Tax on loss on ordinary activitiesDespite our overall loss-making position in 1999and 2000, we provided for tax liabilities in bothperiods. The principal reason for this was that taxliabilities were incurred on profits arising in the UK,Ireland, Italy, Luxembourg, The Netherlands,Belgium, France, Switzerland and Spain. Thesetaxable profits could not, however, be offset by taxlosses in all other countries where we operate.The majority of our operating companies have taxlosses available to carry forward against futureprofits. In some countries, there are timerestrictions on the carry forward of such losses.
Cash flowOperating cash flow before exceptional items was£117.9 million (1999: £17.7 million). Increasedtrading levels resulted in net working capital inflowsof £71.9 million in the year. Capital expenditureincreased to £111.7 million, of which £88.1 millionwas funded from cash resources and the balancethrough finance leases. After repaying the£100 million multi-currency secured loan facilitythe net proceeds of the IPO were £139.0 million.
Treasury policyThe Group’s treasury policy seeks to ensure thatadequate financial resources are available for thedevelopment and growth of its operations whilemanaging its currency, interest rate and counter-party risks. Group Treasury strategy and policy isdeveloped centrally with subsidiary companiesoperating within a framework of controls approvedby the Board. We do not engage in speculativetransactions. Our policy on the major areas oftreasury activity is set out below.
Currency translation The results of the Group’sforeign subsidiaries are translated into Sterling at the average exchange rates for the periodconcerned. The balance sheets of foreignsubsidiaries are translated into Sterling at theclosing exchange rates. Any gains and lossesresulting from the translation are recorded inreserves where they are matched with the gainsand losses on borrowings, foreign exchangecontracts, currency swaps or currency options,used to hedge the net assets of subsidiaries.Group Treasury makes proposals to a committeeof the Board each quarter on hedging its foreignassets in this way.
EBIT before exceptional items(£m)
-12
-4-6
-22
06
48
Q3
00
7.6
Q4
00
9.0
10
Q1
00
-7.0
Q2
00
2.8
Overheads(% of revenues)
1510
50
2025
30
Q2
00
10.5
9.3
Q1
00
9.2
12.8
Sales/marketing General/administrative
Q4
00
9.8
12.0
Q3
00
9.1
10.0
EBITDA before exceptional items(£m)
020
1510
525
Q1
00
0.6
Q2
00
12.5
Q3
00
18.0
Q4
00
21.9
Revenues(£m)
060
3090
120
Q1
00
77.2
Q2
00
98.7
Q3
00
115.
0
Q4
00
130.
2
150
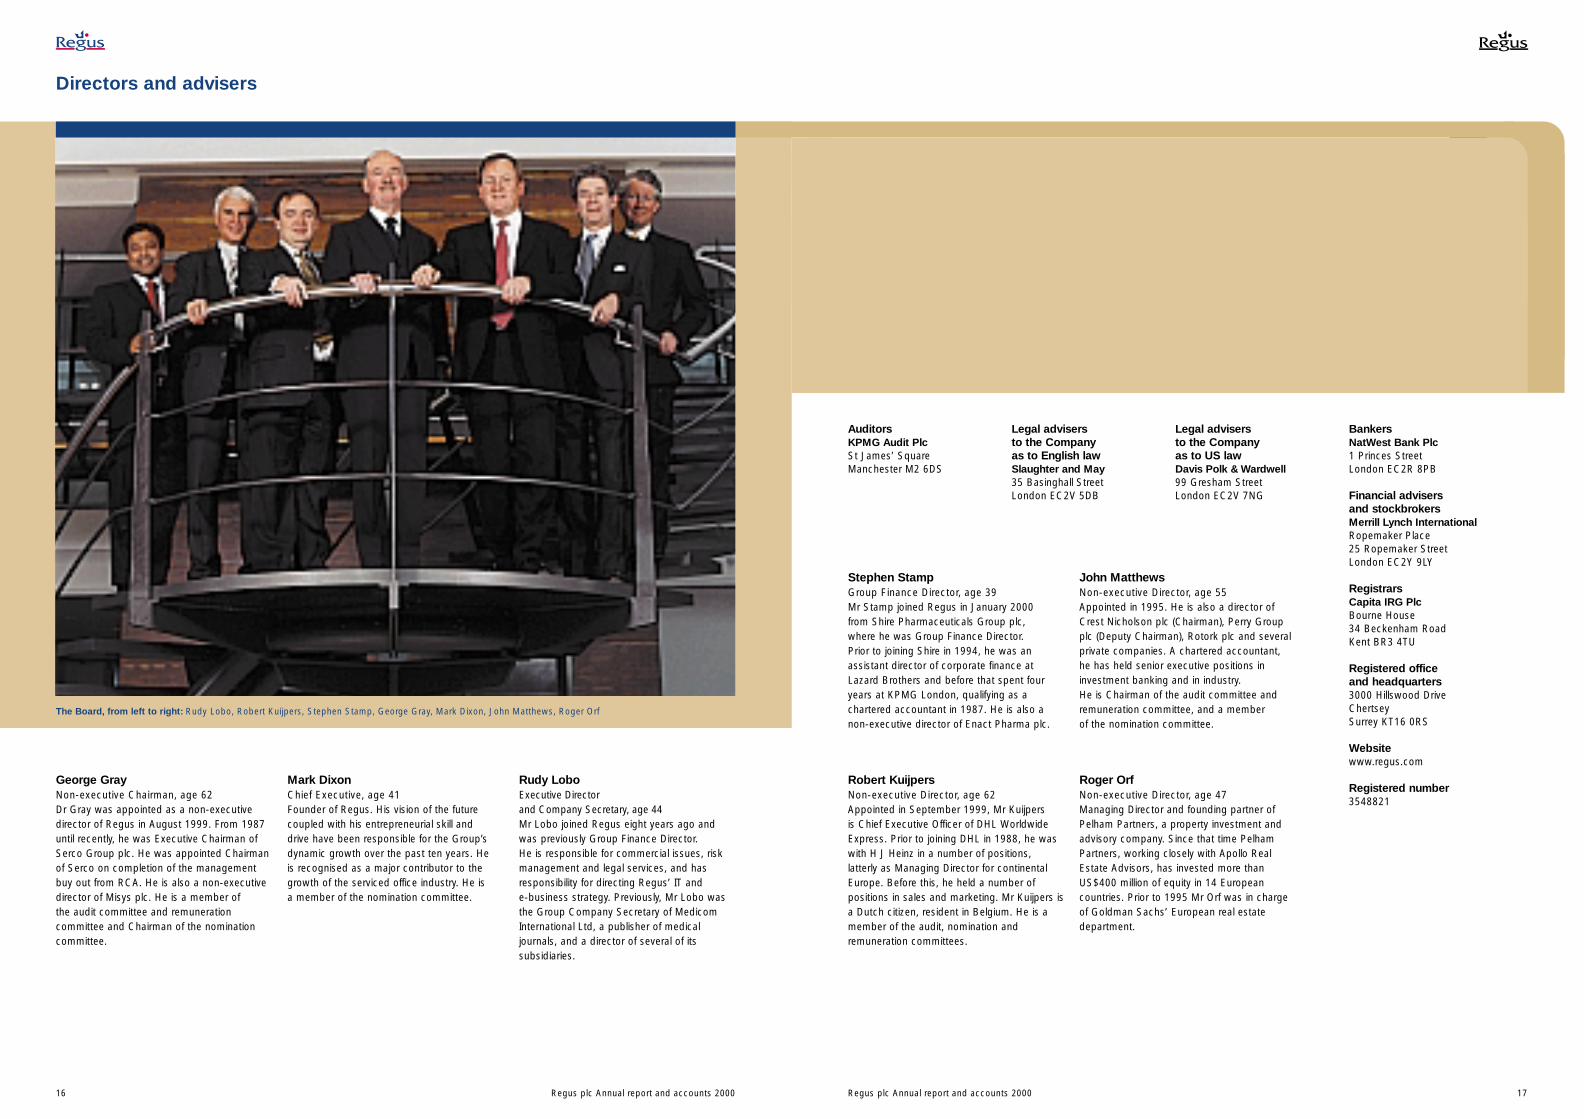
Stephen StampGroup Finance Director, age 39Mr Stamp joined Regus in January 2000 from Shire Pharmaceuticals Group plc, where he was Group Finance Director. Prior to joining Shire in 1994, he was anassistant director of corporate finance atLazard Brothers and before that spent fouryears at KPMG London, qualifying as achartered accountant in 1987. He is also anon-executive director of Enact Pharma plc.
Robert KuijpersNon-executive Director, age 62Appointed in September 1999, Mr Kuijpers is Chief Executive Officer of DHL WorldwideExpress. Prior to joining DHL in 1988, he waswith H J Heinz in a number of positions,latterly as Managing Director for continentalEurope. Before this, he held a number ofpositions in sales and marketing. Mr Kuijpers isa Dutch citizen, resident in Belgium. He is amember of the audit, nomination andremuneration committees.
John MatthewsNon-executive Director, age 55Appointed in 1995. He is also a director ofCrest Nicholson plc (Chairman), Perry Groupplc (Deputy Chairman), Rotork plc and severalprivate companies. A chartered accountant, he has held senior executive positions ininvestment banking and in industry. He is Chairman of the audit committee andremuneration committee, and a member of the nomination committee.
Roger OrfNon-executive Director, age 47Managing Director and founding partner ofPelham Partners, a property investment andadvisory company. Since that time PelhamPartners, working closely with Apollo RealEstate Advisors, has invested more thanUS$400 million of equity in 14 Europeancountries. Prior to 1995 Mr Orf was in chargeof Goldman Sachs’ European real estatedepartment.
Directors and advisers
George GrayNon-executive Chairman, age 62Dr Gray was appointed as a non-executivedirector of Regus in August 1999. From 1987until recently, he was Executive Chairman ofSerco Group plc. He was appointed Chairmanof Serco on completion of the management buy out from RCA. He is also a non-executivedirector of Misys plc. He is a member of the audit committee and remunerationcommittee and Chairman of the nominationcommittee.
Mark DixonChief Executive, age 41Founder of Regus. His vision of the futurecoupled with his entrepreneurial skill and drive have been responsible for the Group’sdynamic growth over the past ten years. He is recognised as a major contributor to thegrowth of the serviced office industry. He is a member of the nomination committee.
Rudy LoboExecutive Director and Company Secretary, age 44Mr Lobo joined Regus eight years ago and was previously Group Finance Director. He is responsible for commercial issues, riskmanagement and legal services, and hasresponsibility for directing Regus’ IT and e-business strategy. Previously, Mr Lobo wasthe Group Company Secretary of MedicomInternational Ltd, a publisher of medicaljournals, and a director of several of itssubsidiaries.
BankersNatWest Bank Plc1 Princes StreetLondon EC2R 8PB
Financial advisers and stockbrokersMerrill Lynch International Ropemaker Place25 Ropemaker StreetLondon EC2Y 9LY
Legal advisers to the Company as to English lawSlaughter and May35 Basinghall StreetLondon EC2V 5DB
Legal advisers to the Company as to US lawDavis Polk & Wardwell99 Gresham StreetLondon EC2V 7NG
Regus plc Annual report and accounts 2000 1716 Regus plc Annual report and accounts 2000
The Board, from left to right: Rudy Lobo, Robert Kuijpers, Stephen Stamp, George Gray, Mark Dixon, John Matthews, Roger Orf
Directors’ report
The directors present their report and the audited financial statements of Regus plc for the year ended 31 December 2000.
Principal activitiesThe Group is engaged in the provision of fully-serviced business centres. The Chairman’s statement, the Review of operations andthe Financial review on pages 4 to 15 describe the principal activities of the Group during 2000.
Business review and future developmentsIn October 2000, the Group successfully floated on the London Stock Exchange and NASDAQ. The loss on ordinary activity beforetaxation for the year ended 31 December 2000 was £3.9 million (1999: loss £54.9 million). An indication of future developments isgiven in the Chairman’s statement.
Change of nameOn 18 July 2000, the Company changed its name from Regus Business Centres plc to Regus plc.
DividendsNo dividend is proposed (1999: £nil).
Directors and directors’ interestsThe directors who held office during the year were :M L J DixonS A Stamp (appointed 7 January 2000)R J G LoboJ W MatthewsR G OrfG G GrayR M KuijpersP L Jenkins (resigned 7 January 2000)
Details of the directors’ interests and shareholdings are given in the Remuneration report on pages 22 to 24.
In accordance with the Articles of Association, M J Dixon, R J G Lobo and J W Matthews retire by rotation and, being eligible, offer themselves for re-election at the Annual General Meeting.
EmployeesIt is the Group’s policy to communicate with all employees and to encourage them to take a wider interest in the affairs of theiremploying company and the Group. This is done in a variety of ways, including electronic media, in-house journals, bulletins andbriefing sessions.
The health and safety of employees is of paramount importance. Safety awareness is actively promoted in the working environmentand is reviewed from time to time, in the light of good practice and developing legislation, in all businesses worldwide.
The Group is committed to the principle of equal opportunity in employment, regardless of a person’s race, creed, nationality, sex,age, marital status or disability. Employment policies are fair, equitable and consistent with the skills and abilities of the employeesand the needs of the Group’s businesses. These policies ensure that everyone is accorded equal opportunity for recruitment,training and promotion. Where an employee becomes disabled while employed by a Group company, every effort is made toenable that person to continue in employment.
The number of employees and their remuneration are set out in note 5 to the financial statements.
Political and charitable donationsThe Group made no political contributions in either 2000 or 1999. Donations to UK charities amounted to £18,190 (1999: £16,000).
Payment of creditorsIt is the policy of the Group to agree terms of payment for its business transactions with its suppliers. Payment is then made inaccordance with these, subject to the terms and conditions being met by the supplier. The Company does not follow any code or standard on payment practice. The Company has no trade creditors.
Regus plc Annual report and accounts 2000 1918 Regus plc Annual report and accounts 2000
Statement of directors’ responsibilitiesCompany law requires the directors to prepare financial statements for each financial period which give a true and fair view of thestate of affairs and of the profit or loss of the Company and Group for that period. In preparing these financial statements, thedirectors are required to:
• select suitable accounting policies and then apply them consistently;
• make judgments and estimates that are reasonable and prudent;
• state whether applicable accounting standards have been followed, subject to any material departures disclosed and explainedin the financial statements; and
• prepare the financial statements on the going concern basis unless it is inappropriate to presume that the Group will continue in business.
The directors are responsible for keeping proper accounting records which disclose with reasonable accuracy at any time the financial position of the Company and Group and to enable them to ensure that the financial statements comply with the Companies Act 1985. They have general responsibility for taking such steps as are reasonably open to them to safeguard the assets of the Company and of the Group and to prevent and detect fraud and other irregularities.
Substantial shareholdingsThe Company has been notified of the following holders of 3% or more of its issued share capital for the purposes of Section 198of the Companies Act 1985, as at 26 February 2001:
Paramount Nominees Ltd1 355,329,286 61.19%Chase Nominees Ltd 24,406,380 4.20%HSBC Trustee (Jersey) Ltd2 23,140,000 3.99%Mourant and Co Trustees Ltd3 18,120,670 3.12%
1 The beneficiary is Maxon Investments BV. M L J Dixon owns 100% interest in Maxon (page 24).
2 The beneficiary of half of this holding is R J G Lobo (page 24).
3 These shares are held by Regus Employee Trust (note 10).
Introduction of the EuroThe directors are aware of the potential impact of the introduction of the Euro and an action plan is in place. The effects on the business are not expected to be significant and costs will be expensed to the profit and loss account when incurred.
AuditorsPursuant to Section 384 of the Companies Act 1985, a resolution for the re-appointment of KPMG Audit Plc as auditors of the Company is to be proposed at the forthcoming Annual General Meeting.
By order of the Board 26 February 2001
R J G Lobo Company Secretary3000 Hillswood DriveChertseySurrey KT16 0RSUnited Kingdom
Corporate governance
The Board of Directors is committed to maintaining the highest standards of corporate governance in line with the CombinedCode, issued by the London Stock Exchange in 1998, which sets out the Principles of Good Governance and the Code of BestPractice. A summary of the Company’s procedures for applying the principles and the extent to which the provisions of theCombined Code have been applied are set out below.
Board compositionThe Board currently comprises three executive directors, three independent non–executive directors, including a non-executivechairman and Mr R G Orf who, by virtue of his interest in the share capital of the Company (as described in the Remunerationreport) is not an independent non-executive director. The Chairman of the audit committee, currently Mr J W Matthews, has actedas senior independent director since 1995. The Board schedules seven meetings each year, but arranges to meet at other times,as appropriate. It has a formal schedule of matters specifically reserved for its decision and approval. The Board is supplied withappropriate and timely information to enable it to discharge its duties and requests additional information or variations to regularreporting as it requires. A procedure exists for directors to seek independent professional advice at the Company’s expense in thefurtherance of their duties, if necessary. In addition, appropriate training is made available for all new directors to assist them in thedischarge of their responsibilities. All directors have access to the advice and services of the Company Secretary, who is responsiblefor ensuring that Board procedures are followed and that applicable rules and regulations are complied with. While all directors areexpected to bring an independent judgment to bear on strategy, performance, resources (including key appointments) and standardsof conduct, the independent non-executive directors were selected and appointed for this purpose. All directors submit themselvesfor re-election at least every three years and directors appointed during the period are required to seek re-election at the next AGM.The independent non-executive directors understand that the Board will not automatically recommend their re-election.
Board committeesThe Board has a number of standing committees, which all have written terms of reference setting out their authority and duties:
Audit committee – the members of this committee are Mr J W Matthews (Chairman), Dr G G Gray and Mr R M Kuijpers (allindependent non-executive directors). The audit committee meets as required, but not less than four times a year. Its responsibilities,in addition to those referred to under Internal Control, include a critical review of the annual and interim financial statements(including the Board’s statement on internal control in the annual report) prior to their submission to the Board for approval, when a report from the committee is also given. The committee also reviews the scope and results of the external audit and its costeffectiveness and the independence and objectivity of the auditors. Although other directors, including the Group Finance Director,attend audit committee meetings, the committee can meet for private discussions with the internal and external auditors.
Nomination committee – the members of this committee are Dr G G Gray (Chairman), Mr J W Matthews, Mr R M Kuijpers (allindependent non-executive directors), and Mr M L J Dixon. The committee meets as required but not less than once a year. Itsresponsibilities include reviewing the Board structure, size and composition, nominating candidates to the Board to fill Boardvacancies when they arise and recommending directors who are retiring by rotation to be put forward for re-election.
Remuneration committee – the members of this committee are Mr J W Matthews (Chairman), Dr G G Gray and Mr R M Kuijpers(all independent non-executive directors). A statement setting out the role and responsibility of this committee and the Group’sremuneration policy is shown on pages 22 to 24.
From the end of March 2001 Mr R M Kuijpers stepped down as a non-executive director and no longer serves on the committees above.
Going concernAfter making appropriate enquiries, the directors consider that the Group has adequate resources to continue in operational existencefor the foreseeable future. For this reason, they continue to adopt the going-concern basis in preparing the financial statements.
Internal controlThe Board acknowledges its overall responsibility for the Group’s system of internal control and for reviewing its effectiveness on a timely basis. The internal control processes have been designed to identify, evaluate and manage the key risks that the Groupencounters in pursuing its objectives. Internal control processes encompass all controls, including financial, operational andcompliance controls and risk management. Such a system is, however, designed to manage rather than eliminate the risk of failureto achieve business objectives, and cannot provide absolute assurance against material misstatement.
The main Board conducted an in-depth review of the Group’s strategy prior to the Initial Public Offering on 17 October 2000 and it continues to conduct regular reviews of the Group’s strategic direction. Country and regional strategic objectives, quarterly plansand performance targets for 2001 and beyond have been set by the executive directors and are regularly reviewed by the main
Board in the context of the Group’s overall objectives.
The control framework and key procedures in place throughout the year ended 31 December 2000 are:
• The executive directors (“the Group executive”) normally meet monthly together with certain other senior executives to considerGroup financial performance, business development and Group management issues. Directors of key operating companiesmeet regularly to manage their respective businesses.
• Major business risks and their financial implications are appraised by the executives responsible as part of the budget processand are endorsed by regional management. Key risks are reported to the Board and the audit committee. The appropriatenessof controls is considered by the executives, having regard to cost/benefit, materiality and the likelihood of risks crystallising.
• Country and regional budgets, containing financial and operating targets, capital expenditure proposals and performanceindicators, are reviewed by the Group executive and must support regional business strategies.
• Monthly reports on Group and regional performances are provided to the Group executive. Quarterly summaries and forecastsare presented to the Board and discussed at Group Board meetings. Performance against budgets and objectives is reviewedwith regional management, as are forecasts and material sensitivities. The Board regularly receives reports from key executivesand functional heads on matters such as forecasts, business development, strategic planning, legal and corporate.
• Appropriate delegated authority levels are in force across the Group which prescribe the limits to which it can be committed.
• A Group-wide policy governs appraisal and approval of investment expenditure and asset disposals. Post-investment audits are undertaken.
• Other key policies and control procedures (including finance, operations and health and safety), which have Group-wideapplication, are available to all staff on web-based systems.
Since the IPO on 17 October 2000, the Group has strengthened its internal audit function, co-sourced with Arthur Andersen, whichreports to management on the Group’s worldwide operations. Its programme of work and its findings, including any materialcontrol issues and resultant actions, are reviewed by the audit committee.
To underpin the effectiveness of controls, it is the Group’s policy to recruit and develop appropriately skilled management and staffof high calibre and integrity. High standards of business ethics and compliance with laws, regulations and internal policies aredemanded from staff at all levels.
Communications with shareholdersA regular programme of meetings with major institutional shareholders is planned in order to communicate the Group’sperformance and prospects. In addition, presentations will be made four times a year after the announcement of results, the detailsof which, together with Group financial reports and announcements, will be accessible via the Group’s internet site. The Companycorresponds regularly on a range of subjects with its individual shareholders who have an opportunity to question the Board, aswell as the Chairman of the audit and remuneration committees, at the Annual General Meeting.
Compliance statementSince obtaining a listing on 17 October 2000, the Company has complied with the provisions set out in Section 1 of the Code ofBest Practice prepared by the Committee on Corporate Governance and published in June 1998 (“the Combined Code”) exceptfor the requirement of provision D2.1 of the Code (according to the Guidance notes issued to directors by the Turnbull workingparty issued in September 1999). This Code provision states that the directors should, at least annually, conduct a review of theeffectiveness of the Group’s system of internal controls and should report to shareholders that they have done so. The reviewshould cover all controls, including financial, operational and compliance controls and risk management.
The following procedures will enable the Company to report full compliance for 2001 but were not in place throughout the yearending 31 December 2000:
• Throughout 2001, an ongoing process for the formal identification of the Company’s significant risks and mitigating controlprocesses will be in place.
• An embedded system of reporting the effectiveness of controls (and, where relevant, management’s actions in response to anyobserved weaknesses) will be established during the first quarter of 2001.
• A multi-disciplinary Group risk forum, chaired by Mr R Lobo, has been established to report to the Board on a quarterly basisfrom the first quarter of 2001. It will consider all aspects of risk management and, through its reports, will enable the Board toassess regularly the overall effectiveness of the Group’s system of internal control.
For the period prior to 17 October 2000, the Group complied with the remaining provisions of the Combined Code except for:
• the requirement to re-elect directors at least every three years (provision A6.2); and
• the establishment of an Audit Committee (provision A3.1).
Regus plc Annual report and accounts 2000 2120 Regus plc Annual report and accounts 2000
Remuneration report
The remuneration committeeThe remuneration committee is chaired by Mr J W Matthews and its other members are Dr G G Gray and Mr R M Kuijpers. All members of this committee are independent non-executive directors. The Group Chief Executive and/or other directors may be invited to attend some meetings of the committee in an advisory capacity as the committee considers appropriate. The committee will consider all material elements of remuneration policy, remuneration and incentives of executive directors and senior management with reference to independent remuneration research and professional advice in accordance with the Combined Code on Corporate Governance, and will make recommendations to the Board of Directors on the framework for executive remuneration and its cost. The Board of Directors is then responsible for implementing the recommendations andagreeing the remuneration package of individual directors. Directors are not permitted, under Regus’ Articles of Association, to vote on their own terms and conditions of remuneration. The committee does not make recommendations on the remuneration of non-executive directors, which is a matter solely for the full Board. The members of the remuneration committee attend theCompany’s Annual General Meeting and are available to answer shareholders’ questions about directors’ remuneration.
Remuneration policyRemuneration policy centres on ensuring that remuneration packages are sufficiently competitive to attract, retain and motivate the right calibre of executive directors and senior management. Incentive payments are conditional upon demanding performancecriteria so as to align incentive awards paid to directors directly with the interest of shareholders. The remuneration committee uses the services of external consultants to help it agree appropriate packages reflecting the remuneration policy. The constituentparts of those packages are set out in the following paragraphs.
Basic salary and benefits Salaries are reviewed annually and determined by the committee, taking into account the performance of the individual directorsover the previous 12 months and the pay and employment conditions elsewhere in the Group. The committee also usesinformation provided by external consultants relating to the rates of pay for similar positions in comparable companies. Anyincreases in basic salary are effective from 1 January in each year.
The remuneration table included within this report also shows benefits received in 2000. The main benefits relate to the provision of company cars and the provision of private medical insurance for the director and his immediate family.
Annual performance bonusUnder the annual bonus scheme the executive directors are entitled to an annual bonus of up to 40% of their basic salary, which is payable provided the budget targets for the relevant financial year are achieved.
Long-term incentive planOther than share options, the executive directors do not participate in any of the long-term incentive plans offered to seniormanagement.
Share optionsThe Group believes that share ownership by employees, including the executive directors, strengthens the link between theirpersonal interests and those of ordinary shareholders. Regus has established a number of employee share plans, including theRegus Team Member Share Plan, a replacement plan known as the Regus Global Share Plan and the Regus InternationalSharesave Plan. As at 26 February 2001 no options had been granted to executive directors, other than those detailed in the tableof directors’ interests at the end of this report.
During 1999 the Group established the Regus Employee Trust. The Trust is a discretionary trust for the benefit of employees,including executive directors. The Trust may issue shares to the Group’s employees (including directors) at the discretion of theCompany. The Trust has purchased some of the shares in the Company which would be required if participants were entitled toexercise the maximum number of options outstanding under the share option plans.
Regus plc Annual report and accounts 2000 2322 Regus plc Annual report and accounts 2000
PensionsThe executive directors participate in the Company’s Money Purchase (Personal Pension) Scheme. The Company matchesemployee contributions up to a maximum of 10% of basic salary.
The main benefits to executive directors, who contribute a percentage of their gross salaries to the scheme, are:
• A pension, based on the value of fund built up from personal contributions, at any age between 50 and the normal pension age of 65;
• A tax-free cash sum, payable when taking the benefits;
• Life assurance cover based on the level of contributions with the opportunity to purchase additional cover, subject to InlandRevenue limit of 5% of net relevant earnings; and
• Pension to spouse payable on death.
All executive directors are subject to the Inland Revenue cap on the amount of salary which may be treated as pensionable.
Service contractsOn 1 July 2000 Mr M L J Dixon, Mr R J G Lobo and Mr S A Stamp entered into full-time rolling service agreements with RegusManagement Limited. These are terminable by either party giving not less than 12 months’ notice to the other party orautomatically on the respective directors reaching the age of 65.
Dr G G Gray, Mr R M Kuijpers, Mr J W Matthews and Mr R G Orf, as non-executive directors, have been appointed pursuant to letters of appointment dated 2 September 1999 (as amended by letters of amendment dated 30 November 1999 and 21September 2000), 4 October 1999, 26 October 1999 and 29 August 2000 respectively. These appointments are for three years,terminable on three months’ notice by the Company or the directors.
Directors’ remuneration tablePension Pension
Total Total scheme schemeSalary/ remuneration remuneration contributions contributions
1 In addition to the annual bonus of 40% of their basic salary, the directors indicated received a one-off bonus of $10,000 each. This was approved by theremuneration committee.
We have audited the financial statements on pages 26 to 54.
Respective responsibilities of directors and auditorsThe directors are responsible for preparing the annual report. As described on page 19 this includes responsibility for preparing the financial statements in accordance with applicable United Kingdom law and accounting standards. Our responsibilities, asindependent auditors, are established in the United Kingdom by statute, the Auditing Practices Board, the Listing Rules of theFinancial Services Authority and by our profession’s ethical guidance.
We report to you our opinion as to whether the financial statements give a true and fair view and are properly prepared inaccordance with the Companies Act 1985. We also report to you if, in our opinion, the directors’ report is not consistent with the financial statements, if the Company has not kept proper accounting records, if we have not received all the information andexplanations we require for our audit, or if information specified by law regarding directors’ remuneration and transactions with the group is not disclosed.
We review whether the statement on pages 20 to 21 reflects the company’s compliance with the seven provisions of the CombinedCode specified for our review by the Financial Services Authority, and we report if it does not. We are not required to considerwhether the board’s statements on internal control cover all risks and controls, or form an opinion on the effectiveness of thegroup’s corporate governance procedures or its risk and control procedures.
We read the information contained in the annual report, including the corporate governance statement, and consider whether it isconsistent with the audited financial statements. We consider the implications for our report if we become aware of any apparentmisstatements or material inconsistencies with the financial statements.
Basis of audit opinionWe conducted our audit in accordance with Auditing Standards issued by the Auditing Practices Board. An audit includesexamination, on a test basis, of evidence relevant to the amounts and disclosures in the financial statements. It also includes anassessment of the significant estimates and judgments made by the directors in the preparation of the financial statements, and of whether the accounting policies are appropriate to the Group’s circumstances, consistently applied and adequately disclosed.
We planned and performed our audit so as to obtain all the information and explanations which we considered necessary in order to provide us with sufficient evidence to give reasonable assurance that the financial statements are free from materialmisstatement, whether caused by fraud or other irregularity or error. In forming our opinion we also evaluated the overall adequacyof the presentation of information in the financial statements.
OpinionIn our opinion the financial statements give a true and fair view of the state of affairs of the Company and of the Group as at 31 December 2000, and of the loss of the Group for the year then ended, and have been properly prepared in accordance with the Companies Act 1985.
KPMG Audit Plc 26 February 2001Chartered Accountants Registered Auditor
Remuneration report continued Auditor’s report to the members of Regus plc
Regus plc Annual report and accounts 2000 2524 Regus plc Annual report and accounts 2000
1 Mr Dixon’s beneficial ownership of shares is calculated by attributing to him all shares owned by Maxon Investments BV, an entity in which Mr Dixon holds a 100%beneficial ownership interest.
2 Mr Orf’s beneficial ownership of shares is calculated by attributing to him all shares, including options, owned by AP Pelham Partners X1 LLC, an affiliate of Apollo Real Estate Investment Fund 111 LP. Mr Orf, as a director of AP Pelham Partners X1 LLC, exercises shared investment and voting powers over shares held by AP Pelham Partners X1 LLC.
Directors’ share optionsGranted Date from
Option 31 December during 31 December Exercise which Expirytype 1999 2000 2000 price exercisable date
Stephen Stamp A – 2,790,203 2,790,203 145.5p 7/1/03 7/1/10C – 4,003 4,003 242.0p 1/1/04 1/7/04
A Awarded under the Regus Team Member Share Plan for nil consideration. The Board of Directors has the discretion to waive some or all of the exercise price. The grant to Mr Stamp is subject to higher performance targets.
B Awarded to Mr Lobo by Maxon pursuant to an agreement dated 17 September 1999 recording the terms of an agreement entered into on 11 November 1992between Mr Lobo and Maxon, as amended on 30 June 2000. These shares are currently held by HSBC Trustees (Jersey) Limited and will not be capable of exercisebefore 31 December 2003 other than in defined circumstances (which include the discretion of Maxon). The shares subject to the option are transferable to Mr Loboupon payment to Maxon of an exercise price of £45,000, which is equivalent to the market value of the relevant shares at the time the parties entered into the optionarrangements.
C Awarded under the Regus International Sharesave Plan, the maximum monthly contribution for which may not exceed the amount permitted by the Income andCorporation Taxes Act 1988.
Summary particulars of the Group’s share option schemes are given in note 21 on page 49.
The market price of the shares at 31 December 2000 was 362p and the range since 17 October, the date of the IPO, was 277p to 376p.
None of the directors had a beneficial interest in any contract of significance in relation to the business of the Company or itssubsidiaries at any time during the financial year.
There has been no change in the directors’ shareholdings (all of which are beneficial) and their share options between the year endand 26 February 2001.
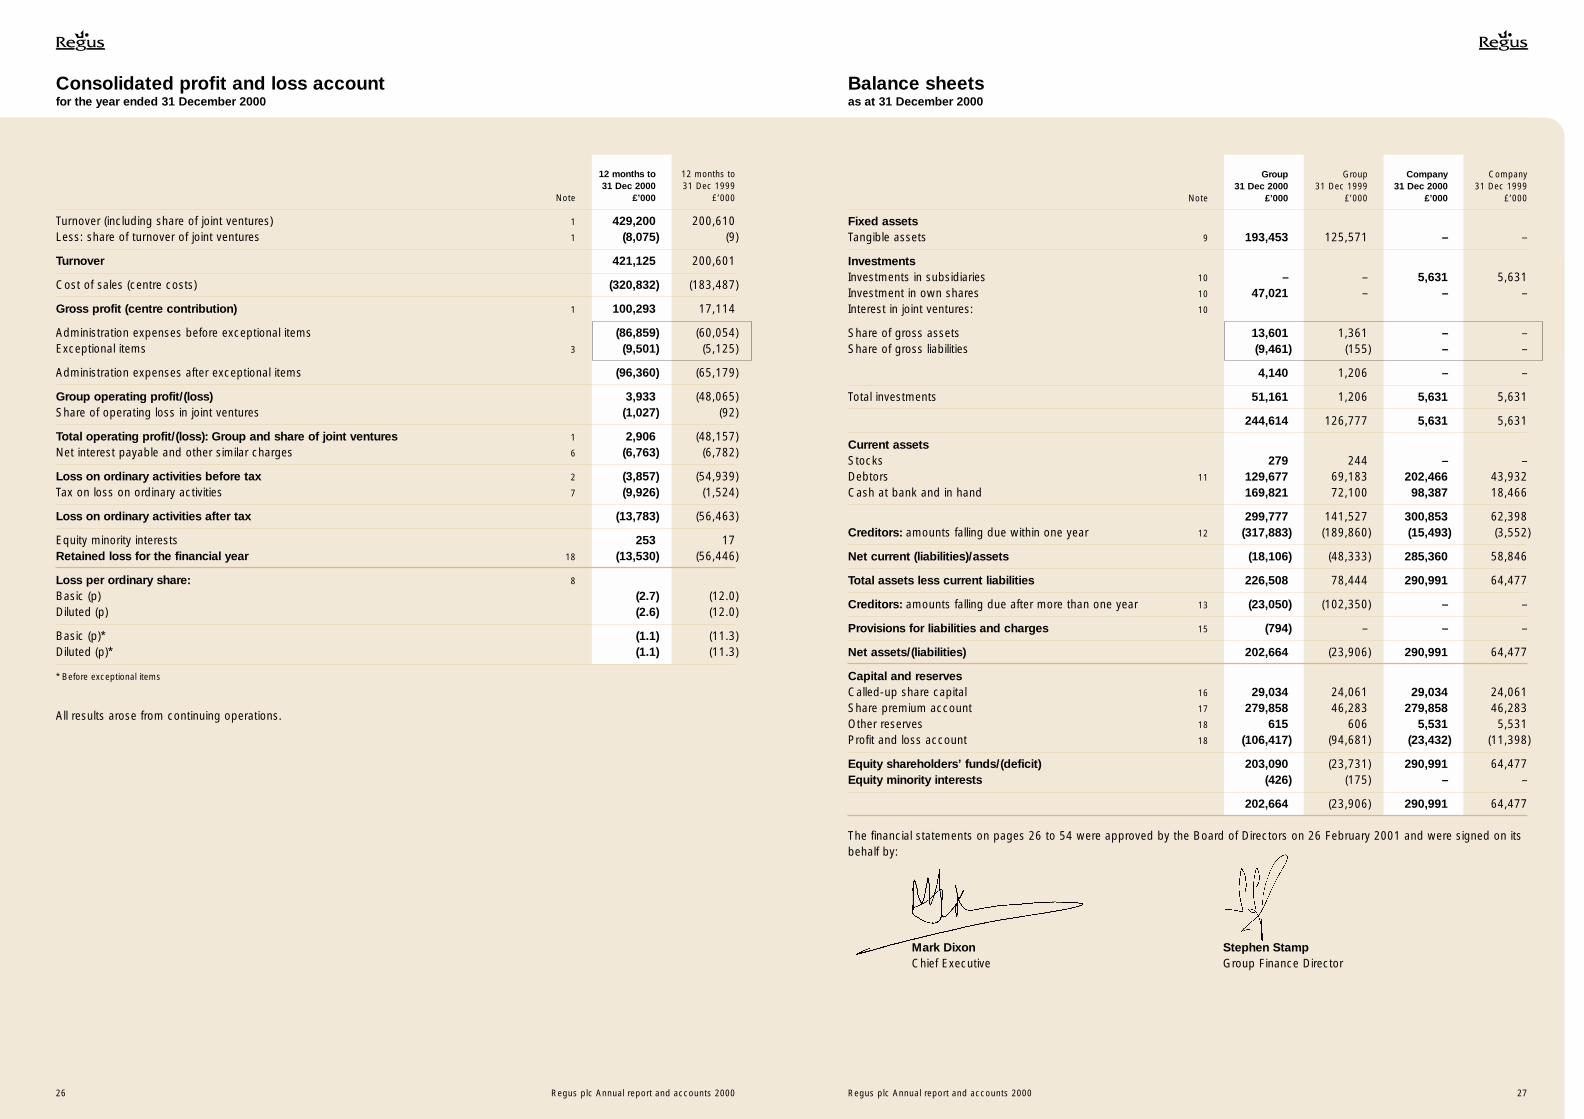
Balance sheets as at 31 December 2000
Consolidated profit and loss accountfor the year ended 31 December 2000
12 months to 12 months to31 Dec 2000 31 Dec 1999
Note £’000 £’000
Turnover (including share of joint ventures) 1 429,200 200,610Less: share of turnover of joint ventures 1 (8,075) (9)
The financial statements on pages 26 to 54 were approved by the Board of Directors on 26 February 2001 and were signed on its behalf by:
Mark Dixon Stephen StampChief Executive Group Finance Director
Consolidated statement of total recognised gains and losses for the year ended 31 December 2000
Consolidated cash flow statement for the year ended 31 December 2000
12 months to 12 months to31 Dec 2000 31 Dec 1999
Note £’000 £’000
Cash inflow from continuing operating activitiesNet cash inflow before exceptional items 117,899 17,731Outflow related to exceptional item 19(a) – (3,370)
Net cash inflow from continuing operating activities 19(a) 117,899 14,361
Returns on investments and servicing of financeInterest received 3,851 1,287Interest paid (7,993) (3,575)Interest paid on finance leases (2,861) (2,943)Debt arrangement fees paid – (1,500)
(7,003) (6,731)
TaxationTax paid (2,224) (969)
(2,224) (969)
Capital expenditurePurchase of tangible fixed assets (88,078) (76,024)Sale of tangible fixed assets 1,506 311Purchase of own shares (42,500) –
(129,072) (75,713)
Acquisitions and disposalsInvestment in joint ventures (3,789) (1,296)
(3,789) (1,296)
Cash outflow before management of liquid resources and financing (24,189) (70,348)Management of liquid resources 19(b) (78,712) (16,519)Financing 19(b) 118,766 96,979
Increase in cash in the period 19(c)(d) 15,865 10,112
12 months to 12 months to31 Dec 2000 31 Dec 1999
£’000 £’000
Loss for the financial year (13,530) (56,446)Exchange differences 2,675 (1,160)Tax charge on exchange differences (872) –
Total recognised losses for the year (11,727) (57,606)
Reconciliation of movements in Group shareholders’ funds
12 months to 12 months to31 Dec 2000 31 Dec 1999
£’000 £’000
Loss for the financial year (13,530) (56,446)Net proceeds of ordinary shares issued 238,548 20,000Exchange differences 2,675 (1,160)Tax charge on exchange differences (872) –
Net increase/(decrease) in shareholders’ funds 226,821 (37,606)Shareholders’ (deficit)/funds at 1 January (23,731) 13,875
Shareholders’ funds/(deficit) at 31 December 203,090 (23,731)
Regus plc Annual report and accounts 2000 2928 Regus plc Annual report and accounts 2000
Accounting policies
1 Description of businessRegus plc (the “Company”), formerly Regus Business Centres plc, and its consolidated subsidiaries (the “Group”) are engaged in the provision of fully serviced business centres offering clients a mix of workstations, conference rooms and related supportservices. The Group operates an international network of business centres and is divided into four geographic regions, UK andIreland, Rest of Europe, Americas and Rest of World. Maxon Investments BV (“Maxon”) is the ultimate parent company andM L J Dixon, the Chief Executive of the Company, has an effective controlling interest in the equity shares of the Company via Maxon.
2 Basis of preparationThe consolidated financial statements have been prepared in conformity with accounting principles generally accepted in theUnited Kingdom (“UK GAAP”), under the historical cost convention. These principles differ in certain significant respects fromgenerally accepted accounting principles in the United States (“US GAAP”). Application of US GAAP would have affectedshareholders’ funds/(deficit) and results of operations at and for the years ended 31 December 1999 and 2000, to the extentsummarised in note 27.
The preparation of financial statements in conformity with UK GAAP and US GAAP requires management to make estimates and assumptions that reflect the reported amounts of assets and liabilities and disclosure of contingent liabilities at the date of the financial statements and the reported amounts of revenues and expenses for an accounting period. Such estimates andassumptions could change in the future as more information becomes known or circumstances change, such that the Group’sresults may differ from the amounts reported and disclosed in the financial statements. The following principal accounting policieshave been applied consistently in dealing with items which are considered material in relation to the Group’s financial statements.
3 Basis of consolidationThe financial statements have been prepared using the merger accounting principles contained in FRS 6, Acquisitions and Mergers,in relation to the Group reorganisation which comprised the addition on 23 July 1998 of a new Group holding company, Regus plc,above the previous one, Regus Business Centre BV. Under merger accounting, the results and cash flows of the two companiesare combined as though the structure was in place from 1 January 1997. Profit and loss and balance sheet comparatives areshown on the combined basis and adjustments have been made where necessary to adopt accounting policies consistent with UK GAAP rather than Dutch GAAP as used by the previous holding company.
The consolidated financial statements incorporate the financial statements of the Company and all its subsidiary undertakingswhich are more than 50% owned subsidiaries. Subsidiary undertakings not more than 50% owned, including 50% owned jointventures, are accounted for under the gross equity method and included in interest in joint ventures. All significant intercompanyaccounts and transactions have been eliminated on consolidation.
4 Transactions in foreign currenciesAssets and liabilities of foreign subsidiaries and related hedging instruments are translated into Sterling at the closing exchange rateprevailing at the balance sheet date. Results of overseas undertakings are translated into Sterling at the average rates of exchangefor the relevant period. Differences arising from the re-translation of the results of overseas undertakings are dealt with throughreserves.
Transactions in foreign currency are recorded using the rate of exchange at the date of the transaction. Monetary assets andliabilities denominated in foreign currencies are translated using the rate of exchange prevailing at the balance sheet date and thegains or losses on translation are included in the profit and loss account.
5 Tangible fixed assets and depreciationDepreciation is provided on a straight-line basis at rates calculated to write off the cost of fixed assets over their estimated usefullives at the following rates:
Furniture – five years Fixtures and fittings – shorter of the lease term, the first break point of the building lease or ten yearsTelephones and office equipment – five yearsComputer hardware – three yearsComputer software – two yearsCars – four years
Regus plc Annual report and accounts 2000 3130 Regus plc Annual report and accounts 2000
6 Fixed asset investmentsFixed asset investments are generally accounted for at the lower of cost and recoverable amount. Investments designated ashedging instruments are carried at market value, any gains or losses being recognised consistently with the item being hedged.
7 StocksStocks are stated at the lower of cost and net realisable value. Stocks relate to items purchased for resale to customers and to items intended for distribution within the business, such as office supplies and marketing materials. Provision is made for any deterioration in net realisable value as a result of obsolescence or damage.
8 Deferred taxationProvision under the liability method is made for deferred taxation at the current rate of corporation tax on all timing differences, to the extent that they are expected to crystallise.
9 Refurbishment The terms of most building leases require Regus to make good dilapidation or other damage occurring during the rental period.Due to the nature of the business, centres are maintained to a high standard. Accruals for dilapidations are made only when it is known that a dilapidation has occurred.
10 TurnoverTurnover represents the value of services provided to third parties in the year and is exclusive of VAT and similar taxes.
Centre income is invoiced monthly in advance and is deferred until the month in which the services are provided.
Income for other services supplied to clients using centres is charged and recognised in the month in which the related servicesare provided.
11 Cost of salesCost of sales consists of costs from the individual business centres, including property lease costs, employee costs and start-upcosts.
12 Start-up costsStart-up costs (including formation costs, costs related to finding property and any other centre opening costs) are charged to the profit and loss account as they are incurred.
13 PensionsThe Group operates defined contribution schemes. Contributions are charged to the profit and loss account on an accruals basis.
14 Leasesa) Finance leasesWhere the Group enters into a lease for furniture, fittings, equipment or cars which entails taking substantially all the risks andrewards of ownership of an asset, the lease is treated as a finance lease. This also includes occasions where the Group takesinterest-bearing extended credit from suppliers and certain loans from landlords.
Under all such lease arrangements the asset is recorded in the balance sheet as a tangible asset and is depreciated over theshorter of the lease term and its estimated useful life in accordance with the policy described above. Future instalments under such leases, net of finance charges, are included in creditors.
Lease payments are apportioned between the finance element, which is charged to the profit and loss account on a sum-of-the-digits basis or a post-tax actuarial basis, and the capital element, which reduces the outstanding obligation for future instalments.
b) Building leasesBuilding leases are all accounted for as operating leases because substantially all the risks and rewards of ownership remain with the lessor.
The rental on certain leases is wholly or partly conditional on the profitability of the centre and therefore the risk to the business, in terms of rent, is reduced. Once all outstanding rent has been paid, landlords receive a share of the profits of the centre.
Regus plc Annual report and accounts 2000 3332 Regus plc Annual report and accounts 2000
Notes to the financial statementsfor the year ended 31 December 2000
Regus plc Annual report and accounts 2000 33
1 Segmental reporting
The following tables set out the Group’s segmental analysis by geographic region and by established and new centres. Establishedcentres are those that have been open for a period of at least 18 months as at the end of the relevant period and new centres arethose that have been open for less than 18 months as at the end of the relevant period.
12 months to 12 months to 12 months to 12 months to31 Dec 2000 31 Dec 1999 31 Dec 2000 31 Dec 1999
£’000 £’000 £’000 £’000
Geographic analysisUK and Ireland 188,862 102,856 59,619 20,169Rest of Europe 118,933 73,739 29,214 10,830Americas 94,296 15,646 13,850 (6,012)Rest of World 27,109 8,369 (2,390) (7,873)
429,200 200,610 100,293 17,114
Total Group 421,125 200,601Total joint ventures 8,075 9
Operating Operating Net assets/ Net assets/profit/(loss) profit/(loss) (liabilities) (liabilities)
12 months to 12 months to As at As at31 Dec 2000 31 Dec 1999 31 Dec 2000 31 Dec 1999
£000 £’000 £’000 £’000
Geographic analysisUK and Ireland 36,763 4,830 21,304 (5,952)Rest of Europe 3,783 (10,527) (28,972) (27,073)Americas (14,646) (19,812) (308) (15,189)Rest of World (11,609) (15,742) (29,294) (17,791)Other (1,884) (1,781) 249,435 47,224Exceptional item (9,501) (5,125) (9,501) (5,125)
2,906 (48,157) 202,664 (23,906)
Total Group 3,933 (48,065) 198,524 (25,112)Total joint ventures (1,027) (92) 4,140 1,206
There is no difference between segmental information on an origin basis and on a destination basis.
The directors are of the opinion that the whole of the turnover is derived from the same class of business.
Accounting policies continued
32 Regus plc Annual report and accounts 2000
14 Leases continued
For leases which are wholly or partly conditional on the profitability of the centre, an estimate is made of the likely rent payablebased on profitability in respect of the period up to the date of the first market rent review or first break point in the lease,whichever is sooner, and this is spread on a straight-line basis over that period. Any subsequent changes in estimates are spreadover the remaining period to the date of the first market rent review or first break point in the lease, whichever is sooner. Amountspayable in respect of profit shares are accrued once a sufficient net surplus has been made which would result in a profit sharebeing paid.
Any incentives or rent-free periods on conventional leases and the conventional element of leases, which are partly conventionaland partly conditional on profitability, are spread on a straight-line basis over the period to the date of the first market rent review orfirst break point in the lease, whichever is sooner, so that the amounts charged to the profit and loss account are the same eachyear over that period.
15 Financial instrumentsThe Group uses various derivative financial instruments to hedge its exposures to fluctuations in foreign exchange risks. These include forward currency contracts and currency options.
The accounting method used for derivative financial instruments is determined by whether or not the instrument is designated as a hedge of an existing exposure and, if so, by the accounting method used for the item being hedged.
The Group considers its derivative financial instruments to be hedges when certain criteria are met.
Forward currency contractsThe Group’s criteria to qualify for hedge accounting are:
• The instrument must be related to a foreign currency asset or liability
• It must involve the same currency as the hedged item
• It must reduce the risk of foreign currency exchange movements on the Group’s operations.
The Group has established policies and procedures for risk assessment and the approval, reporting and monitoring of derivativefinancial instruments. The Group does not enter into financial instruments for trading or speculative purposes.
Forward currency contracts are marked to market at the period end, with the resulting exchange gains or losses taken toadministration expenses in the profit and loss account except where the hedged items’ exchange difference is reflected in reserves(such as quasi-equity loans). In this situation the gain or loss is taken to reserves. The gains or losses on the forward contracts arerecognised when the gains or losses on the underlying hedged transactions are recognised. The net resulting unrealised asset orliability is reflected in debtors or creditors as appropriate.
Premiums or discounts on derivative financial instruments that hedge an existing exposure are charged or credited to interestincome or cost over the life of the instrument, the related asset or liability is classified as an accrual or prepayment.
Derivative financial instruments that are not designated as hedges are marked to market using period-end market rates, and gainsor losses are taken to the profit and loss account.
Gains or losses arising on hedging instruments which are cancelled due to the termination of the underlying exposure are taken to administration expenses immediately.
Currency optionsUnder hedge accounting for currency options, the Group defers the instruments’ impact on profit until it fully recognises theunderlying hedged item in the profit and loss account.
Option costs are charged to the interest cost over the life of the option contract, the related asset is classified as prepayments.
At maturity, any realised gain on the option is recognised in the profit and loss account in administration expenses.
Regus plc Annual report and accounts 2000 3534 Regus plc Annual report and accounts 2000
Notes to the financial statementsfor the year ended 31 December 2000 continued
2 Loss on ordinary activities before tax12 months to 12 months to31 Dec 2000 31 Dec 1999
£’000 £’000
Loss before tax is stated after charging:Depreciation of tangible fixed assets:
Loss on sale of fixed assets 1,520 15Operating leases:
– property 136,969 71,805– equipment 6,033 5,466
Audit fees:– Company 5 5– Group 546 375
Non-audit fees paid to KPMG Audit plc and associates:– UK companies 204 76– Group 496 306– exceptional (note 3) – 900
Other exceptional items (note 3) 9,501 4,225
In addition to the fees above, audit fees and non-audit fees of £0.2 million and £0.8 million respectively paid to KPMG were offsetagainst the share premium account.
3 Exceptional item
The exceptional pre-tax charge of £9.5 million relates to costs associated with the write down of the Reward share options’exercise price from £1.455 to £0.05.
The exceptional pre-tax charge of £5.1 million in 1999 related principally to costs associated with the raising of loan finance andthe postponed flotation work during 1999.
4 Loss of holding company
Of the loss attributable to shareholders, a loss of £11.9 million (1999: loss of £11.7 million) is dealt with in the accounts of Regus plc.As permitted by Section 230 of the Companies Act 1985, the Company has not presented its own profit and loss account.
Regus plc Annual report and accounts 2000 3534 Regus plc Annual report and accounts 2000
5 Employees and directors12 months to 12 months to31 Dec 2000 31 Dec 1999
£’000 £’000
Staff costs for the Group during the yearWages and salaries 61,648 42,126Social security costs 7,851 5,465Other pension costs 260 300
69,759 47,891
The Group contributes to the personal pension schemes of a small number of employees. The amount which is included withincreditors is £44,000 (1999: £12,000). Included within the above staff costs in 1999 are £900,000 of exceptional costs in relation tothe postponed flotation work (note 3).
12 months to 12 months to31 Dec 2000 31 Dec 1999
Number Number
Average number of people (including executive directors) employed during the yearCentre staff 1,525 949Sales staff 284 285Finance staff 135 111Other staff 157 147
2,101 1,492
12 months to 12 months to31 Dec 2000 31 Dec 1999
£’000 £’000
DirectorsAggregate emoluments 988 787
Compensation for loss of office – 36
Company pension payments to money purchase scheme 48 65
Highest-paid directorAggregate emoluments 448 385
Company pension payments to money purchase scheme 28 56
Retirement benefits are accruing to three directors under a money purchase scheme. One director (1999: one director) receivedshare options under the long-term incentive scheme.
More detailed information on directors’ emoluments is provided in the Remuneration report on pages 22 to 24.
Regus plc Annual report and accounts 2000 3736 Regus plc Annual report and accounts 2000
Notes to the financial statementsfor the year ended 31 December 2000 continued
Regus plc Annual report and accounts 2000 3736 Regus plc Annual report and accounts 2000
6 Net interest payable and other similar charges12 months to 12 months to31 Dec 2000 31 Dec 1999
£’000 £’000
Interest payable on overdrafts and loans 7,759 7,495Interest payable on finance leases 2,867 2,965
10,626 10,460Interest income (3,863) (3,678)
Net interest payable and other similar charges 6,763 6,782
7 Taxation12 months to 12 months to31 Dec 2000 31 Dec 1999
£’000 £’000
United KingdomCorporation tax at 30% (1999: 30%) 4,402 –Deferred tax 794 –Under provision in respect of prior periods – 180
5,196 180OverseasCorporation taxes 4,752 1,322Under provision in respect of prior periods (22) 124Deferred tax – (102)
9,926 1,524
Approximate gross tax losses to carry forward against certainfuture UK corporation tax liabilities – 5,855
Approximate gross tax losses to carry forward against certainfuture overseas corporation tax liabilities 76,910 57,718
No deferred tax has been provided on the unremitted accumulated reserves of the subsidiary undertakings as accumulatedreserves of subsidiary undertakings are retained to finance their business.
At 31 December 2000, the total unremitted accumulated reserves of the overseas subsidiary undertakings were £2.0 million (1999: £2.4 million).
The tax losses above have the following expiration dates:
31 Dec 2000 31 Dec 1999£’000 £’000
2000 – 8602001 196 9152002 757 1,4972003 2,592 3,4892004 15,885 10,0102005 7,574 2732006 397 2982007 and later 27,647 16,547
55,048 33,889Available indefinitely 21,862 29,684
76,910 63,573
7 Taxation continued
A reconciliation of the actual tax charge resulting from applying the UK statutory rate to the loss before tax is as follows:
12 months to 12 months to31 Dec 2000 31 Dec 1999
£’000 £’000
UK statutory rate applied to result for year (1,157) (16,502)Adjusted for:Permanent differences:Professional fees associated with postponed flotation and costs of obtaining loan finance – 2,010Other permanent differences 451 217Difference in taxation rates (1,721) (1,732)Tax losses utilised (1,133) (795)Deferred tax asset not booked in respect of:Tax losses carried forward 6,907 16,211Start-up costs and other reserves 6,717 1,905Adjustment in respect of prior periods (22) 304Other items (116) (94)
Actual tax charge 9,926 1,524
Page 14 of the financial review provides an explanation of the tax charge.
8 Loss per share
Loss per share has been calculated by dividing the retained loss for the financial year by the weighted average number of ordinaryshares in issue excluding those held under the employee share trust. The loss per share before exceptional items has beencalculated by adjusting the loss for the years ended 31 December 2000 and 1999 by the exceptional items of £9.5 million and £5.1 million and the tax thereon of £1.5 million and £1.5 million respectively. There were no adjustments to the retained loss for the year for the diluted earnings per share computations. The basic weighted number of ordinary shares has been adjusted by 13,829,065 (1999: nil) shares, relating to share options, to arrive at the diluted number of ordinary shares. The followingsummarises the calculation of loss per share for the years ended 31 December 1999 and 2000:
12 months to 12 months to31 Dec 2000 31 Dec 1999
Retained loss for the year (£’000) (13,530) (56,446)
Weighted average ordinary shares in issue – basic (000) 497,889 469,486
– diluted (000) 511,718 469,486
Loss per ordinary share – basic (p) (2.7) (12.0)
– diluted (p) (2.6) (12.0)
Loss per ordinary share (before exceptional items) – basic (p) (1.1) (11.3)
– diluted (p) (1.1) (11.3)
Regus plc Annual report and accounts 2000 3938 Regus plc Annual report and accounts 2000
Notes to the financial statementsfor the year ended 31 December 2000 continued
Regus plc Annual report and accounts 2000 3938 Regus plc Annual report and accounts 2000
11 DebtorsGroup Group Company Company
31 Dec 2000 31 Dec 1999 31 Dec 2000 31 Dec 1999£’000 £’000 £’000 £’000
Amounts falling due within one yearTrade debtors 60,990 31,153 – –Amounts owed by participating interest 1,862 – – –Other debtors 29,940 14,951 – –Prepayments and accrued income 26,364 16,121 393 –VAT recoverable 10,521 6,958 – –
129,677 69,183 393 –
Amounts falling due after one yearAmounts owed by Group undertakings – – 202,073 43,932
Total debtors 129,677 69,183 202,466 43,932
As at 31 December 2000 the provision for bad and doubtful debts was £1.7 million (1999: £1.0 million). An allowance for bad anddoubtful debts is recorded at the end of each period based upon the expected collectability of all trade receivables.
Analysis of the bad and doubtful debt provision is as follows:Group Group
31 Dec 2000 31 Dec 1999£’000 £’000
Opening balance 1,047 732Additional charges to profit and loss account 842 439Provision utilisation (190) (79)Exchange difference 2 (45)
Closing balance 1,701 1,047
9 Tangible fixed assets – GroupFurniture
and fittings Computers Motor vehicles Total£’000 £’000 £’000 £’000
Aggregate depreciationAt 1 January 2000 32,921 3,093 253 36,267Exchange differences 280 70 (2) 348Charge for the period 34,759 5,664 123 40,546Disposals (2,688) (1,137) (177) (4,002)
At 31 December 2000 65,272 7,690 197 73,159
Net book value at 31 December 2000 179,421 13,807 225 193,453
Net book value at 31 December 1999 117,746 7,500 325 125,571
The net book value of tangible fixed assets includes an amount in respect of fixed assets held under finance leases as follows:
Group Group31 Dec 2000 31 Dec 1999
£’000 £’000
Cost 74,570 51,675Depreciation (28,078) (15,900)
Net book value 46,492 35,775
10 InvestmentsGroup Company
Group Interest SharesInvestment in joint Group in Group
in own shares* ventures Total undertakings£’000 £’000 £’000 £’000
At 1 January 2000 – 1,206 1,206 5,631Exchange differences – 170 170 –Additions 45,200 3,791 48,991 –Revaluation 1,821 – 1,821 –Share of losses retained – (1,027) (1,027) –
At 31 December 2000 47,021 4,140 51,161 5,631
* The nominal value of the Group’s investment in own shares is £0.9 million. Note 21 provides details of the investment in own shares.
Details of investments in subsidiary companies are given on pages 53 to 54 of these accounts.
Notes to the financial statementsfor the year ended 31 December 2000 continued
Regus plc Annual report and accounts 2000 4140 Regus plc Annual report and accounts 2000
14 Maturity of debt
The maturity profile of the carrying amount of the Group’s financial liabilities as at 31 December was as follows:
Bank loans Finance and overdrafts Other loans leases Total
31 Dec 2000 31 Dec 2000 31 Dec 2000 31 Dec 2000£’000 £’000 £’000 £’000
Within one year 5,750 807 10,614 17,171Between one and two years 4 285 10,224 10,513Between two and five years 8 678 10,685 11,371After five years or more – 512 241 753
5,762 2,282 31,764 39,808
Bank loans Finance and overdrafts Other loans leases Total31 Dec 1999 31 Dec 1999 31 Dec 1999 31 Dec 1999
£’000 £’000 £’000 £’000
Within one year 26,154 122 9,314 35,590Between one and two years 80,783 1,361 7,216 89,360Between two and five years 21 547 6,436 7,004After five years or more – 26 22 48
106,958 2,056 22,988 132,002
The following provides additional disclosure for bank loans and overdrafts and other loans:
Group Group Company Company31 Dec 2000 31 Dec 1999 31 Dec 2000 31 Dec 1999
£’000 £’000 £’000 £’000
Within one year 6,557 26,276 – 3,249Between one and two years 289 82,144 – –Between two and three years 249 343 – –Between three and four years 238 88 – –Between four and five years 199 137 – –After five years or more 512 26 – –
8,044 109,014 – 3,249
The following provides additional finance lease disclosure including the interest components of future minimum lease payments:
Group Group Company Company31 Dec 2000 31 Dec 1999 31 Dec 2000 31 Dec 1999
£’000 £’000 £’000 £’000
Within one year 11,966 10,984 – –Between one and two years 11,967 7,901 – –Between two and three years 7,862 4,726 – –Between three and four years 1,970 2,358 – –Between four and five years 1,379 209 – –After five years or more 1,118 23 – –
Present value of future minimum lease payments 31,764 22,988 – –Within one year 10,614 9,314 – –
After one year 21,150 13,674 – –
12 Creditors – amounts falling due within one yearGroup Group Company Company
31 Dec 2000 31 Dec 1999 31 Dec 2000 31 Dec 1999£’000 £’000 £’000 £’000
Bank loans and overdrafts 5,750 26,154 – 3,249Other loans 807 122 – –Obligations under finance leases 10,614 9,314 – –Amounts owed to Group undertakings – – 8,851 –Trade creditors 31,207 19,928 – –Customer deposits 80,024 37,674 – –Other tax and social security 16,128 9,043 – –Corporation tax 9,849 1,877 301 301Deferred income 43,541 23,551 – –Deferred landlord contributions 3,173 4,529 – –Rent accruals 56,307 34,145 – –Other accruals 58,392 21,440 – –Other creditors 2,091 2,083 6,341 2
317,883 189,860 15,493 3,552
As at 31 December 2000 other accruals included property taxes £4.5 million (1999: £2.6 million), telephone call cost accruals£1.4 million (1999: £1.1 million), marketing and advertising £3.4 million (1999: £1.4 million), commissions and bonuses £6.0 million(1999: £1.4 million), holiday pay £1.1 million (1999: £0.7 million), legal and audit fees £1.4 million (1999: £0.6 million), share optioncost accruals £13.2 million (1999: £nil) and other accruals £27.4 million (1999: £13.6 million)
13 Creditors – amounts falling due after more than one year
Group Group Company Company31 Dec 2000 31 Dec 1999 31 Dec 2000 31 Dec 1999
£’000 £’000 £’000 £’000
Bank loans 12 80,804 – –Other loans 1,475 1,934 – –Obligations under finance leases 21,150 13,674 – –Accruals and deferred income 361 5,855 – –Other creditors 52 83 – –
23,050 102,350 – –
Certain bank loans are secured on the assets of the applicable subsidiaries and bear interest at local commercial rates. All othercreditors are unsecured and non-interest bearing.
Deferred tax has been provided to the extent that the directors believe on the basis of reasonable assumptions that it is probablethat the liability will crystallise in the foreseeable future.
As at 31 December 2000 the Group had £13.7 million (1999: £3.0 million) of other available credit facilities, none of which (1999: £0.8 million) was drawn, that bear interest at various commercial rates with maturities through December 2004.
Regus plc Annual report and accounts 2000 4342 Regus plc Annual report and accounts 2000
Notes to the financial statementsfor the year ended 31 December 2000 continued
Regus plc Annual report and accounts 2000 4342 Regus plc Annual report and accounts 2000
15 Provisions for liabilities and chargesGroup
Deferred tax£’000
At 1 January 2000 –Provided in year 794
At 31 December 2000 794
There is no unprovided deferred tax.
16 Share capitalGroup and Group and Company Company
31 Dec 2000 31 Dec 1999£’000 £’000
Authorised659,999,615 new A ordinary shares of 5 pence each – 33,000140,000,385 new B ordinary shares of 5 pence each – 7,000800,000,000 ordinary shares of 5 pence each 40,000 –
40,000 40,000
Allotted and fully paid385,665,000 new A ordinary shares of 5 pence each – 19,28395,557,208 new B ordinary shares of 5 pence each – 4,778580,676,185 ordinary shares of 5 pence each 29,034 –
29,034 24,061
In March 2000, 1,855,670 new A ordinary shares of 5 pence each were allotted for a total consideration of £2.7 million.
In October 2000, 97,598,307 ordinary shares of 5 pence each were issued in an Initial Public Offering for a total consideration of £253.8 million, at the same time new A and new B ordinary shares were reclassified as ordinary shares.
17 Share premium accountGroup and Company
(non distributable)
£’000
At 1 January 2000 46,283Premium on issue of shares during period 251,483Issue costs (17,908)
At 31 December 2000 279,858
18 ReservesGroup Company
Group Other Company OtherProfit (non Profit (non
and loss distributable) and loss distributable)£’000 £’000 £’000 £’000
At 1 January 2000 (94,681) 606 (11,398) 5,531Retained loss for the period (13,530) – (11,922) –Transfer to capital reserve (9) 9 – –Exchange differences 2,675 – (112) –Tax on exchange differences (872) – – –
At 31 December 2000 (106,417) 615 (23,432) 5,531
19 Cash flow statement
a) Reconciliation of operating profit/(loss) to net cash inflow from operating activitiesGroup Group
12 months to 12 months to31 Dec 2000 31 Dec 1999
£’000 £’000
Continuing operating activitiesOperating profit/(loss) 3,933 (48,065)Depreciation charge 40,546 20,061Loss on disposal of fixed assets 1,520 15(Increase)/decrease in stocks (33) 22Increase in debtors (58,228) (32,573)Increase in creditors 130,161 74,901
Net cash inflow from continuing operating activities 117,899 14,361
The cash inflow for 1999 includes a £3.4 million outflow relating to the exceptional item charged during the year (note 3).
b) Financing and management of liquid resourcesGroup Group
12 months to 12 months to31 Dec 2000 31 Dec 1999
£’000 £’000
Management of liquid resourcesNew cash deposits (95,897) (105,536)Repayment of cash deposits 17,185 89,017
(78,712) (16,519)
FinancingNew loans 13,945 105,073Repayment of loans (116,325) (12,298)Payment of principal under finance leases (14,702) (15,796)Issue of equity shares 253,756 20,000Issue costs (17,908) –
118,766 96,979
Regus plc Annual report and accounts 2000 4544 Regus plc Annual report and accounts 2000
Notes to the financial statementsfor the year ended 31 December 2000 continued
Regus plc Annual report and accounts 2000 4544 Regus plc Annual report and accounts 2000
19 Cash flow statement continued
c) Reconciliation of net cash flow to movement in net funds/(borrowings)12 months to 12 months to31 Dec 2000 31 Dec 1999
£’000 £’000
Increase in cash in the period 15,865 10,112Cash outflow/(inflow) from change in borrowings and finance leases 117,082 (76,979)Cash outflow from increase in liquid resources 78,712 16,519
Change in net funds/borrowings resulting from cash flows 211,659 (50,348)Other non-cash items:New finance leases (23,574) (17,234)Exchange differences 1,830 (1,280)
Movement in net funds/borrowings in the year 189,915 (68,862)Net (borrowings)/funds at 1 January (59,902) 8,960
Net funds/(borrowings) at 31 December 130,013 (59,902)
d) Analysis of changes in net funds/(borrowings) in the period
Cash at bank and in hand 16,426 8,030 6,583 393 31,432Overdrafts (1,923) 7,835 (7,229) 114 (1,203)
14,503 15,865 (646) 507 30,229Debt due after one year (82,738) (10,076) 91,387 (60) (1,487)Debt due within one year (24,353) 112,456 (93,852) 395 (5,354)Finance leases due after one year (13,674) 6,534 (14,000) (10) (21,150)Finance leases due within one year (9,314) 8,168 (9,377) (91) (10,614)
Liquid resources include cash held on deposit of which £40.9 million at 31 December 2000 (1999: £22.0 million) relates to depositswhich are held by banks as security for the issuance of bank guarantees to support lease commitments by Regus operatingcompanies. These amounts are blocked and are not available for use by the business.
There are arrangements in place where cash balances and deposits with banks in the UK and the Netherlands can be offsetagainst overdrawn accounts in the same bank.
Non-cash changes comprise new finance leases and reclassifications between categories.
20 Financial instruments
Details of the role that financial instruments have had during the year in managing the risks that the Group faces are discussed in the Financial review on page 14 of the financial statements.
Short-term debtors and creditors and inter-company balancesShort-term debtors and creditors have been excluded from all the following disclosures other than the currency risk disclosure.Inter-company balances have been excluded from all the following disclosures except for the currency risk disclosure.
Interest rate risk and currency profile of financial liabilities and assetsThe following table analyses the currency and interest rate composition of the Group’s financial liabilities and assets, comprisinggross borrowings, and deposits where applicable.
31 December 2000Weighted
Weighted averageaverage period for
At floating At fixed Non-interest fixed which raterates rates bearing Total interest rate is fixed
Financial liabilities £’000 £’000 £’000 £’000 % Years
Maturity analysis of undrawn committed borrowing facilitiesThe Group has the following undrawn committed borrowing facilities available at 31 December in respect of which all conditionsprecedent had been met at that date:
31 Dec 2000 31 Dec 1999Expiring within £’000 £’000
One year or less 3,589 10,000Between one and two years – –In more than two years – 1,250
3,589 11,250
20 Financial instruments continued
Currency exposureAs explained in the Financial review, to mitigate the effect of the currency exposures arising from its net investments overseas theGroup borrows in the local currencies arising from its net investments. Gains and losses arising on net investments overseas arerecognised in the statement of total recognised gains and losses.
The tables below show the extent to which Group companies have monetary assets and liabilities in currencies other than theirlocal currency. Foreign exchange differences on retranslation of these assets and liabilities are taken to the profit and loss accountof the Group companies and the Group.
31 December 2000Net foreign currency monetary assets/(liabilities)
JapaneseFunctional currency Euro Yen Sterling US Dollar Others Totalof Group operation £’000 £’000 £’000 £’000 £’000 £’000
Regus plc Annual report and accounts 2000 4948 Regus plc Annual report and accounts 2000
Notes to the financial statementsfor the year ended 31 December 2000 continued
Regus plc Annual report and accounts 2000 4948 Regus plc Annual report and accounts 2000
20 Financial instruments continued
Fair value disclosuresThe following table provides a comparison by category of the carrying amounts and the fair value of the Group's financial assetsand liabilities at 31 December.
Fair value is the amount at which a financial instrument could be exchanged in an arm's length transaction between informed andwilling parties, other than a forced or liquidation sale, and excludes accrued interest.
Set out below the table is a summary of the methods and assumptions used for each category of financial instrument.
Book value Fair value Book value Fair value31 Dec 2000 31 Dec 2000 31 Dec 1999 31 Dec 1999
£’000 £’000 £’000 £’000
Primary financial instruments held or issued to finance the Group's operationsShort-term borrowings (17,171) (15,874) (35,590) (34,842)Long-term borrowings (22,637) (16,837) (96,412) (92,531)Short-term deposits 138,389 138,389 55,674 55,674Accounts receivable 60,990 60,990 31,153 31,153Accounts payable (31,207) (31,207) (19,928) (19,928)Cash at bank and in hand 31,432 31,432 16,426 16,426
Derivative financial instruments held to hedge thecurrency exposure on expected future resultsForward foreign currency contracts 1,510 1,510 – –Currency options – 45 – –
Summary of methods and assumptionsForward foreign currency contracts and currency optionsFair value is based on market price of comparable instruments at the balance sheet date.
Short-term deposits and borrowings, accounts receivable and payableThe fair value of short-term deposits, loans, overdrafts, and accounts receivable and payable approximates to the carrying valuebecause of the short maturity of these instruments. The fair value of finance leases has been calculated by discounting future cashflows at the Group’s weighted average cost of capital.
Long-term borrowingsThe fair value of bank loans and other loans approximates to the carrying value because the majority are floating rate wherepayments are reset to market rates at intervals of less than one year. The fair value of finance leases has been calculated bydiscounting future cash flows at the Group’s weighted average cost of capital.
HedgesThe table below shows the extent to which the Group has off-balance sheet (unrecognised) and on-balance sheet (deferred) gainsand losses in respect of financial instruments used as hedges at the beginning and end of the year. It also shows the amount ofsuch gains and losses which have been included in the profit and loss account for the year and those gains and losses which areexpected to be included in next year’s expected profit and loss accounts.
All the gains and losses on the hedging instruments are expected to be matched by losses and gains on the hedged transactionsor positions.
Under the Group’s accounting policy, foreign currency assets and liabilities which are hedged using forward foreign currencycontracts are translated at the period end rate and the forward contract is marked to market. The Group defers the impact of foreign currency options on profit until it fully recognises the underlying hedged item in the profit and loss account.
20 Financial instruments continued
The gains or losses on both these types of instrument are treated as deferred for the purposes of the table below.
Unrecognised DeferredUnrecognised Unrecognised net gains/ Deferred Deferred net gains/
Gains and losses on hedges at 1 January 2000 – – – – – –Arising in previous years included in 2000 income – – – – – –
Gains and losses not included in 2000 incomeArising before 1 January 2000 – – – – – –Arising in 2000 45 – 45 – – –
Gains and losses on hedges at 31 December 2000 45 – 45 – – –
Of which:Gains and losses expected to be included in 2001 income 45 – 45 – – –Gains and losses expected to be included in 2002 income or later – – – – – –
21 Employee share ownership plan (“ESOP”)
During 1999 the Group established the Regus Employee Trust. The Trustee is Mourant & Co Trustees Limited which is anindependent professional trust company residing in Jersey. The Trust is a discretionary trust for the benefit of employees (includingdirectors). The ESOP provides for the issue of options and the payment of bonuses to the Group’s employees (including directors)at the discretion of the Company.
The Trustee is not entitled to receive dividends.
At 31 December 2000 the Trust held 18,120,670 shares in Regus plc (note 10). The market value at 31 December 2000 was£65.6 million. Costs incurred by the Trust are expensed in the profit and loss account.
Regus plc Annual report and accounts 2000 5150 Regus plc Annual report and accounts 2000
Notes to the financial statementsfor the year ended 31 December 2000 continued
Regus plc Annual report and accounts 2000 5150 Regus plc Annual report and accounts 2000
23 Operating lease commitments
At 31 December the Group had lease agreements in respect of properties, vehicles, plant and equipment, for which the paymentsextend over a number of years.
Vehicles,plant and 31 Dec 2000 31 Dec 1999
Property equipment Total Total£’000 £’000 £’000 £’000
Annual commitments under non-cancellable operating leases expiring:Within one year 2,601 1,903 4,504 1,169Between one and five years 78,830 7,527 86,357 35,797After five years 59,829 31 59,860 61,667
141,260 9,461 150,721 98,633
31 Dec 2000 31 Dec 1999Total Total
£’000 £’000
Minimum future lease payments under non-cancellable operating leases:Amounts due within one year 150,721 98,633Amounts due between one and two years 149,732 103,079Amounts due between two and three years 143,571 97,087Amounts due between three and four years 114,692 83,487Amounts due between four and five years 88,320 58,609Amounts due after five years 245,420 177,472
892,456 618,367
24 Contingent liabilities
The Group has bank guarantees and letters of credit held with certain banks, totalling £42.2 million (1999: £26.5 million). The Company also acts as a guarantor for certain obligations of other subsidiary entities.
25 Related party transactions
During the year ended 31 December 2000 the Group received management fees of £3.0 million (1999: £nil) from its joint ventureentities as listed on pages 53 and 54. At 31 December 2000, £1.9 million (1999: £nil) was due to the Group from the joint ventures.
26 Ultimate parent company and controlling party
Maxon Investments BV, a company incorporated in The Netherlands, is considered as the ultimate parent company. M L J Dixon is considered the ultimate controlling party by virtue of his effective controlling interest in the equity shares of the Company viaMaxon Investments BV.
21 Employee share ownership plan (“ESOP”) continued
At 31 December 2000, awards over a total of 28,047,451 (1999: 20,971,634) shares had been granted to employees. The awards have been issued in eight tranches and some of the awards had been granted subject to the performance of the Group(performance awards). Details of the awards are provided below:
31 December 31 December2000 Exercise 1999 Exercise
Date first Number of price Number of priceAward type exercisable awards £ awards £
Performance awards 1 January 2003 to 1 January 2007 10,184,514 1.455 7,492,834 1.4551 January 2004 to 1 January 2008 1,322,792 2.60 –
Non-performance awards 1 January 2003 to 1 January 2007 9,741,279 1.455 9,582,328 1.4551 January 2003 to 1 January 2006 4,047,105 0.05 3,896,472 1.4551 January 2004 to 1 January 2008 2,751,761 2.60 –
28,047,451 20,971,634
Lapsed options at 31 December (4,025,953) –
Net options at 31 December 24,021,498 20,971,634
In addition, at 31 December 2000, awards over 120,000 American Depositary Receipts (1999: nil) had been granted to anemployee employed by the Group. The employee may begin to exercise these between 12 December 2003 and 12 December2005. All these awards had been granted subject to conditions linked to the performance of the Group. The exercise price of theseawards is $25.00.
The Group also operates a SAYE share ownership plan.
22 Capital commitmentsGroup Group Company Company
31 Dec 2000 31 Dec 1999 31 Dec 2000 31 Dec 1999£’000 £’000 £’000 £’000
Contracts placed for future capital expenditure not provided in the financial statements 14,279 17,432 – –
Regus plc Annual report and accounts 2000 5352 Regus plc Annual report and accounts 2000
Notes to the financial statementsfor the year ended 31 December 2000 continued
52 Regus plc Annual report and accounts 2000
27 Summary of differences between UK and US GAAP financial statements
The Group’s consolidated financial statements are prepared in accordance with UK GAAP, which differs in certain respects from US GAAP.
Effect of differences between UK and US GAAPThe following is a summary of the material adjustments to net loss which would have been required if US GAAP had been appliedinstead of UK GAAP:
12 months to 12 months to31 Dec 2000 31 Dec 1999
£’000 £’000
Net loss reported in accordance with UK GAAP (13,530) (56,446)US GAAP adjustments:Stock purchase warrants – (1,500)Amortisation of debt discount – (2,038)Compensation expense related to options granted by shareholder (6,836) (11,840)Compensation expense related to other variable plan options 3,997 –Deferred taxes (474) 644Income taxes on US GAAP adjustments – 611
Net loss in conformity with US GAAP (16,843) (70,569)
Weighted average shares outstanding (000) 502,773 469,486Loss per ordinary share before extraordinary items (p) (3.4) (14.7)Loss per ordinary share after extraordinary items (p)1 (3.4) (15.0)
1 In the year ended 31 December 1999 there was an extraordinary cost of £1,775,000 relating to the early extinguishment of debt.
The following is a summary of the material adjustments to shareholders’ funds/(deficit) which would have been required if US GAAPhad been applied instead of UK GAAP:
31 Dec 2000 31 Dec 1999£’000 £’000
Shareholders’ funds/(deficit) recorded in accordance with UK GAAP 203,090 (23,731)US GAAP adjustments:Stock purchase warrants and debt discount – (8,500)Compensation expense related to options granted by shareholder 1 – –Compensation expense related to other variable plan options2 10,778 –Deferred taxes 1,902 2,376Income taxes on US GAAP adjustmentsEmployee share trust (investment in own shares) (47,021) –
Shareholders’ funds/(deficit) in conformity with US GAAP 168,749 (29,855)
1 Shareholders’ funds/(deficit) was not affected by the differences between UK GAAP and US GAAP since these differences resulted in recording an increase to expense and a corresponding increase to contributed capital.
2 Shareholders’ funds/(deficit) was not affected by the differences between UK GAAP and US GAAP on these options as the difference resulted in recording an increase to expense and a corresponding increase to contributed capital, except for awards granted to employees where the Company will pay a cash bonus forthe difference between the fair value and the base price of the awards.
Principal Group companies
Regus plc Annual report and accounts 2000 53
Country of % of equity Name of Group entity incorporation and votes held
Regus Business Centre SA Argentina 100Regus Centres Pty Ltd Australia 100Regus Business Centre GmbH Austria 100Regus Business Centre SA Belgium 100Stephanie Square Business Centre SA Belgium 100Regus do Brasil Ltda Brazil 100Regus Business Centre Ltd Canada 100Regus Business Centre Chile Ltda Chile 100Regus Business Service Co Ltd China 95Regus Business Services (Shanghai) Ltd China 100Regus Colombia Ltda Colombia 100Regus Business Centre s.r.o Czech Republic 100Regus Copenhagen Aps Denmark 100Regus Business Centre (Egypt) Egypt 100FoRe Business Centres Ltd ††† England 50Host Regus Ltd England 100Park Business Centres Ltd ††† England 50Regus Business Centres (Holdings) Ltd * England 100Regus Business Centres (UK) Ltd England 100Regus Business Centre Trading Ltd † England 100Regus City Ltd England 100Regus Management Limited England 100Regus (UK) Ltd England 100Regus Finland Oy Finland 100Regus Paris SA France 100Regus Roissy SA France 100Regus Business Centre GmbH Germany 100Regus Hellas SA Greece 100Regus Business Centre Ltd Hong Kong 100Regus Central Europe Trading and Servicing Ltd Hungary 100Regus Kft Hungary 100Europa Business Centre Ltd Ireland 100Regus Finance Ireland 100Regus Franchise International Ltd Ireland 100Regus Ireland Ltd Ireland 100Regus Business Centres Ltd Israel 100Regus Business Centre Srl Italy 100Regus Milano Centrale Business Centre S.p.A †† Italy 65Regus Japan KK Japan 100Regus Korea Limited Korea 100SIA Regus Business Centre Latvia 100Regus Luxembourg SA Luxembourg 100Regus Centres Sdn Bhd Malaysia 100Regus Business Centre SA de CV Mexico 100Regus Services SA de CV Mexico 100Regus Maroc SARL Morocco 100Regus Amsterdam BV Netherlands 100Regus Business Centre BV Netherlands 100Regus International Holdings BV †† Netherlands 60Regus Business Centre Oslo AS Norway 100Regus Business Centre (Panama) SA Panama 100Regus Business Centre (Peru) SA Peru 100Regus Centres Inc Philippines 100Regus Business Centre SP zoo Poland 100
Principal Group companies continued
54 Regus plc Annual report and accounts 2000
Country of % of equity Name of Group entity incorporation and votes held
Regus Business Centre Lda Portugal 100Regus Business Centre (Romania) SRL Romania 100LLC Regus Business Centre Russia 100Regus Centres Pte Ltd Singapore 100Regus Business Centre Bratislava sro Slovak Republic 100Regus Business Centre SA Spain 100Business Centre Gothenburg AB Sweden 100Business Centre Stockholm AB Sweden 100Regus Business Centre (S) SA Switzerland 100Regus Business Centre (Tanzania) Ltd Tanzania 100Regus Centres (Thailand) Ltd Thailand 100Regus Tunisie SARL Tunisia 100Regus Is Merkezi Isletmeciligi Ltd Sirketi Turkey 100Regus Business Centres (Ukraine) Ukraine 100Regus Business Centre Corp USA 100Regus Crescent Business Centres LLC ††† USA 50Regus Equity Business Centres LLC ††† USA 50Regus Business Centre Venezuela CA Venezuela 100Regus Centre (Vietnam) Ltd Vietnam 100
Investments in Group undertakings are held at cost, all of which are included within the consolidated results. Shares listed aboveare held directly by Regus plc where indicated by an asterisk.
Other than Regus Business Centre BV, Regus Business Centres (Holdings) Ltd and Regus Finance, which are investment holdingcompanies, and Regus Management Limited which is a management company employing head office staff, the principal activity of all other companies is the provision of fully serviced business centres.
A full list of the Group companies will be included in the Company’s annual return.
† Our Azerbaijan business operates as a branch of this company.†† Our South Africa business operates as a branch of this company.††† Joint ventures.
Regus plc Annual report and accounts 2000 55
Shareholder information
Annual General MeetingThe Annual General Meeting will be held at Regus City Point,1 Ropemaker Street, London EC2Y 9HT, at 3.00pm onTuesday 17 April 2001. The full Notice of Meeting and proxycard accompany this report.
RegistrarAdministrative enquiries about the holding of Regus sharesshould be directed in the first instance to the Registrar whoseaddress is:
American Depositary Receipts (ADRs)In the US, the Company’s ordinary shares are traded in theform of American Depositary Receipts, evidenced by ADRs,and are traded under the symbol “REGS” on NASDAQ.
Each ADR represents five ordinary shares in Regus plc.Morgan Guaranty Trust Company of New York is theauthorised Depositary Bank for the Regus ADR Programme.For enquiries on the ADR service please contact ourrepresentatives at:
Morgan Guaranty Trust Company of New YorkPO Box 842006BostonMA 02284-2006USA
Unsolicited mailThe Company is obliged by law to make its share registeravailable to other organisations who may then use it for amailing list. If you wish to limit the receipt of unsolicited mailyou may do so by writing to:
The Mail Preference Service (MPS)Freepost 22London W1E 7EZUnited Kingdom
Tel: +44 (0) 845 703 4599
MPS will then notify the organisations which support itsservice that you do not wish to receive unsolicited mail.
Further informationInformation about Regus may be found on the Reguswebsite at:www.regus.com, or telephone +44 (0) 845 303 3004(international direct dial).
Administration expenses after exceptional items (8.3) (13.1) (29.6) (65.1) (96.4)
Group operating profit/(loss) (5.1) (4.6) (15.2) (48.0) 3.9Share of operating loss in joint ventures – – – (0.1) (1.0)
Total operating profit/(loss): Group andshare of joint ventures (5.1) (4.6) (15.2) (48.1) 2.9Net interest payable and other similar charges (0.6) (1.8) (2.0) (6.8) (6.8)
Loss on ordinary activities before tax (5.7) (6.4) (17.2) (54.9) (3.9)Tax on loss on ordinary activities (0.2) (0.5) (0.8) (1.5) (9.9)
Loss on ordinary activities after tax (5.9) (6.9) (18.0) (56.4) (13.8)Minority interests – – 0.1 – 0.3
Retained loss for the financial period (5.9) (6.9) (17.9) (56.4) (13.5)
Loss per ordinary share:Basic (£) (0.01) (0.02) (0.04) (0.12) (0.03)Diluted (£) (0.01) (0.02) (0.04) (0.12) (0.03)Weighted average number of shares outstanding (thousands) 400,000 400,000 427,729 469,486 497,889
Balance sheet data (at year end):Fixed assets 11.2 24.0 54.7 126.8 244.6Cash 3.5 14.8 48.0 72.1 169.8Total assets 21.6 53.0 142.2 268.3 544.4Other net current liabilities (14.5) (32.7) (59.9) (120.4) (187.9)Creditors: amounts falling due after more than one year (9.8) (22.8) (29.1) (102.4) (23.8)Equity minority interests (0.1) (0.1) (0.2) (0.2) (0.4)Equity shareholders funds/(deficit) (9.5) (16.6) 13.9 (23.7) 203.1
56 Regus plc Annual report and accounts 2000
Financial calendar
Designed and produced by C&FD. Chairman and Board photography by Neil Hurley at Redback. Printed in England by Fernedge.
AGM 17 April 2001
Announcements of quarterly resultsQuarter 1 15 May 2001Quarter 2 14 August 2001Quarter 3 12 November 2001