27
2015 Full Year Results Presentation. 1 st March 2016 © Regus Group Services 2016

2015 Full Year Results Presentation. 1st March 2016
© Regus Group Services 2016

Caution statement. No representations or warranties, express or implied are given in, or in respect of, this presentation or any further
information supplied. In no circumstances, to the fullest extent permitted by law, will the Company, or any of its respective
subsidiaries, shareholders, affiliates, representatives, partners, directors, officers, employees, advisers or agents
(collectively “the Relevant Parties”) be responsible or liable for any direct, indirect or consequential loss or loss of profit
arising from the use of this presentation, its contents (including the management presentations and details on the market),
its omissions, reliance on the information contained herein, or on opinions communicated in relation thereto or otherwise
arising in connection therewith. The presentation is supplied as a guide only, has not been independently verified and does
not purport to contain all the information that you may require.
This presentation may contain forward-looking statements that are based on current expectations or beliefs, as well as
assumptions about future events. Although we believe our expectations, beliefs and assumptions are reasonable, reliance
should not be placed on any such statements because, by their very nature, they are subject to known and unknown risks
and uncertainties and can be affected by other factors that could cause actual results, and our plans and objectives, to differ
materially from those expressed or implied in the forward-looking statements. You are cautioned not to place undue reliance
on any forward-looking statements, which speak only as of the date hereof. The Company undertakes no obligation to revise
or update any forward-looking statement contained within this presentation, regardless of whether those statements are
affected as a result of new information, further events or otherwise.
This presentation, including this disclaimer, shall be governed by and construed in accordance with English law and any
claims or disputes, whether contractual or non-contractual, arising out of, or in connection with, this presentation, including
this disclaimer, shall be subject to the exclusive jurisdiction of the English Courts.
Percentage movements in this presentation are stated at constant currency unless otherwise indicated. Financial results are
stated before non-recurring items unless otherwise indicated.
2

Full Year Financial Highlights.
• Group revenues increased 15.9% to £1,927.0m
• Underlying operating profit up 37% to £144.8m
• Underlying cash generated before net growth investment
increased to £215.7m from £175.6m
• Improved post-tax ROI on pre-12 net investment to 23.1%
• Operating margin increased from 6.2% to 7.5%
• EPS increased 45% from 7.4p to 11.2p
• Full year dividend of 4.5p – an increase of 13%
3

• 23.1% post-tax cash returns
on all locations opened on or
before 31 December 2011
• Recent year group
investments are progressing
well and should achieve
similarly attractive returns
Definition
Post-tax cash return
on net investment =
EBITDA less amortisation of partner contribution
less tax on EBIT, less maintenance capex
Growth capital expenditure less partner contribution
Generating attractive returns.
Post-tax cash return on net investment
-9.3%
-8.1%
11.2%
13.3%
23.0%
4.2%
25
20
15
10
5
0
-5
-10
-15
2013
2012
2011
and before
2014
(9.3%) (8.0%)
11.2%
Return on net investment 2015 Return on net investment 2014
NCO year group
2015
(9.5%)
13.3%
20.9% 23.1%
0.0%
%
4

2015 • Another year of strong revenue growth
• Invested £285m, adding 554 new locations
• 22% growth in locations to 2,768
• Further overhead leverage
• Strong and improving returns
Fast growth trajectory.
2500
2000
1500
1000
500
0
2011 2013 2012 2014
Group revenue
2015
£m
+12.6%*
+9.2%*
+23.2%*
+15.8%*
+15.9%*
* Revenue growth at constant currency
5
Prudence remains our watchword
• We have seen rapid growth but are carefully
watching the global economic climate
• We will continue to apply our strict planning
and processes to the opening of new
locations
2016 • Current pipeline visibility:
• c. £100m net growth capital
• c. 300 locations

6
Exciting opportunities.
Structural change helping drive our
industry across the globe:
• The rise of the sharing economy,
facilitated by technology and
changing work practises
• Companies actively seeking
flexibility and alternative ways to
support their workplace
• Greater awareness of what the
market offers customers

7
Verizon win.
Verizon to transform its real estate
portfolio, with staff moving into multiple
Regus locations across the USA
Deal will:
• Help Verizon to halve operating costs
over the next five years
• Enable Verizon & its staff to work more
flexibly and cost effectively
• Boost employee productivity, morale
and convenience
• Give remote workers access to Regus’
entire network of centres
• Anticipate further similar deals due to
Regus’ global network and our new
simplified Global Agreement

Financial Review.
8

Returns developing as expected.
Post-tax return on net investment
• We continue to make attractive
returns
• Benefiting from operational
leverage and capital efficiency
4.2%
20
10
0
-10
2013
2012
2011
and before
2014
(9.3%) (8.1%)
11.2%
Return on net investment 2015 Return on net investment 2014
NCO year group
2015
(9.5%)
13.3%
20.9% 23.1%
0.0% %
9
15.2%
31.0%
40
30
20
10
0
2013 2012 2011
and before
2015
(1.4%) 1.2%
19.6%
29.6% 26.5%
Gross profit margin before interest, tax depreciation and amortisation 2015
Gross profit margin before interest, tax depreciation and amortisation 2014
Gross profit margin*
• 2012, 2013 and 2014 additions
showing continued improvement
• 2015 locations progressing as
planned
2014
34.1% 33.9%
%
*before interest, tax, depreciation and amortisation
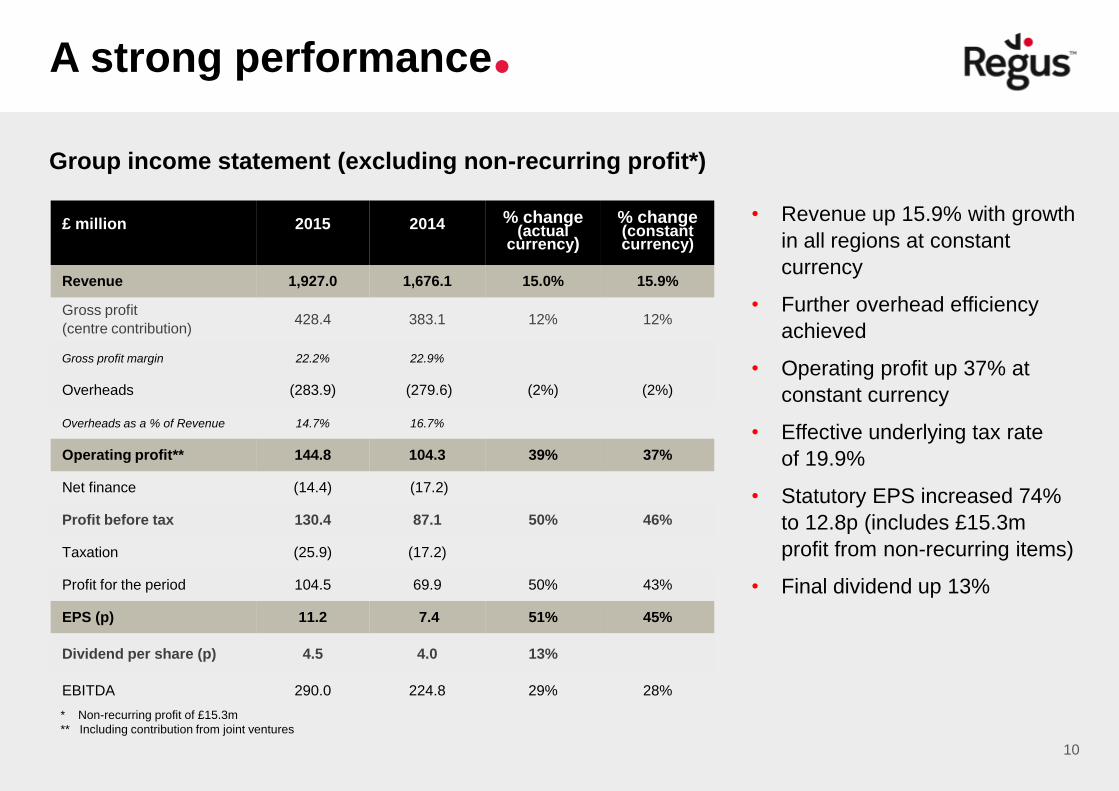
A strong performance.
• Revenue up 15.9% with growth
in all regions at constant
currency
• Further overhead efficiency
achieved
• Operating profit up 37% at
constant currency
• Effective underlying tax rate
of 19.9%
• Statutory EPS increased 74%
to 12.8p (includes £15.3m
profit from non-recurring items)
• Final dividend up 13%
£ million
2015
2014
% change (actual
currency)
% change (constant currency)
Revenue 1,927.0 1,676.1 15.0% 15.9%
Gross profit
(centre contribution) 428.4 383.1 12% 12%
Gross profit margin 22.2% 22.9%
Overheads (283.9) (279.6) (2%) (2%)
Overheads as a % of Revenue 14.7% 16.7%
Operating profit** 144.8 104.3 39% 37%
Net finance (14.4) (17.2)
Profit before tax 130.4 87.1 50% 46%
Taxation (25.9) (17.2)
Profit for the period 104.5 69.9 50% 43%
EPS (p) 11.2 7.4 51% 45%
Dividend per share (p) 4.5 4.0 13%
EBITDA 290.0 224.8 29% 28%
Group income statement (excluding non-recurring profit*)
* Non-recurring profit of £15.3m
** Including contribution from joint ventures
10

11
Mature centre* performance: by geography.
Revenue Revenue Growth at
Actual Currency
Revenue Growth at
Constant Currency Contribution
Mature Gross
Margin (%)
£m 2015 2014 2015 2014 2015 2014
Americas 712.1 660.1 7.9% 3.9% 189.0 157.3 26.5% 23.8%
EMEA 321.2 341.0 (5.8)% 5.5% 89.6 83.2 27.9% 24.4%
Asia Pacific 239.1 230.6 3.7% 3.9% 68.7 64.9 28.7% 28.1%
UK 352.9 340.2 3.7% 3.7% 86.8 81.0 24.6% 23.8%
Other 2.9 0.6 1.0 0.2
Total 1,628.2 1,572.5 3.5% 4.3% 435.1 386.6 26.7% 24.6%
* Mature centres open on or before 31 December 2013
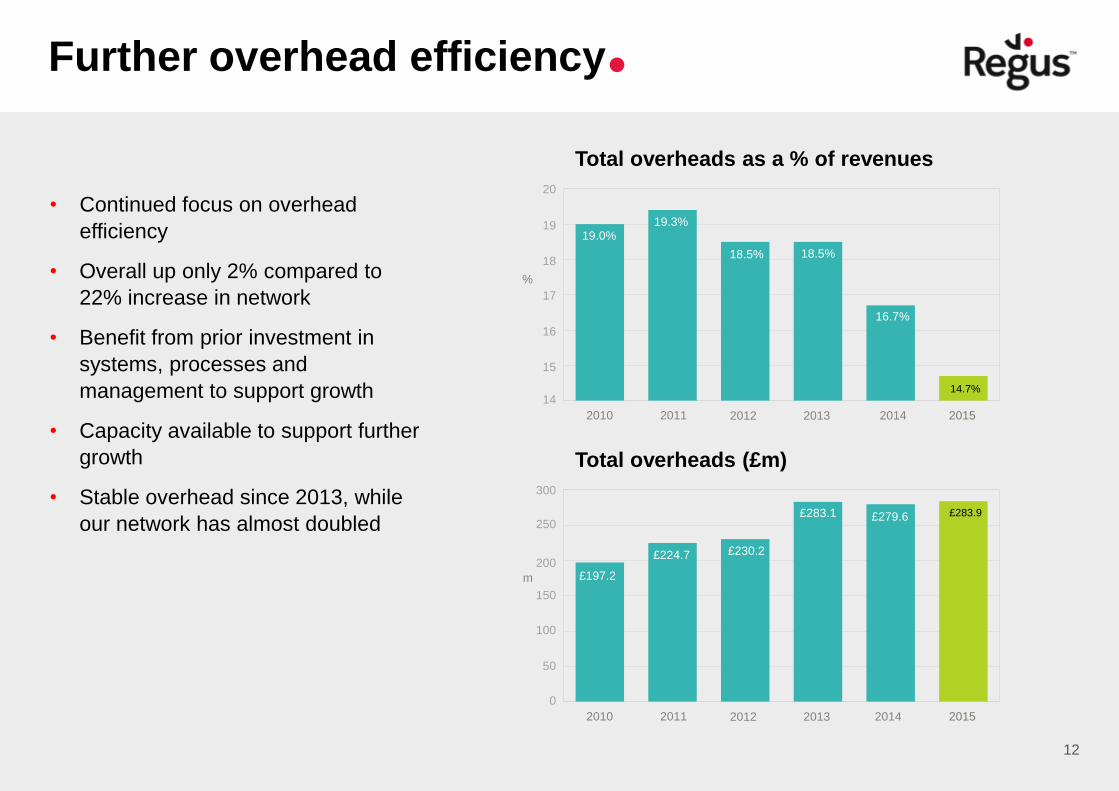
Total overheads as a % of revenues
• Continued focus on overhead
efficiency
• Overall up only 2% compared to
22% increase in network
• Benefit from prior investment in
systems, processes and
management to support growth
• Capacity available to support further
growth
• Stable overhead since 2013, while
our network has almost doubled
12
14.7%
19.0% 19.3%
18.5% 18.5%
16.7%
19
%
2011 2012 2014
2013 2010 2015
18
17
16
15
20
14
Total overheads (£m)
£283.9
£197.2
£224.7 £230.2
£283.1 £279.6 250
m
2011 2012 2014
2013 2010 2015
200
150
100
50
300
0
Further overhead efficiency.

13
Improved field structure.
Two important changes to local sales structure:
• New ‘cluster’ location management:
• higher productivity
• cost efficiencies
• sharper focus on broader offering
• Revised compensation basis:
• move away from sales commissions
• quarterly profit share bonus scheme

£ million 2015 2014
Group EBITDA 290.0 224.8
Working capital 103.5 80.3
Less growth related partner contributions (59.8) (47.0)
Maintenance capital (74.9) (53.8)
Taxation (29.1) (20.9)
Finance costs (13.2) (13.5)
Other items (0.8) 5.7
Underlying cash flow 215.7 175.6
Disposal proceeds after costs 80.0 -
Cash flow before growth expenditure 295.7 175.6
Underlying cash flow before net growth
capital expenditure (£m)
97.7
115.4
175.6
2011 2012 2014 2013
250
200
150
100
50
0
112.4
2015
215.7
Strong cash flow.
14
• Group EBITDA increased by 28%
at constant currency
• Cash generated before net growth
investment and disposal proceeds increased
to £215.7m, or 23.1p per share
• Sale of property portfolios for
£80m

0
100
200
300
400
500
600
£ million 2015 2014
Cash flow before growth expenditure 295.7 175.6
Net growth capital expenditure (284.9) (206.6)
Total net cash flow from operations 10.8 (31.0)
£ million 2015 2014
Total net cash flow from operations 10.8 (31.0)
Corporate finance / Share repurchase (32.0) (17.3)
Dividends (38.8) (35.4)
Opening net debt (138.0) (57.2)
Exchange movements 7.4 2.9
Closing net debt (190.6) (138.0)
Net Debt : EBITDA ratio 0.66x 0.61x
A healthy balance sheet.
15
Balance Sheet
• Maintained prudent approach to balance
sheet management
• Net debt to Group EBITDA ratio broadly
maintained at 0.66x
• Intention remains to maintain target
ratio of less than 1.5x
Financial Headroom
• Extended maturity of £320m Revolving
Credit Facility, now committed until 2020
• Total available funding of £474m
with improved maturity profile
Maturity profile 31 December 2015
Bank Facility Schuldschein
2014 2015 2016 2017 2018 2019 2020
£m

Financial summary.
16
• A strong set of financial results
• Continued to deliver attractive post-tax
cash returns
• Significant growth in profitability
reflecting underlying progress in the
business and economies of scale
• Maintained a prudent balance sheet
with improved maturity profile of
funding and significant available
headroom
• Increased the dividend 13%

Strategic update and outlook.
17

Key drivers of the industry
External factors enabling change Forces driving demand
The market opportunity.
2,768 locations
106 countries
977 cities
9,290 colleagues
18

19
Global
Corporate
SME
Sole Trader
Global integrator. Making work more efficient.
Real Estate
Owners
Office
Retail
Infrastructure
Owners
Community
Infrastructure
Corporate
owners and
renters’
own space
Regus - Partner of choice.
The principles that drive our business
1. Investment in products
and innovation
2. Detailed planning to
deliver growth
3. Range of partnering
options
4. Rigorous management
of the business

20
1. Investment in products and innovation: formats. Meeting demand: Delivering growth
• Flexibility
• Consistency
• Flexibility
• Inspiration
• Business support
• Inspiration
• Exclusivity
• Privacy
• Value
• Ease
• Convenience
• Professionalism
• Support
• Professionalism
• Community
• Creative workstyle
• Connections
• Funding
• Luxury
• Status
• Functional
• Convenience
• Productivity
• Mobility

21
Regus app
• The world of flexible working in
the palm of your hand
• Search for locations, check
availability and make bookings
on the move
Marketplace
• An online trading platform that
allows customers to promote
services to each other, as well as
giving them access to specially
curated offers from partners around
the world
Access control
• Cloud based electronic access
control that simplifies lock and key
administration while providing
customers with improved control
over their workspace
1. Investment in products and innovation: innovation.

20,000
15,000
10,000
5,000
0
2015
Growth potential
Source: Company reports and presentations
22
2. Detailed planning to deliver growth.
• Detailed and comprehensive
country plans
• Investment in strong local
management to deliver these plans
• Exciting growth market, with
significant customer demand
• Potential for 20,000+ Regus
locations
• Pace of investment will be driven
by ability to generate strong returns
A clear strategy to deliver profitable growth
>36,000 restaurants
119 countries
Benchmarks
>21,000 locations
65 countries

23
3. Range of partnering options.
Intelligent use of different partnering
methods dependent on geographic
demographics and inherent risks to
develop our national networks
Occasionally and tactically, property
purchases will also make sense

• Continued drive to improve
overall rigour and efficiency in
the business
• Strong risk management
• Investing in key management
• Improving software & systems
• Further improvement in
operating model e.g. clustering
• Improving customer service
24
4. Rigorous management of the business.

Outlook & summary.
• Successful 2015:
• Improved returns on investment
• Significant operating leverage
• Strong cash flow
• Outlook for 2016
• Healthy growth
• Well placed to take advantage
of structural changes in the
world of work
• Mindful of global economic
uncertainty
• Current trading in line with our
expectations
25

Questions.
26

Wayne Gerry
Group Investor Relations Director
+44 (0) 7584 376533
27
Contact details.


