Report on the Audited Financial Status, Results of Operations, and Cash Flows for the Quarter ended March 31, 2007 Reliance Communications Limited Registered office: H Block, 1 st Floor, Dhirubhai Ambani Knowledge City, Navi Mumbai - 400710 April 30, 2007
Transcript
Report on the Audited Financial Status, Results of Operations, and Cash Flows for the Quarter ended March 31, 2007
Reliance Communications Limited Registered office: H Block, 1st Floor, Dhirubhai Ambani Knowledge City, Navi Mumbai - 400710
April 30, 2007
Page 2 of 32
Supplemental Disclosures
Safe Harbour: Some information in this report may contain forward-looking statements. We have based these forward-looking statements on our current beliefs, expectations, and intentions as to facts, actions and events that will or may occur in the future. Such statements generally are identified by forward-looking words such as “believe”, “plan”, “anticipate”, “continue”, “estimate”, “expect”, “may”, “will” or other similar words.
A forward-looking statement may include a statement of the assumptions or bases underlying the forward-looking statement. We have chosen these assumptions or bases in good faith, and we believe that they are reasonable in all material respects. However, we caution you that forward-looking statements and assumed facts or bases almost always vary from actual results, and the differences between the results implied by the forward-looking statements and assumed facts or bases and the actual results could be material depending on the circumstances. You should also keep in mind that any forward-looking statement made by us in this report or elsewhere speaks only of the date on which we made it. New risks and uncertainties come up from time to time, and it is impossible for us to predict these events or how they may affect us. We have no duty to, and do not intend to, update or revise the forward-looking statements in this report after the date hereof. In light of these risks and uncertainties, any forward-looking statement made in this report or elsewhere may or may not occur and has to be read and understood along with this supplemental disclosure.
General Risk: Investments in equity and equity-related securities involve a degree of risk and investors should not invest in the equity shares of the Company unless they can afford to take the risk of losing their investment. For taking an investment decision, investors must rely on their own examination of the Company including the risks involved.
Convenience Translation: All references in this report to “Rs” are to Indian Rupees and all references herein to “US$” are to United States Dollars.
We publish our financial statements in India Rupees, the legal currency of the Republic of India. All amounts translated into United States Dollars in this report are provided solely for the convenience of the reader, and no representation is made that the Indian Rupee or United States Dollar amounts referred to herein could have been or could be converted into United States Dollars or Indian Rupees respectively, as the case may be, at any particular rate, the rates stated in this report, or at all.
Others: In this report, the terms “we”, “us”, “our”, “the Company” or “the Group”, unless otherwise specified or the context otherwise implies, refer to Reliance Communications Limited (“Reliance Communications”) and its affiliates, including, inter alia, FLAG Telecom Group Limited (“FLAG”), Reliance Telecom Limited (“RTL”), and Reliance Communications Infrastructure Limited (“RCIL”). Further abbreviations are defined within this report.
Any discrepancies in any table between total and sums of the amounts listed are due to rounding off.
Disclaimer: This communication does not constitute an offer of securities for sale in the United States. Securities may not be sold in the United States absent registration or an exemption from registration under the U.S. Securities Act of 1933, as amended. Any public offering of securities to be made in the United States will be made by means of a prospectus and will contain detailed information about the Company and its management, as well as financial statements.
Reliance Communications Limited (“Reliance Communications” or “the Company”) is India’s largest integrated communications service provider in the private sector with over 30 million individual, enterprise, and carrier customers.
We operate pan-India across the full spectrum of wireless, wireline, and long distance, voice, data, video and internet communication services. We also have an extensive international presence through the provision of long distance voice, data and internet services and submarine cable network infrastructure globally.
As presently constituted, Reliance Communications was formed by the demerger and vesting of the telecommunications undertakings of Reliance Industries Limited (“RIL”). The demerger and vesting became effective on December 21, 2005. Our shares were listed in India on the Bombay Stock Exchange and National Stock Exchange on March 6, 2006 and our Global Depositary Receipts were listed on the Luxembourg Stock Exchange on August 3, 2006.
1.2. Strategic Business Units
The business of Reliance Communications is organized into three strategic customer-facing business units: Wireless, Global, and Broadband. In addition, one of the wholly owned subsidiaries of Reliance Communications is engaged in the marketing and distribution of wireless handsets. Our strategic business units are supported by our fully integrated, state-of-the-art network and operations platform and by the largest retail distribution and customer service facilities of any communications service provider in India.
1.2.1. Wireless
We offer CDMA and GSM based wireless services, including mobile and fixed wireless voice, data, and value added services for individual consumers and enterprises. Our primary brands are Reliance Mobile for the mobile portfolio of services and Reliance Hello for the fixed wireless portfolio of services. Our voice services comprise both local, and national and international long distance calling. Our data services comprise wireless multimedia over the “click, browse, and select” Reliance Mobile World platform, wireless internet access (Reliance Netconnect), and connectivity for devices such as point-of-sale, lottery and ATM terminals. We also offer public calling office (“PCO”) and coin collection box services over our wireless network through independent retail operators of such facilities.
Page 5 of 32
Our presence in the wireless market increased significantly with the commercial launch nationwide of our CDMA based services in mid-2003. Within three years, we have become the largest provider of wireless communication services in the country, as measured by voice and data minutes of use. As at March 31, 2007, we had 28 million wireless customers in aggregate, representing a 17.4% market share of the All-India wireless market. We had the largest in-service base of multimedia-enabled handsets and the largest number of unique users of such services (over 8 million customers). In addition, we are the largest PCO operator in the private sector with over 50% market share.
1.2.2. Global
We offer national and international long distance calling services. We operate this business unit primarily on a wholesale basis, offering carriage and termination to other carriers as well as on an inter segment basis to other business units of Reliance Communications. In overseas markets, we offer a retail virtual calling card service for calls to India (Reliance India Call) and to 200 other international destinations (Reliance Global Call). This service is currently active in the United States, Canada, the United Kingdom, and Australia.
We entered the long distance market in India in mid-2003, and have become the largest carrier of international voice minutes, with a market share of 40% for ILD wholesale inbound. In addition, we have over 1.1 million customers for our Reliance India Call service. Usage of Reliance India Call accounts for 40% of total retail market calls from the United States to India.
We offer national and international (submarine cable) network infrastructure on both an Indefeasible Right of Use (“IRU”) and leased circuit basis, internet bandwidth, and managed services and Global Ethernet to other carriers and enterprises globally. We have global partnerships with carriers such as C&W, Verizon/MCI, Sprint, Deutsche Telekom, and BT for Global VPN and Bi-lateral IPLCs.
We own and operate through FLAG the largest private submarine cable system in the World, directly connecting 40 countries from the East coast of the United States, to Europe, the Middle East, India, South and East Asia, through to Japan. FLAG Global Network provides unique connectivity between the world’s largest telecommunications market in developed countries and the world’s fastest growing telecommunications markets in developing countries.
We are currently extending the FALCON cable system, which directly connects 12 countries in the Middle East, East Africa and the Mediterranean to the rest of the world through the FLAG Global Network. FLAG and FALCON provide unique on-net global connectivity and our long term customers include more than 250 global carriers and more than 400 large enterprises. Through FLAG and FALCON, we are the largest provider of international bandwidth in the Middle East and Asia. Ownership of these assets further allows us to leverage our strengths in the Indian and Global market.
Page 6 of 32
1.2.3. Broadband
We offer the most complete portfolio of enterprise voice, data, video, internet and IT infrastructure services of any operator in India. These services include: national and international private leased circuits, broadband internet access, audio and video conferencing, MPLS-VPN, Centrex, and managed internet data centre (“IDC”) services. We offer unique, value added products and services to large and medium enterprises for their communications, networking, and IT infrastructure needs across the country. We are the clear market leader in the highest growth segments of the market, comprising MPLS-VPN, Centrex, and IDC services.
We launched our enterprise broadband services in the first half of 2005, focusing initially on the top 40 cities in India. In these cities, we are leveraging our existing metro fibre optic networks to establish direct building connectivity on-net. We currently have over 488,600 buildings directly connected to our network and over 620,000 access lines.
Our primary building access technology is metro Ethernet LAN, which offers performance and cost advantages versus other access technologies in areas with high service potential. Our Metro Ethernet LAN technology gives us a significant edge in delivering high bandwidth data services, as compared with all of our competitors who are deploying legacy copper networks. In cities where we are not currently providing wireline direct building connectivity, we have selectively deployed wireless LMDS to access targeted buildings in accordance with our customers requirements.
We have established an enterprise customer base that includes over 800 of the Top 1,000 Indian enterprises and MNCs and are expanding rapidly in the SME segment. We are the market leader in IDC services (Reliance Data Center) with over 50% market share and are also the leading provider of MPLS-VPN and Centrex solutions.
Page 7 of 32
1.3. Network and Operating Facilities
Our CDMA wireless service operates nationwide, while our GSM wireless service operates in 8 licensed service areas (“Circles”) in Eastern and Central India. Our wireless network covers over 8,000 towns across India, providing coverage of over 54% of the population. This is the largest wireless network in India in terms of coverage and capacity. CDMA-2000 1xRTT technology is deployed throughout our CDMA network nationwide, offering bandwidth of 144 Kbps.
Our national inter-city long distance network is the largest next generation network in India, with over 80,000 route kilometres of ducted fibre optic cables. In addition, we have a totally unique asset in over 20,000 route kilometres of ducted fibre optic cables installed in the leading cities in India. The entire inter-city and metro fibre optic backbone network is deployed in a ring and mesh architecture and is MPLS enabled. The Reliance Data Network has over 180 MPLS integrated network nodes. In addition, we have over 200,000 sq. ft. of IDC capacity in multiple locations. Our network operating centre in Navi Mumbai, India, is one of the most advanced in the world. The entire range of our products and services is enabled by streamlined, fully integrated, flow through operating and business support systems. These facilities provide us with by far the most superior platform in India for offering bandwidth intensive, feature rich, converged services and solutions for consumers, enterprises, and carrier customers with virtually limitless scalability.
Our national networks are integrated with our international networks – the 65,000 route kilometres FLAG cable systems, including the recently commissioned 11,500 route kilometres FALCON cable system.
Our consumer and SME offerings are supported by one of the most extensive and powerful distribution networks in India with throughput capacity for 20 million handsets per annum. The backbone of our retail presence is over 1,650 owned and operated Reliance World stores with a presence in over 700 Indian cities. These stores offer customer activation and after sales service and also operate as broadband experience centres offering a range of broadband internet and video conferencing applications. Together with preferred retailers, we have a branded retail presence in over 1,300 towns. Our customer service is further supported by our multi-lingual contact centre facilities, with over 6,000 seats.
Page 8 of 32
1.4. Principal Operating Companies
Reliance Communications Limited is a major operating company and is also the holding company for the other major operating companies in the Group. Reliance Communications provides CDMA-based wireless, wireline, broadband, and long distance services in India and overseas. Its major assets are the CDMA wireless network, transmission networks used in its business, and the contact centres.
FLAG Telecom Group Limited (“FLAG”) is a wholly owned subsidiary of Reliance Communications. FLAG provides international connectivity services and infrastructure. Its major assets are the FLAG Atlantic, FLAG North Asia Loop, FLAG Europe Asia and FALCON submarine cable systems.
Reliance Telecom Limited (“RTL”) and Reliable Internet Services Limited (“RISL”) are wholly owned subsidiaries of Reliance Communications. RTL provides GSM-based wireless services in 7 Circles, while RISL provides GSM-based wireless services in 1 further Circle. RTL and RISL own the GSM wireless networks in their respective Circles.
Reliance Communications Infrastructure Limited (“RCIL”) is a wholly owned subsidiary of Reliance Communications. RCIL provides wireless multimedia (Reliance Mobile World) and internet access (Reliance Netconnect) services to customers of Reliance Communications. It also undertakes wireless handset distribution and marketing and IDC services.
Page 9 of 32
2. Financial Highlights
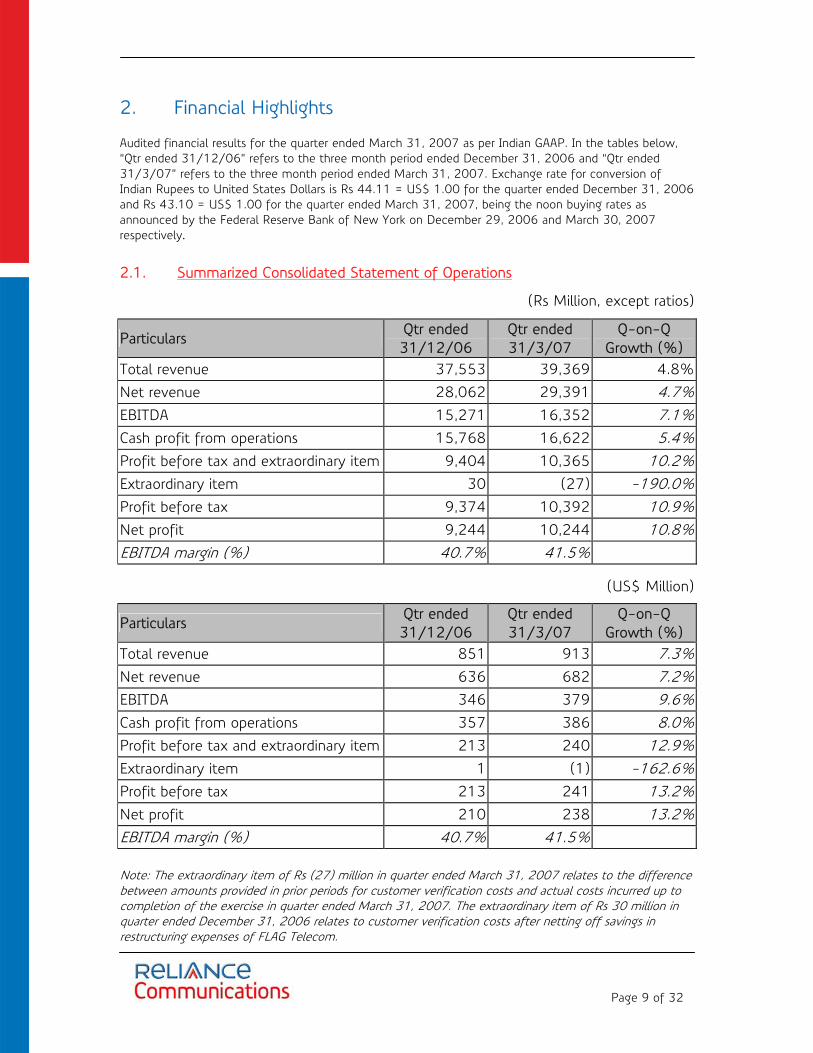
Audited financial results for the quarter ended March 31, 2007 as per Indian GAAP. In the tables below, “Qtr ended 31/12/06” refers to the three month period ended December 31, 2006 and “Qtr ended 31/3/07” refers to the three month period ended March 31, 2007. Exchange rate for conversion of Indian Rupees to United States Dollars is Rs 44.11 = US$ 1.00 for the quarter ended December 31, 2006 and Rs 43.10 = US$ 1.00 for the quarter ended March 31, 2007, being the noon buying rates as announced by the Federal Reserve Bank of New York on December 29, 2006 and March 30, 2007 respectively.
2.1. Summarized Consolidated Statement of Operations
(Rs Million, except ratios)
Particulars Qtr ended 31/12/06
Qtr ended 31/3/07
Q-on-Q Growth (%)
Total revenue 37,553 39,369 4.8% Net revenue 28,062 29,391 4.7% EBITDA 15,271 16,352 7.1% Cash profit from operations 15,768 16,622 5.4% Profit before tax and extraordinary item 9,404 10,365 10.2% Extraordinary item 30 (27) -190.0% Profit before tax 9,374 10,392 10.9% Net profit 9,244 10,244 10.8% EBITDA margin (%) 40.7% 41.5%
(US$ Million)
Particulars Qtr ended 31/12/06
Qtr ended 31/3/07
Q-on-Q Growth (%)
Total revenue 851 913 7.3% Net revenue 636 682 7.2% EBITDA 346 379 9.6% Cash profit from operations 357 386 8.0% Profit before tax and extraordinary item 213 240 12.9% Extraordinary item 1 (1) -162.6% Profit before tax 213 241 13.2% Net profit 210 238 13.2% EBITDA margin (%) 40.7% 41.5%
Note: The extraordinary item of Rs (27) million in quarter ended March 31, 2007 relates to the difference between amounts provided in prior periods for customer verification costs and actual costs incurred up to completion of the exercise in quarter ended March 31, 2007. The extraordinary item of Rs 30 million in quarter ended December 31, 2006 relates to customer verification costs after netting off savings in restructuring expenses of FLAG Telecom.
Particulars As at 31/3/07 Assets Net fixed assets, including capital work-in-progress 330,423 Investments 11,925 Current assets, loans and advances 59,063 Total assets 401,411
Liabilities and stockholders equity Total current liabilities and provisions 179,186 Net debt 18,238 Total liabilities 197,424 Stockholders equity 203,928 Minority interest 59 Total liabilities and stockholders equity 401,411
Net debt to annualized EBITDA (x) 0.27 Net debt to stockholders equity (x) 0.08 Book value per equity share (Rs) 113
(US$ Million)
Particulars As at 31/3/07 Assets Net fixed assets, including capital work-in-progress 7,666 Investments 277 Current assets, loans and advances 1,370 Total assets 9,313
Liabilities and stockholders equity Total current liabilities and provisions 4,158 Net debt 423 Total liabilities 4,581 Stockholders equity 4,731 Minority interest 1 Total liabilities and stockholders equity 9,313
Page 11 of 32
2.3. Summarized Statement of Operations by Segment
Gross revenue 3,161 3,299 4.4% Net revenue 2,755 2,825 2.5% EBITDA 1,486 1,611 8.4% EBIT 1,091 1,101 0.9% EBITDA margin (%) 47.0% 48.8% EBIT margin (%) 34.5% 33.4% Note: “Net revenue” in 2.3.1, 2.3.2, and 2.3.3 above represents gross segment revenue less license fees and access charges.
Page 12 of 32
2.3.4. Others
(Rs Million, except ratios)
Particulars Qtr ended 31/12/06
Qtr ended 31/3/07
Q-on-Q Growth (%)
Other income 769 947 23.1% Other expenses 776 790 1.8% EBITDA (7) 158 -2357.1% EBIT (376) (10) -97.3% Note: “Other income” in 2.3.4 above represents revenue earned from operating activities not included in segments (as defined). “Other expenses” in 2.3.4 above represents expenses related to such activities and unallocated corporate expenses. Previous quarter’s figures have been re-grouped, re-arranged, and re-classified wherever necessary.
Page 13 of 32
2.4. Contribution to Revenue by Segment
(Rs Million, except ratios)
Qtr ended 31/12/06 Qtr ended 31/3/07 Segment
Revenue % of Total Revenue % of Total
Wireless 27,520 61% 29,692 63% Global 13,335 30% 12,938 28% Broadband 3,161 7% 3,299 7% Others 769 2% 947 2% Sub Total 44,785 100% 46,876 100% Eliminations (7,232) (7,507) Total 37,553 39,369 Note: “Others” comprises “Other income” as shown in 2.3.4 above.
2.5. Contribution to EBITDA by Segment
(Rs Million, except ratios)
Qtr ended 31/12/06 Qtr ended 31/3/07 Segment
EBITDA % of Total EBITDA % of Total
Wireless 10,293 67% 11,511 70% Global 3,552 23% 3,121 19% Broadband 1,486 10% 1,611 10% Others (7) 0% 158 1% Sub Total 15,324 100% 16,401 100% Eliminations (53) (49) Total 15,271 16,352
Page 14 of 32
2.6. Investment in Projects by Segment
(Rs Million, except ratios)
Cumulative to 31/3/07 Qtr ended 31/3/07 Segment
Rs Million % of Total Rs Million % of Total
Wireless 192,050 58% 9,860 62% Global 87,640 27% 3,330 21% Broadband 31,760 10% 2,240 14% Others 15,239 5% 510 3% Total 326,689 100% 15,940 100% Note: Investment in projects comprises gross fixed assets, intangible assets, capital work-in-progress, and unamortized one time entry fee paid. The categories of assets allocated to each segment are set out in Section 5.
Page 15 of 32
3. Key Performance Indicators
The financial figures used for computing ARPU, RPM, SMS revenue, non-voice revenue, and ARPL are based on Indian GAAP. Data used for computing wireless market share is derived from reports published by industry associations. Although we believe that such data is reliable, it has not been independently verified. Definitions of terms are set out in Section 7 “Qtr ended 31/12/06” refers to the three month period ended December 31, 2006; “Qtr ended 31/3/07” refers to the three month period ended March 31, 2007. 3.1. Wireless
Metric Unit Qtr ended 31/12/06
Qtr ended 31/3/07
Circles operational Nos 23 23
Wireless customers Nos 29,980,102 28,007,333
GSM Wireless Nos 3,640,810 3,387,254
CDMA Wireless Nos 26,339,292 24,620,079
Wireless market share (All-India) % 20.5% 17.4%
Wireless net adds Nos 4,000,770 -1,972,769
Market share – wireless net adds* % 20.2% 17.6%
Pre-paid % of total wireless customers % 82.9% 84.7%
Pre-paid % of wireless net adds* % 92.3% 96.3%
Wireless ARPU* Rs/Sub 328 377
Wireless net ARPU* Rs/Sub 230 263
Wireless churn % 1.8% NM
Wireless minutes of use (MoU) Bn Mins 38.1 42.5
Wireless MoU per customer/month* Min/Sub 454 541
Wireless revenue per minute (RPM) Rs/Min 0.72 0.70
SMS revenue (% of ARPU) % 1.7% 1.7%
Non-voice revenue (% of ARPU) % 6.3% 6.3%
* Excludes the 5.58 million subscribers deactivated due to re-verification requirements. Such customers were barred from the early part of the quarter ended March 31, 2007.
Page 16 of 32
3.2. Global
Metric Unit Qtr ended 31/12/06
Qtr ended 31/3/07
Total ILD minutes Mn Mins 1,472 1,503
Total NLD minutes Mn Mins 4,715 4,873
Note: Definition of ILD minutes includes transit minutes and global calling card minutes. Definition of NLD minutes includes carriage of all ILD minutes originating or terminating in India. 3.3. Broadband
Metric Unit Qtr ended 31/12/06
Qtr ended 31/3/07
Circles operational Nos 18 18
Towns active (wireline only) Nos 30 40
Access lines Nos 530,000 620,000
Access line net adds Nos 106,000 90,000
ARPL Rs/line 2,206 1,932
Buildings directly connected Nos 379,141 488,661
Page 17 of 32
4. Basis of Presentation of Financial Statements
4.1. Reporting Periods
The financial year end of Reliance Communications Limited is March 31. Each financial year (“FY”) is referred to by the calendar year in which the particular financial year end occurs.
The financial year end of the Company was previously December 31. In respect of the year ended December 31, 2005, the financial year was a 9 month period commencing April 1, 2005 and ended December 31, 2005. In respect of the financial year ended March 31, 2007, the financial year was a 15 month period commencing January 1, 2006.
4.2. Consolidated and Segment Financial Results
4.2.1. Revenues Revenues of the Company have been reported in the following manner:
Consolidated Revenues and Segment Gross Revenues
Consolidated revenues of the Company have been classified as “Services and Sales” revenue. This represents revenues earned from the provision of services and from the sale of network infrastructure on an IRU basis. Services and Sales revenue excludes revenue from the sale of equipment as described in Section 4.2.4 below. For the purposes of business segment reporting, revenues have been classified under three segments namely “Wireless”, “Global”, and “Broadband”. The lines of business included in each segment and the basis of segment revenue reporting is described in Section 4.3 below. Revenue earned from operating activities not included in these segments (as defined) is shown as “Other Income” under “Others” in the segment analysis.
Elimination of Inter Segment Revenues
Revenues for each business segment are reported at gross level where inter segment revenue is also included. Hence, revenue of one segment, from inter segment source, is reported as the expense of the related segment. Elimination takes place in determining consolidated revenues for the Company.
For the purpose of determining transfer pricing between segments, open market wholesale rates for comparable services or, where applicable, rates stipulated by the regulatory authorities have been adopted.
Page 18 of 32
4.2.2. Net Revenues by Segment
“Net Revenues” represent revenues earned less direct variable operating expenses in the nature of: (1) access deficit charges (ADC), revenue share (including levies for Universal Service Obligation), and spectrum fees (referred to collectively as “License Fees”); and (2) charges for access, carriage, interconnection, and termination (referred to collectively as “Access Charges”).
Expenses included under License Fees are currently incurred as a percentage of adjusted gross revenue. Expenses included under Access Charges, including ADC, are currently incurred either at rates stipulated by the regulatory authorities on the basis of percentage of adjusted gross revenue, or on the basis of fixed or ceiling cost per minute, or are determined by commercial negotiation with other carriers and between our business segments, as appropriate. License Fees and Access Charges are disclosed in aggregate as part of the classification of “Operating Expenses” in the consolidated statement of operations. Net Revenues are reported for each business segment. 4.2.3. Operating Expenses
Operating expenses of the Company have been reported in the following manner:
Consolidated and Segment Gross Operating Expenses
Consolidated operating expenses of the Company have been classified under four categories of costs, namely “License Fees and Access Charges”, “Network Operations”, “Employees”, and “Selling, General, & Administrative”.
Elimination of Inter Segment Expenses
Principles, as stated in 4.2.1 (b) above, have been followed for reporting gross operating expenses of each segment and elimination of such expenses in determining consolidated EBITDA for the Company.
4.2.4. Equipment Sales (Net of Costs)
The Company is engaged in the marketing and distribution of end user telecom equipment, predominantly consisting of wireless handsets and accessories. This activity is carried out as part of our overall strategy for the wireless business.
Equipment sales, net of costs related to such equipment, are grouped in “SG&A” under “Operating Expenses” in the consolidated results of operations.
Equipment sales, net of costs, are grouped in “Other Expenses” under “Others” for the purposes of segment reporting.
Page 19 of 32
4.3. Composition of Segments
Financial performance of the Company has been reported under the following three business segments:
Wireless
Global
Broadband
Financial results by segment include all products and services covered by the individual segment as described below. Operating activities not included in the segments (as defined below) are grouped under “Others”.
4.3.1. Wireless
The Wireless segment functions in a retail mode. Wireless services are offered on both CDMA and GSM technology platforms. Wireless services consist mainly of the following:
Mobile services for individuals and corporate customers, including local and long
distance voice, messaging, wireless internet access, wireless multimedia and value added services. Services are offered on both pre-paid and post paid bases.
Fixed wireless phone and terminal services are mainly for residential and SME
customers, including local and long distance voice, messaging, wireless internet access, wireless multimedia, and value added services. Services are offered on both pre-paid and post paid bases.
Public calling offices and coin collection boxes for local and long distance voice
using fixed wireless phones and terminals. Service is provided to independent retail operators of such facilities on a pre-paid basis.
Assets allocated to this business segment include: radio equipment (base trans-receiver stations (BTSs), microwave towers, antennas, mobile switching centers (MSCs), and related electronics, software and systems for operations); intra-city access networks (ducts and optical fiber) other than in 30 Metro cities; utilities, servers, customer premises equipment, and license fees.
Page 20 of 32
4.3.2. Global
The global segment functions in a wholesale mode, except for the provision of virtual calling card services. It provides the following services to the wireless and broadband segments of RCOM on an inter segment basis and to other telecom companies (on a carrier’s carrier basis) and enterprises in India and across the globe:
National inter-circle (NLD) carriage services for voice, data, and internet.
International long distance (ILD) carriage services for voice, data, and internet.
IRUs and leased circuits for international voice and data connectivity through
submarine cable systems, together with cable restoration and maintenance services.
International managed data services, including IP-VPN.
Virtual calling card services provided by overseas operating units in USA, UK and Canada in a retail mode to individual customers.
NLD and ILD assets are allocated to this segment. NLD assets include: transport equipment and electronics; transmission networks (ducts and optical fiber) connecting various Media Convergence Nodes (MCNs) across all circles; buildings, utilities, and license fees. ILD assets include: dedicated ports and switches, electronics, infrastructure at various points of presence and other cable systems not owned and operated by the Company. In addition, the submarine cable systems, cable landing stations, switching equipment for PoPs and associated facilities of FLAG (which includes the FALCON cable system), are included in this segment.
4.3.3. Broadband
All services provided through wireline connections and involving the provision of IT infrastructure are covered under this segment. Services are provided across various customer groups including residential, SMEs, and large corporates. Products and services include the following:
Voice Products: E1 DID, Centrex, PBX trunks, audio conferencing, and fixed line
phones.
Data products: VPN, leased lines, IPLCs, Ethernet, video conferencing, internet data centre (IDC) services (including managed hosting, applications, storage, and disaster recovery), and broadband internet.
Page 21 of 32
Assets allocated to this segment include: in-building wiring and building access networks from building access nodes in all locations where active; intra-city access networks (ducts and optical fiber) in 30 Metro cities; internet data centers; digital loop carriers (DLC), routers, modems and related electronics; customer premises equipment (CPE) and license fees. 4.3.4. Others
Others comprise operating activities not included in the segments as defined above. These activities include retailing (Reliance World), property leasing, investments, and equipment distribution and marketing. As described in Section 4.2.4 above, equipment sales are stated net of costs and grouped under “Other expenses”. Other expenses also include unallocated corporate expenses. Assets shown under Others mainly comprise properties owned by the Company, including the Dhirubhai Ambani Knowledge City, and property and fittings (including electronics for video-conferencing and other digital services) used by Reliance World retail outlets. Note: Previous quarter’s figures have been re-grouped, re-arranged and re-classified wherever necessary.
Page 22 of 32
5. Financial Statements
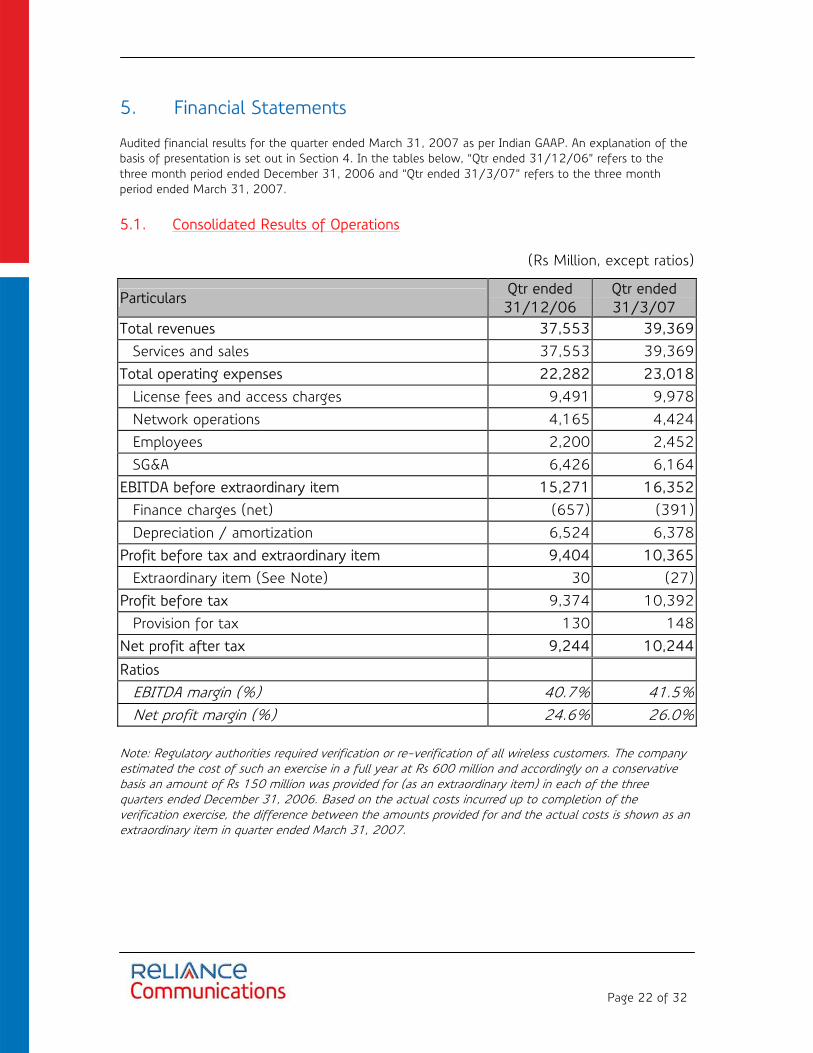
Audited financial results for the quarter ended March 31, 2007 as per Indian GAAP. An explanation of the basis of presentation is set out in Section 4. In the tables below, “Qtr ended 31/12/06” refers to the three month period ended December 31, 2006 and “Qtr ended 31/3/07” refers to the three month period ended March 31, 2007. 5.1. Consolidated Results of Operations
(Rs Million, except ratios)
Particulars Qtr ended 31/12/06
Qtr ended 31/3/07
Total revenues 37,553 39,369 Services and sales 37,553 39,369
Note: Regulatory authorities required verification or re-verification of all wireless customers. The company estimated the cost of such an exercise in a full year at Rs 600 million and accordingly on a conservative basis an amount of Rs 150 million was provided for (as an extraordinary item) in each of the three quarters ended December 31, 2006. Based on the actual costs incurred up to completion of the verification exercise, the difference between the amounts provided for and the actual costs is shown as an extraordinary item in quarter ended March 31, 2007.
Page 23 of 32
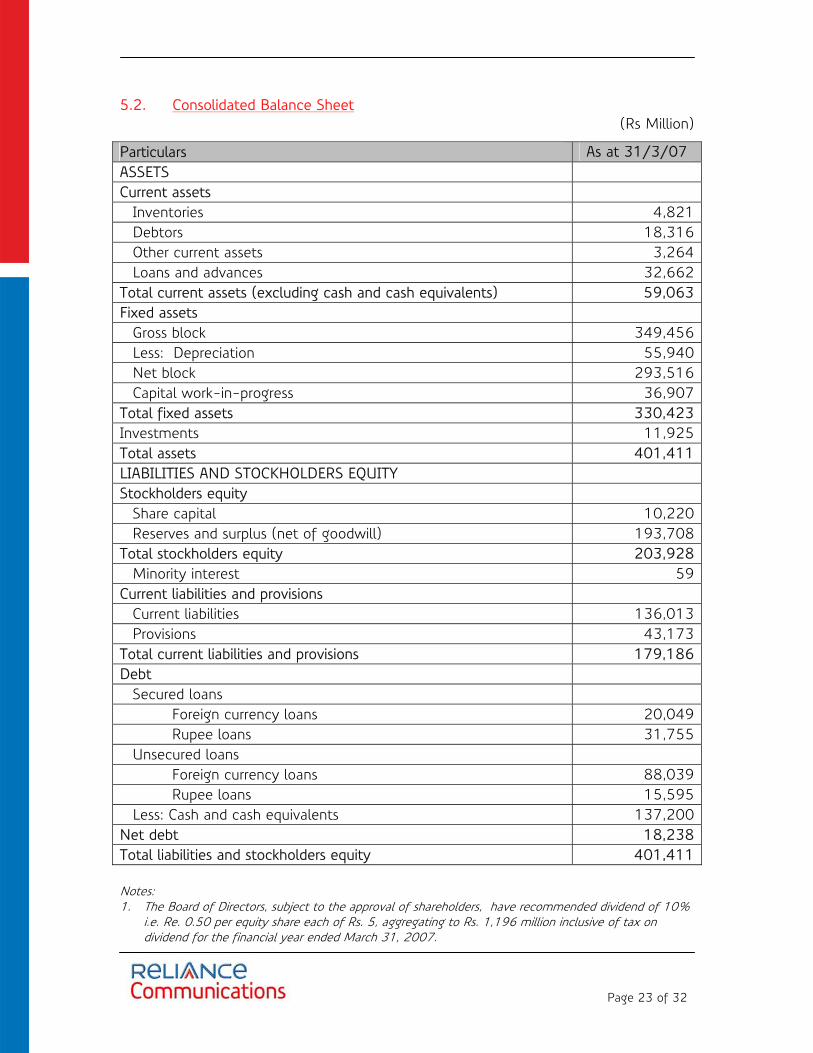
5.2. Consolidated Balance Sheet (Rs Million)
Particulars As at 31/3/07 ASSETS Current assets
Inventories 4,821 Debtors 18,316 Other current assets 3,264 Loans and advances 32,662
Total current assets (excluding cash and cash equivalents) 59,063 Fixed assets
Gross block 349,456 Less: Depreciation 55,940 Net block 293,516 Capital work-in-progress 36,907
Total fixed assets 330,423 Investments 11,925 Total assets 401,411 LIABILITIES AND STOCKHOLDERS EQUITY Stockholders equity
Share capital 10,220 Reserves and surplus (net of goodwill) 193,708
Total stockholders equity 203,928 Minority interest 59
Current liabilities and provisions Current liabilities 136,013 Provisions 43,173
Total current liabilities and provisions 179,186 Debt
Less: Cash and cash equivalents 137,200 Net debt 18,238 Total liabilities and stockholders equity 401,411 Notes: 1. The Board of Directors, subject to the approval of shareholders, have recommended dividend of 10%
i.e. Re. 0.50 per equity share each of Rs. 5, aggregating to Rs. 1,196 million inclusive of tax on dividend for the financial year ended March 31, 2007.
Page 24 of 32
2. The Scheme of Arrangement, approved by shareholders and the Hon’ble Bombay High Court, for the
demerger of the company’s Passive Infrastructure (wireless towers and related infrastructure) to RTIL, a fully owned subsidiary of RCOM, has been implemented. It is expected that the demerger will reduce set-up and operating costs, resulting in cost efficiencies, and providing greater financial flexibility. RCOM will endeavour to unlock significant shareholder value within the next 6 months, through appropriate restructuring of RTIL’s capital structure.
3. The Company has made an allotment of Foreign Currency Convertible Bonds (“FCCB”) of US$ 1,000
million on February 28, 2007 having maturity period of 5 years and 1 day. Each FCCB is convertible in to 1 equity share of the Company at the price of Rs 661.23 per share, representing a premium of 28% to the closing price of the shares on February 5, 207. In the event the FCCBs are fully converted into equity, the equity share capital of the Company would increase by approximately 66.7 million equity shares of Rs 5 each.
Page 25 of 32
5.3. Consolidated Statement of Cash Flows
(Rs Million)
Particulars Qtr ended 31/12/06
Qtr ended 31/3/07
Cash flows from operating activities:
Net profit/(loss) A 9,244 10,244
Add: Non cash/non operating items B 6,304 6,319
Depreciation and amortization 6,524 6,378
Provision for doubtful debts 383 417
Finance charges (net) (657) (391)
(Profit)/loss on sale of assets/investments (106) (208)
Tax expense/(income) 130 151
Extraordinary items 30 (28) Cash generated from operations before working capital changes
A+B 15,548 16,563
(Increase)/decrease in working capital 10,488 (5,396)
Cash generated from operations 26,036 11,167
Tax paid (178) 441 Net cash provided/used by/in operating activities
C 25,858 11,608
Cash flows from investing activities: (Purchase)/sale of property, plant, and equipment
Increase/(decrease) in borrowings (6,800) 36,921 Net cash provided/used by/in financing activities
E (6,800) 36,921
Cash and cash equivalents:
Beginning of the period F 103,082 99,477
End of the period C+D+E+F 99,477 137,200
Note: Previous quarter figures are regrouped and reclassified wherever necessary.
Page 26 of 32
6. Accounting Policies
Set out below are the significant accounting policies to the Unaudited Consolidated Statement of Operations and the Consolidated Statement of Operations and the Consolidated Balance Sheet. 6.1. Principles of Consolidation
The Scheme of Amalgamation and Arrangement (Scheme) for the amalgamation of Reliance Infocomm Limited, Ambani Enterprises Private Limited, Reliance Business Management Private Limited, Formax Commercial Private Limited, Reliance Communications Technologies Limited, Reliance Software Solutions Private Limited, Reliance Communications Solutions Private Limited and Panther Consultants Private Limited (“Transferor Companies”) and demerger of the Network Division of Reliance Communications Infrastructure Limited with the Company, as approved by the High Courts of Bombay and Gujarat became effective from September 12, 2006. In terms of the said Scheme, the Company has allotted 821,484,568 equity shares of Rs 5 each. Upon said allotment, the paid up equity share capital of the Company has increased to Rs 10,223.1 million divided into 2,044,614,990 equity shares of Rs 5 each. Further, as an integral part of the said Scheme, Reliance Communications Infrastructure Limited, Reliance Telecom Limited, Flag Telecom Group Limited and certain other companies became wholly owned subsidiaries of the Company. Consolidation has been carried out in compliance with the applicable Accounting Standards, viz., AS 21 and AS 23, issued by the Institute of Chartered Accountants of India. 6.2. Other Significant Accounting Policies
6.2.1. Basis of Preparation of Financial Statements
The financial statements have been prepared under the historical cost convention in accordance with the generally accepted accounting principles in India and the provisions of the Companies Act, 1956. 6.2.2. Use of Estimates
The presentation of financial statements requires estimates and assumptions to be made that affect the reported amount of assets and liabilities on the date of the financial statements and the reported amount of revenues and expenses during the reporting period. Difference between the actual results and estimates are recognized in the period in which the results are known/materialized.
Page 27 of 32
6.2.3. Fixed Assets
Fixed assets are stated at cost net of CENVAT less accumulated depreciation, amortization and impairment loss, if any. Cost of fixed assets received pursuant to merger of erstwhile Reliance Infocomm Limited and demerger of the Network Division of Reliance Communications Infrastructure Limited in accordance with the Scheme is based on their fair value as on the Appointed Date.
All costs including financing cost until commencement of commercial operations,
net charges of foreign exchange contracts and adjustments arising from exchange rate variations, relating to borrowings attributable to fixed assets, are capitalized.
Expenses incurred relating to projects prior to commencement of commercial
operation are considered as project development expenditure and shown under capital work-in-progress.
In respect of operating leases, rentals are expensed with reference to lease terms
and other considerations in compliance with the provisions of the AS 19 issued by The Institute of Chartered Accountants of India, except for rentals pertaining to the period up to the date of commencement of commercial operations, which are capitalized.
In respect of finance leases, the lower of the fair value of the assets and present
value of the minimum lease rentals is capitalized as fixed assets with corresponding amount shown as liabilities for leased assets in compliance with the provisions of the AS 19 issued by The Institute of Chartered Accountants of India. The principal component in the lease rental in respect of the above is adjusted against liabilities for leased assets and the interest component is recognized as an expense in the year in which the same is incurred except in case of assets used for capital projects where it is capitalized.
Entry fees paid for telecom licenses and indefeasible right of connectivity are stated
at cost for acquiring the same less accumulated amortization. These, being intangible assets, are classified as fixed assets.
Page 28 of 32
6.2.4. Depreciation / Amortization
Depreciation on fixed assets is provided on straight line method at the rates and in the manner prescribed in Schedule XIV to the Companies Act, 1956 except in cases of cable systems, telecom electronic equipment, customer premises equipment and certain other assets for which useful life has been considered based on technical estimation. Depreciation is net of the amount adjusted from Provision for Business Restructuring in accordance with the Scheme.
Depreciation on assets taken on finance lease is provided over the remaining period
of lease from the commencement of commercial operations.
Leasehold land is depreciated over the period of the lease term.
Intangible assets, namely entry fees for telecom licenses and indefeasible right of connectivity are amortized equally over the balance period of licenses or indefeasible rights from the date of commencement of commercial services or acquisition.
The depreciation schedule for various classes of assets is as follows:
Asset Class Period (Years)
Leasehold Land Over the lease period
Building 30 & 60
Plant and Machinery 10-20
Furniture and Fixture 15
Office Equipment 20
Vehicles 10
6.2.5. Impairment of Assets
An asset is treated as impaired when the carrying cost of assets exceeds its recoverable value. An impairment loss is charged to the profit and loss account in the year in which an asset is identified as impaired. The impairment loss recognized in prior accounting periods is reversed if there has been a change in the estimate of recoverable amount. 6.2.6. Investments
Investments are classified into long term and current investments. Investments which are intended to be held for more than one year are classified as long term investments and investments which are intended to be held for less than one year, are classified as current investments.
Page 29 of 32
Current investments are carried at lower of cost and quoted/fair value, computed category wise. Long term investments are stated at cost. Provision for diminution in the value of long term investments is made only if such a decline is other than temporary in the opinion of the management. 6.2.7. Inventories
Inventories are valued at lower of cost or net realizable value. Cost of communication devices and accessories and stores and spares are determined on weighted average basis, or net realizable value whichever is less. 6.2.8. Employee Retirement Benefits
Gratuity and leave encashment liability are provided for based on actuarial valuation done at the year end while Company's contributions towards provident fund and superannuation fund are provided on actual contribution basis in accordance with the related stipulation. 6.2.9. Borrowing Cost
Borrowing costs that are attributable to the acquisition or construction of qualifying assets are capitalized as part of the cost of such assets up to the commencement of commercial operations. A qualifying asset is one that necessarily takes substantial period of time to get ready for intended use. Other borrowing costs are recognized as expense in the year in which they are incurred. 6.2.10. Foreign Currency Transactions
Transactions denominated in foreign currencies are normally recorded at the exchange rates prevailing at the time of the transaction.
Monetary items denominated in foreign currencies at the year end are restated at
year end rates. In case of monetary items, which are covered by forward exchange contracts, the difference between the year end rate and the rate on the date of the contract is recognized as exchange difference and the premium paid on forward contracts has been recognized over the life of the contract.
Non monetary foreign currency items are carried at cost.
Any income or expense on account of exchange difference either on settlement or
on translation is recognized in the profit and loss account, except in cases where they relate to acquisition of fixed assets in which case they are adjusted to the carrying cost of such assets.
Page 30 of 32
6.2.11. Revenue Recognition
Revenue (income) is recognized as and when the services are performed on the basis of actual usage of the Company's network. Revenue on upfront charges for services with lifetime validity and fixed validity periods are recognized over the estimated useful life of subscribers and specified fixed validity period, as appropriate. The estimated useful life is consistent with estimated churn of the subscribers. 6.2.12. Provision for Doubtful Debts
Provision is made in the accounts for doubtful debts in cases where the management considers the debts to be doubtful of recovery. 6.2.13. Miscellaneous Expenditure
Miscellaneous expenses are charged to profit and loss account as and when they are incurred. 6.2.14. Taxes on Income
Provision for income tax is made on the basis of estimated taxable income for the year at current rates. Tax expenses comprise both current tax and deferred tax at the applicable enacted or substantively enacted rates. Current tax represents the amount of income tax payable/recoverable in respect of the taxable income/loss for the reporting period. Deferred tax represents the effect of timing difference between taxable income and accounting income for the reporting period that originate in one period and are capable of reversal in one or more subsequent periods. 6.2.15. Government Grants
Subsidies provided by Government for providing telecom services in rural areas are recognized as operating income. 6.2.16. Provisions, Contingent Liabilities and Contingent Assets
Provisions involving substantial degree of estimation in measurement are recognized when there is a present obligation as a result of past events and it is probable that there will be an outflow of resources. Contingent liabilities are not recognized but are disclosed in the notes. Contingent assets are neither recognized nor disclosed in the financial statements.
Page 31 of 32
7. Glossary
Key Performance Indicators and Financial Terms
Wireless Segment
Wireless market share
Total wireless customers (CDMA Mobile + GSM Mobile + FWP + Wireless PCO), at the end of the relevant period, divided by All-India wireless customers, at the end of the same period. All-India wireless customer numbers are sourced from industry reports.
Market share of wireless net adds
Wireless customer net additions during the relevant period, divided by All-India wireless customer net additions during the same period.
Wireless ARPU Computed by dividing total wireless revenue for the relevant period by average customers; and dividing the result by the number of months in the relevant period.
Wireless net ARPU Computed by dividing net wireless revenue for the relevant period by average customers; and dividing the result by the number of months in the relevant period.
Wireless churn Computed by taking average monthly wireless disconnections divided by average monthly subscriber base in the relevant period. Churn is expressed as a percentage.
Total wireless minutes of use (MoU)
Sum of all incoming and outgoing minutes used on the wireless access network by all customers in aggregate.
Wireless MoU per customer per month
Total wireless MoU divided by average number of wireless customers on the network in the relevant period. The result is expressed as the average per customer per month.
Wireless revenue per minute (RPM)
Wireless ARPU divided by the average wireless MoU per customer per month.
SMS revenue (% of ARPU)
Comprises both charges for customer to customer messaging services and for applications accessed by customers over the SMS platform. SMS revenue is divided by wireless revenue, and expressed as a percentage of ARPU.
Non-voice revenue (% of ARPU)
Comprises SMS revenue, charges for applications accessed by customers over the wireless multimedia platform, wireless internet access services, wireless data, and other value added services. Non-voice revenue is divided by wireless segment revenue, and expressed as a percentage of ARPU.
Page 32 of 32
Global Segment
ILD minutes
Total of incoming and outgoing international long distance minutes carried by the Global business. This includes minutes originating or terminating in India, international transit minutes, and global calling card minutes.
NLD minutes Total of national long distance minutes carried by the Global business. The domestic carriage of all ILD minutes has been included in NLD minutes.
Broadband Segment
Buildings directly connected
The number of buildings directly connected to Reliance Communications's own network (either by wireline, fiber optic, or other fixed access technologies) at the end of the relevant period.
Access lines Number of narrowband and broadband voice and data access lines in use.
ARPL
ARPL (average revenue per line) is computed by dividing total Broadband business revenue by the average number of access lines in use during the relevant period; and dividing the result by the number of months in the relevant period.
Financial Terms
Net revenue
Total revenue less (1) charges for access deficit, USO levy, revenue share and spectrum fees (referred to as “License Fees”) and (2) charges for access, carriage, interconnection and termination (referred to as “Access Charges”).
Cash profit from operations
Is defined as the sum of profit after tax, depreciation and amortization.
Investment in projects Investment in projects comprises net fixed assets, intangible assets, capital work-in-progress, and one time entry fee paid unamortized.