R R R E E E N N N T T T A A A L L L H H H O O O U U U S S S I I I N N N G G G S S S T T T U U U D D D Y Y Y P P P A A A L L L M M M B B B E E E A A A C C C H H H A A A N N N D D D M M M A A A R R R T T T I I I N N N C C C O O O U U U N N N T T T I I I E E E S S S F F F E E E B B B R R R U U U A A A R R R Y Y Y 2 2 2 0 0 0 0 0 0 8 8 8 PREPARED BY THE METROPOLITAN CENTER FLORIDA INTERNATIONAL UNIVERSITY FOR Under the John D. and Catherine T. MacArthur Fund 2007 Rental Housing Initiative
THE METROPOLITAN CENTER FLORIDA INTERNATIONAL UNIVERSITY
FOR
Under the John D. and Catherine T. MacArthur Fund 2007 Rental Housing Initiative
i
CREDITS
The Metropolitan Center at Florida International University:
The Metropolitan Center at Florida International University (FIU) delivers information and expertise to decision makers, community leaders and citizens as they seek to forge solutions to urban problems. The Center is engaged in the study of housing, demographics, economics and politics in South Florida. The overall goal of the Center, as an "applied research" institute, is to provide decision-makers with the best possible information to forge solutions to the problems confronting South Florida’s urban areas. Toward that goal, the Center provides research, training, and technical assistance to governmental and nonprofit institutions in South Florida. Metropolitan Center 150 S.E. 2nd Avenue, Suite 500 Miami, Florida 33131 (305) 349-1251 http://metropolitan.fiu.edu Study Team Ned Murray, Ph.D., AICP, Associate Director, Principal Investigator Dario Moreno, Ph.D., Director Amanda Gorski, Research Associate and Project Manager Oliver Kerr, FAICP, Senior Research Associate Dario Gonzalez, Research Associate Maria Ilcheva, Ph.D (Candidate), Senior Research Associate Victoria Lerma, Research Associate Candy Hurtado, Research Assistant Sub Consultant Civica Consulting Group, Inc
ACKNOWLEDGEMENTS
The Metropolitan Center at Florida International University would like to thank the following organizations and individuals for their assistance and support in producing this report: John D. and Catherine T. MacArthur Fund of the Community Foundation for Palm Beach and Martin Counties
Douglas R. Pugh, Senior Program Officer of the Community Foundation for Palm Beach and Martin Counties.
The Rental Housing Study of Palm Beach and Martin Counties was prepared by the Metropolitan Center at Florida International University (FIU) on behalf of the Community Foundation for Palm Beach and Martin Counties under the John D. and Catherine T. MacArthur Fund 2007 Rental Housing Initiative. The purpose of the Rental Housing Initiative is to analyze the rental housing market in the two-county area and to recommend specific action steps for addressing issues, barriers or problems identified in the housing market research. The Community Foundation for Palm Beach and Martin Counties has identified affordable housing as a critical community issue and is investigating ways by which to address this issue. The Community Foundation seeks to address the issue in a manner which offers the opportunity to provide systemic change in the Foundation’s two-county area. The 2006 Palm Beach County Workforce Housing Needs Assessment prepared for the Housing Leadership Council of Palm Beach County (HLC/PBC) estimated a 2005-2025 future housing demand of approximately 98,000 units, of which 69,060 units or 70 percent would need to be affordable for household earning less than 80 percent of the AMI. The rental inventory of Palm Beach and Martin Counties is the principal source of available housing for low- and moderate-income households. In fact, approximately 60 percent of Palm Beach County’s renter households earn less then 50 percent of the area median income (AMI) and
over 65 percent in Martin County. While the rental inventory is the principal source of available housing for the both County’s lower income households, affordability has become a growing issue. In Palm Beach County 89 percent of renter households earning less than $35,000 per year (47,521 households) are cost burdened (rent payment in excess of 30 percent of monthly gross income). In Martin County 85 percent of renter households (4,231 households) earning less than $35,000 per year are cost burdened. The affordable rental housing conditions in Palm Beach and Martin Counties are exacerbated by a number of factors including near stagnant growth in per capita income, loss of critical rental inventory through condominium conversions, restrictive land use regulations and the lack of production and preservation of rental housing. The conversion of over 16,000 renter units to condominiums Palm Beach and Martin Counties from 2000-2006 created a supply and demand imbalance particularly for low-income households who comprise the vast majority of rental occupied housing. The loss of rental units contributed to increasing rent prices and growing affordability gaps in many municipalities. The rental housing study assessed a range of housing market factors and conditions that impact the supply and demand of affordable rental housing in Palm Beach and Martin Counties. The following highlights the “key findings” from the study:
iii
KEY FINDINGS
1) According to the 2006 U.S. Census American Community Survey, there are 124,518 renter occupied housing units in Palm Beach County and 11,352 renter units in Martin County;
2) Since 2000, the supply of affordable rental housing has diminished, due primarily to the loss of nearly 16,000 rental units to condominium conversions in Palm Beach County and 663 renter units in Martin County;
3) The rental inventory in Palm Beach and Martin Counties is the principal source of available housing for low- and moderate-income households;
4) Approximately 60 percent of Palm Beach County’s and over 65 percent of Martin County’s renter households earn less then 50 percent of the area median income (AMI);
5) In Palm Beach County 89 percent of renter households earning less than $35,000 per year (47,521 households) and 85 percent in Martin County (4,231 households) are cost burdened (paying rent in excess of 30 percent of gross monthly income);
6) Since 2000, the number of renter households that are “extremely” cost burdened (rent payment in excess of 50 percent of monthly gross income) increased from 24,528 to 34,845 (42 percent) in Palm Beach County and from 1,829 to 2,548 (39 percent) in Martin County;
7) Rent affordability gaps are substantial in many municipalities with high concentrations of the resident workforce;
8) Rent prices in the larger (100+ units) multi-family rental complexes are generally less than the average rent due to the fact that many of these properties represent an “older” rental housing inventory;
9) While rental housing is generally more available in Palm Beach and Martin Counties since 2000 (10 percent vacancy rate in both Counties), affordability has diminished significantly;
10) The significant increase in “vacant seasonal” homes in Palm Beach and Martin Counties since 2000 has impacted the availability of rental housing;
11) In recent years affordable rental housing production in Palm Beach and Martin Counties has been limited to Low-Income Housing Tax Credit developments that provide approximately 6,500 assisted rental units in Palm Beach County and approximately 275 units in Martin County;
12) Expiring uses by 2010 will impact 1,016 affordable rental units in Palm Beach County in fourteen (14) rental development complexes;
13) Expiring uses also include more recently funded properties such as Low Income Housing Tax Credit projects that have begun to reach their fifteenth year in service;
14) County/municipal HUD and state funded housing programs primarily focus on subsidized home ownership with little attention given to rental production and preservation;
15) A review of county/municipal Comprehensive Plans and municipal Community Redevelopment Area (CRA) plans determined that little emphasis is given to affordable rental housing production and preservation.
workforce/affordable housing needs. The model was first applied in the Housing Leadership Council of Palm Beach County’s (HLC/PBC) 2007 Palm Beach County Workforce Housing Market Update and Municipal Scorecard. The expectation is that in order for local governments to address the complexities and long-term urgency of workforce/affordable housing issues there is the need to institute a more comprehensive, performance based approach. As such, the study recommends the following action steps to specifically address the affordable rental housing needs of Palm Beach and Martin Counties:
1) Each county and municipality must develop a comprehensive workforce/affordable housing policy that addresses the urgent need of expanding and preserving the inventory of affordable rental housing;
♦♦♦
2) Each county and municipality must coordinate and integrate the workforce/affordable housing planning and policy initiatives set forth in their Comprehensive Plans, HUD Consolidated Plans, State Local Housing Assistance Plans (LHAPs) and Community Redevelopment Plans to specifically address the vital need for affordable rental housing, and to maximize their effectiveness and impact;
♦♦♦
3) Each county and municipality must add a policy provision to the Housing Element of the Comprehensive Plan that all future development will not result in a “net loss” of existing workforce/affordable rental housing for households earning 80 percent or less than the area median income (AMI);
♦♦♦
4) Each county and municipality must provide policies and objectives in the Future Land Use Element of their Comprehensive Plans that enable workforce/affordable rental housing development opportunities, including density relief, expanding multi-family residential districts and reducing parking requirements;
♦♦♦
5) Each county and municipality must provide specific policies and objectives within their HUD Consolidated Plans and State Local Housing Assistance Plans (LHAPs) to address the production and preservation of workforce/affordable rental housing;
♦♦♦
6) Each municipality with a Community Redevelopment Area (CRA) Plan must include policies and strategies for developing a spectrum of housing types and opportunities including mixed-income rental housing;
♦♦♦
v
7) Each county and municipality, as part of the community participation or public hearing process for workforce/affordable housing policies, programs and initiatives, should coordinate with community organizations such as the Housing Leadership Council of Palm Beach County in developing public education strategies for addressing potential NIMBY issues with respect to affordable rental housing;
♦♦♦
8) Each municipality must forge working partnerships with non-profit housing organizations to go beyond the basic requirements of Chapter 166.0451, Florida Statutes, Disposition of Municipal Property for Affordable Housing, and facilitate more aggressive land banking initiatives to accommodate future workforce/affordable rental housing development;
♦♦♦
9) A comprehensive “Rental Housing Preservation Program” initiative is recommended that would include provisions to allow Florida Counties to modify their property appraisal policies and procedures to provide property tax relief to existing and proposed rental housing developments which can document that a majority of occupied housing units are dedicated to households earning 80 percent or less than the area median income (AMI); and
♦♦♦
10) The Rental Housing Study of Palm Beach and Martin Counties identified HUD expiring use multi-family rental properties in Palm Beach County. The Counties and individual municipalities must formulate strategic planning initiatives to preserve this “at-risk” affordable housing. Palm Beach and Martin Counties will need to monitor approaching expirations and assist owners in exploring equitable ways to preserve such low-cost housing and keep it in the affordable rental housing inventory. Preservation methods might include offering economic incentives to current owners to preserve the properties in the affordable rental inventory; acquiring and transferring the properties to owners with an interest in preserving the projects as affordable rental housing; and, providing funding for property rehabilitation and financial stabilization.
vi
TABLE OF CONTENTS I. INTRODUCTION.......................................................................................................................................1
BACKGROUND..................................................................................................................................................... 1 METHODOLOGY AND SCOPE OF STUDY ......................................................................................................... 2 AN ADEQUATE SUPPLY OF AFFORDABLE RENTAL HOUSING..................................................................... 3
II. HOUSING INVENTORY OF PALM BEACH AND MARTIN COUNTIES.................................................4
A. OVERALL HOUSING INVENTORY.................................................................................................................. 4 OVERALL HOUSING UNITS BY STRUCTURE TYPE .......................................................................................................5 AGE AND CONDITION OF THE HOUSING INVENTORY..................................................................................................6 HOUSING OCCUPANCY BY TENURE ..............................................................................................................................7 HOUSING VACANCY RATES............................................................................................................................................7 CONDOMINIUM CONVERSIONS ......................................................................................................................................9
B. RENTAL HOUSING INVENTORY................................................................................................................... 13 RENTAL UNITS BY STRUCTURE TYPE .........................................................................................................................13 CHANGES IN RENTER OCCUPANCY ............................................................................................................................14 MULTIFAMILY RENTAL INVENTORY.............................................................................................................................17 LOW INCOME MULTIFAMILY RENTAL HOUSING.........................................................................................................20 MULTIFAMILY MORTGAGE REVENUE BOND PROGRAM ...........................................................................................20 THE HOUSING CREDIT (HC) PROGRAM .......................................................................................................................21 THE STATE APARTMENT INCENTIVE LOAN PROGRAM.............................................................................................21 HUD EXPIRING USES .....................................................................................................................................................25
III. RENTAL HOUSING SUPPLY AND DEMAND ASSESSMENT............................................................26
A. BACKGROUND ..................................................................................................................................................................26 B. RENTER DEMAND BY HOUSEHOLD COMPOSITION AND INCOME ..............................................................................27 C. LEVEL OF AFFORDABILITY FOR RENTER HOUSEHOLDS ............................................................................................29 D. FUTURE DEMAND .............................................................................................................................................................30
IV. IMPACT OF PUBLIC POLICY, REGULATIONS AND PUBLIC PROGRAMS ON RENTAL HOUSING.....................................................................................................................................................................35
LAND USE POLICIES & REGULATIONS........................................................................................................... 42 PROPERTY TAXES............................................................................................................................................. 44 PERMITTING REQUIREMENTS ......................................................................................................................... 46 CODE ENFORCEMENT ...................................................................................................................................... 47 RENTAL HOUSING PRESERVATION................................................................................................................ 49 LEVERAGING OF FUNDS AND STATE HOUSING RESOURCES.................................................................... 51 LOCAL FUNDING & ECONOMIC INVENTIVES ................................................................................................. 53 LOCAL GOVERNMENT ORGANIZATION & MANAGEMENT CAPACITY........................................................ 54 HUD EXPIRING USES......................................................................................................................................... 55
MAPS PALM BEACH COUNTY MAJOR MULTI-FAMILY RENTAL..………………………………………………………………18
PALM BEACH COUNTY MAJOR RETAIL EMPLOYERS ..…………………………………………………………………34
vii
LIST OF TABLES TABLE 1: PALM BEACH AND MARTIN COUNTY OVERALL HOUSING GROWTH: 2000-2006..................................................4
TABLE 2: PALM BEACH AND MARTIN COUNTIES HOUSING UNITS BY STRUCTURE TYPE: 2000-2006................................5
TABLE 3: AGE OF HOUSING IN PALM BEACH AND MARTIN COUNTY ...................................................................................6
TABLE 4: HOUSEHOLD GROWTH BY TENURE IN PALM BEACH AND MARTIN COUNTIES: 2000-2006 ................................7
TABLE 5: PALM BEACH AND MARTIN COUNTIES OCCUPANCY CHARACTERISTICS: 2000-2006.........................................8
TABLE 6: PALM BEACH AND MARTIN COUNTIES VACANT HOUSING UNITS: 2006 ..............................................................8
TABLE 7: PALM BEACH COUNTY CONDOMINIUM CONVERSIONS 1960-2007 .......................................................................9
TABLE 8: PALM BEACH COUNTY CONDOMINIUM CONVERSIONS BY MUNICIPALITY: 2000-2007 ......................................10
TABLE 9: MARTIN COUNTY CONDOMINIUM CONVERSIONS: 1980-2006..............................................................................11
TABLE 10: MARTIN COUNTY CONDOMINIUM CONVERSIONS BY MUNICIPALITY: 1980-2006 .............................................12
TABLE 11: PALM BEACH AND MARTIN COUNTIES RENTER-OCCUPIED HOUSING UNITS BY STRUCTURE TYPE: 2006...13
TABLE 12: PALM BEACH AND MARTIN COUNTIES HOUSING OCCUPANCY CHARACTERISTICS: 2006 .............................14
TABLE 13: PALM BEACH AND MARTIN COUNTIES RENTER-OCCUPIED HOUSING GROWTH: 2002-2006 ..........................15
TABLE 14: PALM BEACH COUNTY CITIES WITH CONCENTRATIONS OF MULTI-FAMILY RENTAL HOUSING: 2007 ...........17
TABLE 15: PALM BEACH COUNTY MULTI-FAMILY RENTAL COMMUNITY APARTMENTS BY SIZE, BEDROOMS AND AVERAGE RENTS: 2007 .......................................................................................................................................19
TABLE 16: MARTIN COUNTY MULTI-FAMILY RENTAL COMMUNITY (100+ UNITS) BY SIZE, BEDROOMS AND AVERAGE RENTS: 2007 .......................................................................................................................................19
TABLE 17: FLORIDA HOUSING FINANCE CORPORATION MMRB/HC/SAIL AVAILABLE RENTAL PROPERTIES* PALM BEACH COUNTY ..................................................................................................................................................22
TABLE 18: FLORIDA HOUSING FINANCE CORPORATION MMRB/HC/SAIL AVAILABLE RENTAL PROPERTIES* MARTIN COUNTY .................................................................................................................................................24
TABLE 19: HUD EXPIRING USES BY MUNICIPALITY: 2007-2010. ..........................................................................................25
TABLE 20: PALM BEACH AND MARTIN COUNTIES GROSS RENT AS A PERCENTAGE OF HOUSEHOLD INCOME: 2006 ......................................................................................................................................................................27
TABLE 21: PALM BEACH COUNTY AFFORDABILITY GAPS FOR 2 BEDROOM RENTAL APARTMENT BY MUNICIPALITY: 2007 ............................................................................................................................................29
TABLE 22: PALM BEACH AND MARTIN COUNTY’S AFFORDABILITY GAPS FOR 2 BEDROOM RENTAL APARTMENTS AT 50% AND 80% AMI .........................................................................................................................................29
TABLE 23: POPULATION PROJECTIONS GROWTH 2010-2030 PALM BEACH AND MARTIN COUNTIES .............................30
TABLE 24: RENTER OCCUPIED HOUSING UNITS 2010-2030 PROJECTIONS PALM BEACH AND MARTIN COUNTIES .......31
TABLE 25: PALM BEACH AND MARTIN COUNTIES PROJECTED ANNUAL RENTER HOUSING DEMAND BY INCOME CATEGORY: 2000-2025 ........................................................................................................................................32
LIST OF FIGURES FIGURE 1: PALM BEACH AND MARTIN COUNTIES OVERALL HOUSING GROWTH: 2000-2006 .............................................4
FIGURE 2: PALM BEACH AND MARTIN COUNTIES HOUSING UNITS BY STRUCTURE TYPE 2000-2006 ...............................5
FIGURE 3: AGE OF HOUSING IN PALM BEACH AND MARTIN COUNTY: 2006 ........................................................................6
FIGURE 4: PALM BEACH COUNTY CONDOMINIUM CONVERSIONS: 1960-2007. ....................................................................9
FIGURE 5: PALM BEACH COUNTY TOTAL NUMBER OF CONDOMINIUM CONVERSIONS BY MUNICIPALITY: 2000-2007...11
FIGURE 6: MARTIN COUNTY CONDOMINIUM CONVERSIONS: 1980-2006 ............................................................................12
FIGURE 7: PALM BEACH AND MARTIN COUNTIES RENTER-OCCUPIED HOUSING UNITS BY STRUCTURE TYPE: 2006 ...14
FIGURE 8: PALM BEACH AND MARTIN COUNTIES HOUSING OCCUPANCY DISTRIBUTION: 2006 .....................................15
FIGURE 9: PALM BEACH AND MARTIN COUNTIES LOSS IN SHARE OF RENTER-OCCUPIED UNITS: 2000-2006................16
FIGURE 11: PERCENTAGE OF PALM BEACH AND MARTIN COUNTIES’ HOUSEHOLDS PAYING 30 PERCENT OR MORE OF INCOME ON RENT: 2006......................................................................................................................28
FIGURE 12: PROJECTED POPULATION GROWTH 2010-2030, PALM BEACH AND MARTIN COUNTIES ..............................30
FIGURE 13: RENTER OCCUPIED HOUSING UNITS 2010-2030 PROJECTIONS PALM BEACH AND MARTIN COUNTIES ......31
1
I. INTRODUCTION
Background
The Rental Housing Study of Palm Beach and Martin Counties was prepared by the Metropolitan Center at Florida International University (FIU) on behalf of the Community Foundation for Palm Beach and Martin Counties under the John D. and Catherine T. MacArthur Fund 2007 Rental Housing Initiative. The purpose of the Rental Housing Initiative is to analyze the rental housing market in the two-county area and to recommend specific action steps for addressing issues, barriers or problems identified in the housing market research. The Community Foundation for Palm Beach and Martin Counties has identified affordable housing as a critical community issue and is investigating ways by which to address this issue. The Community Foundation seeks to address the issue in a manner which offers the opportunity to provide systemic change in the Foundation’s two-county area. Over the past two years the Metropolitan Center has been actively engaged in assisting local governments and community partnerships address the issue of affordable housing which has now become the foremost public policy issue facing South Florida. The critical demand for affordable rental housing was substantiated in workforce housing studies prepared by the Metropolitan Center in 2006 on behalf of the Housing Leadership Council of Palm Beach County and the Broward Housing Partnership. It became clearly evident, based on an economic base analysis of Palm Beach and Broward Counties, that the household income of the vast majority of South Florida’s workers strictly limits their housing choice to a dwindling supply of
affordable rental housing. The studies further documented that the inventory of affordable rental housing has been greatly diminished due to the rush of condominium conversions in the past few years and limited rental housing production and preservation activity. The Rental Housing Study of Palm Beach and Martin Counties provides a closer analysis of the renter housing market in two relatively different counties with respect to population, density and development philosophies. Despite these obvious differences, their spatial relationship co-joins the two counties in terms of shared economies and residential markets. The South Florida residential building boom that occurred during 2003-2005 substantially impacted the housing markets of Palm Beach, Broward and Miami-Dade Counties. Martin County and St. Lucie County to the north were initially buffered from the unbridled growth and development occurring to the south. However, as housing values began to inflate the Tri-county market, Martin and St. Lucie Counties began to experience the fallout in terms of escalating housing prices. The following rental housing analysis of Palm Beach and Martin Counties is intended to provide a clear understanding of the rental supply and demand factors and conditions that impact the two counties. With this understanding the study then recommends a series of policy and planning actions that can help to preserve and expand the supply of affordable rental housing in the two-county area.
2
Methodology and Scope of Study
The methodology used by the FIU Metropolitan Center in the research and preparation of the Rental Housing Study for Palm Beach and Martin Counties was to assess current rental supply and demand factors and conditions to determine the level to which the local rental market is providing adequate choices and opportunities for households in need of rental housing. The housing demand and supply assessment examines the existing and future rental housing needs of Palm Beach and Martin Counties with respect to household income, affordability and location of the existing inventory. The study includes the following tasks:
♦ Rental Housing Inventory: An inventory of renter housing by type and value for both counties and a GIS database of multi-family projects by location.
♦ Rental Housing Supply and Demand Assessment: An assessment of the key housing supply and demand factors and conditions that impact the availability of affordable rental housing in the two counties.
♦ Impact of Public Policy, Regulations and Public Programs on Rental Housing: An assessment of existing policies, regulations and programs and their impact on the availability of an adequate supply of affordable rental housing in the two counties. The assessment includes best practice case study examples.
♦ Rental Housing Action Plan: Based on the above assessments, a series of rental housing action steps are recommended to preserve and expand the supply of affordable rental housing in the two counties.
3
An Adequate Supply of Affordable Rental Housing
A basic premise of all housing markets is that there must exist a spectrum of housing choice and opportunity for local residents. This axiom establishes that housing choice and needs differ in most communities due to a variety of factors, including: household income, population age, proximity of employment and mere preference. A spectrum of rental housing choice and opportunity is particularly important as rental housing can accommodate an assortment of individual and household needs. First and foremost, an adequate supply of affordable rental housing provides choice and opportunity to working individuals and families with more modest incomes. In addition, rental housing provides a place to live during such life transitions as a job change or a divorce. And, as has been the traditional American way, affordable rental housing enables households to save and eventually purchase a home.
Significant to the housing market of South Florida’s and that of Palm Beach and Martin Counties is the fact that the composition of rental housing demand has been changing markedly in the last decade. In particular, the minority population share of renter households climbed from 37 percent in 1995 to 43 percent in 2005, and is expected to exceed 50 percent by 2015. Minorities comprise the majority of renters in 9 of the nation’s 10 largest metropolitan areas and now account for two out of every three renters in cities like Miami. Of particular significance to Palm Beach and Martin Counties is the fact that much of the increase in the minority renter population is the result of the increase in Hispanic households. Hispanics account for a growing share of all renters with families accounting for 72 percent of Hispanic renter households. 1
The population age composition of rental markets has also been changing nationally as middle-aged, empty nesters have made rental units a preferred option. While retired middle-aged and senior citizens are more apt to locate in suburban locations, working renter households are much more likely to live in cities in closer proximity to job locations and public transportation. Minority renters, in particular,
1 Joint Center for Housing Studies of Harvard University,
(Cambridge, MA. 2007) , America’s Rental Housing, p 1.
remain highly concentrated in cities and close to their workplace or transit.
An understanding of the shifting demands for housing is critical for the creation of effective housing policies and strategies. Surely, the increasing demand for worker housing documented in prior housing studies has magnified the importance of providing a wide spectrum of renter choice and opportunity with respect to affordability and location. The growing need and shifts in demand for rental housing will require that an adequate supply of decent and affordable rental housing is preserved and expanded in both Palm Beach and Martin Counties. The location of existing and new rental production is particularly relevant as proximity to job center and public transportation is vital to a workforce that is principally comprised of low- and moderate-income households. The two counties and individual municipalities will need to explore all policy options to preserve existing rental housing and stimulate in-fill production in strategic locations.
Currently, about one in four households in Martin and Palm Beach Counties live in rental housing. While this figure is lower than the national average (about one in three) it is a substantial share of the total, accounting for 136,000 renter-occupied units in 2006. These homes provide shelter for about 357,000 persons. Many of these are indeed working families with modest incomes, but there are also many higher income families who simply prefer to rent a home. Thus, the Rental Housing Study for Palm Beach and Martin Counties examines these households and the homes that they inhabit with the objective of providing a better understanding of the issues of the availability, quality, location and affordability of these units with a particular emphasis on the cost burdens borne by many renter households in the two county area.
4
II. HOUSING INVENTORY OF PALM BEACH AND MARTIN COUNTIES
A. Overall Housing Inventory
The first step in defining a rental housing inventory is to establish an overall housing inventory that differentiates owner and renter housing by unit count, type, occupancy and condition. In most locations, there will be a changing numerical relationship between the owner and renter inventories that can impact housing availability. In 2006, there were approximately 706,000 total housing units in the two counties with nearly 90 percent of the units located in Palm Beach County. Both counties experienced unprecedented housing growth from 2000 - 2006. Palm Beach County’s
housing inventory increased by 13.4 percent during this period for an annual average gain of 14,000 units. Martin County experienced a 14.4 percent increase in their overall housing inventory gaining approximately 1,600 units annually. Statewide, the comparable 2000-2006 percentage increase was 2.8 percent. Broward County to the south registered a significantly less 7.5 percent gain as the county approached build-out. Clearly, Palm Beach and Martin Counties have experienced among the highest population and housing growth rates in the State of Florida.
Table 1: Palm Beach and Martin County Overall Housing Growth: 2000-2006
Palm Beach Martin
2000 2006 % Growth 2000 2006 %Growth
Total Housing Units 556,428 631,146 13.4% 65,471 74,921 14.4% Source: 2000 U.S. Decennial Census Bureau Data / 2006 American Community Survey, US Census Bureau
Figure 1: Palm Beach and Martin Counties Overall Housing Growth: 2000-2006
13.4%
14.4%
0
100,000
200,000
300,000
400,000
500,000
600,000
700,000
Palm Beach County Martin County
2000 2006
Source: 2000 U.S. Decennial Census Bureau Data / 2006 American Community Survey, US Census Bureau
5
Overall Housing Units by Structure Type
The majority of housing structures in Palm Beach and Martin Counties are single-family homes, detached or attached (Table 2). According to the 2006 U.S. American Community Survey there are currently 343,392 single-family homes (6 percent growth) in Palm Beach County compared to 268,004 multi-family units (26 percent
growth). Mobile homes comprise 19,740 units, but have declined by 4 percent since 2000. There are currently 44,955 single-family homes in Martin County (11 percent growth) compared to 20,515 multi-family units (20 percent growth). Significantly, mobile homes increased by 22 by percent in Martin County since 2000.
Table 2: Palm Beach and Martin Counties Housing Units by Structure Type: 2000-2006
Palm Beach Martin Structure Type
2000 2006 2000 2006
Single-family Units 324,392 343,402 40,591 44,955
Multi-family Units 211,999 268,004 17,114 20,515
Mobile Homes and other 20,637 19,740 7,766 9,451
Total Housing Units 556,428 631,146 65,471 74,921
Source: 2000 U.S. Decennial Census Bureau Data / 2006 American Community Survey
Figure 2: Palm Beach and Martin Counties Housing Units by Structure Type 2000-2006
Palm Beach County, 2006
Mobile Homes
and other
19,740
Multi-family
Units
268,004Single-family
Units
343,402
Martin County, 2006
Single-family
Units
44,955
Multi-family
Units
20,515
Mobile
Homes and
other
9,451
Source: 2000 U.S. Decennial Census Bureau Data / 2006 American Community Survey
6
Age and Condition of the Housing Inventory
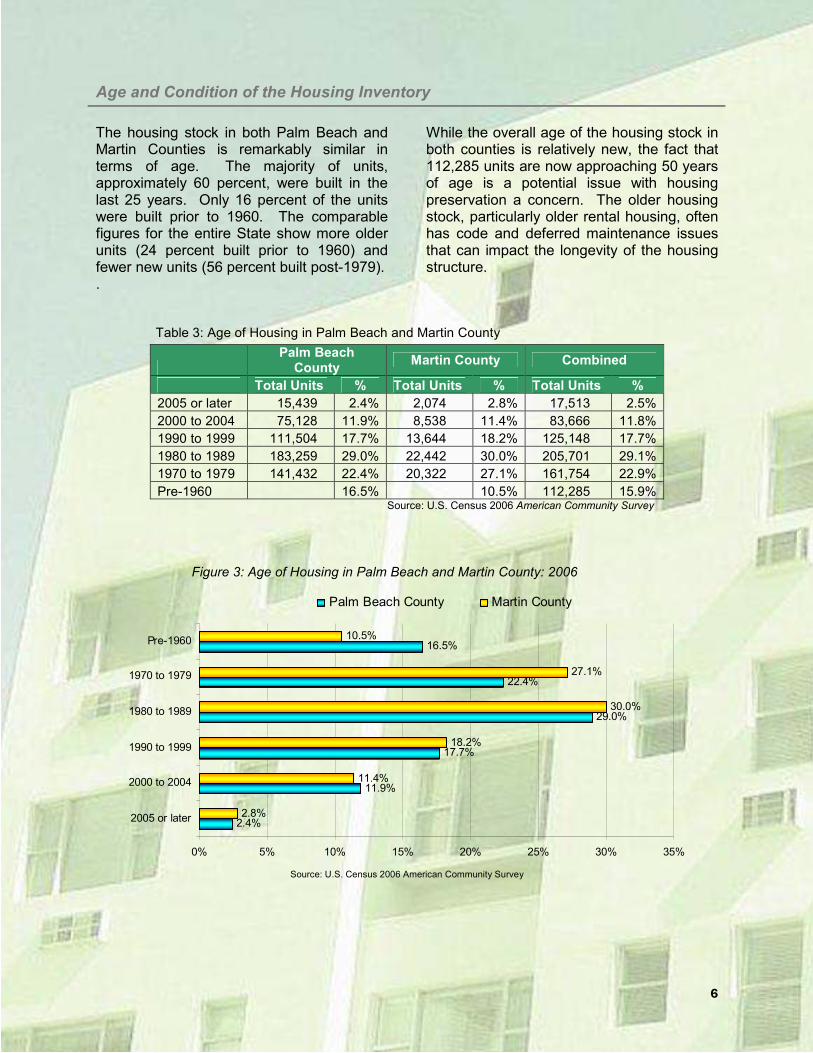
The housing stock in both Palm Beach and Martin Counties is remarkably similar in terms of age. The majority of units, approximately 60 percent, were built in the last 25 years. Only 16 percent of the units were built prior to 1960. The comparable figures for the entire State show more older units (24 percent built prior to 1960) and fewer new units (56 percent built post-1979).
While the overall age of the housing stock in both counties is relatively new, the fact that 112,285 units are now approaching 50 years of age is a potential issue with housing preservation a concern. The older housing stock, particularly older rental housing, often has code and deferred maintenance issues that can impact the longevity of the housing structure.
.
Table 3: Age of Housing in Palm Beach and Martin County
Palm Beach
County Martin County Combined
Total Units % Total Units % Total Units %
2005 or later 15,439 2.4% 2,074 2.8% 17,513 2.5%
2000 to 2004 75,128 11.9% 8,538 11.4% 83,666 11.8%
1990 to 1999 111,504 17.7% 13,644 18.2% 125,148 17.7%
1980 to 1989 183,259 29.0% 22,442 30.0% 205,701 29.1%
1970 to 1979 141,432 22.4% 20,322 27.1% 161,754 22.9%
Pre-1960 16.5% 10.5% 112,285 15.9% Source: U.S. Census 2006 American Community Survey
Figure 3: Age of Housing in Palm Beach and Martin County: 2006
2.4%
11.9%
17.7%
29.0%
22.4%
16.5%
2.8%
11.4%
18.2%
30.0%
27.1%
10.5%
0% 5% 10% 15% 20% 25% 30% 35%
2005 or later
2000 to 2004
1990 to 1999
1980 to 1989
1970 to 1979
Pre-1960
Palm Beach County Martin County
Source: U.S. Census 2006 American Community Survey
7
Housing Occupancy by Tenure
From 2000-2006 Palm Beach and Martin Counties experienced more significant growth in owner-occupied housing units compared to renter-occupied units (Table 4). Owner-occupied units increased by 7.3 percent in Palm Beach County and 5.6 percent in Martin County during this period.
Approximately one in four occupied housing units (76 percent) in Palm Beach and Martin Counties is renter-occupied. There was a marginal 3.6 percent growth in renter-occupied units in Palm Beach County from 2000 to 2006 and a 1.8 percent growth in Martin County.
Table 4: Household Growth by Tenure in Palm Beach and Martin Counties: 2000-2006
Palm Beach Martin 2000 2006 % Growth 2000 2006 %Growth
Occupied housing units 474,175 504,518 6.4% 55,288 57,951 4.8%
Total Housing 556,428 631,146 13.4% 65,471 74,921 14.4% Source: 2000 U.S. Decennial Census Bureau Data / 2006 American Community Survey
Housing Vacancy Rates
Housing vacancy rates in Palm Beach and Martin Counties have significantly increased from 2006-2007. Palm Beach County’s overall vacancy rate increased from 14.8 percent in 2000 to 20.1 percent in 2006. Martin County’s overall vacancy rate increased from 15.6 percent in 2000 to 22.7 percent in 2006. Comparable rates in neighboring Miami-Dade and Broward Counties are much lower, 13 and 14.3 percent, respectively. The high rates in Palm Beach and Martin Counties are
attributed to the large number of homes intended for “seasonal, recreational, or occasional use,” including units that are classified as vacant, but are temporarily occupied by persons with a usual residence elsewhere. Approximately two of every three vacant units are in this category. The homeowner and rental vacancy rates provide a better indication of availability as these include only those vacant units that are offered for sale or rent.
8
Table 5: Palm Beach and Martin Counties Occupancy Characteristics: 2000-2006
2000 2006
Change 2000-2006
Percentage Change
Palm Beach County Total housing units 556,428 631,146 74,718 13.4%
Occupied housing units 474,175 504,518 30,343 6.4%
Vacant housing units 82,253 126,628 44,375 53.9%
For rent, for sale, or rented/sold not occupied 22,628 37,946 15,318 67.7%
Vacant, current residence elsewhere n/a 9,645 n/a n/a
Seasonal, Recreational or Occasional Use 59,625 88,682 29,057 48.7%
Vacancy Rate 14.8% 20.1% 5.3 n/a
Homeowner vacancy rate 2.0% 3.5% 1.5 n/a
Rental vacancy rate 8.7% 9.9% 1.2 n/a
Martin County
Total housing units 65,471 74,921 9,450 14.4%
Occupied housing units 55,288 57,951 2,663 4.8%
Vacant housing units 10,183 16,970 6,787 66.7%
For rent, for sale, or rented/sold not occupied 2,603 4,073 1,470 56.5%
Vacant, current residence elsewhere n/a 1,318 n/a n/a
Seasonal, Recreational or Occasional Use 7,580 12,897 5,317 70.1%
Vacancy Rate 15.6% 22.7% 7.1 n/a
Homeowner vacancy rate 2.3% 5.4% 3.1 n/a
Rental vacancy rate 10.4% 8.6% -1.8 n/a Source: 2000 U.S. Decennial Census Bureau Data / 2006 American Community Survey
Table 6: Palm Beach and Martin Counties Vacant Housing Units: 2006
Palm Beach
County % from Total
Martin County
% from Total
For rent 13,970 11.0% 1,089 6.4%
Rented, not occupied 2,527 2.0% 214 1.3%
For sale only 13,915 11.0% 2,660 15.7%
Sold, not occupied 7,534 5.9% 110 0.6% For seasonal, recreational, or occasional use 67,511 53.3% 10,641 62.7%
For migrant workers 167 0.1% 195 1.1%
Other vacant 21,004 16.6% 2,061 12.1%
Total Vacant 126,628 100.0% 16,970 100.0% Source: 2000 U.S. Decennial Census Bureau Data / 2006 American Community Survey
9
Condominium Conversions
Since 2000 Palm Beach County has lost nearly 16,000 rental units or 10 percent of its overall rental inventory to condominium conversions. The vast majority of the rental units were lost during the residential building boom from 2003-2005. Such transactions call for multi-family rental
properties to be renovated, converted to condominiums, and resold for a profit. The dramatic increase in condominium conversions in recent years has been fueled by the large cash returns to both investors and rental property owners.
Table 7: Palm Beach County Condominium Conversions 1960-2007
Year # of Condo
Conversions Total # of Units
2007 2 8
2006 19 2596
2005 42 8114
2004 17 3130
2003 11 1788
2002 1 22
2001 1 91
2000 1 200
1990-1999 11 207
1980-1989 80 2738
1970-1979 29 1714
Pre 1970 4 153
Source: State of Florida Records
Figure 4: Palm Beach County Condominium Conversions: 1960-2007.
The largest number of condominium conversions in Palm Beach County occurred in the larger municipalities where the highest concentrations of the County’s rental inventory are located. The greatest losses occurred in West Palm Beach (5,542 units), Boynton Beach (2,056 units), Boca Raton (1,617 units), Palm Beach Gardens (1,354 units) and Delray Beach (1,100 units).
Table 8: Palm Beach County Condominium Conversions by Municipality: 2000-2007
Municipality #Conversions #Units
Boca Raton 9 1,617
Boynton Beach 8 2,056
Delray Beach 7 1,110
Green Acres 2 86
Gulf Stream 2 372
Highland Beach 1 200
Hypoluxo 2 620
Juno Beach 1 120
Jupiter 2 653
Lake Park 2 338
Lake Worth 8 610
Lantana 2 81
North Palm Beach 3 88
Palm Beach Gardens 6 1,354
Royal Palm Beach 4 404
South Palm Beach 1 104
Tequesta 1 252
Wellington 8 342
West Palm Beach 25 5,542 Source: State of Florida Records
11
Figure 5: Palm Beach County Total Number of Condominium Conversions by Municipality: 2000-2007
81
86
88
104
120
200
252
338
342
372
404
610
620
653
1,110
1,354
1,617
2,056
5,542
0 1,000 2,000 3,000 4,000 5,000 6,000
Lantana
Green Acres
North Palm Beach
South Palm Beach
Juno Beach
Highland Beach
Tequesta
Lake Park
Wellington
Gulf Stream
Royal Palm Beach
Lake Worth
Hypoluxo
Jupiter
Delray Beach
Palm Beach Gardens
Boca Raton
Boynton Beach
West Palm Beach
# of Units
Source: State of Florida.
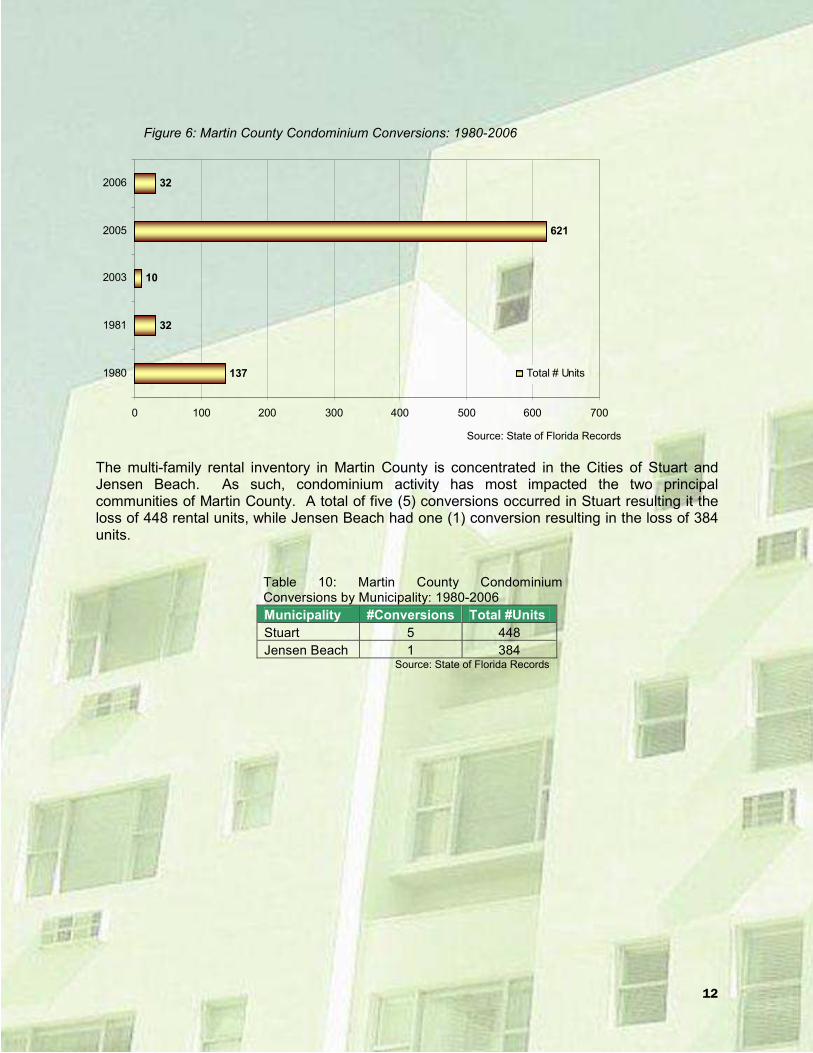
Condominium Conversion activity also impacted Martin County during the height of the South Florida residential building boom. While Martin County has far less multi-family rental housing than Palm Beach County, the loss of 662 rental units (6 percent of the rental inventory) during the 2003-2006 is significant.
Table 9: Martin County Condominium Conversions: 1980-2006
Year #Conversions Total # Units
2006 1 32
2005 2 621
2003 1 10
1981 1 32
1980 1 137 Source: State of Florida Records
12
Figure 6: Martin County Condominium Conversions: 1980-2006
137
32
10
621
32
0 100 200 300 400 500 600 700
1980
1981
2003
2005
2006
Total # Units
Source: State of Florida Records
The multi-family rental inventory in Martin County is concentrated in the Cities of Stuart and Jensen Beach. As such, condominium activity has most impacted the two principal communities of Martin County. A total of five (5) conversions occurred in Stuart resulting it the loss of 448 rental units, while Jensen Beach had one (1) conversion resulting in the loss of 384 units.
Table 10: Martin County Condominium Conversions by Municipality: 1980-2006
Municipality #Conversions Total #Units
Stuart 5 448
Jensen Beach 1 384 Source: State of Florida Records
13
B. Rental Housing Inventory
Rental Units by Structure Type
An analysis of rental units by structure type indicates that single-family detached homes comprise a significant portion of the rental inventory in both counties. Single-family detached structures comprise 19.9 percent of the total inventory in Palm Beach and 26.8 percent in Martin County. However, in both counties multi-family structures consisting of 5-19 units are the more typical rental housing structure. Significantly, mobile homes in Martin County comprise 10.6 percent of the rental inventory.
Table 11: Palm Beach and Martin Counties Renter-Occupied Housing Units by Structure Type: 2006
Structure Type
Palm Beach County
% from Total
Martin County
% from Total
1, detached 24,758 19.9% 3,041 26.8%
1, attached 9,235 7.4% 458 4.0%
2 10,510 8.4% 1,023 9.0%
3 or 4 14,124 11.3% 1,032 9.1%
5 to 9 15,546 12.5% 2,230 19.6%
10 to 19 18,344 14.7% 1,353 11.9%
20 to 49 16,393 13.2% 629 5.5%
50 or more 13,105 10.5% 382 3.4%
Mobile homes 2,503 2.0% 1,204 10.6%
Total 124,518 100.0% 11,352 100.0% Source: 2006 U.S. Census American Community Survey
Renter-occupied single-family housing structures have significantly increased in both Palm Beach and Martin Counties since 2000. In fact, the largest gain in renter-occupied units in Palm Beach County from 2000-2006 is found in single-family structures (3,990 units). Palm Beach County lost renter-occupied units in many of its structure types, including: 50+ unit structures (2,484 units), 5-9 unit structures (450 units) and (1,872 units). These 2000-2006 figures suggest the first hard U.S. Census documentation of the loss of rental-occupied units to condominium conversions. While Martin County also experienced an increase from 2000-2006 in renter-occupied single-family structures (207 units), the
County’s larger gain was in 1-unit attached structures (691 units). Martin County’s renter-occupied units show marginal increases in most structure types with the only significant loss occurring in 50+ unit structures (162 units). The substantial increase in renter-occupied, single-family structures and concomitant loss of multi-family structure types, particularly in Palm Beach County, has significant ramifications in terms of rental affordability. The rent price for single-family homes is generally much higher than rent prices in the existing multi-family housing inventory.
14
Figure 7: Palm Beach and Martin Counties Renter-Occupied Housing Units by Structure Type: 2006
19.9%
7.4%
8.4%
11.3%
12.5%
14.7%
13.2%
10.5%
2.0%
26.8%
4.0%
9.0%
9.1%
19.6%
11.9%
5.5%
3.4%
10.6%
0% 5% 10% 15% 20% 25% 30%
1, detached
1, attached
2
3 or 4
5 to 9
10 to 19
20 to 49 units
50 or more unts
Mobile home
Palm Beach County Martin County
Source: U.S. Census 2006 American Community Survey
Changes in Renter Occupancy
As previously noted, occupancy characteristics for Palm Beach and Martin Counties show that the majority of occupied housing units are owner-occupied. According to the 2006 U.S. Census, owner-occupied units now comprise 60.2 percent of the housing units in Palm Beach County and 62.2 percent of all occupied housing in Martin County (Table 12).
Table 12: Palm Beach and Martin Counties Housing Occupancy Characteristics: 2006
Palm Beach
County Martin County
Total Combined
# of Units
% from Total
Housing
# of Units
% from Total
Housing
Total # of
Units
% from Total
Housing
Occupied housing units 504,518 79.9% 57,951 77.3% 562,470 79.7%
Vacant housing units 126,628 20.1% 16,970 22.7% 143,598 20.3%
Total Housing Units 631,146 100.0% 74,921 100.0% 706,068 100.0% Source: U.S. Census 2006 American Community Survey
15
Figure 8: Palm Beach and Martin Counties Housing Occupancy Distribution: 2006
60.2%
19.7% 20.1%
62.2%
15.2%
22.7%
0%
10%
20%
30%
40%
50%
60%
70%
Owner-occupied Renter-occupied Vacant units
Palm Beach County Martin County
Source: U.S. Census 2006 American Community Survey
Renter-occupied units represent a small share of occupied housing units in Palm Beach and Martin County and this share has begun to decline in recent years. According to the 2000 U.S. Census there were 120,149 housing units occupied by renters in Palm Beach County, accounting for approximately 21.6 percent of all occupied units. In 2006 there were 4,400 more renter units but no corresponding increase in the rental percentage. The lag
in growth compared to owner-occupied units is shown in the declining 19.7 share of renter-occupied housing units from 2000-2006. Martin County, with a much smaller renter housing inventory in 2000 (11,152 occupied units), showed an increase of only 195 units in the six-year period. The renter share of all renter-occupied units declined from 17 to 15.2 percent.
Table 13: Palm Beach and Martin Counties Renter-Occupied Housing Growth: 2002-2006
Palm Beach County
2000
% of 2000 Total
Housing 2006
% of 2006 Total
Housing
2000-2006 % Growth
Renter Occupied 120,151 21.6% 124,518 19.7% 3.6%
Total Housing Units 556,428 631,146 13.4%
Martin County
2000
% of 2000 Total
Housing 2006
% of 2006 Total
Housing
2000-2006 % Growth
Renter Occupied 11,157 17.0% 11,352 15.2% 1.7%
Total Housing Units 65,471 74,921 14.4% Source: 2000 U.S. Decennial Census Bureau Data / 2006 American Community Survey
16
Figure 9: Palm Beach and Martin Counties Loss in Share of Renter-Occupied Units: 2000-2006
0%
5%
10%
15%
20%
25%
Palm Beach Martin Combined
2000 2006
Source: 2000 U.S. Decennial Census Bureau Data / 2006 American Community Survey
17
Multifamily Rental Inventory
Large (100+ units) multi-family apartment communities (complexes) represent an important share of the local rental housing inventory. Apartment communities typically represent a significant share of the local affordable housing supply and generally provide opportunity and choice regarding bedroom distribution. There are currently a total of 95 private rental apartment communities with 100+ units in Palm Beach County totaling 27,699 units (See Map – Major Rental Properties). In Martin County there is currently only one private apartment community of 100+ units. These multi-family rental complexes are either managed by outsourced management companies or by the owners of the
development. In Palm Beach County there are 60 multi family rental buildings managed by an outsourced management company and 35 managed by the owner of the development. The single large apartment complex in Martin County is managed by an outside professional management company. Palm Beach County’s large multi-family rental apartment communities are concentrated in cities where the bulk of the County’s renter housing inventory is currently located, e.g. West Palm Beach (20 communities), Boca Raton (19 communities), Boynton Beach (17 communities) and Delray Beach (12 communities).
Table 14: Palm Beach County Cities with Concentrations of Multi-Family Rental Housing: 2007
West Palm Beach 20 25.30% 87.20% -4.20% $1,059 0.30%
* Source: Real Facts 3rd Quarter 2007 Rental Housing Data The 95 multi-family rental communities in Palm Beach County are largely comprised of 2-bedroom/2-bath (11,725 units) and 1-bedroom/1-bath (9,231 units) apartments (Table 15). The average square foot is 1,041 and the average monthly rent $1,146 or $1.10 per square foot. The average monthly rent for a 2-bedroom/2-bath unit is $1,203. The average occupancy rate for all multi-family rental communities is 91.3 percent.
18
19
Table 15: Palm Beach County Multi-Family Rental Community Apartments by Size, Bedrooms and Average Rents: 2007
Palm Beach County Multi Family (100+ units) Detail
Unit Type # of
Units Avg. sq. ft. Avg. Rent Avg. Rent/sq. ft.
All 27,699 1,041 $1,146 $1.10
Studio 64 581 $841 $1.45
jr. 1bd 20 530 $649 $1.22
1bd 1bth 9,231 776 $960 $1.24
2bd 1bth 1,591 935 $1,038 $1.11
2bd 2bth 11,725 1,138 $1,203 $1.06
2bd TH 1,008 1,324 $1,413 $1.07
3bd 2bth 3,093 1,354 $1,388 $1.02
3bd TH 351 1,660 $1,639 $0.99
Avg. Occupancy
Avg. Year Built
Avg. Rent (All Units)
Avg. Rent/sq. ft. (All Units)
91.30% 1992 $1,146 $1.10 Source: Real Facts 3rd Quarter 2007 Data
The single large, multi-family rental community in Martin County consists of 135 rental units. The bedroom distribution consists of 60 1-bedroom/1-bath units; 40 2-bedroom/2-bath units; and, 33 3-bedroom/2-bath units. The rents range from $1,027 for the 1-bedroom units to $1,713 for the 3-bedroom units. The average occupancy rate for this 2004 multi-family structure is 97.8 percent.
Table 16: Martin County Multi-Family Rental Community (100+ Units) by Size, Bedrooms and Average Rents: 2007
Unit Type # of Units Avg. sq. ft. Avg. Rent Avg. Rent/
sq. ft.
All 135 1,173 $1,304 $1.11
Studio
jr. 1bd
1bd 1bth 60 861 $1,027 $1.19
2bd 1bth
2bd 2bth 40 1,185 $1,340 $1.13
2bd TH
3bd 2bth 33 1,684 $1,713 $1.02
3bd TH
Avg. Occupancy
Avg. Year Built Avg. Rent (All Units)
Avg. Rent/sq. ft. (All Units)
97.80% 2004 $1,304 $1.11 Source: Real Facts 3rd Quarter 2007 Data
20
Low Income Multifamily Rental Housing
Important to the local rental housing inventory is multi-family communities (complexes) that provide rental opportunity to low-income individuals and households. There are sixty-six (66) multi-family apartment complexes in Palm Beach County and four (4) in Martin County
comprising approximately 10,000 units subsidized either in part or full by the Florida Housing Finance Corporation. Following is a brief summary of these programs and a list of apartment communities (Tables 17-18) in Palm Beach and Martin Counties.
Multifamily Mortgage Revenue Bond Program
The Multi-family Mortgage Revenue Bond (MMRB) program uses both taxable and tax-exempt bonds to provide below market-rate loans to non-profit and for-profit developers who set aside a certain percentage of their apartment units for low income families. These bonds are sold through either a competitive or negotiated method of sale or private placement. The program requires that at least 20 percent of the units be set aside for households earning at or below 50 percent of the area median income (AMI). The developer may also opt to set aside 40 percent of the units for households earning at or below 60 percent of the AMI.
The MMRB program encourages targeting in several areas. Special consideration is given to developments that target specific groups or areas such as the Florida Keys, rural development, the elderly, urban infill areas, Front Porch Florida communities, HOPE VI communities, homeless people, and farm workers or commercial fishing workers. Affordable housing developers are able to use the dollars from this program in conjunction with other Florida Housing programs, such as the Affordable Housing Guarantee Program, which participates in the U.S. Department of Housing and Urban Development's Multifamily Risk Sharing program, and the State Apartment Incentive Loan Program.
21
The Housing Credit (HC) Program
The Housing Credit (HC) program provides for-profit and nonprofit organizations with a dollar-for-dollar reduction in federal tax liability in exchange for the acquisition and substantial rehabilitation, substantial rehabilitation, or new construction of low and very low income rental housing units. Eligible development types and corresponding credit rates include: new construction (9 percent); substantial rehabilitation (9 percent); acquisition (4 percent); and federally subsidized (4 percent). A Housing Credit allocation to a development can be used for 10 consecutive years once the development is placed in service. Qualifying buildings include garden, high-rise, townhouses, duplexes/quads, single family or mid-rise with an elevator. Ineligible development types include hospitals, sanitariums, nursing homes, retirement homes, trailer parks, and life care facilities. This program can be used in conjunction with the HOME Investment Partnerships program, the State Apartment Incentive Loan
program, the Predevelopment Loan program, or the Multifamily Mortgage Revenue Bonds program. Each development must set aside a minimum percentage of the total units for eligible low or very low income residents for the duration of the compliance period, which is a minimum of 30 years with the option to convert to market rates after the 14th year. At least 20 percent of the housing units must be set aside for households earning 50 percent or less of the area median income (AMI) or 40 percent of the units must be set aside for households earning 60 percent or less of the AMI. Additionally, housing credits are sometimes reserved for affordable housing that addresses specific geographic or demographic needs, including the elderly, farm workers and commercial fishing workers, urban infill, the Florida Keys Area, Front Porch Florida communities, or developments funded through the U.S. Department of Agriculture Rural Development.
The State Apartment Incentive Loan Program
The State Apartment Incentive Loan program (SAIL) provides low-interest loans on a competitive basis to affordable housing developers each year. This money often serves to bridge the gap between the development's primary financing and the total cost of the development. SAIL dollars are available to individuals, public entities, not-for-profit or for-profit organizations that propose the construction or substantial rehabilitation of multifamily units affordable to very low income individuals and families.
A minimum of 20 percent of the development's units must be set aside for families earning 50 percent or less of the area median income. Developments that use housing credits in conjunction with this program may use a minimum set-aside of 40 percent of the units for residents earning 60 percent of the area median income. Developments in the Florida Keys Area may use a minimum set-aside of 100 percent of the units for residents with annual household incomes below 120 percent of the state or local median income, which ever is higher.
22
Table 17: Florida Housing Finance Corporation MMRB/HC/SAIL Available Rental Properties* Palm Beach County
Property Name
Address City Zip Code Units
Occupied Occupancy Rate (%) **
Ashley Lake Park
5020 Ashley Lake Dr.
Boynton Beach
33437 274 91
Auburn Trace 625 Auburn Circle, West
Delray Beach
33444 231 90
Ballet Villages 430 South Rosemary Ave.
West Palm Beach
33410 na na
Ballet Villages II
400 South Rosemary Ave.
West Palm Beach
33410 na na
Boynton Bay 499 Boynton Bay Circle
Boynton Beach
33435 226 94
Chelsea Commons
6351 Pine Ave. Greenacres 33463 na na
Colony Park 8215 Belvedere Rd.
West Palm Beach
33411 112 86
Congress Park
3010 Congress Park Dr.
Lake Worth 33461 129 100
Courtyard on Flagler
1701 N. Flagler Dr.
West Palm Beach
33407 58 na
Doveland Villas
8633 Doveland Dr.
Pahokee 33486 81 92
Green Cay Village
6744 Heritage Boynton Beach
33437 160 na
Groves of Delray
1301 SW 10th
Ave. Delray Beach
33444 154 97
Hampton Court
4790 Australian Way
West Palm Beach
33407 247 86
Harris Music Lofts
206 Clematis St. West Palm Beach
33401 na na
In the Pines South
16101 Half Mile Rd.
Delray Beach
33447 39 98
Indian Trace Apartments
1000 Indian Trace Circle
Riviera Beach
33407 283 86
Lake Delray 700 Lindell Blvd. Delray Beach
33444 na na
Lake Shore Apartments
4660 N. Congress Ave.
West Palm Beach
33407 178 93
Lake Worth Towers
1500 Lucerne Ave.
Lake Worth 33460 na na
Lakeside Commons
Executive Center Dr.
West Palm Beach
33401 117 91
Live Oak Plantation
1551 Quail Dr. West Palm Beach
33409 na na
Madison Chase
1096 Madison Chase
West Palm Beach
33411 152 95
Malibu Bay 750 Malibu Bay Dr.
West Palm Beach
33401 na na
23
Property Name
Address City Zip Code Units
Occupied Occupancy Rate (%) **
Mallards Landing
1598 Quail Dr. West Palm Beach
33409 na na
Mangonia Residence
2210 N. Australian Ave.
West Palm Beach
33407 218 87
Marina Bay 2600 Lantana Rd.
Lake Worth 33462 174 91
McCurdy Center
1101 Dr. Martin Luther King Jr. Blvd.
Belle Glade 33430 92 na
Merry Place Sprice Ave. and 17
th Street
West Palm Beach
33407 128 na
Mystic Woods I
4250 Leo Lane Palm Beach Gardens
33410 na na
Mystic Woods II
4250 Leo Lane Palm Beach Gardens
33410 90 98
Palm Garden Apartments
4th Ave. and
North A St. Lake Worth 33460 na na
Palm Grove 2100 Australian Ave, N.
West Palm Beach
33407 149 99
Park on Wallis
5211 Wallis Rd. West Palm Beach
33415 22 96
Pines on Stacy
5280 Stacy St. West Palm Beach
33417 22 96
Pinnacle at Abbey Park
1921 Abbey Rd. West Palm Beach
33415 152 95
Pinnacle Palms
601 Executive Center Dr.
West Palm Beach
33401 151 99
Portofino Apartments
10th Avenue
Palm Springs
33461 253 94
Quail Woods 1599 Quail Drive
West Palm Beach
33417 na na
Renaissance 4200 Bear Lake Ct.
West Palm Beach
33409 326 95
Reserve at Ashley Lake
5217 Cedar Lake Park
Boynton Beach
33409 415 94
Riverview House
2571 Lake Worth Rd.
Lake Worth 33461 140 88
Rosemary 706 8th St.
West Palm Beach
33401 na na
Royal Palm Lakes
1749 East Main St.
Pahokee 33476 42 95
Saddlebrook Apartments
5101 Caribbean Blvd.
West Palm Beach
33407 223 97
Springbrook Commons
5500 North Haverhill Rd.
West Palm Beach
33402 119 83
Sugar Cane Villas
38520 86th
Street #2 Pahokee 33476 86 na
Turtle Nest Village
9th Ave and H
St. Lake Worth 33463 na na
24
Property Name
Address City Zip Code Units
Occupied Occupancy Rate (%) **
Venetian Isles I
800 Venetian Isles Dr.
Lake Park 33403 242 84
Venetian Isles II
833 Murano Dr. Lake Park 33403 107 96
Village at Delray
Auburn Ave. and 8
th St.
Delray Beach
33444 192 na
Village Place 2111 Brandy Wine Rd.
West Palm Beach
33409 175 87
Villas at Cove Crossing
2730 Lantana Road
Lantana 33462 na na
Waverly 1386 Summit Pines Blvd.
West Palm Beach
33415 251 97
Windsor Park 1389 Summit Pines Blvd.
West Palm Beach
33415 na na
Wood Lake 1749 Jog Rd. West Palm Beach
33415 221 99
Worthington 6274 Pinestead Dr.
Lake Worth 33463 283 96
*Multi-family rental properties developed with assistance under the Florida Housing Finance Corporation’s MMRB, HC and SAIL Programs. **Occupancy rates as of November 2007
Table 18: Florida Housing Finance Corporation MMRB/HC/SAIL Available Rental Properties* Martin County
Property Address
Address City Zip Code Units
Occupied Occupancy
Rate % The Crossings at Indian Run
3800 SE Gatehouse Circle
Stuart 34994 344 Na
Joseph Lee Gardens
14759 Andalucia Court
Indiantown 34956 na Na
Stuart Point 3521 NW Treasure Coast Drive
Jensen Beach
34957 191 Na
Salerno Village 5813 SE 47
th
Avenue Stuart 34996 42 Na
25
HUD Expiring Uses
Palm Beach County’s loss of its rental inventory due to condominium conversions and hurricane damage may be potentially exacerbated as subsidized rental housing projects become “at-risk” when the terms of their affordability period expires. The issue of HUD expiring uses which involves thousands of privately owned, publicly subsidized rental housing units throughout the country has become an issue in Palm Beach County. A total of 14 HUD-subsidized affordable rental housing projects totaling 1,016 units are at risk of losing their affordability due to expiring affordability periods, opt-outs from subsidy programs, and deteriorating physical and financial conditions (Table 19). In addition to HUD-
subsidized housing, the loss of inventory of other federal, state, and local subsidies are also at risk. These include more recently funded properties such as Low Income Housing Tax Credit projects that reach their fifteenth year in service.
The current list of “expiring uses” indicates that the vast majority of at-risk multi-family rental properties are located in Palm Beach County’s major municipalities; e.g. West Palm Beach, Boca Raton, Riviera Beach, Delray Beach, where the largest concentration of rental housing exist. Coincidentally, many of these cities also have the largest number of condominium conversions.
Table 19: HUD Expiring Uses by Municipality: 2007-2010.
Municipality Number of
Developments Total Assisted
Units Overall Expiration
Date Period
Boca Raton 2 156 2007-2010
Boynton Beach 1 60 2007-2010
Delray Beach 1 158 2007-2010
Jupiter 3 106 2007-2010
Lake Worth 1 99 2007-2010
Riviera Beach 1 182 2007-2010
Tequesta Village 1 62 2007-2010
West Palm Beach 4 193 2007-2010 Source: Florida Clearinghouse Shimberg Center, 2007
Housing demand is largely driven by several key factor conditions – local employment patterns, shifts in population and household growth, and household income. Employment is the principal driver of population and household growth. Conversely, economic decline and associated job loss has the opposite effect, typically resulting in decreases in population, households and household income with a profound effect on residential markets. Therefore, a clear understanding of the relationship between current and projected employment and wages, population and households and household income is fundamental to a housing demand analysis. An industry and employment analysis of Palm Beach and Martin Counties clearly shows that the economic base of both Counties is principally comprised of service-providing industries, most notably, Retail Trade, Health Care and Social Assistance, Accommodation and Food Services and Administrative Support & Waste Management, Remediation Services. In total, service-providing industries account for over 80 percent of all jobs in both Counties. While service-providing industries are essential to the local economy, and do offer
livable wages among many of the associated occupations, the vast preponderance of employment is found in low-wage earning occupations. Housing supply factors include the total number of units by type, price range, tenure and absorption. Housing supply analysis must also consider development trends and projections based on building permit data and planned development activity. Furthermore, it is essential that a housing supply analysis capture the dynamics of a housing market, particularly in locations undergoing drastic changes in the housing market like South Florida. As previously noted, South Florida, including Palm Beach and Martin Counties, experienced an unprecedented residential building boom from 2003-2005 where property appreciation rates skyrocketed and where investors significantly altered the housing supply through multiple conversions of multi-family rental housing properties into condominiums. These housing supply factors, when combined with housing demand, provide a more thorough understanding the relative balance between the local supply and demand for rental housing.
27
B. Renter Demand by Household Composition and Income
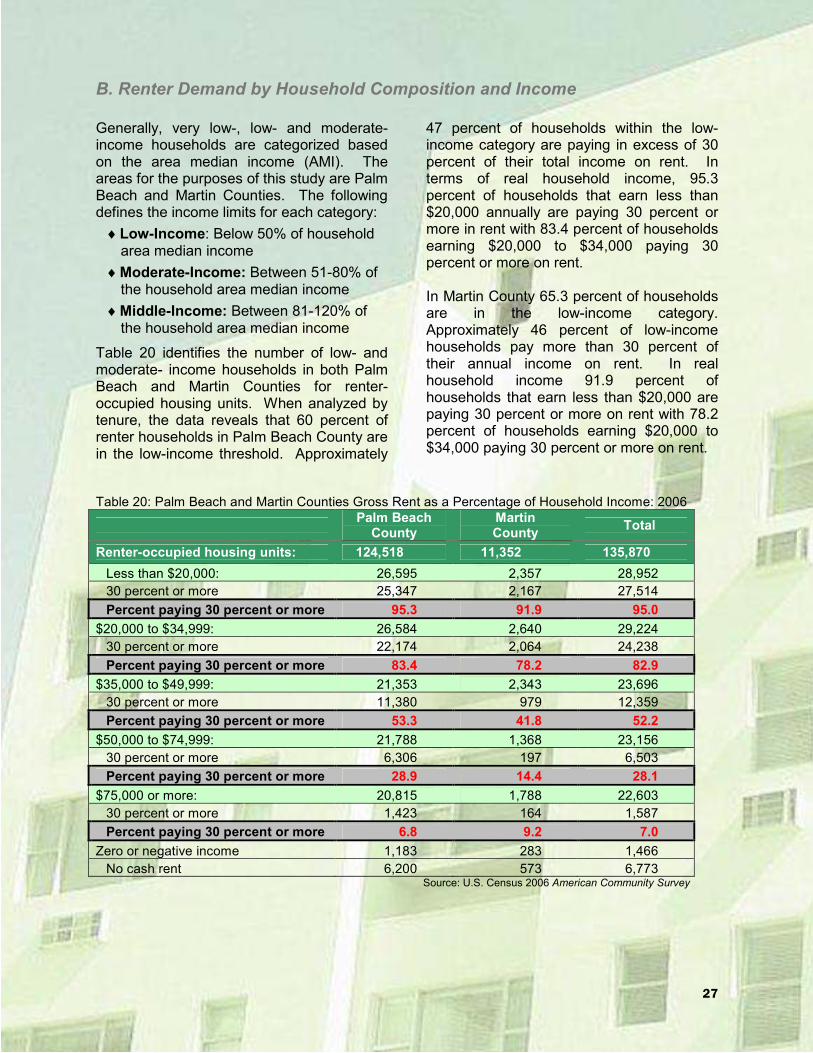
Generally, very low-, low- and moderate-income households are categorized based on the area median income (AMI). The areas for the purposes of this study are Palm Beach and Martin Counties. The following defines the income limits for each category:
♦ Low-Income: Below 50% of household area median income
♦ Moderate-Income: Between 51-80% of the household area median income
♦ Middle-Income: Between 81-120% of the household area median income
Table 20 identifies the number of low- and moderate- income households in both Palm Beach and Martin Counties for renter-occupied housing units. When analyzed by tenure, the data reveals that 60 percent of renter households in Palm Beach County are in the low-income threshold. Approximately
47 percent of households within the low-income category are paying in excess of 30 percent of their total income on rent. In terms of real household income, 95.3 percent of households that earn less than $20,000 annually are paying 30 percent or more in rent with 83.4 percent of households earning $20,000 to $34,000 paying 30 percent or more on rent. In Martin County 65.3 percent of households are in the low-income category. Approximately 46 percent of low-income households pay more than 30 percent of their annual income on rent. In real household income 91.9 percent of households that earn less than $20,000 are paying 30 percent or more on rent with 78.2 percent of households earning $20,000 to $34,000 paying 30 percent or more on rent.
Table 20: Palm Beach and Martin Counties Gross Rent as a Percentage of Household Income: 2006
No cash rent 6,200 573 6,773 Source: U.S. Census 2006 American Community Survey
28
Clearly, in both Palm Beach and Martin Counties households that earn $49,999 or lower are the most cost-burdened. The percentage of cost-burdened renter households increases exponentially as annual household income declines down to the “less than $20,000” income category.
Figure 11: Percentage of Palm Beach and Martin Counties’ Households Paying 30 Percent or More of Income on Rent: 2006
7%
29%
53%
83%
9%
14%
42%
92%
95%
78%
0% 10% 20% 30% 40% 50% 60% 70% 80% 90% 100%
$75,000 or more:
$50,000 to $74,999:
$35,000 to $49,999:
$20,000 to $34,999:
Less than $20,000:
Palm Beach County Martin County
Source: U.S. Census 2006 American Community Survey
29
C. Level of Affordability for Renter Households
An affordability gap analysis was performed for each of the 11 major municipalities in Palm Beach County and for both counties as a whole. A rent survey determined that the median rent in Palm Beach County in 2005 was $1,202/month, a 52 percent increase from 2000 and the average rent reported for Martin County for 2007 was $1,099, a 6.6 percent increase from 2005 and a 38.6% increase from 2000. The gap analysis in Table 21 shows a significant affordability gap in Riviera Beach ($264), but surpluses in other municipalities and the two counties as a whole based on median household income. However, in applying the 80 and 50 percent of AMI levels in Table 22 that are more typical of renter households, substantial affordability gaps are shown in the 50 percent of AMI household category.
Table 21: Palm Beach County Affordability Gaps for 2 Bedroom Rental Apartment by Municipality: 2007*
Municipality
2007 Median
HH Income
Monthly Median
Household Income
Affordable Rent
@ 30% of Income
Median Rent
Affordability Gap @
Median
Boca Raton $76,007 $6,334 $1,900 1390 510
Boynton Beach $50,267 $4,189 $1,257 1108 149
Delray Beach $54,715 $4,560 $1,368 1382 14
Greenacres City $46,604 $3,884 $1,165 960 205
Jupiter $69,317 $5,776 $1,733 1237 496
Lake Worth $37,890 $3,158 $947 927 20
Palm Beach Gardens $75,411 $6,284 $1,885 1277 608
Riviera Beach $40,510 $3,376 $1,013 1277 264
Royal Palm Beach $69,091 $5,758 $1,727 1243 484
Wellington $88,652 $7,388 $2,216 1413 803
West Palm Beach $46,393 $3,866 $1,160 1088 72 * Palm Beach County Quarterly Housing Report Fourth Quarter, 2007, Reinhold P. Wolff Economic Research Source: 2000 U.S. Census (Median income is adjusted for inflation),2006 ACS, FIU Metropolitan.
Table 22: Palm Beach and Martin County’s Affordability Gaps for 2 Bedroom Rental Apartments at 50% and 80% AMI*
County Low Income
50% AMI
Monthly Household
Income
Affordable Rent @ 30% of Income
Median Rent
Affordability Gap @
Median
Palm Beach County 30,600 2,550 765 1,202 437
Martin County 25,470 2,123 637 1,099 462
County
Moderate Income
50%-80% AMI
Monthly Household
Income
Affordable Rent @ 30% of Income
Median Rent
Affordability Gap @ Median
Palm Beach County 48,960 4,080 1,224 1,202 22
Martin County 40,752 3,396 1,019 1,099 80 * Palm Beach County Quarterly Housing Report Fourth Quarter, 2007, Reinhold P. Wolff Economic Research Source: 2000 U.S. Census (Median income is adjusted for inflation),2006 ACS, FIU Metropolitan.
30
D. Future Demand
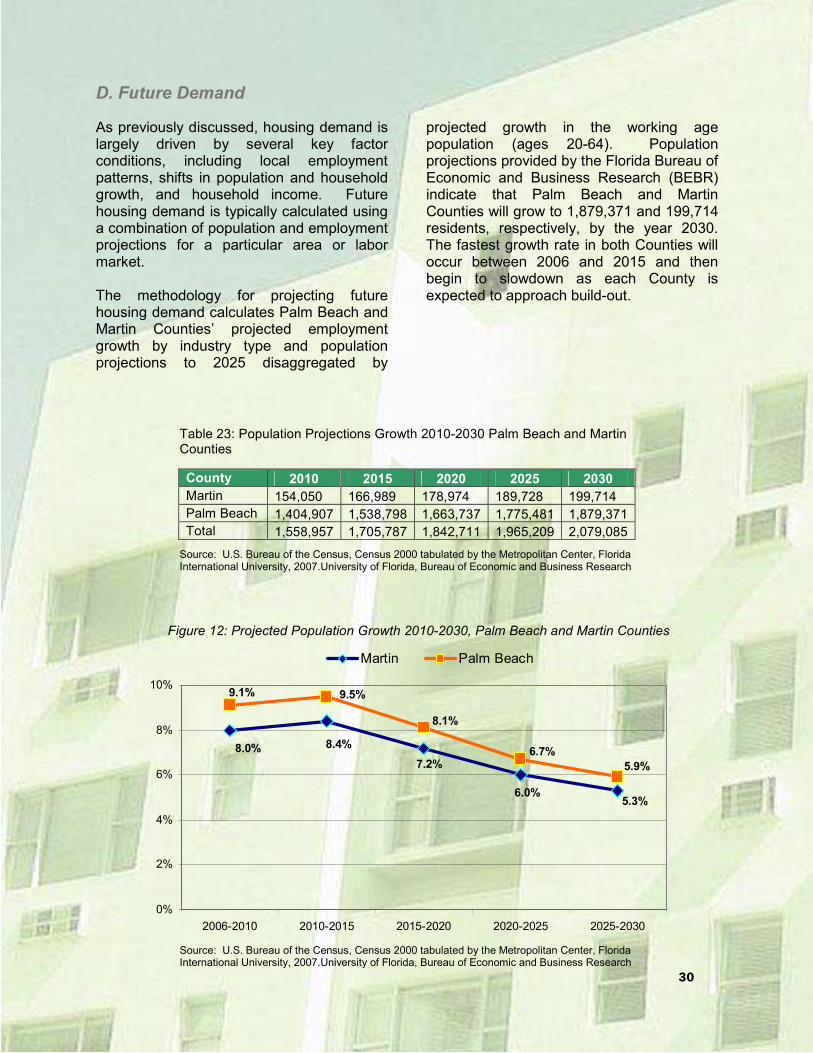
As previously discussed, housing demand is largely driven by several key factor conditions, including local employment patterns, shifts in population and household growth, and household income. Future housing demand is typically calculated using a combination of population and employment projections for a particular area or labor market. The methodology for projecting future housing demand calculates Palm Beach and Martin Counties’ projected employment growth by industry type and population projections to 2025 disaggregated by
projected growth in the working age population (ages 20-64). Population projections provided by the Florida Bureau of Economic and Business Research (BEBR) indicate that Palm Beach and Martin Counties will grow to 1,879,371 and 199,714 residents, respectively, by the year 2030. The fastest growth rate in both Counties will occur between 2006 and 2015 and then begin to slowdown as each County is expected to approach build-out.
Table 23: Population Projections Growth 2010-2030 Palm Beach and Martin Counties
Source: U.S. Bureau of the Census, Census 2000 tabulated by the Metropolitan Center, Florida International University, 2007.University of Florida, Bureau of Economic and Business Research
Figure 12: Projected Population Growth 2010-2030, Palm Beach and Martin Counties
5.3%6.0%
7.2%
8.4%8.0%
5.9%
6.7%
8.1%
9.5%9.1%
0%
2%
4%
6%
8%
10%
2006-2010 2010-2015 2015-2020 2020-2025 2025-2030
Martin Palm Beach
Source: U.S. Bureau of the Census, Census 2000 tabulated by the Metropolitan Center, Florida International University, 2007.University of Florida, Bureau of Economic and Business Research
Total 1,558,957 1,705,787 1,842,711 1,965,209 2,079,085
31
Future rental housing demand is then calculated based on population and employment projections and extrapolate growth in renter-occupied units during the period 2010 to 2030. Table 24 and Figure 14 show that the growth rate in renter-occupied units in both Palm Beach and Martin Counties will peak during the period
2010-2015 and then gradually decrease in subsequent years. Despite a decrease in the growth rate after 2010, renter- occupied housing units are projected to increase by 4,137 units in Martin County and 51,299 units in Palm Beach County during the 2010 to 2030 time period.
Table 24: Renter Occupied Housing Units 2010-2030 Projections Palm Beach and Martin Counties
County 2010 2015 2020 2025 2030
Martin 13,650 14,822 15,908 16,882 17,787
Palm B. 149,808 164,285 177,793 189,875 201,107
Total 163,459 179,107 193,701 206,757 218,894 Source: U.S. Bureau of the Census, Census 2000 tabulated by the Metropolitan Center, Florida International University, 2007.University of Florida, Bureau of Economic and Business Research
Figure 13: Renter Occupied Housing Units 2010-2030 Projections Palm Beach and Martin Counties
8.6%
7.3%
6.1%
5.4%
9.7%
8.2%
6.8%
5.9%
0%
2%
4%
6%
8%
10%
12%
2010-2015 2015-2020 2020-2025 2025-2030
Martin Palm Beach
Source: U.S. Bureau of the Census, Census 2000 tabulated by the Metropolitan Center, Florida International University, 2007.University of Florida, Bureau of Economic and Business Research
32
An extrapolation of projected growth in future population, renter-occupied housing units and existing housing demand provides an estimate of projected renter housing demand by income category. Table 25 shows that the vast majority of the annual renter demand in both Palm Beach and Martin Counties will be for households earning 80 percent and less of the area median income (AMI). In Palm Beach County annual renter demand for households earning less than 80 percent AMI will be just under 2,000 units per year. In Martin County low- and moderate-income renter housing demand peaks at 177 units per year through 2010 and then decreases slightly thereafter.
Table 25: Palm Beach and Martin Counties Projected Annual Renter Housing Demand by Household Income Category: 2000-2025
Palm Beach County
Annual Average Demand 2000-2010 2010-2015 2015-2020 2020-2025
Renter Housing Units 3,277 3,199 2,985 2,670 Low and Moderate Income
Households(<80% AMI) 1,966 1,919 1,791 1,602
Workforce Households (80% to 120% AMI) 557 554 507 454
Martin County
Annual Average Demand 2000-2010 2010-2015 2015-2020 2020-2025
Renter Housing Units 273 257 238 213 Low and Moderate Income
Households(<80% AMI) 177 167 155 138
Workforce Households (80% to 120% AMI) 33 31 29 26 *Year-round housing excludes "other vacant" units and those held "for seasonal, recreational, or occasional use."
Source: 2000 U.S. Census Bureau and 2006 U.S. Census American Community Survey
The 2007 Workforce Housing Market Update prepared by the FIU Metropolitan Center on behalf of the Housing Leadership Council of Palm Beach County showed a correlation between the spatial concentration of workforce households and major retail employment (See map – Major Retail Employers). This study shows that a correlation also exists between the concentration of workforce households and rental housing supply. Given the high cost of homeownership and the fact that most of the workforce of Palm Beach and Martin Counties earn less than 80 percent of the AMI, rental housing and workforce housing have become essentially synonymous. While many of the larger municipalities within Palm Beach and Martin Counties have a decent supply of rental housing, including subsidized multi-family rentals, a significant number of municipalities with high retail and service sector employment
lack a sufficient supply of affordable rental housing, thus creating a spatial mismatch. The need to maintain an adequate supply of affordable rental housing is important in terms of the local economy and the quality of life of each community within Palm Beach and Martin Counties. The fact that households earning less than 80 percent of the area median income (AMI) comprise the vast majority of Palm Beach and Martin Counties’ renter units presents a real challenge in terms of expanding and preserving this critical housing inventory. For these same renter households represent the leading workforce for Palm Beach and Martin Counties’ service and retail sector economies. And, as previously noted, approximately 60 percent of these renter households in Palm Beach County’s and 65 percent in Martin County earn less then 50 percent of the AMI.
33
The previous analysis shows that 89 percent of renter households (47,521 households) in Palm Beach County earning less than $35,000 per year are cost burdened (rent payment in excess of 30 percent of monthly gross income). In Martin County 85 percent of renter households (4,231 households) earning less than $35,000 per year are cost burdened. However, further analysis shows that the cost burden for renter households has increased dramatically since 2000 within both Palm Beach and Martin Counties. Since 2000, the number of renter households that are “extremely” cost burdened (rent payment in excess of 50 percent of monthly gross income) increased
from 24,528 to 34,845 (42 percent) in Palm Beach County and from 1,829 to 2,548 (39 percent) in Martin County. Once renter households become extremely cost burdened they become more “at-risk” for having to relocate from their communities, jobs and way of life. This occurrence is currently being played out in Monroe County where a recent affordable housing needs assessment performed by the FIU Metropolitan Center showed a clear correlation between the substantially growing number of extremely cost burdened renter households and the large exodus of workforce age renters.
34
35
IV. IMPACT OF PUBLIC POLICY, REGULATIONS AND PUBLIC PROGRAMS ON RENTAL HOUSING
A. Background
The following section provides an assessment of existing public policies, regulations and public programs and their impact on the availability of an adequate supply of affordable rental housing in Palm Beach and Martin Counties. The prior analysis documents the important supply and demand factors and conditions that have created a growing shortage of affordable rental housing in the two counties. The leading factors and conditions include: 1) an inflationary housing market during the 2003-2005 residential boom period which impacted all housing types including sharp increases in average rents; 2) multiple condominium conversions that resulted in the loss of over 16,000 rental units; and 3) limited rental production to keep up with rising demand. Given these circumstances, local governments will need to evaluate their existing policies, regulations and programs to determine whether the requisite planning and management capacity is in place to effectively respond to the demand for affordable housing within their respective communities. The first step is to conduct a self-assessment to determine whether existing policies, regulations and programs encourage rental housing production and preservation or create barriers and other inefficiencies that prevent or discourage the availability of affordable rental housing in each community. (For a summary of community options to alleviate barriers to affordable rental housing production and preservation see Appendix A – Affordable Rental Housing Public Policies and & Initiatives: Lessons Learned.) According to 2005 HUD Report, Why Not in Our Community? Removing Barriers to Affordable Housing, various forms of housing
regulation can decrease the total amount of housing built and increase prices by as much as $40,000. The report notes how local regulatory systems have gotten more complex over the last two decades and constitutes the single greatest problem in getting housing built. Administrative processes for developmental approvals continue to become more complex with ever-lengthening reviews and requirements for multiple, duplicative approvals. Too many communities see little public benefit in streamlining the processes, even though each day of unnecessary delay eventually raises development costs with subsequent increases to housing prices and rents. In some cases, an unnecessarily complex approval system may be consciously used by communities and opponents of affordable housing as a growth management tool, a way to extract greater concessions from the developer, or a method for keeping out affordable housing. According to the HUD report, impact fees pose the greatest barrier to affordable housing when they are regressive or disproportionate to actual development costs. These barriers to affordable can particularly impact affordable rental housing production and preservation and exclude rental and affordable housing developments in a community altogether. Not-in-my-back-yard (NIMBY) sentiment plays a key role in the exclusion of these types of housing. As a result, many suburban communities do not permit multifamily housing development anywhere in the jurisdiction. Also prevalent are restrictions on other economical forms of housing, such as accessory apartments, duplexes, and manufactured housing.
housing delivery “process criteria.” The four elements provide the basis for a comprehensive affordable housing delivery system. Together these processes aim to provide the essential policy skills and leadership, management commitment, dedicated funding and on-going institutional capacity-building to enable the successful development and implementation of a sustainable workforce/affordable housing delivery system. For the Rental Housing Study of Palm Beach and Martin Counties, the MS-AHD methodology involved an assessment of current policies, regulations and housing programs of the two counties. The assessment included a review of each County’s Comprehensive Plan and most recent Comprehensive Plan Evaluation and Appraisal Report (EAR). The review also included HUD-Consolidated Plans, Local Housing Assistance Plans (LHAP) and Community Redevelopment Area (CRA) Plans, where applicable.
♦♦♦
C. Findings
Public Policies
The MS-AHD assessment determined that a comprehensive and systematic policy approach to workforce/affordable housing issues is not evident within Palm Beach and Martin Counties or the major municipalities of each County. While the Counties and many municipalities have begun to address the need for workforce/affordable housing through policy changes within the Comprehensive Plan, the results have not been fully coordinated and integrated. Additionally, the workforce/ affordable housing policies that have been enacted by local governments focus primarily on homeownership assistance rather than rental production and preservation. Another significant finding is that while some progress has been made in addressing workforce/affordable needs through the policies and objectives of the Housing Element of the Comprehensive Plan, a review of individual Comprehensive Plans and Evaluation and Appraisal Reports (EARs) found that the Counties and most
municipalities do not correlate their Housing Elements with other important elements such as Future Land Use, Public Facilities, Transportation and Capital Improvements. It is through the Future Land Use Element and its supporting regulations that affordable housing policies can be implemented. Other elements of the Comprehensive Plan, e.g. Transportation, Capital Improvements, can provide the public infrastructure support for affordable housing development and provide opportunities such as transit-oriented development (TOD), an effective planning tool for creating mixed-use, mixed-income development. Further, it was found that few municipalities correlate policy initiatives in their Comprehensive Plans with housing and development policies within their HUD Consolidated Plans, LHAPs and Community Redevelopment Area (CRA) Plans.
One of the most critical findings of the study is the general lack of coordination and integration in the affordable housing delivery management
37
systems that are in place in local governments. Housing delivery is typically fragmented among each municipality’s Housing and Community Development and Planning and Zoning Departments, and Community Redevelopment Agencies (CRAs). Where there is some of
evidence of success in addressing the workforce affordable housing needs, local government display a discernible level of coordination and communication among key departments and agencies within the affordable housing delivery system.
♦♦♦
Regulations
One of the greatest regulatory barriers to rental housing production is land use. Typically, land use regulations often restrict the location and allowable densities that are needed to provide the land capacity for rental housing production. Given the scale of rental housing demand in Palm Beach and Martin Counties, land availability and density are essential. In Martin County there are only 707 acres of land designated for multi-family housing, of which, 540 acres are already developed. The County’s maximum unit density in multi-family districts is only 10 units per acre which has been found to be overly restrictive in accommodating rental housing development. The County has recently proposed an increase from 10 to 15 units per acre as an incentive for developing very-low, low and moderate-income rental housing. According to the 2006 Martin County Affordable and Workforce Housing Program Review conducted by the Florida Housing Coalition, the County’s “density bonus incentives of the Housing and Land Use Elements are commendable except that they are virtually unusable due to the buffering requirements and compatibility of surrounding uses requirements which is exacerbated by the extremely high cost of vacant land, in particular where there are municipal services.” The report goes on to note that no Low Income Tax Credit projects were submitted from Martin County in recent years. County staff report working with affordable housing developers who were searching for suitable sites but were unsuccessful. Growth management measures, including the buffering requirements, compatible uses, and low-density zoning, have made it difficult, if not impossible, for housing credit projects to be developed.
For a housing credits project to be financially feasible, it generally needs to consist of 75 units or more. Given the apparent high demand for affordable rental units, encouraging growth management strategies that allow for these densities and developments is crucial. For that reason a specific policy will be recommended for the Housing Element that will enable the County to monitor the types of density requests and approvals being made to determine the effectiveness of density incentives.2 Another significant barrier to the production of rental housing are county and municipal development review procedures that can take months and often stymie proposed rental housing projects such as Low Income Tax Credit developments that must go through a rigorous State application process, thus necessitating an expedited local development review process. State financing is conditional on timeliness and subsidies are usually based on a fixed amount that does not factor in a lengthy permitting process. Some municipalities, and Palm Beach County have created streamlined permitting processes for affordable housing development though, by-and-large, local governments have not created fully transparent and expeditious development review procedures. The lack of transparency and expediency has much to do with the previous finding noted under the policy barriers above regarding lack of coordination and integration within the housing delivery system, including local building departments.
2 Florida Housing Coalition. 2006. Martin County Affordable and Workforce Housing Program Review
38
♦♦♦
Housing Programs
As noted in the policy findings, existing housing policies, including newly enacted workforce housing policies in Palm Beach and Martin Counties, do not specifically or adequately address the need for rental housing production and preservation. Despite the documented need for affordable housing at the 80 percent and under area median household income levels, housing programs focus on homeownership opportunities for “workforce” households earning well above 80 percent of the AMI. The MS-AHD model also determined the Palm Beach and Martin Counties along with the leading municipalities have not created local dedicated funding sources for workforce/affordable housing. The existence of local dedicated funding is particularly critical for rental housing production and preservation as few federal and state programs accommodate local rental housing programs. While neither county nor local municipalities have created long-term local dedicated funding sources for affordable housing, several cities, including Palm Beach County government have earmarked other housing funds for affordable housing including opportunities for rental housing production and preservation. CRA tax increment financing (TIF) funds have been an effective “short-term” financing tool. While the funding is limited to designated community redevelopment areas, there is substantial flexibility in the use of TIF funds to support workforce/affordable housing development activities. Several municipalities with access to various federal and state housing funds, e.g. Community Development Block Grant (CDBG), HOME, State Housing Initiatives Program (SHIP), have effectively piggybacked these funds with local housing financing tools, including TIF funds, to address their workforce/affordable housing needs.
As previously documented in the rental study, the issue of HUD expiring uses could impact a total of 14 HUD-subsidized affordable rental housing projects totaling 1,016 units that are “at risk” of losing their affordability due to expiring affordability periods, opt-outs from subsidy programs, and deteriorating physical and financial conditions. In addition to HUD-subsidized housing, the loss of inventory of other federal, state, and local subsidies are also at risk. These include more recently funded properties such as Low Income Housing Tax Credit projects that reach their fifteenth year in service. Palm Beach and Martin Counties must take a pro-active role to ensure that this valuable inventory of affordable rental housing remains affordable to the existing renter population. According to the Florida Clearinghouse at the Shimberg Center, government agencies, advocacy organizations, housing developers have combined to launch efforts to preserve “at-risk” affordable housing. Preservation methods include offering incentives to current owners to keep properties in the affordable inventory, transferring properties to owners with an interest in maintaining the housing as affordable and providing funding for rehabilitation and financial stabilization. However, efforts to preserve properties and to formulate policies are hampered by the lack of comprehensive data about the subsidized housing stock. In the absence of this information, governments and others often make ad hoc decisions about preservation of properties that have reached a crisis stage, rather than systematically allocating resources to the types of properties most at risk and that provide the most cost-effective and needed types of housing.3
3 Florida Clearinghouse at the Shimberg Center 2007.
1) Each county and municipality must develop a comprehensive workforce/ affordable housing policy that addresses the urgent need of expanding and preserving the inventory of affordable rental housing;
♦♦♦
2) Each county and municipality must coordinate and integrate the workforce/affordable housing planning and policy initiatives set forth in their Comprehensive Plans, State Local Housing Assistance Plans (LHAPs), HUD Consolidated Plans, and Community Redevelopment Plans to specifically address the vital need for affordable rental housing, and to maximize their effectiveness and impact;
♦♦♦
3) Each county and municipality must add a policy provision to the Housing Element of the Comprehensive Plan that all future development will not result in a “net loss” of existing workforce/ affordable rental housing for households earning 80 percent or less than the area median income (AMI);
♦♦♦
4) Each county and municipality must provide policies and objectives in the Future Land Use Element of their Comprehensive Plans that enable workforce/affordable rental housing development opportunities, including density relief, expanding multi-family residential districts and reducing parking requirements;
♦♦♦
5) Each county and municipality must provide specific policies and objectives within their HUD Consolidated Plans and State Local Housing Assistance Plans (LHAPs) to address the production and preservation of workforce/affordable rental housing;
♦♦♦
6) Each municipality with a Community Redevelopment Area (CRA) Plan must include policies and strategies for developing a spectrum of housing types and opportunities including mixed-income rental housing;
♦♦♦
40
7) Each county and municipality, as part of the community participation or public hearing process for workforce/ affordable housing policies, programs and initiatives, should coordinate with community organizations such as the Housing Leadership Council of Palm Beach County in developing public education strategies for addressing potential NIMBY issues with respect to affordable rental housing;
♦♦♦
8) Each municipality must forge working partnerships with non-profit housing organizations to go beyond the basic requirements of Chapter 166.0451, Florida Statutes, Disposition of Municipal Property for Affordable Housing, and facilitate more aggressive land banking initiatives to accommodate future workforce/affordable rental housing development;
♦♦♦
9) A comprehensive “Rental Housing Preservation Program” initiative is recommended that would include provisions to allow Florida Counties to modify their property appraisal policies and procedures to provide property tax relief to existing and proposed rental housing developments which can document that a majority of occupied housing units are dedicated to households earning 80 percent or less than the area median income (AMI); and
10) The Rental Housing Study of Palm Beach and Martin Counties identified HUD expiring use multi-family rental properties in Palm Beach County. The Counties and individual municipalities must formulate strategic planning initiatives to preserve this “at-risk” affordable housing. Palm Beach and Martin Counties will need to monitor approaching expirations and assist owners in exploring equitable ways to preserve such low-cost housing and keep it in the affordable rental housing inventory. Preservation methods might include offering economic incentives to current owners to preserve the properties in the affordable rental inventory; acquiring and transferring the properties to owners with an interest in preserving the projects as affordable rental housing; and, providing funding for property rehabilitation and financial stabilization.
♦♦♦
41
APPENDIX A
A F F O R D A B L E
R E N TA L H O U S I N G
P U B L I C P O L I C I E S & I N I T I AT I V E S :
L E S S O N S L E A R N E D
42
LAND USE POLICIES & REGULATIONS MULTI-FAMILY ZONING DISTRICT FREMONT, CALIFORNIA The district encourages a well planned and appropriate multiple-family developments within medium, high, and very high density land use classifications while stabilizing and protecting the residential characteristics of the area.
BACKGROUND
The City of Fremont General Plan’s Housing Element directed that a new multi-family zoning district (R-3) be developed to allow new development in multifamily districts at all densities within density ranges of the General Plan in lieu of the Planned District process. The R-3 district was adopted by City Council on July 22, 2003. In applying the ordinance since adoption, staff has found some provisions related to density requirements need to be clarified and changes were made in 2005.
The goal of the multi-family district is to encourage a well planned and appropriate multiple-family developments within medium, high, and very high density land use classifications while stabilizing and protecting the residential characteristics of the district.4 It is also the intention of the City, through the creation of the multi-family district, to create a suitable environment for multi-family living within existing and future land use designations, meet the diverse needs of Fremont residents, and provide multifamily developers the flexibility to meet these goals.
HOW IT WORKS
Proposed developments may qualify for a density bonus if the project includes reduced minimum lot setbacks or reduced parking requirements. Additional incentives such as streamlining the permitting process are bundled within the program to attract diverse types of affordable units within the multi-family zone. Below provides more details regarding the incentives5:
• Site identification assistance - City staff can help identify available locations.
• Flexibility in lot and siting standards through the Site Plan and Architectural Review Approval process when the intent of the standard is met through other means.
• Additional Incentives for projects that qualify for a density bonus, namely: o Increased maximum lot coverage of
seventy percent; o Reduced common open space
areas for each affordable unit; and o Reduced parking requirements for
the affordable units.
• Land use modifications such as: o Allowance for neighborhood and
office commercial uses on the first story of a multi-family residential building that is three stories tall or greater when located on a parkway, arterial or collector street;
• Allowance for live-work units. o Streamlined processing of plans
and permits. o Marketing and applicant
screening- initial renters and/or eligible homebuyers are selected by the City.
4 City of Fremont. www.ci.fremont.ca.us. Article 7.5. R-3 Multi-Family Residence District 5 City of Fremont. http://www.ci.fremont.ca.us/Construction/DevelopAffordableHousing/default.htm. Please note more detailed
information may be reviewed online: http://www.ci.fremont.ca.us/NR/rdonlyres/emzcntqzeeiagi4kxowm64ylifv7k3d4zhudijmn5q722umbuckddy2onzomvk5zfwaxg2r3offrhu5uvjl7p5s6oqe/R3MultipleFamilyZoning.pdf
43
Furthermore, in a report developed by the Washington Area Housing Partnership, the City of Fremont was highlighted as a good practice in making changes to land use regulations that reduce the minimum lot size or setbacks required for new residential development.6 The following four points were highlighted: 1) Must be enacted through local ordinance; 2) Reduces cost of housing development by allowing higher density; 3) May apply to all new development in a jurisdiction; and 4) May be used only in areas targeted for affordable housing development.
LOCAL APPLICATION
Determining the viability of a multifamily zoning district is a worthy planning exercise for Palm Beach and Martin County to undertake. The planning exercise could include identifying the best location based on need, density, and possible Transit Oriented Development (TOD) and mixed-use development opportunities. The results of the planning exercise could be incorporated in the Housing Element of the Comprehensive Plan.
6 Toolkit for Affordable Housing Development. Washington Area Housing Partnership. 2005
44
PROPERTY TAXES MULTIFAMILY HOUSING PROPERTY TAX EXEMPTION PROGRAM7 SEATTLE, WASHINGTON
The Multifamily Housing Property Tax Exemption allows developers to receive a property tax exemption on the residential portion of a development for 10 years. In exchange, a certain number of the housing units must be affordable for modest-income households.
BACKGROUND
In 2006, 2,300 permits were filed to convert rental units into condominiums and, thus, displaced many low-income renters; in particular. The displacement was first notable in downtown where commercial revitalization had also displaced low-income families.8 It was this environment that led the City of Seattle to enact the Multi-Family Housing Tax Exemption (MFTE) in 20049. Initially, the tax exemption was only available to the downtown. However, Seattle’s Mayor recently expanded the exemption to 17 target areas throughout the city, developed additional program initiatives, and renamed the Multi-Family Tax Exemption Program to the Seattle Homes Within Reach Program.
The purpose of the MFTE program is as follows:
• Encourage the development of multifamily housing opportunities within the City of Seattle.
• Stimulate the construction of new multifamily buildings, and the rehabilitation of vacant or underutilized buildings.
• Increase the supply of housing opportunities for low- and moderate-income households.
• Assist in accomplishing the planning goals required under the Growth Management Act, by increasing the supply of multifamily housing opportunities in urban growth centers.
• Contribute neighborhood development and community revitalization.
• Preserve and protect buildings of historic and cultural significance.
• Encourage the creation of both rental and homeownership "workforce housing".
• Encourage the development of mixed-income housing.
7 City of Seattle. http://www.seattle.gov 8 http://www.wshfc.org/Newsletter/index.htm 9 The Multi-family Housing Tax Exemption code can be reviewed: http://clerk.ci.seattle.wa.us/~scripts/nph-
The tax exemption for developing multi-family housing is available for both rental and sale projects. A project approved for the property tax exemption under the program will receive a certificate of tax exemption for the assessed value of the residential improvements. However, it should be noted that the assessed values of the land and any non-residential component of the improvements (retail, commercial, office space, etc.) are not eligible for the exemption
and will be taxed on its full assessed value. The tax exemption remains in place for a maximum of ten years and is transferable to a new property owner as long the property continues to meet the compliance requirements. Should the property owner decide to sell the building, it is important to note that the City of Seattle has the right of first offer for the life of the exemption plus one additional year.
To be eligible for the MFTE, the following requirements must be satisfied:
• Applications must be submitted to the Office of Housing prior to the date a building permit is issued for the multifamily development.
• The multifamily housing site must be located within the boundaries of one of the target areas.
• The multifamily housing must be part of a residential or mixed-use project in which at least fifty percent of the project is intended for permanent residential occupancy.
• Existing residential tenants cannot be displaced from a building purchased for rehabilitation. For a new construction project where an existing rental housing building previously existed within 18 months prior to the application for exemption, units must be replaced that were rented to tenants who received a tenant relocation assistance payment.
The affordability requirements for rental units are listed below:
• A minimum of 20% of the units rented to households with income, including basic utilities, at or below 60% of median, at rents determined to be affordable to such households; or
• A minimum of 25% of the units rented to households with income, including basic utilities, at or below 65% of median, at rents determined to be affordable to such households; or
• A minimum of 30% of the units rented to households with income, including basic utilities, at or below 70% of median, at rents determined to be affordable to such households.
LOCAL APPLICATION
Palm Beach and Martin Counties should consider working with local municipalities to establish a tax exemption strategy in anticipation of a future real estate market recovery. A planning exercise that identifies and evaluates the geographical
concentration of multifamily buildings with 100 or more units is recommended. A good starting point for this exercise is the geo-coded inventory of major multi-family rental properties provided in this study.
46
PERMITTING REQUIREMENTS
ELGIN EXPEDITED PERMITTING PROCESS10 CITY OF ELGIN, ILLINOIS
The city developed an internal standard of performance to expedite the permitting by simplifying the construction process for residents and developers. Larger-scale developments enjoy significant cost savings that potentially allow price reductions on the final residential or commercial product.
BACKGROUND
The slow regulatory process of local planning and zoning approvals can significantly increase the cost of construction. In an attempt to minimize these costs, the City of Elgin expedited its permitting process by reducing it to an average of two weeks. The permitting process is defined from “standard review to code administration review.” The city established an internal standard of performance to streamline the permitting policy and made it easier for residents and developers to schedule contractors and construction work. By providing this predictability, the city can leverage costs savings as a way to negotiate additional affordable homes.
The impact of these changes is greatest with large-scale developments that enjoy significant cost savings. The city expects that the cost savings will attract more private development and will allow for price reductions to trickle down to the final residential product.
HOW IT WORKS
Straightforward permits are channeled “over-the-counter” to two dedicated city staff persons that review and approve proposals without delay. Examples of “over-the-counter” approvals include: fence and swimming pool construction, driveway resurfacing, and fence erection. The city claims that this new policy required no additional funds to implement.
The two-week standard is only extended for three reasons: 1) The plan warrants a certificate of appropriateness which requires approval by the city’s Design Review Committee Plans, 2) The property in question is located within the city’s historic districts, or 3) The plan requires rezoning or Planned Unit Development approval.
LOCAL APPLICATION
The slow permitting procedures in Palm Beach County have recently been criticized by building professionals who claim the status quo discourages potential development.11 Therefore, to encourage affordable rental developments, an expedited permitting process should be considered that would allow affordable rental projects to “go to the front of the line.”
10 Home Grown: Local Strategies in Action. Metropolitan Mayor’s Caucus, Chicago Metropolis 2020, Metropolitan Planning Council. 11 Collins, Thomas. “Speed up building permits, panel says.” Palm Beach Post. Monday, December 17, 2007.
47
CODE ENFORCEMENT
TROUBLED BUILDING INITIATIVE12 CHICAGO, ILLNOIS
The Troubled Buildings Initiative is an effort to curtail the deterioration and loss of viable affordable housing through targeted enforcement efforts and direct intervention with property managers and building owners.
BACKGROUND
Rental properties in disrepair and property abandonment affect the general affordable rental housing stock in a community. To address this issue, the City of Chicago developed the Troubled Buildings Initiative (TBI) in a multi-departmental collaboration that included: Housing, Buildings, Law, Administrative Hearings, Police, Water, Planning, Streets and Sanitation, and Human Services. A local nonprofit mortgage lender also partnered in the effort13.
TBI aims to curtail the deterioration and loss of viable housing through targeted enforcement efforts and direct intervention with property managers and building owners. TBI effectively mobilizes the resources and expertise of the eight city departments and non-profit mentioned above. The buildings are inspected for safety and to make sure they are habitable. If violations are found, TBI will assist the building owners to obtain financing to rehabilitate problem buildings. The initiative is funded by annual allocations of $1 million in Community Block Grant funds and $1 million in corporate funds. It should be noted that the initiative requires significant investment of time and resources to handle ongoing tracking of properties, inter-departmental coordination and strategic interventions.
HOW IT WORKS
The process begins when a building is referred to the TBI by a city department, alderman, community development organization, or a concerned citizen. Once TBI receives the complaint, it coordinates the response of city agencies to address the structure in question as follows:
• The Department of Buildings inspects the property, and if applicable, writes up code violations.
• If violations are found, the case is referred to the Department of Law for prosecution.
• TBI monitors buildings in the program before, during and after prosecution.
• If an owner fails to bring his or her property into compliance, the city will seek to change the ownership of the building. The strategy to achieve the change in ownership generally includes the following steps: identify court-appointed receivers, transfer city liens to the nonprofit for foreclosure, negotiate with lenders for the sale of delinquent notes for foreclosure, and purchasing the building for back taxes.
• The new building owners will also be monitored to ensure they address code violations.
• In cases of foreclosure and that the nonprofit partner is the successful bidder, the property will be redeveloped to create affordable rental housing (occasionally the property is redeveloped for homeownership).
12 Home Grown: Local Strategies in Action. Metropolitan Mayor’s Caucus, Chicago Metropolis 2020, Metropolitan Planning Council. 13 The Nonprofit is the Community Investment Corporation (CIC), a pooled-risk mortgage lender funded by 47 Chicago banks and
that specializes in multi-family rehab in low-income communities. Recently, CIC partnered with the University of Chicago to create a $10 million program to fund affordable rent in Chicago’s south side. For more information on the partnership: http://www-news.uchicago.edu/releases/06/060307.housing.shtml. For more information on CIC: http://www.cicchicago.com
48
In the first three years of the program, “2,439 units have been either fully repaired or are under repair; 67 buildings with 1,294 units have completed rehabilitation; 65 buildings with 1,145 units have rehabilitation in process; 35 buildings with 751 units are under receivership; and only nine buildings with 278 units needed to be demolished (3% of the total 272 Troubled Buildings with 5,096 units that have been identified by City departments and community groups as the worst/most troublesome properties in their neighborhoods).”14
In 2006 the initiative was expanded to include vacant buildings. The goal is to reduce the number of deteriorated, unsafe and underutilized vacant and open buildings in Chicago by at least 75 percent in the first year. The multi-department effort (Police, Buildings, Law, and Housing) aims to: 1) Secure the buildings according to municipal code, making them inaccessible to the public and off-limits to criminal activity; and 2) Rehabilitate, demolish, forfeit, or sell at least half of the buildings.15 Lenders and mortgage holders are also brought into the process to help address the City's concerns about vacant and abandoned buildings.16
LOCAL APPLICATION
The older rental multifamily buildings tend to be the most vulnerable properties in the rental housing stock. Though South Florida does not have an aged rental stock similar to Chicago, there are troubled buildings whose owners may find it easier to sell for redevelopment than to invest in preserving the rental stock. Therefore, Palm Beach and Martin Counties should consider a proactive troubled building initiative that concentrates on preventative strategies.
14 Campaign for Sensible Growth. http://www.growingsensibly.org 15 Home Grown: Local Strategies in Action. Metropolitan Mayor’s Caucus, Chicago Metropolis 2020, Metropolitan Planning Council. 16 City of Chicago. http://egov.cityofchicago.org
49
RENTAL HOUSING PRESERVATION
HOUSING AUTHORITY OF THE CITY OF SANTA BARBARA SANTA BARBARA, CALIFORNIA
The Rental Solutions Program has enabled the city to preserve housing options within the community for low-income workers caught between the gap of high rent and ineligibility for traditional housing programs.
BACKGROUND
Santa Barbara, California has one of the most expensive housing markets in the country. The median price for a single-family home exceeds $800,000; median rent for a two-bedroom apartment is $1,400, far beyond the means of minimum wage earners.17
To mitigate the problem, the Housing Authority of the City of Santa Barbara (HASB) established the Rental Solutions Program. The apartments available through the Program are units that are owned and/or managed by the HASB; HASB relies on its own funds, funding from the City, and tax exempt financing to develop their apartment complexes.
Since the units were built or purchased without federal funds, they are not subject to many of the same regulations as traditional programs. Therefore, the HASB is a landlord in the same manner an apartment in the open-market has a landlord. The differences and benefits are:18
• Housing Authority rents are below open-market rates compared to comparable units.
• Once qualified, the tenant is required to report income changes only every 5 years.
• There is guaranteed stability because the HASB does not increase rents as often as private landlords on the open market. Rents increases are always within reasonable.
• The HASB is committed to maintaining properties in excellent condition.
HOW IT WORKS
The HASB’s innovative Rental Solutions Program is designed to assist the local workforce who earns 80% or less of the Area Median Income. The housing units have fewer income eligibility restrictions than Public Housing and Section 8 programs and, therefore, serve those who are caught in the gap between high rents and inability to qualify for low rent housing.
The HASB’s Rental Solutions Program consists of 224 rental units (studio to three-bedrooms) are located within the City of Santa Barbara and offered at affordable, below-market rents. Applicants qualify for the program based upon income, and other related criteria. In 2006, the annual income limit for a household of one is $36,250, and the income limit for a two-person household is $41,400 per year ($62,160 at Casa de Las Fuentes housing complex).
The Program provides rental solutions for people in a wide range of circumstances. Preference is given to residents of Santa Barbara (living or working on the South Coast), employed persons and/or veterans. In general, the majority of the tenants are working individuals and families who achieve financial independence from any form of assistance within 3-7 years. In addition, the HASB also provides long-term support for people with special needs and limited income such as seniors, veterans, and people with disabilities.
17 National League of Cities. http://www.nlc.org 18 Housing Authority of the City of Santa Barbara. http://www.hacsb.org/housing/rental.html
50
Award-winning HASB Development: Casa de Las Fuentes
The HASB’s first rental workforce housing project, Casa de Las Fuentes, was developed to serve the Downtown’s low-income workers that do not own vehicles and makes up part of the housing stock available in the Rental Solutions Program. The 42-unit (18 studio and 24 one-bedroom apartments) development was constructed without delay, cost overrun, or neighborhood disruption.19 In addition, Casa de Las Fuentes is considered a best practice having won eleven awards including the National Association of Home Builders, (Best Urban Smart Growth Neighborhood), the League of California Cities (Helen Putnam Award for Excellence), the California State Chapter of the American Planning Association Award of Excellence (Outstanding Planning Project Award) and the Builder Magazine Grand Award ("Best Redevelopment Rehab or Infill Site Plan”).20
The Casa de Las Fuentes tenants generally pay no more than 30 percent of their income for rent, which generally ranges from $481 to $651 for a studio apartment. Rents for one-bedroom units are about $815, depending on income. 21
The cost of Casa de Las Fuentes was $5.5 million ($131,000 per unit), considered a remarkable price due to the high quality of the construction and prime downtown location. The city’s redevelopment agency provided a subsidy of $1.8 million ($43,000 per unit) deferred low-interest loan to be paid by residual receipts and the HASB provided $700,000 in cash equity to the project22. These funds were used to leverage a $3 million private tax-exempt note.23 The tax-exempt note was issued by HASB and purchased by a local bank at 5.125 percent interest, which was recently refinanced for 4.375 percent.24 In addition, the HASB received a $600,000 pre-development loan at 3 percent through the California Housing Finance Agency’s HELP program. This loan was paid after the project was completed.25
LOCAL APPLICATION
It is important to support stakeholders dedicated to the development and management of affordable rental units. Whether a proactive Housing Authority similar to Santa Barbara or a capable non-profit developer, they could be assisted by helping them identity acquisition or development opportunities for affordable multifamily rental projects; especially if those opportunities can be leveraged with tax credits.
19 California Redevelopment Association. http://www.calredevlop.org 20 Cities 21, http://www.cities21.org 21 Cities 21. http://www.cities21.org 22 Ibid. 23 National League of Cities. http://www.nlc.org 24 Cities 21. http://www.cities21.org 25 Ibid.
51
LEVERAGING OF FUNDS AND STATE HOUSING RESOURCES
MIAMI BEACH COMMUNITY DEVELOPMENT CORPORATION26
The Design Institute (DI) recommended that the Miami Beach CDC work with housing providers and employers to create a comprehensive housing policy that provides a framework for a complementary financing strategy for the development of multifamily rental units. DI also suggested multiple strategies for leveraging the current funding by: forming a bank lending consortium, establishing an Employer Assisted Housing program and/or a housing linkage fee program, looking at Habitat for Humanity as a possible resource, and combining the three buildings in question into one financing portfolio to reduce risks.
BACKGROUND
The City of Miami Beach and the Miami Beach Community Development Corporation (MBCDC) have an impressive history of producing affordable housing that blends in well with the market rate buildings in the vicinity. An important redevelopment strategy utilized by Miami Beach has been the smaller building-by-building rehabilitation of 20 to 30 units at a time that has enabled a more livable environment and has preserved the city’s architectural character.
Recently, MBCDC used TIF to purchase three historic buildings with to be renovated for affordable rental housing. The Goal is to preserve affordable housing opportunities for a diverse, mixed income residential population, including low- and moderate- income families, the general workforce, and artists and cultural workers. It should be noted that the buildings are located within the Cultural Arts Neighborhood District Overlay (CANDO) whose goal is to promote and stabilize the presence of artists, cultural facilities, and related businesses.
In June 2007, the City and MBCDC submitted the three buildings to the Public Officials Design Institute at Abacoa for recommendations on how to best proceed with the development of these structures. Below are the suggestions provided by DI relating to financing and the leveraging of funds for an affordable rental projects.
HOW IT WORKS
Leveraging Funds through a Comprehensive, Integrated Housing Policy
One of the DI’s primary recommendations is to recreate a comprehensive and broad housing policy to help gain a better understanding of the overall housing needs. The policy should focus on workforce housing and address current and future housing supplies and demand. Critical policy elements would include land use and zoning incentives, neighborhood revitalization strategies, public/private affordable housing development opportunities, and new housing funding options. This housing policy would serve two functions: 1) as the underpinning for developing housing programs, and 2) attract financing and better leverage investment sources.
Augmenting the Financing with Alternative Strategies
The DI made a number of recommendations specific to augmenting existing financing resources. This is especially important in the City of Miami Beach where the cost of real estate values has significantly increased since the 1980s. With the availability of federal programs for financing affordable housing declining, gap financing for affordable housing through the leveraging of funds has become essential. The following were recommendations made by the DI.
26 “Design Institute Report.” Florida Public Officials Design Institute at Abacoa. June 2007
52
1. Avoid purchasing buildings in the future. Instead, provide incentives for developers to buy the buildings and renovate them within the guidelines of the MBCDC and the Community Redevelopment Agency (CRA).
2. Stack the three buildings together in one portfolio. This would allow commercializing one of the buildings to buy down the costs of the others. Also, a combined portfolio has the benefit of reduced risk which could facilitate finding financing for the project. Combining the buildings can also close the number of issues that have to be addressed. Each building should be examined to see how it would fit into the overall portfolio.
3. Sell the first floor for commercial use. The revenue could help offset costs.
4. Establish an Employer Assisted Housing (EAH) program. In an EAH program, a company assists its employees find affordable housing in or near the community where the employer is based. Another approach would be for a group of employers to create an EAH program under one umbrella and would have access to the units for their employees based upon the percent contributed towards acquiring the units. The agreement from the employers to lease or purchase the units (e.g., for 30 years) can be used to help obtain financing in the form of silent capital.
5. Leverage funds or partner with programs such as: 1) the U.S. Department of Housing and Urban Development’s (HUD) 202 Program for units dedicated to the elderly, 2) Habitat for Humanity, 3) the CRA - particularly for Tax Incremental Financing (TIF) funds generated by CRA projects to help finance a bond issue, and 4) State and federal funds can be used to leverage private funds.
6. Work with businesses to create a local lending consortium that makes loans within the city’s housing policy guidelines.
7. Establish a dedicated source of affordable housing funds (i.e. an affordable housing trust fund). The trust fund could be capitalized by a linkage fee imposed on nonresidential and market rate residential projects in the city. The fees should be used by affordable housing provider to build lower-cost homes within the community.
8. Consider a local bond issue for affordable housing preservation and rehabilitation. Look at using a transfer of development rights program that gives a developer higher densities in exchange for providing affordable housing. Consider creating a pro forma that utilizes a combination of the financing programs outlined above (for example, selling or leasing ground space for retail uses, establishing an Employer Assisted Housing program, using TIF funds to help secure a bond issue, and creating a local lending consortium).
9. Enhance the financing package through the use of tax incentives (i.e. Historic Tax Credits, New Market Tax Credits, and Low Income Housing Credits).
LOCAL APPLICATION
The recommendations provided by the Design Institute are applicable to any jurisdiction and nonprofit housing developers. Nonprofit developers can be supported by providing an inventory of suitable properties for acquisition and guidance on the tools and resources available to them for leveraging local financing.
53
LOCAL FUNDING & ECONOMIC INVENTIVES
FEE WAIVER CITY OF HIGHLAND PARK, ILLINOIS27
Highland Park provides fee waivers as an economic incentive to multi-family housing developers by relinquishing building fee revenues in exchange for affordable homes.
BACKGROUND
In the City of Highland Park, the fee waiver incentive for multifamily housing is a component of its inclusionary housing policy. The City waives fees for developers who build housing that serves families earning between 50 and 120 percent of Area Median Income ($37,700-$90,480 for a family of four in 2006). The intent of the fee waivers is to help mitigate developer costs and make the construction of multifamily buildings more attractive. The city relinquishes the revenue from: application and building fees, building permits, plan reviews, sewer and water fees, a demolition tax. Development impact fees are waived on a case-by-case basis. The impact fees attributable to affordable units are routinely waived by the City Council, and are paid by funds from the city’s Housing Trust Fund. Details regarding impact fees and other fee waivers are included in the development agreement for each inclusionary development.
In addition, the city also offers developers a density bonus at a ratio of one additional market-rate unit for each affordable unit.
HOW IT WORKS
In order for a developer to receive a fee waiver, 20 percent of the total number of homes within a development must be affordable. This includes the following types of development:
• New residential or mixed-use construction.
• Renovation of an existing multi-family building that increases the number of homes in that building.
• Any construction that will change the use of an existing non-residential building into a residential building.
• Conversion of apartments into condominiums.
As part of the inclusionary housing policy, the fee waiver policy was formalized after input from developers. The City made sure that the waivers make financial sense and are in line with the costs of building affordable homes.
LOCAL APPLICATION
Consideration should be given to waiving building and impact fees to help mitigate the costs to private and nonprofit developers of multifamily rental housing. Waivers could be restricted to rental housing projects for with rents affordable to households earning less than 80 percent of the area median income (AMI) and infill projects that don’t require the extension of road, water and sewer improvements.
27 Home Grown: Local Strategies in Action. Metropolitan Mayor’s Caucus, Chicago Metropolis 2020, Metropolitan Planning Council
54
LOCAL GOVERNMENT ORGANIZATION & MANAGEMENT CAPACITY
HOUSING COMMISSION, CITY OF HIGHLAND PARK, ILLINOIS28
The Highland Park Housing Commission is a local body dedicated to the city’s workforce housing initiatives and to have help craft policies that respond to the city’s need. Examples of its efforts include: a Community Land Trust, Housing Trust Fund, and an Inclusionary Housing Ordinance.
BACKGROUND
The City of Highland Park’s success in developing and implementing affordable housing policy over the past thirty years has been the result of building capacity around workforce housing issues. The commission is considered the catalyst in the city’s most important workforce housing initiatives (i.e. the Community Land Trust, the Housing Trust Fund, and the adoption of the Inclusionary Housing policy).
The Housing Commission was created due to a serious shortage of housing affordable for low and moderate-income housing in the city. Many local employers were having trouble retaining employees due to housing affordability issues. To address this issue, the Highland Park Housing Commission was established by ordinance to “encourage, promote and engage in the development of low and moderate rent housing projects, and to relieve the shortage of decent, safe and sanitary dwellings.”
HOW IT WORKS
To facilitate the management of affordable housing initiatives, the Housing Commission has broad power to act as needed. The Commission has the authority to:
• Acquire and dispose of improved or unimproved property.
• Remove unsanitary or substandard conditions.
• Construct and operate housing.
• Regulate the maintenance of affordable buildings.
• Borrow, expend, loan, and repay monies for the purposes listed above.
In addition, the Housing Commission has the following responsibilities: • Operates rental housing in four affordable developments.
• Maintains a waiting list for condominium units in an affordable senior development.
• Assembles land and generates revenue to develop affordable senior and family housing.
• Administers the city’s Housing Trust Fund to provide financial resources for affordable housing activities.
• Oversees the city’s Inclusionary Housing Program and other housing initiatives.
• Makes recommendations to the City Council on policy matters and programs related to affordable housing.
• Operates three Section 8 affordable housing rental buildings through three nonprofit corporations.
LOCAL APPLICATION
A Housing Commission with professional capacity could serve as an umbrella agency in the local rental housing delivery system and help coordinate and integrate various city/county departments (i.e. Planning, Economic Development, Community Development, Code Enforcement, Buildings, CRA) and community non-profits (i.e. community development corporations, land trusts) critical to the planning and development of affordable rental housing.
The Massachusetts Housing Partnership has put its bank-funded loan pool to work in Cambridge making a long-term loan of $4.5 million to help preserve 42 units of affordable rental housing located just outside Central Square, one of the city’s most popular areas.
BACKGROUND
The development, known as CAST apartments, will remain home for its resident population of low and moderate-income families. The three brick buildings have been substantially renovated and will continue to serve the neighborhood’s low-income families as 24 of the 42 units are three-bedroom units or larger. 37 of the units will be affordable to families with incomes at or below 60 percent of median income, which in Cambridge is $48,480 for a family of four.
CAST is an example of “expiring use,” a common situation in which affordable apartments financed under a federal program called Section 236, can be sold at market rate after 20 years, if the owner opts to pre-pay out of the program. CAST, purchased with a 236 loan in 1971, was in danger of being lost to the red-hot Cambridge real estate market by 2002.
HOW IT WORKS
Homeowners Rehab Inc. (HRI) purchased the property for $6 million from CAST Associates, a subsidiary of longtime Boston area developer and property management executive Ed Abrams. (Abrams remained involved in CAST as a co-general partner and manager of the property).
HRI then embarked on a $2.8 million renovation program, making improvements to the kitchens, bathrooms, hallways, grounds and internal systems. A September 30, 2003 ceremony marked the completion of the preservation and renovation efforts.
The Massachusetts Housing Partnership (MHP) often refinances these types of “expiring use” properties. For example, earlier that year MHP put together a permanent financing package of $25 million to preserve 280 apartments in the City of Salem. In 2001, MHP loaned $3.2 million to preserve 60 affordable rental units at the Pondview Apartments in Jamaica Plain.
“When it came time to find a permanent lender, it wasn’t very hard,” said Peter Daly, HRI’s executive director. “MHP knows the affordable housing business as well as anyone else.”
Other funders in the CAST effort included the City of Cambridge, the state Department of Housing and Community Development, Fleet Bank, the Massachusetts Housing Investment Corporation, the Cambridge Neighborhood Reinvestment Corporation, and the Community Economic Development Assistance Corporation. MHP has now financed five HRI affordable housing efforts, totaling $17 million and 290 rental units. The MHP funds come from its bank-funded loan pool created in 1990 when the state legislature passed a law requiring banks to extend credit lines to MHP for affordable housing. Since then, MHP’s fund has grown to a half-billion dollars and it has provided hard-to-find, below-market, long-term financing for nearly 10,000 units.
LOCAL APPLICATION
The State of Florida does not have a Massachusetts Housing Partnership type of agency that provides that has developed a large bank-funded loan pool for affordable housing development and preservation. However, a similar financing package could be developed using a combination of State Apartment Incentive Loan (SAIL) Program Multi-family Mortgage Revenue Bond Program financing along with local funding sources such as TIF and housing trust funds. A Homeowners Rehab, Inc. (HRI) type entity could be formed through existing community development corporations (CDCs) or community land trusts (CLTs).