58
Annual Minnesota Transportation Performance Report 2009

AnnualMinnesota TransportationPerformanceReport
2009


May, 2010
Dear Citizens of Minnesota,
I am pleased to share with you the 2009 Minnesota Transportation Performance Report.
Mn/DOT presents this report to illustrate the performance of Minnesota’s transportation system. The performance measures show results, indicating how well – or not so well – the statewide transportation system is working.
Key findings since last year indicate continuing reductions in the number of highway fatalities, strong state bridge condition that will continue to improve, and an uptick in Twin Cities Metro area freeway congestion, balanced by gains in express transit ridership benefiting from new options like NorthStar Commuter Rail.
In making plans and decisions, Mn/DOT involves communities, citizens and partners and uses performance information. State and local system performance data helps Mn/DOT evaluate the effectiveness of transportation investment choices and make trade off decisions within its budgets. Mn/DOT’s measures cover our largest services and expenditure areas.
To address performance concerns, the department is also working on innovative approaches to stretch available revenues. They include utilizing public-private partnerships, accelerating low-cost/high benefit congestion projects, pursuing context sensitive and flexible design solutions and considering all transportation modes for improving mobility and accessibility in the Metro and in Greater Minnesota.
Mn/DOT is committed to building public trust by being transparent and accountable to the public on how we spend tax dollars. We will continue to measure and report performance and involve citizens, stakeholders and partners in the implementation of plans and future investment and policy decisions.
Together, we can realize the shared vision of a safe, efficient and sustainable transportation system.
Sincerely,
Thomas K. Sorel


Annual Minnesota
Transportation Performance
Report
2009
Minnesota Department of Transportation
Prepared by
The Office of Capital Programs andPerformance Measures
651-366-3798
April 2010Minnesota Department of Transportation
395 John Ireland Boulevard
Saint Paul, Minnesota 55155 Phone: 800-657-3774
800-627-3529 (TTY, Voice, ASCII) www.dot.state.mn.us

6
Table of Contents
Introduction ............................................................................... 7
Performance Highlights ............................................................. 8
Minnesota 2009 Transportation Results Scorecard ...............10
Traffic Fatalities ....................................................................... 13
Bridge Condition ...................................................................... 16
Pavement Condition ................................................................. 18
Snow & Ice Management ......................................................... 20
Bridge Safety Inspections ........................................................ 22
Customer Satisfaction .............................................................. 24
Nonstop Air Destinations ......................................................... 26
Port Tonnage ........................................................................... 28
Interregional Corridors ............................................................ 30
Aviation Access ........................................................................ 32
Congestion ............................................................................... 34
Incident Clearance ................................................................... 36
Express Transit Ridership ....................................................... 38
Bus Service Hours ................................................................... 40
Short-Line Railroad Condition ................................................. 42
Accessibility.............................................................................. 44
Fuel Use ................................................................................... 46
Project Delivery ....................................................................... 48
Transportation Systems in Minnesota .....................................50
Revenue and Investment Overview ......................................... 51
Trends Impacting Performance ............................................... 53
Measure Explanations and System Definitions ........................54
7
IntroductionGood transportation systems are essential to Minnesota’s economic competitiveness and qual-ity of life, supporting thriving communities, suc-cessful businesses and healthy industries. The goal of this second annual Minnesota Transportation Performance Report is to provide a customer view of transportation performance.
The report describes the condition and service levels provided by major parts of Minnesota’s statewide transportation system in 2009 and the previous decade. It features 18 performance measures and monitoring indicators that track progress on the 10 policy goals of the Minnesota Statewide Transportation Policy Plan 2009-2028. It complements the 2010 Highway Investment Plan Annual Update with new 2009 data and a broader set of multimodal indicators.
Mn/DOT has been using performance measure-ment tools since the early 1990s. Performance information along with citizen and stakeholder input and legislative direction are used to evalu-ate investment choices and make trade-off deci-sions within available resources. This report cov-ers the results for Mn/DOT's largest budget areas.
Scope: Mn/DOT and Minnesota transportationThe report includes the chief performance mea-sures and targets Mn/DOT uses in its planning and decision-making, as well as tracking indica-tors for the broader statewide transportation system. The larger system is operated by diverse partners including the Metropolitan Council, the Metropolitan Airports Commission, the Minnesota Department of Public Safety, pri-vate railroads and port operators, the Federal Aviation Administration and U.S. Army Corps of Engineers and local government port authorities and transit operators. The report does not cover county, city and township roads, except for traffic fatalities and services like transit provided on those systems. See the chart on page 50 for a summary of Minnesota's diverse transportation system.
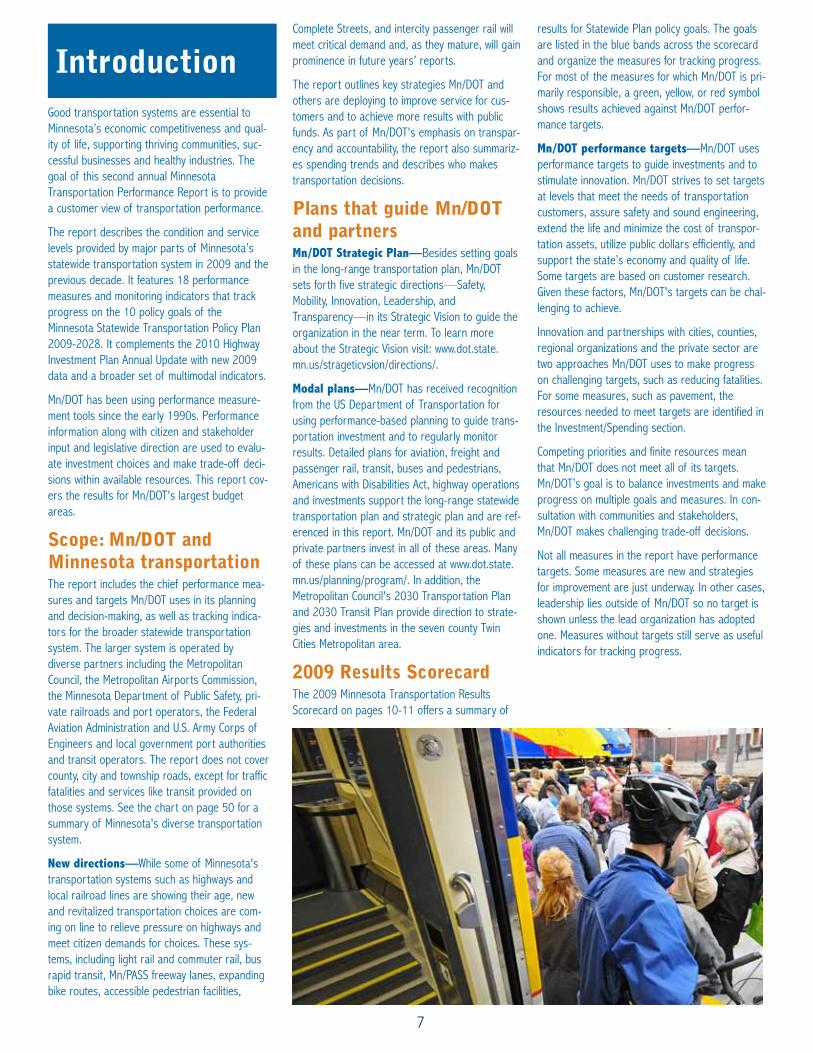
New directions—While some of Minnesota's transportation systems such as highways and local railroad lines are showing their age, new and revitalized transportation choices are com-ing on line to relieve pressure on highways and meet citizen demands for choices. These sys-tems, including light rail and commuter rail, bus rapid transit, Mn/PASS freeway lanes, expanding bike routes, accessible pedestrian facilities,
Complete Streets, and intercity passenger rail will meet critical demand and, as they mature, will gain prominence in future years’ reports.
The report outlines key strategies Mn/DOT and others are deploying to improve service for cus-tomers and to achieve more results with public funds. As part of Mn/DOT's emphasis on transpar-ency and accountability, the report also summariz-es spending trends and describes who makes transportation decisions.
Plans that guide Mn/DOT and partnersMn/DOT Strategic Plan—Besides setting goals in the long-range transportation plan, Mn/DOT sets forth five strategic directions—Safety, Mobility, Innovation, Leadership, and Transparency—in its Strategic Vision to guide the organization in the near term. To learn more about the Strategic Vision visit: www.dot.state.mn.us/strageticvsion/directions/.
Modal plans—Mn/DOT has received recognition from the US Department of Transportation for using performance-based planning to guide trans-portation investment and to regularly monitor results. Detailed plans for aviation, freight and passenger rail, transit, buses and pedestrians, Americans with Disabilities Act, highway operations and investments support the long-range statewide transportation plan and strategic plan and are ref-erenced in this report. Mn/DOT and its public and private partners invest in all of these areas. Many of these plans can be accessed at www.dot.state.mn.us/planning/program/. In addition, the Metropolitan Council's 2030 Transportation Plan and 2030 Transit Plan provide direction to strate-gies and investments in the seven county Twin Cities Metropolitan area.
2009 Results ScorecardThe 2009 Minnesota Transportation Results Scorecard on pages 10-11 offers a summary of
results for Statewide Plan policy goals. The goals are listed in the blue bands across the scorecard and organize the measures for tracking progress. For most of the measures for which Mn/DOT is pri-marily responsible, a green, yellow, or red symbol shows results achieved against Mn/DOT perfor-mance targets.
Mn/DOT performance targets—Mn/DOT uses performance targets to guide investments and to stimulate innovation. Mn/DOT strives to set targets at levels that meet the needs of transportation customers, assure safety and sound engineering, extend the life and minimize the cost of transpor-tation assets, utilize public dollars efficiently, and support the state’s economy and quality of life. Some targets are based on customer research. Given these factors, Mn/DOT's targets can be chal-lenging to achieve.
Innovation and partnerships with cities, counties, regional organizations and the private sector are two approaches Mn/DOT uses to make progress on challenging targets, such as reducing fatalities. For some measures, such as pavement, the resources needed to meet targets are identified in the Investment/Spending section.
Competing priorities and finite resources mean that Mn/DOT does not meet all of its targets. Mn/DOT’s goal is to balance investments and make progress on multiple goals and measures. In con-sultation with communities and stakeholders, Mn/DOT makes challenging trade-off decisions.
Not all measures in the report have performance targets. Some measures are new and strategies for improvement are just underway. In other cases, leadership lies outside of Mn/DOT so no target is shown unless the lead organization has adopted one. Measures without targets still serve as useful indicators for tracking progress.
8
Performance Highlights
This summary highlights Minnesota transportation performance trends through 2009 and the factors shaping the trends. Strong performance in some areas and weak performance in others reflect challenging trade-off decisions made by Mn/DOT and other transportation agencies in an era of tight resources.
StrengthsMn/DOT and its partners have achieved strong results in improving highway safety and bridges, clearing state roads of snow and ice, and provid-ing statewide connections via interregional high-ways and a local airport system reaching nearly every corner of the state.
Fatalities on Minnesota’s state and local roads fell six of the last seven years, from a peak of 657 in 2003 to an estimated 420 in 2009. Minnesota is nearing the 2010 Toward Zero Deaths (TZD) partnership target of 400. Minnesota had the 2nd lowest fatality rate in the nation in 2008 – 37 per-cent below the national average. Using the “4 E’s” of Engineering, Enforcement, Education, and Emergency Trauma Systems – and boosted by new legislation – state, local and private Minnesota agencies have reduced fatalities across both state and local roads, and for seven catego-ries targeted by TZD – Under age 21, unbelted drivers, speeding-related, run-off-the road, alco-hol-related, intersection crashes, and head-on and side-swipe crashes.
Bridges—Eighty-seven percent of State Highway Bridges on Principal Arterials (the busiest roads, with 85 percent of state bridges by deck area) are in Good or Satisfactory condition, meeting Mn/DOT’s target. 3.5 percent are rated Poor, but that level is projected to come down and meet the 2 percent target as a result of the estimated $2.5 billion Chapter 152 Bridge Program funded by the 2008 legislature through 2018. Among the 50 states, Minnesota had the 5th lowest percentage of state bridges rated structurally deficient or functionally obsolete in 2009.
Mn/DOT inspected 100 percent of state bridges due for inspection in 2009. 94 percent were inspected on time, short of the 100 percent tar-get, but up from 86 percent on time in 2007. With the help of Chapter 152 funds, Mn/DOT has increased bridge inspection and maintenance staffing and equipment, improved documentation and processes to make repairs on time, and embarked on new measures to monitor on-time repair.
Statewide travel connections are strong; measures for Interregional Corridor travel speed and access to airports both exceed Mn/DOT tar-gets. Ninety-eight percent of Greater Minnesota interregional corridor trips on major state roads outside the Twin Cities Metro area can be driven at average speeds near 55 or 60 miles per hour. Ninety-six percent of Minnesotans live within 20 miles of a paved and lighted airport. These 118 locally-owned airports are vital for business, ship-ping and receipt of goods, medical and emergency services, law enforcement, tourism and private and scheduled air service.
National and global connections through air service, rail service and Great Lakes and Mississippi river shipping are vital to Minnesota’s economic competitiveness and quality of life. A major asset for Minnesota is the large number of nonstop air destinations available from the Minneapolis-St. Paul International Airport—sup-plemented by destinations from Rochester and Duluth. With 134 nonstop destinations in 2009 down from 144 in 2008, the Twin Cities ranks 9th
among U.S. metropolitan areas. 21 destinations are international. Still, there is concern that two of nine Greater Minnesota cities with commercial air service – Grand Rapids and St. Cloud – have lost service since 2000.
Mn/DOT’s snow and ice clearance operations regularly met the annual target for clearing ice and snow on time for 70 percent or more of storm events over the last decade. Severe cold and storms in the 2008-09 winter pushed Mn/DOT’s snow and ice results below the target for the first time, despite record spending of $67.5 million. Results were back above target in the 2009-10 winter season through February.
Accountability and transparency—Mn/DOT project delivery. 93 percent of Mn/DOT con-struction projects scheduled for FY2009 were put out for bid within the year, though many were moved within the year. At the same time, Mn/DOT awarded its largest construction program ever, at $929 million in FY2009. The FY2010 program is larger yet at $1.21 billion.
9
WeaknessesPavement. State highway pavement condition continues to decline. Due to an aging system and competing investment needs, the percent of miles rated Poor for ride quality and condition reached record highs in 2009. The percent Poor is predict-ed to rise from about seven percent in 2009 (990 miles) to 19 percent by 2019 (2,744 miles), based on predicted available revenues and cur-rent investment plans. Mn/DOT is pursuing new ways to get more value for each dollar invested in pavements, including low-cost maintenance and repair methods and performance-based project design to “right-size” projects. Mn/DOT's antici-pated spending is an average of $285 million per year for 2010-2013 and about $200 million per year for 2014-2019. Meeting Mn/DOT’s perfor-mance targets would require investing from $200 to $400 million more per year from 2014 to 2019 above and beyond anticipated spending.
Mn/DOT customer research has consistently found that substandard pavements reduce customer satisfaction levels with highway maintenance. General satisfaction with state highway mainte-nance fell to 6.0 on a 1 to 10 scale in 2009 - remaining in the “neutral” zone below the target of 7.0. Still, customer satisfaction remained “posi-tive” for snow and ice removal, roadway striping, and signing.
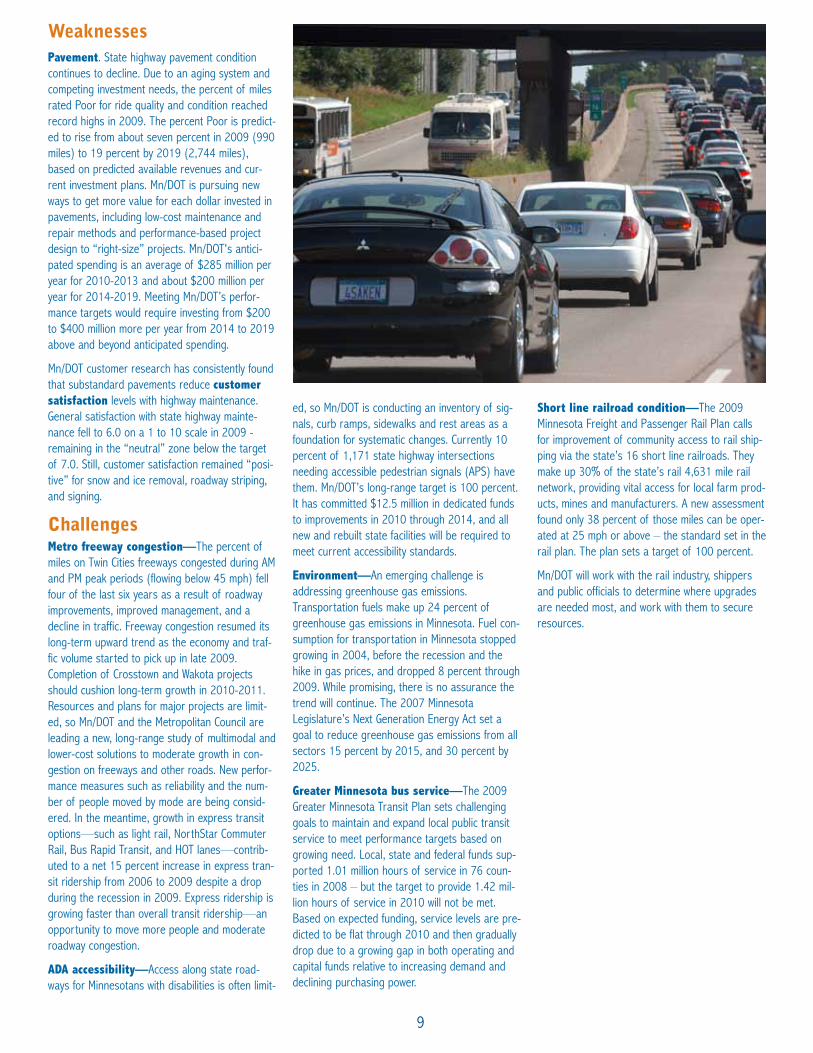
ChallengesMetro freeway congestion—The percent of miles on Twin Cities freeways congested during AM and PM peak periods (flowing below 45 mph) fell four of the last six years as a result of roadway improvements, improved management, and a decline in traffic. Freeway congestion resumed its long-term upward trend as the economy and traf-fic volume started to pick up in late 2009. Completion of Crosstown and Wakota projects should cushion long-term growth in 2010-2011. Resources and plans for major projects are limit-ed, so Mn/DOT and the Metropolitan Council are leading a new, long-range study of multimodal and lower-cost solutions to moderate growth in con-gestion on freeways and other roads. New perfor-mance measures such as reliability and the num-ber of people moved by mode are being consid-ered. In the meantime, growth in express transit options—such as light rail, NorthStar Commuter Rail, Bus Rapid Transit, and HOT lanes—contrib-uted to a net 15 percent increase in express tran-sit ridership from 2006 to 2009 despite a drop during the recession in 2009. Express ridership is growing faster than overall transit ridership—an opportunity to move more people and moderate roadway congestion.
ADA accessibility—Access along state road-ways for Minnesotans with disabilities is often limit-
ed, so Mn/DOT is conducting an inventory of sig-nals, curb ramps, sidewalks and rest areas as a foundation for systematic changes. Currently 10 percent of 1,171 state highway intersections needing accessible pedestrian signals (APS) have them. Mn/DOT’s long-range target is 100 percent. It has committed $12.5 million in dedicated funds to improvements in 2010 through 2014, and all new and rebuilt state facilities will be required to meet current accessibility standards.
Environment—An emerging challenge is addressing greenhouse gas emissions. Transportation fuels make up 24 percent of greenhouse gas emissions in Minnesota. Fuel con-sumption for transportation in Minnesota stopped growing in 2004, before the recession and the hike in gas prices, and dropped 8 percent through 2009. While promising, there is no assurance the trend will continue. The 2007 Minnesota Legislature’s Next Generation Energy Act set a goal to reduce greenhouse gas emissions from all sectors 15 percent by 2015, and 30 percent by 2025.
Greater Minnesota bus service—The 2009 Greater Minnesota Transit Plan sets challenging goals to maintain and expand local public transit service to meet performance targets based on growing need. Local, state and federal funds sup-ported 1.01 million hours of service in 76 coun-ties in 2008 – but the target to provide 1.42 mil-lion hours of service in 2010 will not be met. Based on expected funding, service levels are pre-dicted to be flat through 2010 and then gradually drop due to a growing gap in both operating and capital funds relative to increasing demand and declining purchasing power.
Short line railroad condition—The 2009 Minnesota Freight and Passenger Rail Plan calls for improvement of community access to rail ship-ping via the state’s 16 short line railroads. They make up 30% of the state’s rail 4,631 mile rail network, providing vital access for local farm prod-ucts, mines and manufacturers. A new assessment found only 38 percent of those miles can be oper-ated at 25 mph or above – the standard set in the rail plan. The plan sets a target of 100 percent.
Mn/DOT will work with the rail industry, shippers and public officials to determine where upgrades are needed most, and work with them to secure resources.
Measure Score Result Target Trend Analysis
t r ave l e r s a f e t y
Minnesota Traffic Fatalities—All state and local roads
Est. 420as of
4/15/09
400 by 2010
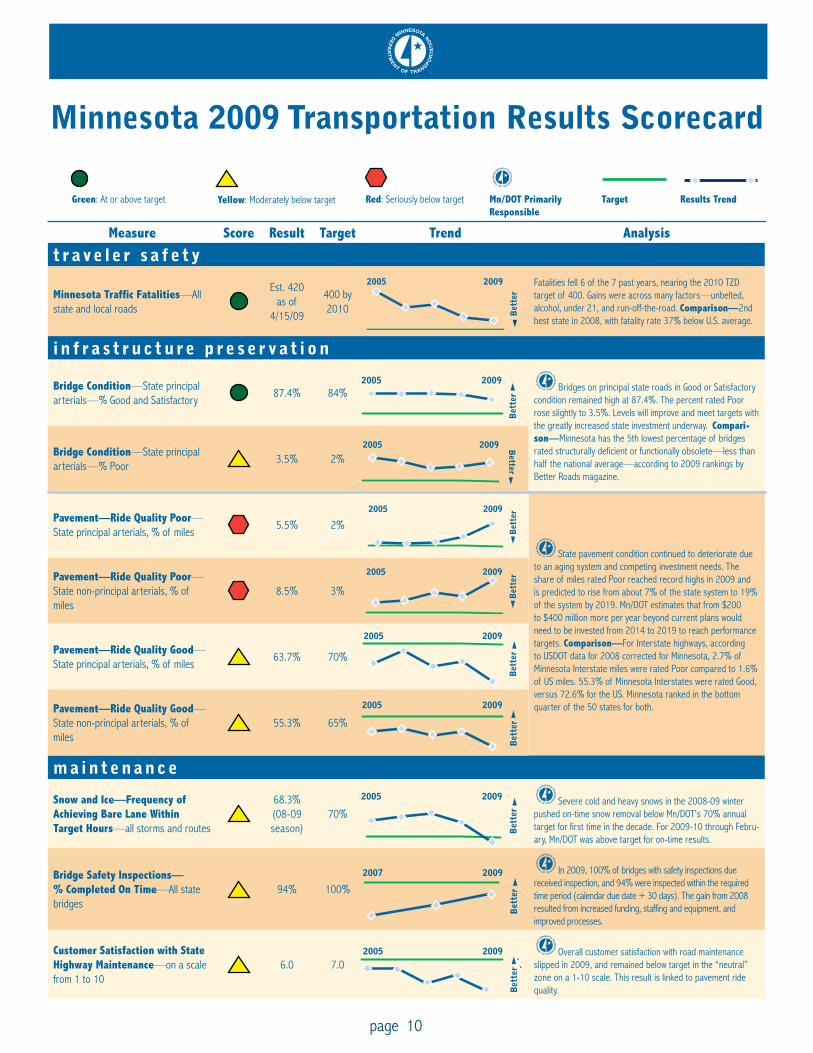
Fatalities fell 6 of the 7 past years, nearing the 2010 TZD target of 400. Gains were across many factors—unbelted, alcohol, under 21, and run-off-the-road. Comparison—2nd best state in 2008, with fatality rate 37% below U.S. average.
i n f r a s t r u c t u r e p r e s e r v a t i o n
Bridge Condition—State principal arterials—% Good and Satisfactory
87.4% 84% Bridges on principal state roads in Good or Satisfactory condition remained high at 87.4%. The percent rated Poor rose slightly to 3.5%. Levels will improve and meet targets with the greatly increased state investment underway. Compari-son—Minnesota has the 5th lowest percentage of bridges rated structurally deficient or functionally obsolete—less than half the national average—according to 2009 rankings by Better Roads magazine.
Bridge Condition—State principal arterials—% Poor
3.5% 2%
Pavement—Ride Quality Poor—State principal arterials, % of miles
5.5% 2%
State pavement condition continued to deteriorate due to an aging system and competing investment needs. The share of miles rated Poor reached record highs in 2009 and is predicted to rise from about 7% of the state system to 19% of the system by 2019. Mn/DOT estimates that from $200 to $400 million more per year beyond current plans would need to be invested from 2014 to 2019 to reach performance targets. Comparison—For Interstate highways, according to USDOT data for 2008 corrected for Minnesota, 2.7% of Minnesota Interstate miles were rated Poor compared to 1.6% of US miles. 55.3% of Minnesota Interstates were rated Good, versus 72.6% for the US. Minnesota ranked in the bottom quarter of the 50 states for both.
Pavement—Ride Quality Poor—State non-principal arterials, % of miles
8.5% 3%
Pavement—Ride Quality Good—State principal arterials, % of miles
63.7% 70%
Pavement—Ride Quality Good—State non-principal arterials, % of miles
55.3% 65%
m a i n t e n a n c e
Snow and Ice —Frequency of Achieving Bare Lane Within Target Hours—all storms and routes
68.3% (08-09 season)
70%Severe cold and heavy snows in the 2008-09 winter
pushed on-time snow removal below Mn/DOT’s 70% annual target for first time in the decade. For 2009-10 through Febru-ary, Mn/DOT was above target for on-time results.
Bridge Safety Inspections— % Completed On Time —All state bridges
94% 100%
In 2009, 100% of bridges with safety inspections due received inspection, and 94% were inspected within the required time period (calendar due date + 30 days). The gain from 2008 resulted from increased funding, staffing and equipment, and improved processes.
Customer Satisfaction with State Highway Maintenance—on a scale from 1 to 10
6.0 7.0Overall customer satisfaction with road maintenance
slipped in 2009, and remained below target in the “neutral” zone on a 1-10 scale. This result is linked to pavement ride quality.
Minnesota 2009 Transportation Results Scorecard
Green: At or above target Red: Seriously below targetYellow: Moderately below target Target Results TrendMn/DOT Primarily Responsible
Bet
ter
2007 2009
Bet
ter
2005 2009
Bet
ter
2005 2009
Bet
ter
2005 2009
Better
2005 2009
Bet
ter2005 2009
Bet
ter
2005 2009
Bet
ter2005 2009
Bet
ter
2005 2009
Bet
ter
2005 2009
page 10

Measure Score Result Target Trend Analysis
n a t i o n a l a n d g l o b a l c o n n e c t i o n sNonstop Air Destinations from Minnesota—National and international
N/A 134tracking indicator
Nonstop destinations fell in 2009 due to the recession. Comparison—Twin Cities has 9th most nonstop destinations of any US metro area, despite losing 10 destinations in the past year.
Port Tonnage—Annual shipments from MN Great Lakes & river ports
N/A52.3
million tons
tracking indicator
Waterway tonnage dropped sharply in 2009 as the recession cut steel production and taconite shipping from Lake Superior ports by 25 million tons. Comparison—Duluth is 15th largest US port by tonnage (2008).
s t a t ew i d e c o n n e c t i o n sInterregional Corridors—Greater MN—% of Miles +/- 2 mph of Target Speed (55 or 60 mph) or faster
98.0% 95% 98% of major interregional routes beyond the Metro
fringe can be driven at average trip speeds near 55 or 60 mph. Predicted to sustain 98% through 2020, then decline.
Airport Access—Percent of Min-nesota population within 20 miles of an airport with paved and lighted runway
96%2006
90%118 local paved and lighted airports provide ready access to 96% of Minnesotans for business, shipping, recreation, medi-cal services, law enforcement and fire fighting.
t w i n c i t i e s m o b i l i t y
Twin Cities Urban Freeway System Congestion —% of miles below 45 mph in AM or PM peak
N/A 18.2%
new
mea
sure
s un
der d
evp. Congested miles grew in 2009 as the economy stabi-
lized. Crosstown and Wakota project completions will cushion long-term growth in 2010-2011, while Mn/DOT and the Met Council roll out new multimodal approaches. Comparison— 13th most congested of 29 peer metro areas.
Clearance Time for Metro Urban Freeway incidents—3 yr. average 2008
37.1minutes 2008
35.0minutes
Average clearance improved in 2007 and 2008, but is predicted to increase slightly due to the incident detection system expanding beyond FIRST coverage. Comparison—5th most incident delay of 29 metro areas, 2007.
Annual Express Transit Rider-ship—Express buses (all providers): light rail, commuter rail, van pools
N/A23.5
milliontracking indicator
Metro area express transit ridership grew by 15% from 2006 to 2009, surpassing overall transit growth of 4.5%. Capacity is growing with Northstar Commuter Rail and I35W Bus Rapid Transit, and future transitways.
g r e a t e r m i n n e s o t a m e t r o po l i t a n a n d r e g i o n a l m o b i l i t y
Greater Minnesota Bus Service Hours—Public transportation
1.03millionhours
projected
1.42 million hours2010
The bus service level is forecast to remain close to flat at the 2008 level through 2010, then gradually drop, while need rises, due to a growing gap between projected funding and transit service needs.
Railroad Track Speed—% of Miles of short-line RR above 25 mph
under review
38%2007
100% (Rail Plan target)
new measure16 short-line railroads provide cost-efficient access to world markets for Minnesota farms, mines and manufacturers. The State Rail Plan calls for upgrading tracks to 25 mph service.
c o m m u n i t y l i v a b i l i t y
ADA—Accessible Pedestrian Signals—% of state highway intersections with APS
under review
10%
100% over 20+ years
new measureDedicated funds and new design guidelines will gradual-
ly increase the 10% of state road intersections with accessible signals, and improve curb ramps, sidewalks and rest areas.
e n e r gy a n d t h e e nv i r o n m e n tTransportation Fuel Consump-tion—Billions of gallons sold in Minnesota
N/A3.05 billion
tracking indicator
Transportation produces 24% of greenhouse gas emissions in Minnesota. Fuel usage and vehicle miles travelled stopped growing in 2004, before the hike in gas prices, and declined steadily to 2009. Fuel use fell 8% from 2004 to 2009.
a c c o u n t a b i l i t y a n d t r a n s p a r e n cy
Construction Projects Put Out for Bid in the Year Scheduled
93% 90%93% of Mn/DOT construction projects scheduled for
2009 were let. As of January 2010, 198 federal ARRA projects valued at over $480 million were put out for bid.
Bet
ter
2005 2009
Bet
ter
2005 2009
Bet
ter
2008 2009
Bet
ter
2006 2009
Better
2004 2008B
ette
r
2004 2008
Better
2005 2009
Bet
ter
2005 2009
Better
2005 2009
Bet
ter
2006 2009
page 11

12

13
MeasuresDescription of the measure. [A more technical explanation is provided on pp 53-54.]
SystemDescribes the scope or system that the measure applies to
Why this is importantDescribes why Mn/DOT or partners have set a goal and a measure for this
TrafficFatalitiesTRAVELER SAFETY
What we are doing"What we are doing" is a broad assessment of how Mn/DOT and its partners approach work to improve results in the measure area.
Strategies The strategies section describes specific strate-gies and tactics Mn/DOT and other agencies employ to improve performance.
Investment/SpendingThis section describes the financial resources being directed towards specific measure areas. It is not intended as a replacement for official budget documents or as an accounting tool. Historical spending was primarily obtained from the appropriate Mn/DOT office or partner agen-cies. Estimates of future spending were provided by the office responsible for the measure or were generated as part of the Statewide 20-year Highway Investment Plan 2009-2028.
Our progressUsually accompanied by a performance graph or map, this section describes how well Mn/DOT or the transportation system is per-forming in relation to the measure and the reasons for the trends. If there is a perfor-mance target, it is shown.
How we decideMn/DOT's and its partners' decision-making processes are very elaborate. This section describes who makes decisions and the criteria used.
General measurement areaThis heading provides a simple label for each mea-surement area.
State Plan policy areaThis heading corresponds to the Statewide Transportation Policy for which the measure tracks performance.
How to Navigate this ReportEach performance measure area is displayed in a standard template over a two-page spread. A description of each section follows.
Learn moreIf you want to find out more about a particular measure and its related strategies for improvement, this section lists internet sources you can contact for more information. The list includes Mn/DOT con-tacts as well as the internet sites of many of transportation partners.
For comparisonProvides a ranking or comparison with other states, regions or nationally. Does not always compare using the exact methodology as the measure section it is in because identical data is not always available.
TargetLine
Target Line
2005 20102002 2003 2004 2006 20092007 2008 201320122011
Historic Performance Predicted Performance
Performance DataPerformance data is presented for a majority of the measures, usually in a bar chart.

14
MeasuresMinnesota Traffic Fatalities and Serious Injuries
SystemAll state and local roads (141,000 miles)
Why this is importantNationally, vehicle crashes are the leading cause of death for people younger than 35, and the fifth leading cause of death for all per-sons. On an average day in 2009, at least one person died on Minnesota highways and 91 were seriously injured. Serious injuries prevent walking, driving or continuing other activities in the manner prior to the injury. Mn/DOT and its partners have made reducing fatalities and severe injuries one of their highest priorities.
Traffic FatalitiesTRAVELER SAFETY
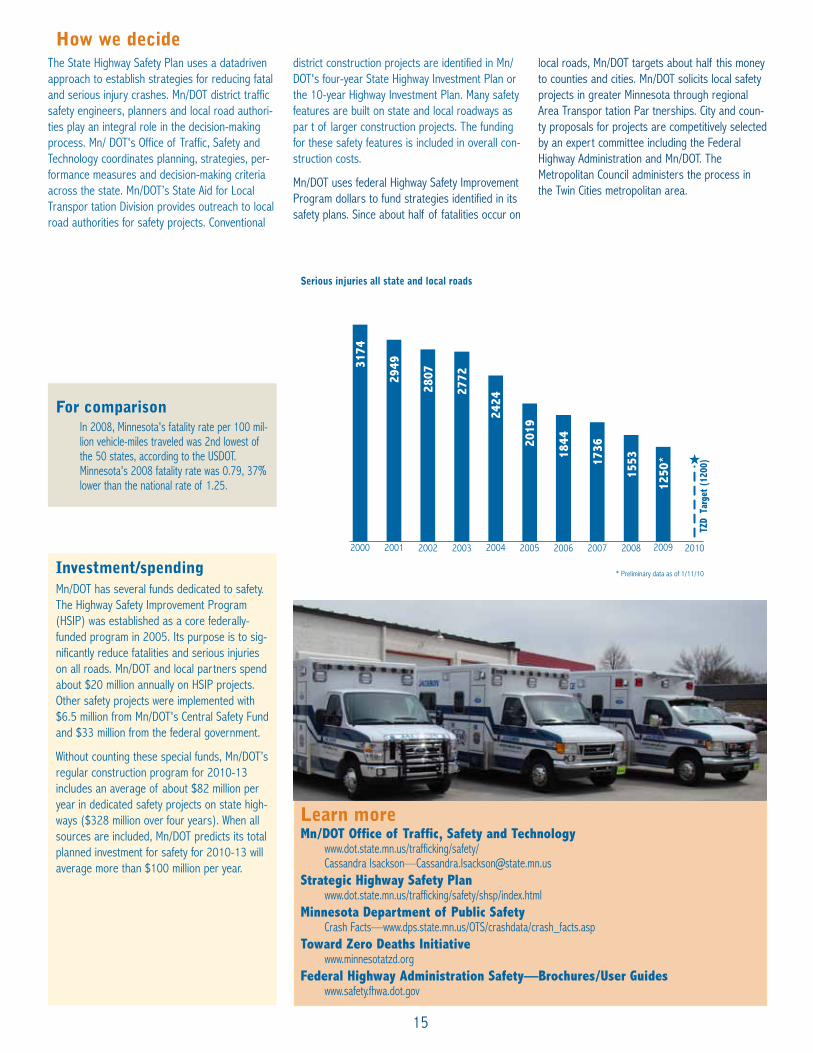
Our progressIn 2008, 455 people died in Minnesota traffic crashes—the fewest since 1945 and an 11 percent decrease from 2007. This achieved and surpassed the target of 500 traffic fatali-ties. The preliminary result for 2009 is a fur-ther decrease to 420. Serious injuries declined steadily from 3,460 in 1999 to 1,553 in 2008, and an estimated 1,250 in 2009.
As shown in the table below, Minnesota has reduced seven categories of fatalities that have been identified for aggressive strategies in the state’s highway safety plan and by new laws passed by the legislature. The largest reductions have been for drivers under 21 and unbelted drivers.
Average annual fatalities by type2001-05 2004-08 %Change
Under 21 144 101 -30%Unbelted 254 201 -21%Speeding related 170 141 -17%Single vehicle ROR 193 163 -16%Alcohol related 214 179 -16%Intersection 201 171 -15%Head-on/side-swipe
122 109 -11%
625
568
657
655
567
559
494
510
455
420
Prel
imin
ary
TZD
New
Targ
et (
400)
TZD Target (500)
2005 201020012000 2002 2003 2004 2006 20092007 2008
Minnesota traffic fatalities all state and local roads
Minnesota’s Toward Zero Deaths (TZD) partner-ship and Mn/DOT's Strategic Highway Safety Plan (SHSP) establish goals and strategies for reducing fatal and serious crashes. Minnesota’s TZD partner organizations are now aiming for new targets of 400 or fewer fatalities and 1,200 or fewer serious injuries by 2010. The Departments of Public Safety, Transportation, and Health lead the TZD initiatives. Other part-ners include the State Patrol, the Federal Highway Administration, Minnesota county engi-neers, the Center for Transportation Studies at the University of Minnesota and private sector participants. The partnership uses engineering, enforcement, education, and emergency trauma systems to accomplish its goals.
Strategies
In order to initiate projects that will systematical-ly implement safety strategies across entire jurisdictions, Mn/DOT’s eight districts and 87 counties will develop their own customized road safety plans by 2012. The plans will identify strategies based on local crash trends.
• Engineering—Low-cost systematic improvements such as rumble strips (see photo), intersection lighting and enhanced signing reduce highway injuries and deaths. To prevent deadly crossover crashes, cable median barriers have been installed state-wide on 179 miles of vulnerable four-lane divided roadways, such as I-94 from Maple Grove to St. Cloud. An additional 68 miles are currently planned for 2010 and 2011.
• Enforcement and education—The State Patrol and local law enforcement are influ-encing driver behavior by emphasizing enforcement of the new Primary Seat Belt Law and Booster Seat Law. Mn/DOT and the Department of Public Safety will continue the High Enforcement of Aggressive Traffic program for the next three years to reduce the number of speed related crashes.
• Emergency trauma systems—The Minnesota Department of Health is working with Minnesota hospitals and health care providers on new systems to transport crash victims rapidly to the right type of care to address their injuries.
What we are doing
15
Investment/spendingMn/DOT has several funds dedicated to safety. The Highway Safety Improvement Program (HSIP) was established as a core federally-funded program in 2005. Its purpose is to sig-nificantly reduce fatalities and serious injuries on all roads. Mn/DOT and local partners spend about $20 million annually on HSIP projects. Other safety projects were implemented with $6.5 million from Mn/DOT's Central Safety Fund and $33 million from the federal government.
Without counting these special funds, Mn/DOT’s regular construction program for 2010-13 includes an average of about $82 million per year in dedicated safety projects on state high-ways ($328 million over four years). When all sources are included, Mn/DOT predicts its total planned investment for safety for 2010-13 will average more than $100 million per year.
Learn moreMn/DOT Office of Traffic, Safety and Technology
www.dot.state.mn.us/trafficking/safety/ Cassandra Isackson—[email protected]
Strategic Highway Safety Planwww.dot.state.mn.us/trafficking/safety/shsp/index.html
Minnesota Department of Public SafetyCrash Facts—www.dps.state.mn.us/OTS/crashdata/crash_facts.asp
Toward Zero Deaths Initiativewww.minnesotatzd.org
Federal Highway Administration Safety—Brochures/User Guideswww.safety.fhwa.dot.gov
3174
2949
2807
2772
2424
2019
1844
1736
1553
1250
*
TZD
Tar
get (
1200
)
2005 201020012000 2002 2003 2004 2006 2007 2008 2009
* Preliminary data as of 1/11/10
Serious injuries all state and local roads
For comparisonIn 2008, Minnesota's fatality rate per 100 mil-lion vehicle-miles traveled was 2nd lowest of the 50 states, according to the USDOT. Minnesota's 2008 fatality rate was 0.79, 37% lower than the national rate of 1.25.
How we decide The State Highway Safety Plan uses a datadriven approach to establish strategies for reducing fatal and serious injury crashes. Mn/DOT district traffic safety engineers, planners and local road authori-ties play an integral role in the decision-making process. Mn/ DOT's Office of Traffic, Safety and Technology coordinates planning, strategies, per-formance measures and decision-making criteria across the state. Mn/DOT’s State Aid for Local Transpor tation Division provides outreach to local road authorities for safety projects. Conventional
district construction projects are identified in Mn/DOT's four-year State Highway Investment Plan or the 10-year Highway Investment Plan. Many safety features are built on state and local roadways as par t of larger construction projects. The funding for these safety features is included in overall con-struction costs.
Mn/DOT uses federal Highway Safety Improvement Program dollars to fund strategies identified in its safety plans. Since about half of fatalities occur on
local roads, Mn/DOT targets about half this money to counties and cities. Mn/DOT solicits local safety projects in greater Minnesota through regional Area Transpor tation Par tnerships. City and coun-ty proposals for projects are competitively selected by an expert committee including the Federal Highway Administration and Mn/DOT. The Metropolitan Council administers the process in the Twin Cities metropolitan area.

16
MeasuresStructural Condition of Bridges
SystemBridges over 20 feet and on State Highway Principal Arterials (2,876 bridges), which com-prises 85 percent of all state bridges, mea-sured by deck area
Why this is importantBridges provide critical economic links across Minnesota. Timely maintenance and replace-ment of bridges reduce long-term costs and ensure safety. Preserving the structural integ-rity of Minnesota’s bridges is a top priority for Mn/DOT. New directives and funding from the 2008 Legislature supported this goal.
Bridge ConditionINFRASTRUCTURE PRESERVATION
To meet guidelines set by the Legislature (Laws 2008, Chapter 152), Mn/DOT developed a bridge program to accelerate replacement and repair of a significant number of state bridges through 2018. The 2008 Legislature provided new funding and as a result approximately 40 fracture critical bridges and 80 structurally defi-cient bridges will be replaced or repaired. These numbers represent higher priority bridges with construction commencing after the Chapter 152 program was established. Twenty other bridges not included in the count either already had work underway before the Chapter 152 program started, or are not required to be addressed by the program but have work planned by 2018. By the end of the 2010 construction season 47 bridges in the program will be substantially com-plete.
Strategies• Mn/DOT manages state bridges to meet
performance targets, ensure safety and extend the life of bridges in good or satis-factory condition within the normal 70- to 80-year aging cycle shown in the graphic.
• Mn/DOT rehabilitates bridges to get full, efficient use during their service life. The condition of a bridge will decline over its first 40 years of use until rehabilitation is
needed. The rehabilitation project will bring the bridge back into good condition until it gradually deteriorates again and replace-ment is necessary.
Investment/spendingMn/DOT's investment in bridges has increased significantly during the last 12 years, from $45 million in 1998 to $152 million on average annually during the last three years. Under the Chapter 152 Bridge Program, Mn/DOT plans to invest an estimated $2.5 billion through 2018 for state bridges using about $1.3 billion in reg-ular state and federal funds and $1.2 billion in bonds sold by the state. In December 2009, an additional $30.3 million in bridge funding was provided by the 2009 American Recovery and Reinvestment Act.
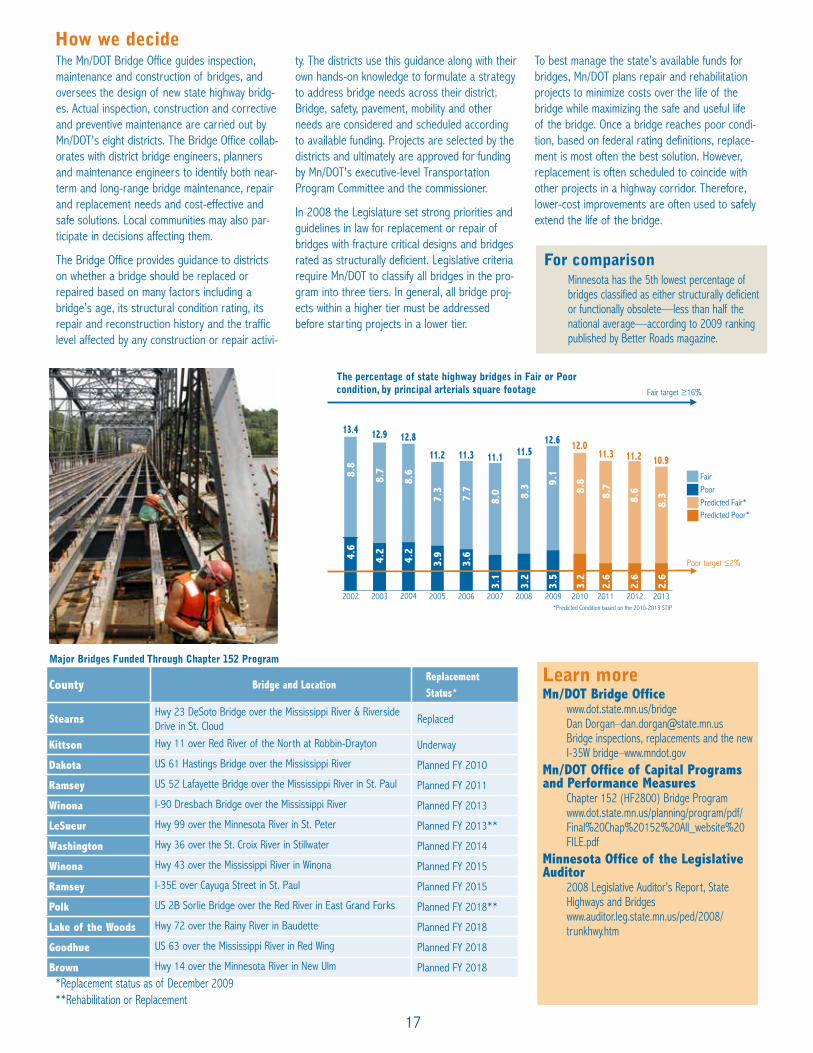
Our progressIn 2009, 87.4 percent of state principal arteri-al bridges were in Good or Satisfactory struc-tural condition, exceeding the target of 84 percent. Another 12.6 percent were in Fair or Poor condition well within the performance tar-get of 16 percent or less.
Mn/DOT has set a goal that the share of prin-cipal arterial bridges in Poor structural condi-tion be 2 percent or less. The Poor share was reduced to a new low of 3.1 percent in 2007, then rose slightly to 3.5 percent in 2009. Improvement is predicted based on the large 2010-13 construction program. Poor condition bridges are termed “structurally deficient” by the US Department of Transportation. They are safe to drive on, but are approaching the end of their useful lives. Unsafe bridges are closed promptly.
The percentage of state highway bridges in Good or Satisfactory condition, by principal arterials square footage
Bet
ter
Con
diti
on
Bridge life cycleYear 0
preventive maintenance
preventive maintenance
repairrehabilitation replace
Year 80 2004
$100
$200 2009
Bridge construction spending($ millions)
What we are doing
GoodSatisfactoryPredicted Good*Predicted Satisfactory*
Good and Satisfactorytarget ≥84%
*Predicted Condition based on the 2010-2013 STIP
53.3
33.3
51.8
53.3
53.3
53.9
55.2
53.4
53.2
53.8
35.3
33.9
35.5
34.8
33.7
35.1
34.2
34.2
54.3
54.4
54.6
34.4
34.5
34.4
86.6 87.1 87.2 88.8 88.7 88.9 88.5 87.4 88.0 88.7 88.8 89.1
2005 20102002 2003 2004 2006 20092007 2008 201320122011
17
The percentage of state highway bridges in Fair or Poor condition, by principal arterials square footage
Major Bridges Funded Through Chapter 152 Program
Fair
*Predicted Condition based on the 2010-2013 STIP
PoorPredicted Fair*Predicted Poor*
Poor target ≤2%
Fair target ≥16%
8.8
4.6
8.7
8.6
7.3
7.7
8.0 8.3 9.1
8.8
4.2
4.2
3.9
3.6
3.1
3.2
3.2
3.5
8.7
8.6
8.3
2.6
2.6
2.6
13.4 12.9 12.8
11.2 11.3 11.1 11.512.6 12.0
11.3 11.2 10.9
2005 20102002 2003 2004 2006 20092007 2008 201320122011
The Mn/DOT Bridge Office guides inspection, maintenance and construction of bridges, and oversees the design of new state highway bridg-es. Actual inspection, construction and corrective and preventive maintenance are carried out by Mn/DOT's eight districts. The Bridge Office collab-orates with district bridge engineers, planners and maintenance engineers to identify both near-term and long-range bridge maintenance, repair and replacement needs and cost-effective and safe solutions. Local communities may also par-ticipate in decisions affecting them.
The Bridge Office provides guidance to districts on whether a bridge should be replaced or repaired based on many factors including a bridge’s age, its structural condition rating, its repair and reconstruction history and the traffic level affected by any construction or repair activi-
ty. The districts use this guidance along with their own hands-on knowledge to formulate a strategy to address bridge needs across their district. Bridge, safety, pavement, mobility and other needs are considered and scheduled according to available funding. Projects are selected by the districts and ultimately are approved for funding by Mn/DOT's executive-level Transportation Program Committee and the commissioner.
In 2008 the Legislature set strong priorities and guidelines in law for replacement or repair of bridges with fracture critical designs and bridges rated as structurally deficient. Legislative criteria require Mn/DOT to classify all bridges in the pro-gram into three tiers. In general, all bridge proj-ects within a higher tier must be addressed before starting projects in a lower tier.
To best manage the state's available funds for bridges, Mn/DOT plans repair and rehabilitation projects to minimize costs over the life of the bridge while maximizing the safe and useful life of the bridge. Once a bridge reaches poor condi-tion, based on federal rating definitions, replace-ment is most often the best solution. However, replacement is often scheduled to coincide with other projects in a highway corridor. Therefore, lower-cost improvements are often used to safely extend the life of the bridge.
Learn moreMn/DOT Bridge Office
www.dot.state.mn.us/bridge Dan Dorgan–[email protected] Bridge inspections, replacements and the new I-35W bridge–www.mndot.gov
Mn/DOT Office of Capital Programs and Performance Measures
Chapter 152 (HF2800) Bridge Program www.dot.state.mn.us/planning/program/pdf/Final%20Chap%20152%20All_website%20FILE.pdf
Minnesota Office of the Legislative Auditor
2008 Legislative Auditor’s Report, State Highways and Bridges www.auditor.leg.state.mn.us/ped/2008/trunkhwy.htm
How we decide
County Bridge and LocationReplacement Status*
StearnsHwy 23 DeSoto Bridge over the Mississippi River & Riverside Drive in St. Cloud
Replaced
Kittson Hwy 11 over Red River of the North at Robbin-Drayton Underway
Dakota US 61 Hastings Bridge over the Mississippi River Planned FY 2010
Ramsey US 52 Lafayette Bridge over the Mississippi River in St. Paul Planned FY 2011
Winona I-90 Dresbach Bridge over the Mississippi River Planned FY 2013
LeSueur Hwy 99 over the Minnesota River in St. Peter Planned FY 2013**
Washington Hwy 36 over the St. Croix River in Stillwater Planned FY 2014
Winona Hwy 43 over the Mississippi River in Winona Planned FY 2015
Ramsey I-35E over Cayuga Street in St. Paul Planned FY 2015
Polk US 2B Sorlie Bridge over the Red River in East Grand Forks Planned FY 2018**
Lake of the Woods Hwy 72 over the Rainy River in Baudette Planned FY 2018
Goodhue US 63 over the Mississippi River in Red Wing Planned FY 2018
Brown Hwy 14 over the Minnesota River in New Ulm Planned FY 2018*Replacement status as of December 2009**Rehabilitation or Replacement
For comparisonMinnesota has the 5th lowest percentage of bridges classified as either structurally deficient or functionally obsolete—less than half the national average—according to 2009 ranking published by Better Roads magazine.
18
MeasuresCustomer Ride Quality–Percent of miles in Good and Poor condition
SystemState Highway Principal Arterials (7,565 road-way miles, 53% of total—the highest traffic volume roads)
State Highway Non-Principal Arterials (6,751 roadway miles, 47% of total) mostly in Greater Minnesota
Why this is importantPreserving the functional and structural integ-rity of Minnesota’s highways is a priority for Mn/DOT. Timely repair and replacement reduce long-term costs. Also, Mn/DOT customer research has found that Minnesotans’ satisfac-tion with overall state highway maintenance is greatly affected by the smoothness of the ride.
Pavement ConditionINFRASTRUCTURE PRESERVATION
Mn/DOT's objective is to preserve the structural integrity of its pavements in Good condition and minimize the share in Poor Condition by doing preventive maintenance, rehabilitation and replacement at the right times. Once pavements are in Poor condition, the options for cost effec-tive repair are limited. To minimize life-cycle costs, pavement engineers recommend the most cost-effective treatment for every segment of state road to help achieve the twin objectives of smooth ride and maximum service life.
StrategiesMn/DOT is continually pursuing better ways to get more value for each dollar invested in pave-ment and to build longer lasting pavements. Strategies include:
• Low-cost maintenance and repair—Using recycled materials, innovative pave-ment designs (such as thin concrete over-lays and full-depth reclamation), or deploy-ing low-cost preventive maintenance treat-ments (such as chip seals and micro-sur-facing).
• Performance-based design—“Right-sizing” pavement projects to focus on meeting pavement and safety performance needs, not overbuilding to meet all other standards.
• Research—Mn/DOT is a lead partner in the MnROAD facility, located on I-94, near Albertville. MnROAD is a world-class research facility dedicated to testing new and innovative types of construction and pavement materials.
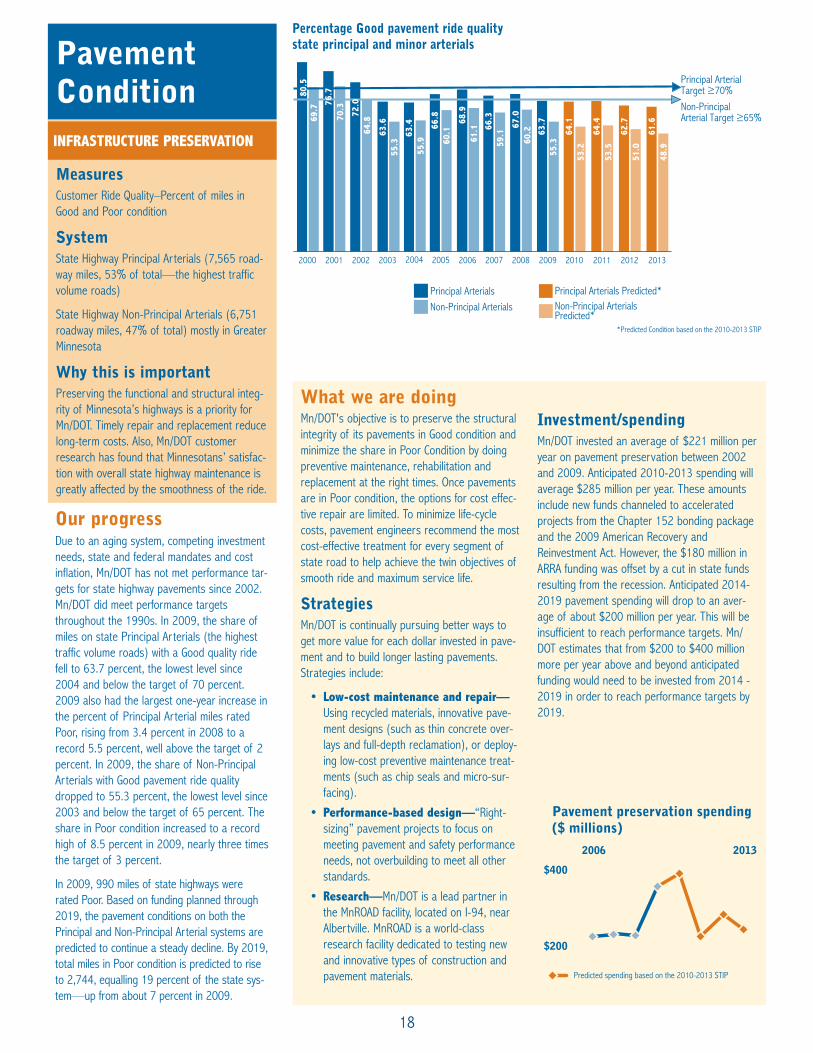
Investment/spendingMn/DOT invested an average of $221 million per year on pavement preservation between 2002 and 2009. Anticipated 2010-2013 spending will average $285 million per year. These amounts include new funds channeled to accelerated projects from the Chapter 152 bonding package and the 2009 American Recovery and Reinvestment Act. However, the $180 million in ARRA funding was offset by a cut in state funds resulting from the recession. Anticipated 2014-2019 pavement spending will drop to an aver-age of about $200 million per year. This will be insufficient to reach performance targets. Mn/DOT estimates that from $200 to $400 million more per year above and beyond anticipated funding would need to be invested from 2014 - 2019 in order to reach performance targets by 2019.
Our progressDue to an aging system, competing investment needs, state and federal mandates and cost inflation, Mn/DOT has not met performance tar-gets for state highway pavements since 2002. Mn/DOT did meet performance targets throughout the 1990s. In 2009, the share of miles on state Principal Arterials (the highest traffic volume roads) with a Good quality ride fell to 63.7 percent, the lowest level since 2004 and below the target of 70 percent. 2009 also had the largest one-year increase in the percent of Principal Arterial miles rated Poor, rising from 3.4 percent in 2008 to a record 5.5 percent, well above the target of 2 percent. In 2009, the share of Non-Principal Arterials with Good pavement ride quality dropped to 55.3 percent, the lowest level since 2003 and below the target of 65 percent. The share in Poor condition increased to a record high of 8.5 percent in 2009, nearly three times the target of 3 percent.
In 2009, 990 miles of state highways were rated Poor. Based on funding planned through 2019, the pavement conditions on both the Principal and Non-Principal Arterial systems are predicted to continue a steady decline. By 2019, total miles in Poor condition is predicted to rise to 2,744, equalling 19 percent of the state sys-tem—up from about 7 percent in 2009.
Percentage Good pavement ride quality state principal and minor arterials
2006
$200
$400
2013
Pavement preservation spending($ millions)
Predicted spending based on the 2010-2013 STIP
Non-PrincipalArterial Target ≥65%
Principal ArterialTarget ≥70%
Principal Arterials Non-Principal Arterials
Principal Arterials Predicted*Non-Principal ArterialsPredicted*
*Predicted Condition based on the 2010-2013 STIP
2005 2010 2011 2012 20132002 2003 20042000 2001 2006 20092007 2008
72.0
63.6
63.4 66.8 68.9
66.3
67.0
63.7
64.1
80.5
76.7
64.8
55.3
55.9 60.1
61.1
59.1
60.2
55.3
53.2
64.4
53.5
62.7
51.0
61.6
48.9
69.7
70.3
What we are doing

19
For comparisonAccording to USDOT data for 2008 corrected for Minnesota, 2.7% of Minnesota Interstate miles were rated in Poor condition compared to 1.6% of US miles. 55.3% of Minnesota Interstates were rated Good, versus 72.6% for the US. Minnesota ranked in the bottom quarter of the 50 states for both.
How we decideDecisions to invest in state highway pavements are guided by a combination of each Mn/DOT district’s hands-on knowledge, common state-wide policies, performance measures and tar-gets in the Statewide Transportation Plan and 20-year Highway Investment Plan, and Mn/DOT executive level guidance.
Mn/DOT's Materials Office in Maplewood mea-sures the physical condition of state roads every year and provides the data to districts. District pavement engineers and planners analyze the data, evaluate the percentage of highways in “Good” and “Poor” condition and recommend a pavement investment goal. Districts with a higher percentage of roadways failing to meet targets are expected to invest more if funds are available.
Districts annually update four-year construc-tion programs and 10-year plans. They identi-fy potential pavement projects, perform field reviews and exercise engineering judgment to narrow options. They then select projects and scope them to establish a definitive cost. Other needs, such as safety, are added if con-sistent with the purpose of the project. When funds are limited, districts sometimes choose short-term repair over recommended major rehabilitation of a roadway.
Learn moreMn/DOT Office of Materials and Road Research
www.state.mn.us/materials/index.htmlKeith Shannon—[email protected]
Mn/DOT Pavement Condition InformationPublications and Pavement Condition Mapswww.dot.state.mn.us/materials/pvmtmgmt.html
Minnesota Statewide Transportation Plan: 2009-2028 www.dot.state.mn.us/planning/stateplan
Mn/DOT Office of Multimodal PlanningMark Nelson—[email protected]
Statewide 20-year Highway Investment Plan 2009-2028Peggy Reichert—[email protected]
Principal Arterials Non-Principal Arterials
Principal Arterials Predicted*Non-Principal ArterialsPredicted*
Non-PrincipalArterial Target ≤3%
Principal ArterialTarget ≤2%
*Predicted Condition based on the 2010-2013 State Transportation Investment Plan0.7
2005 2010 2011 2012 20132002 2003 20042000 2001 2006 20092007 2008
2.0 2.6
2.7
2.6
2.3 2.6 3.4
5.5
5.3
1.5
2.4
4.3 4.9
4.8 5.2
6.5
5.9
8.5 9.0
5.2
9.8
5.9
11.5
6.6
13.7
2.9
2.1
Percentage Poor pavement ride quality state principal and minor arterials
State Percent Good Percent Poor
MN 55.3% 2.7%
WI 60.0% 2.0%
IA 59.4% 1.8%
SD 66.5% 0.0%
ND 90.0% 0.0%
2008 Midwest States Interstate Pavement Condition
Source: USDOT data corrected for Minnesota

20
MeasureFrequency of achieving bare lane within target-ed number of hours
SystemState Highways (approximately 30,000 lane miles)
Why this is importantThe safety of Minnesota’s traveling public is the primary goal of Mn/DOT’s snow and ice removal operations. Citizens expect to be able to carry out normal activities through most weather events and to have transportation facilities that safely accommodate travel shortly after the event has passed. Effective snow and ice management also reduces congestion caused by weather.
Snow & Ice Management
MAINTENANCE
Our progressMn/DOT met its target range for snow and ice clearance time 68 percent of the time in the winter of 2008-2009, which was short of its 70 percent target. The chart above shows the frequency Mn/DOT achieved bare lanes within the targeted number of hours, for all events and all routes, for the 2001-02 to 2008-09 winter seasons. The severely cold tempera-tures in the months of December 2008 and January 2009 caused Mn/DOT to fall below tar-get of 70 percent for the first time in eight years.
Mn/DOT groups all state roads into one of five categories based on traffic volume and has a target clearance time for each. The Snow and Ice Route Classifications table shows each cat-egory, along with average daily traffic volumes, target clearance times and average clearance times for the 2008-09 winter season. Though Mn/DOT did not meet all these targets last year, historically it has met targets for each roadway category as measured as an average regain time for all storms over the entire sea-son. Temperatures, duration of snowfall and other highly variable conditions mean that Mn/DOT may not meet targets for every storm.
Target 70%
2001-02 2002-03 2003-04 2004-05 2005-06 2006-07 2007-08 2008-09
76.8% 84
.9%
74.6%
76.2%
77.5%
79.0%
75.0%
68.3%
Frequency of achieving bare lane within targeted number of hours
Snow and ice services are delivered on more than 30,000 lane miles of state highway by more than 1,500 snowfighters in eight districts. Mn/DOT puts a high priority on meeting snow and ice performance targets. To counteract ris-ing fuel and material costs, Mn/DOT uses tech-nology to increase efficiency. The department regularly tests and adopts innovative strategies to monitor road conditions, prevent ice build-up and remove snow and ice.
Additionally, Mn/DOT is committed to addressing the environmental concerns of using chemicals with its snow and ice service. Mn/DOT takes a strong position for chemical conservation through training, technology and research of new chemical materials. A focus of training is using the right chemical, at the right time, and in the right amount. Both anti-icing and pre-wetting technologies, described below, are proven strat-egies in lowering chemical use. Finally, Mn/DOT’s maintenance research program continually brings forth new ways to improve maintenance operations.
Strategies
Three effective techniques Mn/DOT uses to inhibit ice formation and improve the roadway surface for plowing include:
• Anti-icing—Prevents the formation of
frost and bonding between snow and ice and the pavement surface. Anti-icing chemi-cals are primarily liquids applied before or early in a snowfall.
• Pre-wetting—Adds brine or other com-mercial chemical solutions to the salt and sand mixture. This causes the mixture to stick to the road instead of blowing off to the shoulder or into the ditch.
• De-icing—Uses chemical or mechanical means to break the bond that has formed between ice and the pavement surface.
Mn/DOT continues to advance the use of Automatic Vehicle Locating technologies in winter snow and ice services. AVL, a global positioning based system, allows tracking of resources, including chemical and material usage, as well as monitoring truck deployment. Mn/DOT is also implementing the use of an in-cab expert system called Maintenance Decision Support System to aid snowfighters in decisions about chemical type and application rates.
Another technique Mn/DOT uses to control snow and ice on roadways is living snow fences. Living snow fences are plantings of trees, shrubs and native grasses located along highways. Properly designed and placed, these living barriers trap snow as it blows across fields before it reaches the highway. There are a total of 239 living snow
What we are doing

21
How we decidePerformance management tools are entrenched in Mn/DOT snow and ice services with a strong statewide structure of measures and targets. They were developed coopera-tively by Mn/DOT’s districts in the 1990s with the aid of customer research and past experi-ence.
District maintenance engineers and supervi-sors who understand local conditions make operations decisions such as scheduling plows and drivers. They, along with snowplow drivers, evaluate results after snow events. One evaluation tool is post-storm mapping, such as the map from District 1 to the right. Mn/DOT managers receive monthly district and statewide reports on results and expendi-tures throughout the winter season.
Mn/DOT supervisors and maintenance engi-neers work together statewide to compare practices and implement technology, innova-tions and best practices. Key to Mn/DOT’s success at meeting its plowing targets is its extensive training, use of technology, and the commitment of its work force. District staff receive technical assistance from Mn/DOT’s Office of Maintenance, which also provides support services to districts for such needs as contracts for sand, salt, chemicals and equipment; training for snowfighters, equip-ment purchasing and snow plow fabrication.
Learn moreMn/DOT Office of Maintenance
www.dot.state.mn.us/maintenance/Steven Lund—[email protected]
Minnesota Department of TransportationSnow and Ice Facts—www.dot.state.mn.us/workzone/snowicefacts.html
Winter Driving and Safety Tips—www.dot.state.mn.us/workzone
Highway Systems Operations Plan—www.dot.state.mn.us/planning/program/hsop.html
fences along Mn/DOT maintained highways aver-aging one-fourth of a mile long.
Investment/spendingFunding for snow and ice is a top priority for all districts and fluctuates depending on the severi-ty of the winter. Funding for district winter ser-vices comes directly from the district operating budget. In severe winters, districts may redirect summer maintenance dollars to winter snow-plowing activities. Fluctuating prices for com-modities, such as salt and diesel fuel, can also greatly impact snow and ice expenditures. Mn/DOT spent $67.5 million on snow and ice control during the 2008-09 winter season, which is the highest of any season on record.
Strategies (Cont.)
Snow and ice route classifications
2005
$40
$70
Snow and ice expenditures($ millions)
2009
Post-storm snow & ice map for District 1 December 22 - 29, 2009
Roadway categoryAverage daily
trafficTarget clearance
time
2008-2009 Average clearance
time
Super commuter Over 30,000 0 to 3 hours 3.2 hours
Urban commuter 10,000 - 30,000 2 to 5 hours 6.6 hours
Rural commuter 2,000 - 10,000 4 to 9 hours 9.6 hours
Primary collector 800 - 2,000 6 to 12 hour 12.7 hours
Secondary collector Under 800 9 to 36 hours 16.2 hours
53
70
232
23
18
23
332
217
194
169
123
73
7365
200
61
48
38
3373
2727
6
11
65
1135
61
210
37
169
35
35
2
2
169
16953
53
Pine City
Sandstone
Nopeming
Pike LakeFloodwood
McGregor Moose Lake
Two Harbors
Duluth
Grand Marais
Grand RapidsHibbing
Virginia
CookDeerLake
Ely
InternationalFalls
LittleFalls
Silver Bay
Truck stationsDistrict HeadquartersOver ExpectationMeets ExpectationUnder ExpectationSignificantly Under ExpectationNo Data Recorded
District Sub-Areas Border Duluth Lakes Range Shore South
Carlton
22
MeasureBridge Safety Inspections—percent completed on time
SystemAll state highway bridges over 20 feet in length (3,657 bridges)
Why this is importantA safe transportation system is a fundamental goal of Mn/DOT and a key component of sys-tem safety is the structural integrity of Minnesota bridges. A thorough and systematic inspection program allows Mn/DOT to identify changes in the condition of bridges and to establish a timely, effective bridge maintenance and rehabilitation program. Both state and federal laws require scheduled safety inspec-tion and evaluation of all highway bridges.
Bridge Safety InspectionsMAINTENANCE
Mn/DOT employs a variety of methods to main-tain a high-quality bridge inspection and mainte-nance program. Mn/DOT started a statewide program of bridge preventive maintenance in 2004 and has recently improved its corrective maintenance program (repairs in response to emergencies or problems) through new proce-dures for identifying and tracking work. Mn/DOT dedicated a portion of state operating funds obtained through legislation to reactive mainte-nance work and a statewide increase in bridge staffing.
Strategies• Staffing—The foundation of a sound
bridge management program is a team of certified inspectors and other bridge main-tenance personnel. During the past two years, Mn/DOT has been increasing bridge staffing levels with new state funding pro-vided in 2008.
• Corrective maintenance—Corrective bridge maintenance has always been a key responsibility of district bridge staff. To improve this function, Mn/DOT recently implemented formal procedures for identi-fying, prioritizing and verifying the comple-tion of bridge reactive maintenance work.
• Preventive maintenance—Mn/DOT initi-ated a statewide program of bridge pre-ventive maintenance in 2004 and obtained new funds from the Legislature to support it in 2006. Preventive maintenance, per-formed by Mn/DOT’s eight districts, includes such activities as washing off win-ter salt and painting and filling joints, which extend the life of bridges and help maintain the target percentage of bridges in good and satisfactory condition.
• Status reports—Mn/DOT has initiated new Web-based planning and status
reports available to all district bridge inspectors in addition to periodic inspection meetings with district bridge personnel.
• Field reviews—Assessments of district inspection procedures are conducted annu-ally during the National Bridge Inspection Standards field reviews. This is a joint effort between Mn/DOT’s Bridge Office and FHWA to ensure the state’s inspection pro-gram remains in compliance with state and federal laws.
Investment/spendingExpenditures for bridge repair and maintenance increased starting in FY 2006. One of the ser-vices targeted was bridge preventive mainte-nance. Expenditures for bridge inspection peaked in FY 2008 when the Governor mandat-ed accelerated inspections for all bridges after the I-35W Bridge collapse. This coincided with a 2006 change in federal regulations that increased the inspection frequency for fracture critical bridges. Additionally, bridge inspection and maintenance were one of Mn/DOT’s priori-ties for a portion of the new operating funds allocated by the Legislature starting in FY 2009.
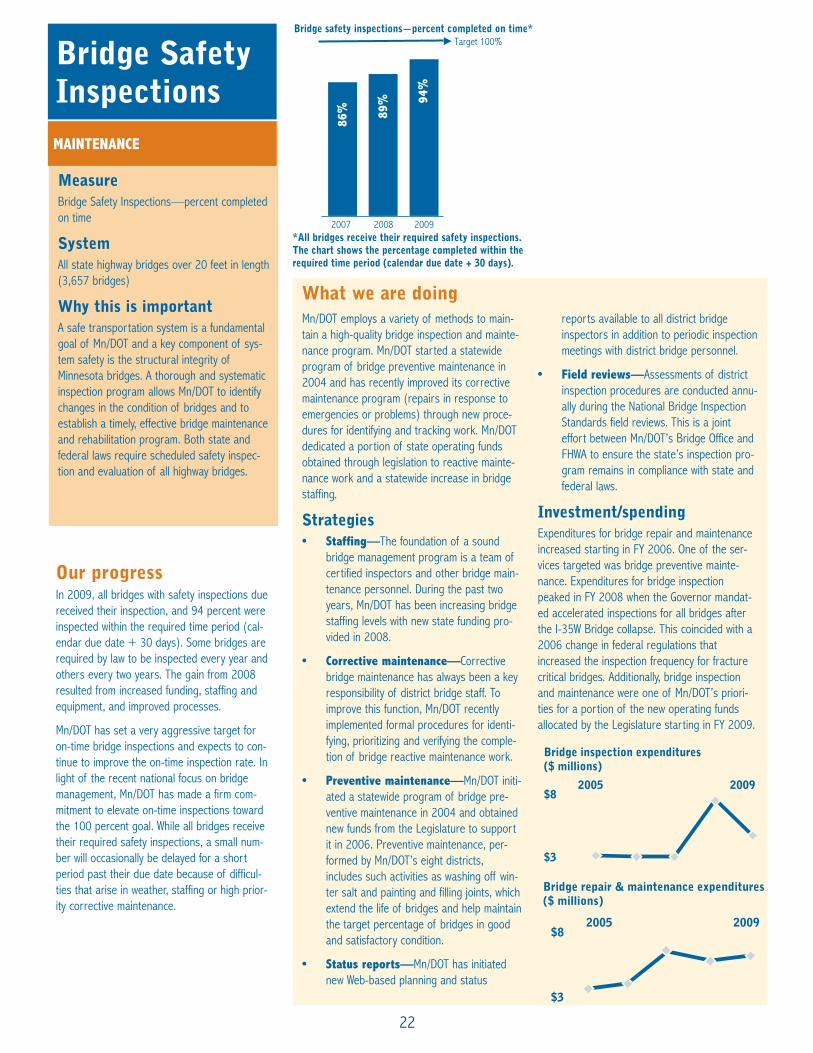
Our progressIn 2009, all bridges with safety inspections due received their inspection, and 94 percent were inspected within the required time period (cal-endar due date + 30 days). Some bridges are required by law to be inspected every year and others every two years. The gain from 2008 resulted from increased funding, staffing and equipment, and improved processes.
Mn/DOT has set a very aggressive target for on-time bridge inspections and expects to con-tinue to improve the on-time inspection rate. In light of the recent national focus on bridge management, Mn/DOT has made a firm com-mitment to elevate on-time inspections toward the 100 percent goal. While all bridges receive their required safety inspections, a small num-ber will occasionally be delayed for a short period past their due date because of difficul-ties that arise in weather, staffing or high prior-ity corrective maintenance.
2005
$3
$8
Bridge inspection expenditures ($ millions)
2009
Bridge safety inspections—percent completed on time*Target 100%
2007 2008 2009
94%
86% 89%
2005
$3
$8
Bridge repair & maintenance expenditures($ millions)
2009
*All bridges receive their required safety inspections. The chart shows the percentage completed within the required time period (calendar due date + 30 days).
What we are doing
23
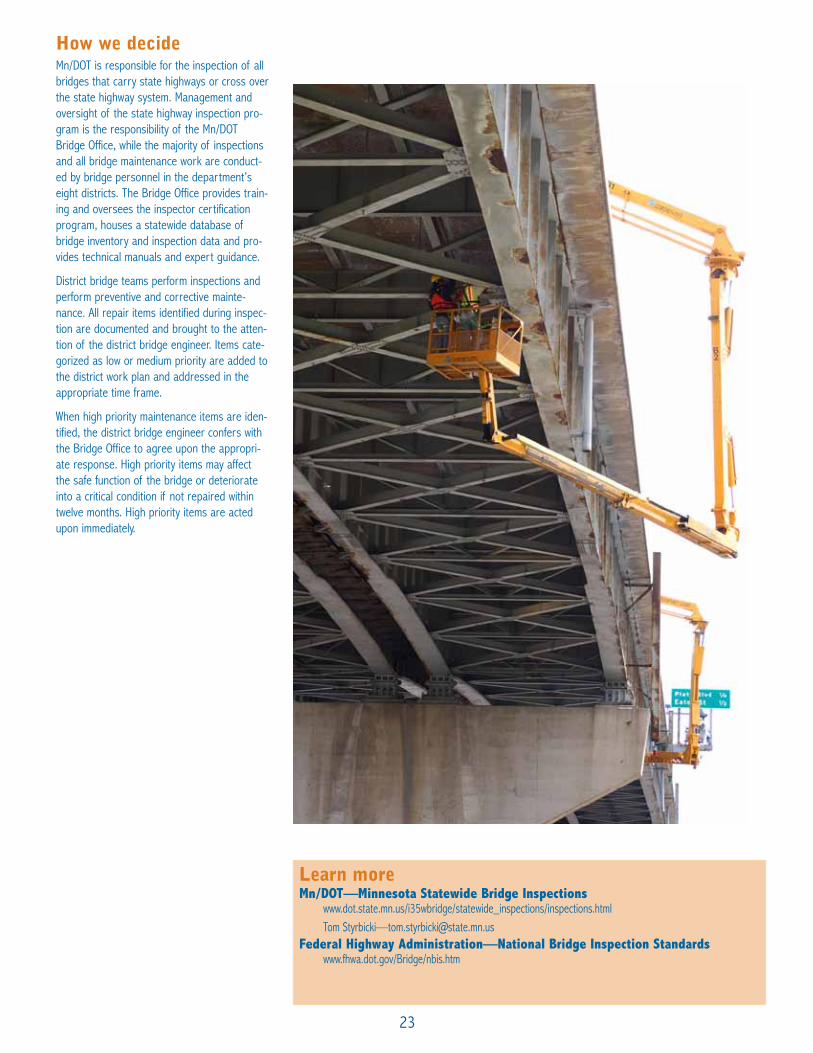
How we decide Mn/DOT is responsible for the inspection of all bridges that carry state highways or cross over the state highway system. Management and oversight of the state highway inspection pro-gram is the responsibility of the Mn/DOT Bridge Office, while the majority of inspections and all bridge maintenance work are conduct-ed by bridge personnel in the department’s eight districts. The Bridge Office provides train-ing and oversees the inspector certification program, houses a statewide database of bridge inventory and inspection data and pro-vides technical manuals and expert guidance.
District bridge teams perform inspections and perform preventive and corrective mainte-nance. All repair items identified during inspec-tion are documented and brought to the atten-tion of the district bridge engineer. Items cate-gorized as low or medium priority are added to the district work plan and addressed in the appropriate time frame.
When high priority maintenance items are iden-tified, the district bridge engineer confers with the Bridge Office to agree upon the appropri-ate response. High priority items may affect the safe function of the bridge or deteriorate into a critical condition if not repaired within twelve months. High priority items are acted upon immediately.
Learn moreMn/DOT—Minnesota Statewide Bridge Inspections
www.dot.state.mn.us/i35wbridge/statewide_inspections/inspections.htmlTom Styrbicki—[email protected]
Federal Highway Administration—National Bridge Inspection Standardswww.fhwa.dot.gov/Bridge/nbis.htm

24
Mn/DOT’s eight districts are responsible for the maintenance and operations of their state highways and bridges. Using numerous tools to measure and manage maintenance performance, all districts work toward common statewide targets.
Strategies Strategies to improve Mn/DOT's maintenance perfor-mance include:
Maintenance research/new technology—Maintenance performance is improved through Mn/DOT’s maintenance research program and commit-ment to new technology. Recent examples relate to the snow and ice area and include the “tow plow”, a pull behind snow plow blade that clears more road surface with the same labor resources. Anti-icing is a technology that provides chemical pre-treating of roadways and bridge surfaces ahead of a winter storm event. The Maintenance Decision Support System, in early stages of implementation, is an in-cab computer based tool that will aid snowfighters in combating winter storms through storm tracking, pre-diction and chemical application recommendations.
Maintenance best practices—Best practices are proven-effective processes or tools that are replicated across multiple Mn/DOT districts or offices. There are three fully deployed best practices in the maintenance area that have become standard Mn/DOT practice including: use of automatic pothole patchers (see
photo); pre-wetting of winter materials; and snowplow underbody plows. Several other maintenance best practices are in various stages of deployment.
Monitoring and reporting tools—Yearly perfor-mance information is reported for key activities in each district and statewide. Reporting includes Pavement Condition; Bridge Inspection and Maintenance; Drainage; Signing; Striping; Fleet Management; and others. Snow and ice removal per-formance is reported monthly during the winter sea-son.
Training—Mn/DOT has a strong commitment to maintenance training. Two examples include Mn/DOT's annual snowfighter boot camps for new recruits and annual refresher training for all snowfighters; and yearly training in roadside vegetation management.
Market research—Mn/DOT uses yearly market research to gauge customer satisfaction with mainte-nance services. Information is tracked on an annual basis and monitored over time. More in-depth cus-tomer market research is completed on a periodic basis to better understand customer needs and desires. Market research has helped identify appropri-ate Levels of Service for winter plowing and assisted with funding trade-offs for non-safety services.
Investment/spending
In FY 2006 Mn/DOT requested and received approval
to shift a portion of the State Road Construction funds to the Operations and Maintenance budget. This shift, based on recommendations in the 2005 Highway Systems Operation Plan, began in FY 2006 and is being used for specific services such as pavement patching and bridge preventive maintenance.
In FY 2009, the Legislature added funding for Operations and Maintenance through Chapter 152. With this increase Mn/DOT is addressing high priority maintenance needs including snow and ice removal; bridge inspection and mainte-nance; pavement and drainage maintenance; and safety and traffic operations.
The following chart shows Mn/DOT’s overall Infrastructure Operations and Maintenance spending from FY 2004 to FY 2009. This includes snow plowing and maintenance for pave-ment, roadsides and bridges, as well as traffic management, fleet and facilities maintenance.
What we are doing
MeasureCustomer Satisfaction with State Highway Maintenance on a scale from 1 to 10
SystemState Highways (approximately 30,000 lane miles)
Why this is importantMaintaining the transportation system is critical to the safety and mobility of the traveling pub-lic. Maintenance activities keep the system operating in all weather and traffic conditions, and are also central to extending infrastructure life and lowering overall ownership costs. This is especially important as much of the highway system is aging and nearing the end of its design life.
Customer SatisfactionMAINTENANCE, OPERATIONS AND SECURITY Target 7.0
Neu
tral
Satis
ified
Not
Satis
ified
2001 2002 2003 2004 2005 2006 2008 2009Note: No omnibus survey conducted in 2007
5.0
7.0
10.0
6.3
6.3
6.4 6.6
6.6
6.2 6.4
6.0
Customer satisfaction with state highway maintenance (1-10 Scale) Omnibus Survey
2005
$200
$275
Infrastructure operations andmaintenance expenditures($ millions)
2009
Overall customer satisfaction with state highway maintenance slipped in 2009 to 6.0, down from 6.4 in 2008. These results are below the 7.0 tar-get, but are in the neutral zone of the 1-10 scale. Survey data indicates Mn/DOT’s overall mainte-nance score is heavily influenced by the smooth surface rating. Notably, the condition of the state's pavement has been declining since 2002.
Customer satisfaction survey data from 2003 to 2009 indicate that most specific maintenance ser-vices, such as snow and ice, have positive ratings above the 7.0 target and are generally stable (see chart opposite). Smooth surface continues to rate the lowest, close to the level of overall road maintenance customer satisfaction.
Our progress

25
How we decide Mn/DOT district managers make maintenance decisions based on several factors including field measures, safety and engineering con-cerns, customer input and budget. The opera-tions and maintenance budget is distributed to the eight Mn/DOT districts to provide opera-tions and maintenance services. Generally, maintenance and operations needs are greater than the available dollars, so district managers prioritize services based on safety and condi-tions in their districts. For instance, snow and ice removal is a safety service for Mn/DOT and is normally funded to the level necessary to meet snow and ice targets. This may impact summer maintenance services following partic-ularly harsh winters.
Past market research has measured the importance of many maintenance services. Customers consistently rate mowing and elimi-nating roadside weeds as significantly less important than maintenance of the road itself. Because of that finding, Mn/DOT reduced efforts in those areas and redirected resources where there is a higher perceived value such as snow and ice removal, clearly visible roadway markings, and road sur-faces.
Though each district prioritizes their mainte-nance needs, district maintenance managers coordinate on issues of statewide concern to improve Mn/DOT’s maintenance practices while working toward common statewide targets.
Learn moreMn/DOT Office of Maintenance
www.dot.state.mn.us/maintenance/ Steven Lund—[email protected]
Pothole informationwww.dot.state.mn.us/information/potholes/index.html
Mn/DOT Market ResearchKarla Rains—[email protected]
Mn/DOT road maintenance customer satisfaction ratings(1-10 Scale) Omnibus Survey
Target 7.0
7.9
7.57.1
6.7
6.06.0
Signs
Str ip ing
L i t ter
SmoothSurface
Snow & Ice
Overal l
Sati
sifi
ed
20
09
Sco
re
Neu
tral
20035.0
6.0
7.0
8.0
9.0
10.0
2004 2005 2006 2008 2009Note: No omnibus survey conducted in 2007

26
Mn/DOT’s Office of Aeronautics works with the Local Airline Service Action Committee, the Metropolitan Airports Commission, and other partners to maintain and improve air service in Minnesota by investing in airport infrastructure. LASAC is made up of representatives of the cit-ies in Minnesota that have air service.
Strategies • Support cities efforts to attract airline ser-
vice.
• Invest to create more secure and passen-ger friendly terminal buildings.
• Develop the potential of Greater Minnesota airports
• Continue the Air Service Marketing Program
Investment/spendingCommercial service airports receive a larger share of FAA Airport Improvement Program funds than do airports without airline service. This funding allows airlines to operate more effectively by providing enhanced airfield and terminal configurations at public airports. In addition, the Greater Minnesota communities with air service are eligible to apply for an Air Service Marketing Grant. Funding for this program comes from the State Airports Fund and has an appropriation of $200,000 biennially.
What we are doing
MeasuresNumber of national and international air desti-nations served by nonstop flights from Minnesota
SystemMinnesota commercial service airports–8 (Minnesotans are also served by airports that offer commercial service in adjacent states.)
Why this is importantMaintaining gateways to the nation and the world for the transportation of people and freight is critical to the state’s economic future.
Access to scheduled air service from Greater Minnesota cities is important to regional eco-nomic viability and quality of life.
Nonstop Air DestinationsNATIONAL AND GLOBAL CONNECTIONS
Our progressThree airports—Minneapolis-St. Paul, Rochester, and Duluth—offer nonstop airline flights to destinations outside Minnesota. The other five commercial air service airports have flights that connect at Minneapolis-St. Paul. The number of nonstop destinations increased steadily from 119 in 2002 to 144 in 2008, then fell to 134 due to the economic reces-sion. International destinations grew to 21 over the period, and held steady in 2009. New destinations were mainly warm-weather vaca-tion destinations.
Two cities in Minnesota have lost commercial service since 2000: Grand Rapids and St. Cloud, whose service was discontinued at the end of 2009. Mesaba provided summer-only service to Ely for a few years ending in 2001. No additional Minnesota cities have gained commercial air service since 2000.
There is a large area of Western and Southern Minnesota that lacks service, though there is commercial service across state borders in Fargo and Sioux Falls.
Source: Metropolitan Airports Commission 2003 Annual Report to the Legislature 2009 Annual Report to the Legislature
InternationalDomestic
134
113
2009
15104
14
15
15 20 21 21
105 116 122
122
123
123
21119 119131
137 142 144 144
20052002 2003 2004 2006 2007 2008
Number of destinations served by nonstop flights from Minnesota
For comparisonThe Twin Cities has 9th most nonstop destina-tions of any US metro area in 2009, according to Metropolitan Airports Commission analysis (regions with multiple airport are counted as a single market).

27
I O W A
SO
UT
H
DA
KO
TA
WI
SC
ON
SI
N
C A N A D A
NO
RT
H
DA
KO
TA
Rochester
Duluth
Hibbing/Chisolm
International Falls
Brainerd
Bemidji
Fargo
Thief River FallsGrandForks
SiouxFalls
Mason City
La Crosse
Mpls.-St. Paul International Airport
113 Domestic Destinations21 International Destinations
DetroitChicago
Orlando
Las V
egas
Detroit
Chicago
Las Ve
gas
Commercialservice airports
How we decide Decisions on air routes and markets served are made by the commercial airlines, shaped by a changing airline industry and economy. Mn/DOT and other agencies such as MAC and local governments can lobby or provide incen-tives for service to be extended to more com-munities.
Mn/DOT supports airline or airport requests that add route availability to the State Airport System. The US DOT is responsible for approv-al of international airline route requests. Project based decision-making is accomplished through the Capital Improvement Plan process for State funds and through the Airport Capital Improvement Plan process for federal funds. Expenses eligible for reimbursement with the Air Service Marketing Program include: air ser-vice advertising, marketing studies, and route analysis.
The Minneapolis-St. Paul International Airport is owned and operated by the Metropolitan Airports Commission, whose board is appoint-ed by the governor.
Learn moreMn/DOT Office of Aeronautics
[email protected] Commercial Air Service—[email protected]
2006 Minnesota Aviation System Planwww.dot.state.mn.us/aero/avoffice/planning/sasp.html
Federal Aviation Administrationwww.faa.gov
Metropolitan Airports Commissionwww.mspairport.com/mac www.metroairports.org/mac/appdocs/pubs/2009MSPLegislativeReport.pdf
Non Stop Air Destinations to and from Minnesota
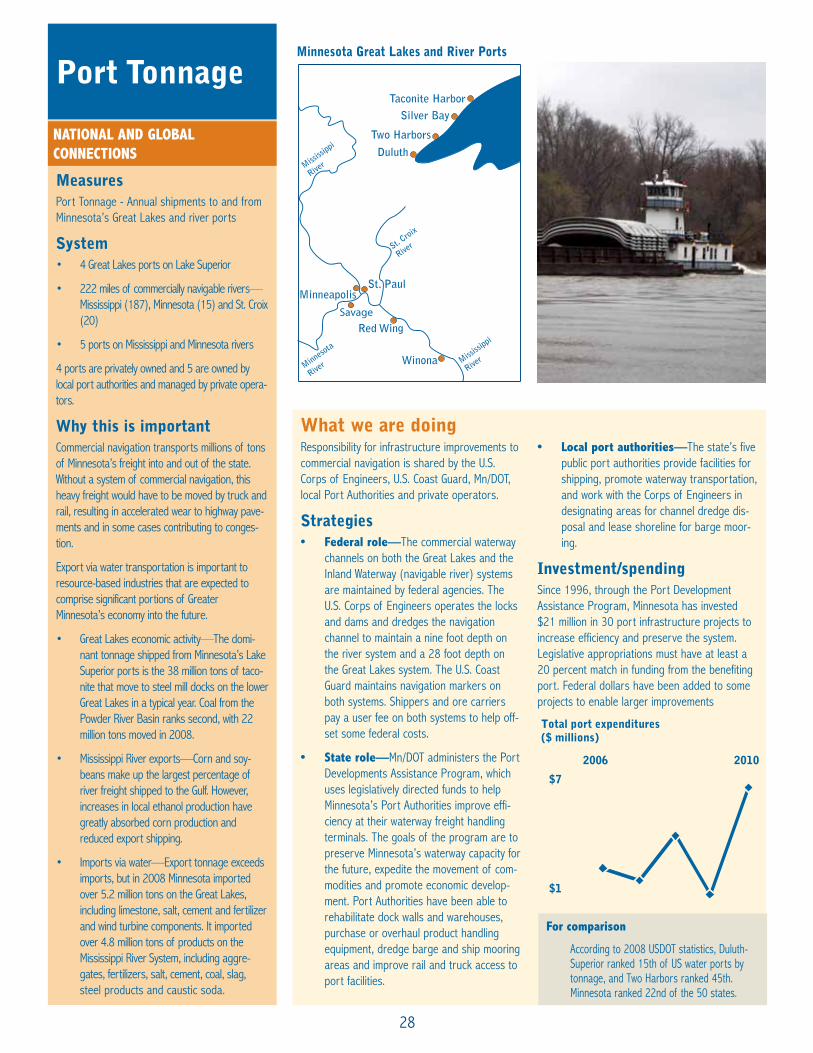
28
MeasuresPort Tonnage - Annual shipments to and from Minnesota’s Great Lakes and river ports
System• 4 Great Lakes ports on Lake Superior
• 222 miles of commercially navigable rivers— Mississippi (187), Minnesota (15) and St. Croix (20)
• 5 ports on Mississippi and Minnesota rivers
4 ports are privately owned and 5 are owned by local port authorities and managed by private opera-tors.
Why this is importantCommercial navigation transports millions of tons of Minnesota’s freight into and out of the state. Without a system of commercial navigation, this heavy freight would have to be moved by truck and rail, resulting in accelerated wear to highway pave-ments and in some cases contributing to conges-tion.
Export via water transportation is important to resource-based industries that are expected to comprise significant portions of Greater Minnesota’s economy into the future.
• Great Lakes economic activity—The domi-nant tonnage shipped from Minnesota’s Lake Superior ports is the 38 million tons of taco-nite that move to steel mill docks on the lower Great Lakes in a typical year. Coal from the Powder River Basin ranks second, with 22 million tons moved in 2008.
• Mississippi River exports—Corn and soy-beans make up the largest percentage of river freight shipped to the Gulf. However, increases in local ethanol production have greatly absorbed corn production and reduced export shipping.
• Imports via water—Export tonnage exceeds imports, but in 2008 Minnesota imported over 5.2 million tons on the Great Lakes, including limestone, salt, cement and fertilizer and wind turbine components. It imported over 4.8 million tons of products on the Mississippi River System, including aggre-gates, fertilizers, salt, cement, coal, slag, steel products and caustic soda.
Port Tonnage
NATIONAL AND GLOBAL CONNECTIONS
Responsibility for infrastructure improvements to commercial navigation is shared by the U.S. Corps of Engineers, U.S. Coast Guard, Mn/DOT, local Port Authorities and private operators.
Strategies• Federal role—The commercial waterway
channels on both the Great Lakes and the Inland Waterway (navigable river) systems are maintained by federal agencies. The U.S. Corps of Engineers operates the locks and dams and dredges the navigation channel to maintain a nine foot depth on the river system and a 28 foot depth on the Great Lakes system. The U.S. Coast Guard maintains navigation markers on both systems. Shippers and ore carriers pay a user fee on both systems to help off-set some federal costs.
• State role—Mn/DOT administers the Port Developments Assistance Program, which uses legislatively directed funds to help Minnesota’s Port Authorities improve effi-ciency at their waterway freight handling terminals. The goals of the program are to preserve Minnesota’s waterway capacity for the future, expedite the movement of com-modities and promote economic develop-ment. Port Authorities have been able to rehabilitate dock walls and warehouses, purchase or overhaul product handling equipment, dredge barge and ship mooring areas and improve rail and truck access to port facilities.
• Local port authorities—The state’s five public port authorities provide facilities for shipping, promote waterway transportation, and work with the Corps of Engineers in designating areas for channel dredge dis-posal and lease shoreline for barge moor-ing.
Investment/spendingSince 1996, through the Port Development Assistance Program, Minnesota has invested $21 million in 30 port infrastructure projects to increase efficiency and preserve the system. Legislative appropriations must have at least a 20 percent match in funding from the benefiting port. Federal dollars have been added to some projects to enable larger improvements
Minnesota Great Lakes and River Ports
2006
$1
$7
Total port expenditures($ millions)
2010
For comparison
According to 2008 USDOT statistics, Duluth-Superior ranked 15th of US water ports by tonnage, and Two Harbors ranked 45th. Minnesota ranked 22nd of the 50 states.
Two Harbors
Duluth
Taconite HarborSilver Bay
MinneapolisSt. Paul
SavageRed Wing
Winona
Mississ
ippi
River
Mississ
ippi
River
Minneso
ta
River
St. Croi
x
River
Lake Superior
What we are doing

29
Annual Port Shipments: 2005-2009
Tons of Freight Shipped on Minnesota Waterways In-bound and Out-bound
Year 2005 2006 2007 2008 2009
Lake Ports 65,717,164 67,434,676 67,996,815 67,056,074 41,526,662
River Ports 12,302,203 12,920,019 12,074,948 8,161,297 10,803,428
Total 78,019,367 80,354,695 80,071,763 75,217,371 52,330,090
Source: Annual terminal reports to Mn/DOT
Learn moreMn/DOT Ports and Waterways
www.dot.state.mn.us/ofrw/waterways.html Dick Lambert—[email protected]
The Port of Duluthwww.duluthport.com
US Army Corps of Engineerswww.usace.army.mil/Pages/default.aspx
How we decideThe Ports & Waterways Section of Mn/DOT meets regularly with the state’s five port authorities to develop and update a priority list of projects needed to improve terminal effi-ciency and meet state safety standards. Projects must be a capital improvement to the infrastructure that will increase efficiency and capacity of the facility. Although Mn/DOT makes the final decision on the project priority, all five port authorities come to consensus on proj-ects to be completed first.
Our progressDuring the 2009 recession, steel production decreased reducing both Minnesota’s taconite production and contributing to a huge 25 mil-lion ton drop in shipping on the Great Lakes. Simultaneously, grain shipping on the river recovered from 2008 as a result of a better supply of ocean ships and river barges and strong demand for grain exports.
The level of waterway freight shipped each year is a function of domestic and international demand, weather impacts on crop production and the duration of ice-free shipping, and competition from rail and trucking. Mn/DOT has limited influence on this measure, but does have a clear interest in reducing the impact of heavy trucks on highway pavements.
Minnesota Port Development Assistance ProgramFiscal Year Expenditures
Year 2005 2006 2007 2008 2009 2010
Federal $0 $0 $0 $0 $0 $3,000,000
Mn/DOT $12,000 $1,539,157 $1,000,000 $2,925,000 $349,398 $2,258,809
Local $31,627 $460,843 $300,000 $922,898 $87,350 $1,191,191
Total $43,627 $2,000,000 $1,300,000 $3847,898 $436,748 $6,450,000
2005 2006 2007 2008 2009
River Ports
Lake Ports
6612
6713
6812
678
4211 Million Tons
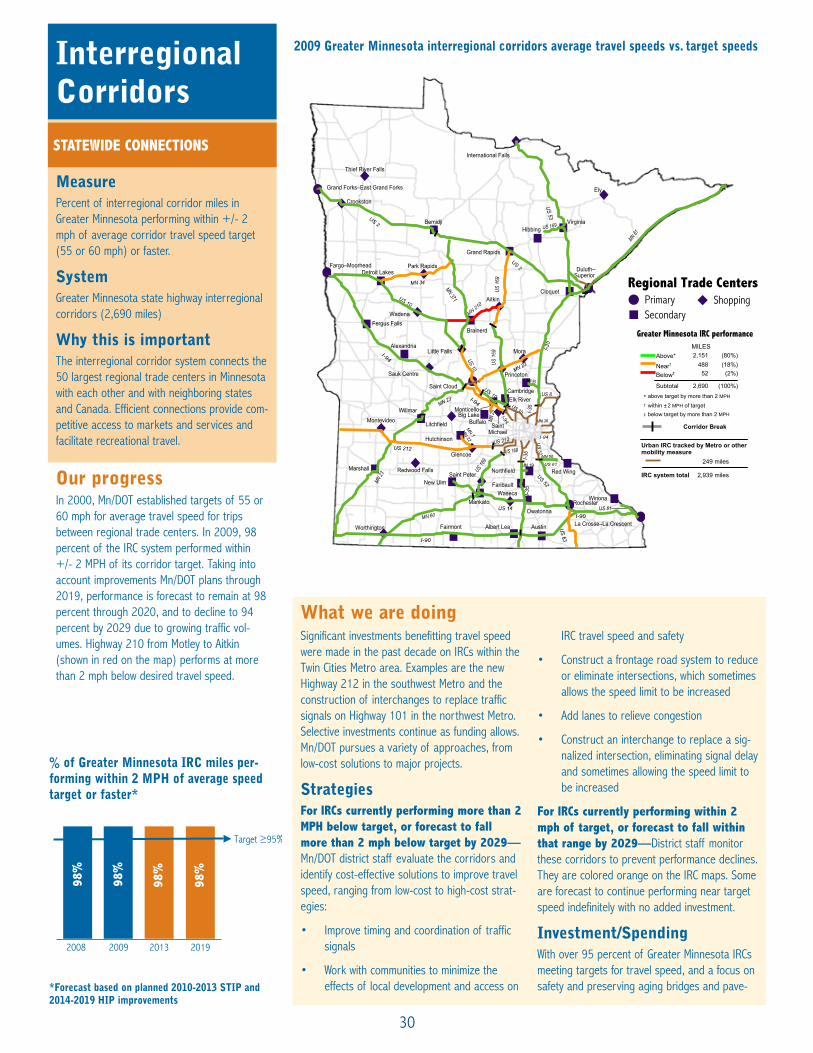
30
MeasurePercent of interregional corridor miles in Greater Minnesota performing within +/- 2 mph of average corridor travel speed target (55 or 60 mph) or faster.
SystemGreater Minnesota state highway interregional corridors (2,690 miles)
Why this is importantThe interregional corridor system connects the 50 largest regional trade centers in Minnesota with each other and with neighboring states and Canada. Efficient connections provide com-petitive access to markets and services and facilitate recreational travel.
Interregional Corridors
STATEWIDE CONNECTIONS
Our progressIn 2000, Mn/DOT established targets of 55 or 60 mph for average travel speed for trips between regional trade centers. In 2009, 98 percent of the IRC system performed within +/- 2 MPH of its corridor target. Taking into account improvements Mn/DOT plans through 2019, performance is forecast to remain at 98 percent through 2020, and to decline to 94 percent by 2029 due to growing traffic vol-umes. Highway 210 from Motley to Aitkin (shown in red on the map) performs at more than 2 mph below desired travel speed.
AustinAlbert LeaFairmontWorthington La Crosse–La Crescent
OwatonnaRochester
WinonaWaseca
Mankato
Saint Peter
Faribault
Marshall
New Ulm
Redwood Falls Red Wing
Hutchinson
Glencoe
MontevideoWillmar
Litchfield SaintMichael
Buffalo
Elk RiverMonticello–
Big Lake
Saint Cloud
Princeton
Cambridge
Sauk Centre
AlexandriaLittle Falls Mora
Fergus FallsBrainerd
Wadena
Aitkin
Detroit Lakes
Cloquet
Duluth–Superior
Fargo–Moorhead Park Rapids
Grand Rapids
BemidjiHibbing
Virginia
Crookston
Grand Forks–East Grand Forks
Thief River Falls
Ely
International Falls
Northfield
Greater Minnesota IRC performance
PrimarySecondary
ShoppingRegional Trade Centers
2,151
52
2,690
Above*
Below‡
Subtotal
MILES(80%)
(2%)
(100%)
488Near† (18%)
*†
‡
above target by more than 2 MPH
below target by more than 2 MPH
within ± 2 MPH of target
_
Urban IRC tracked by Metro or other
Corridor Break
mobility measure
IRC system total
miles
miles
249
2,939
2009 Greater Minnesota interregional corridors average travel speeds vs. target speeds
*Forecast based on planned 2010-2013 STIP and 2014-2019 HIP improvements
% of Greater Minnesota IRC miles per-forming within 2 MPH of average speed target or faster*
Target ≥95%
2008 2009 2013 2019
98%
98%
98%
98%
Significant investments benefitting travel speed were made in the past decade on IRCs within the Twin Cities Metro area. Examples are the new Highway 212 in the southwest Metro and the construction of interchanges to replace traffic signals on Highway 101 in the northwest Metro. Selective investments continue as funding allows. Mn/DOT pursues a variety of approaches, from low-cost solutions to major projects.
Strategies For IRCs currently performing more than 2 MPH below target, or forecast to fall more than 2 mph below target by 2029—Mn/DOT district staff evaluate the corridors and identify cost-effective solutions to improve travel speed, ranging from low-cost to high-cost strat-egies:
• Improve timing and coordination of traffic signals
• Work with communities to minimize the effects of local development and access on
IRC travel speed and safety
• Construct a frontage road system to reduce or eliminate intersections, which sometimes allows the speed limit to be increased
• Add lanes to relieve congestion
• Construct an interchange to replace a sig-nalized intersection, eliminating signal delay and sometimes allowing the speed limit to be increased
For IRCs currently performing within 2 mph of target, or forecast to fall within that range by 2029—District staff monitor these corridors to prevent performance declines. They are colored orange on the IRC maps. Some are forecast to continue performing near target speed indefinitely with no added investment.
Investment/SpendingWith over 95 percent of Greater Minnesota IRCs meeting targets for travel speed, and a focus on safety and preserving aging bridges and pave-
What we are doing
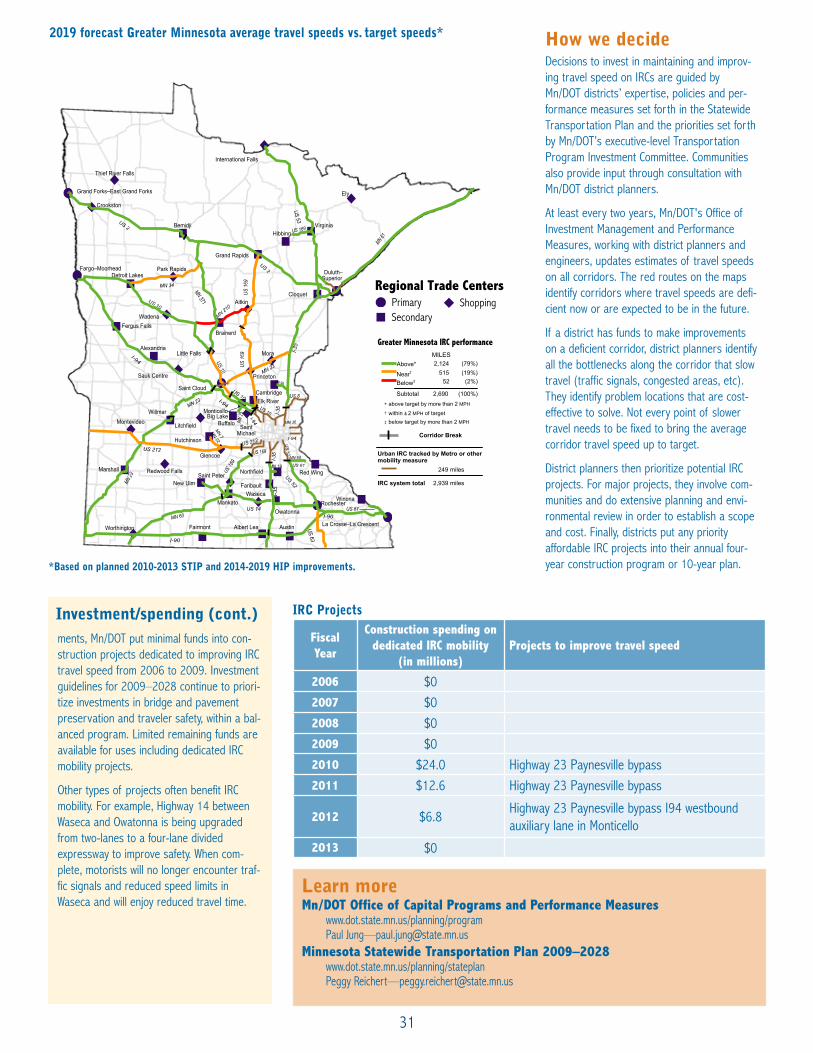
31
What we are doing
How we decide Decisions to invest in maintaining and improv-ing travel speed on IRCs are guided by Mn/DOT districts’ expertise, policies and per-formance measures set forth in the Statewide Transportation Plan and the priorities set forth by Mn/DOT’s executive-level Transportation Program Investment Committee. Communities also provide input through consultation with Mn/DOT district planners.
At least every two years, Mn/DOT's Office of Investment Management and Performance Measures, working with district planners and engineers, updates estimates of travel speeds on all corridors. The red routes on the maps identify corridors where travel speeds are defi-cient now or are expected to be in the future.
If a district has funds to make improvements on a deficient corridor, district planners identify all the bottlenecks along the corridor that slow travel (traffic signals, congested areas, etc). They identify problem locations that are cost-effective to solve. Not every point of slower travel needs to be fixed to bring the average corridor travel speed up to target.
District planners then prioritize potential IRC projects. For major projects, they involve com-munities and do extensive planning and envi-ronmental review in order to establish a scope and cost. Finally, districts put any priority affordable IRC projects into their annual four-year construction program or 10-year plan.
Learn moreMn/DOT Office of Capital Programs and Performance Measures
www.dot.state.mn.us/planning/program Paul Jung—[email protected]
Minnesota Statewide Transportation Plan 2009–2028www.dot.state.mn.us/planning/stateplan Peggy Reichert—[email protected]
Fiscal Year
Construction spending on dedicated IRC mobility
(in millions) Projects to improve travel speed
2006 $02007 $02008 $02009 $02010 $24.0 Highway 23 Paynesville bypass2011 $12.6 Highway 23 Paynesville bypass
2012 $6.8Highway 23 Paynesville bypass I94 westbound auxiliary lane in Monticello
2013 $0
2019 forecast Greater Minnesota average travel speeds vs. target speeds*
*Based on planned 2010-2013 STIP and 2014-2019 HIP improvements.
AustinAlbert LeaFairmontWorthington La Crosse–La Crescent
OwatonnaRochester
WinonaWaseca
Mankato
Saint Peter
Faribault
Marshall
New Ulm
Redwood Falls Red Wing
Hutchinson
Glencoe
MontevideoWillmar
Litchfield SaintMichael
Buffalo
Elk RiverMonticello–
Big Lake
Saint Cloud
Princeton
Cambridge
Sauk Centre
AlexandriaLittle Falls Mora
Fergus FallsBrainerd
Wadena
Aitkin
Detroit Lakes
Cloquet
Duluth–Superior
Fargo–Moorhead Park Rapids
Grand Rapids
BemidjiHibbing
Virginia
Crookston
Grand Forks–East Grand Forks
Thief River Falls
Ely
International Falls
Northfield
Greater Minnesota IRC performance
2,124
52
2,690
Above*
Below‡
Subtotal
MILES(79%)
(2%)
(100%)
515Near† (19%)
*†
‡
above target by more than 2 MPH
below target by more than 2 MPH
within ± 2 MPH of target
Urban IRC tracked by Metro or other
Corridor Break
mobility measure
IRC system total
miles
miles
249
2,939
PrimarySecondary
ShoppingRegional Trade Centers_
_
ments, Mn/DOT put minimal funds into con-struction projects dedicated to improving IRC travel speed from 2006 to 2009. Investment guidelines for 2009–2028 continue to priori-tize investments in bridge and pavement preservation and traveler safety, within a bal-anced program. Limited remaining funds are available for uses including dedicated IRC mobility projects.
Other types of projects often benefit IRC mobility. For example, Highway 14 between Waseca and Owatonna is being upgraded from two-lanes to a four-lane divided expressway to improve safety. When com-plete, motorists will no longer encounter traf-fic signals and reduced speed limits in Waseca and will enjoy reduced travel time.
Investment/spending (cont.) IRC Projects
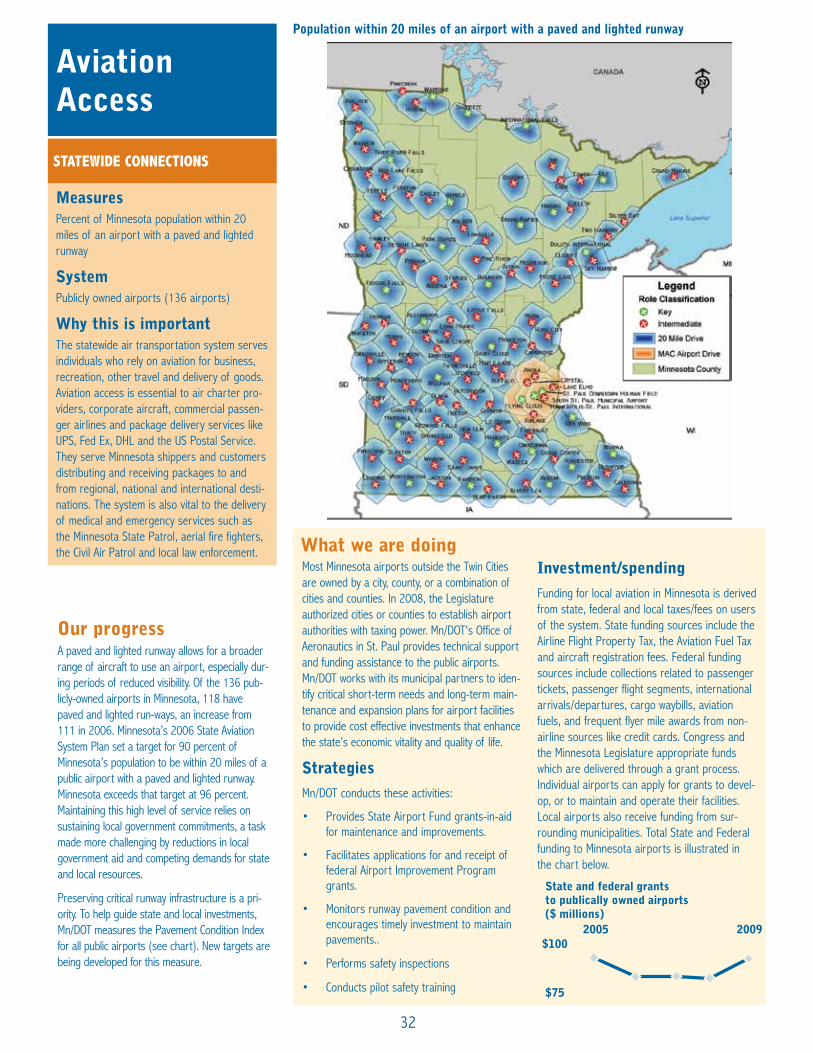
32
MeasuresPercent of Minnesota population within 20 miles of an airport with a paved and lighted runway
SystemPublicly owned airports (136 airports)
Why this is importantThe statewide air transportation system serves individuals who rely on aviation for business, recreation, other travel and delivery of goods. Aviation access is essential to air charter pro-viders, corporate aircraft, commercial passen-ger airlines and package delivery services like UPS, Fed Ex, DHL and the US Postal Service. They serve Minnesota shippers and customers distributing and receiving packages to and from regional, national and international desti-nations. The system is also vital to the delivery of medical and emergency services such as the Minnesota State Patrol, aerial fire fighters, the Civil Air Patrol and local law enforcement.
Aviation Access
STATEWIDE CONNECTIONS
Our progressA paved and lighted runway allows for a broader range of aircraft to use an airport, especially dur-ing periods of reduced visibility. Of the 136 pub-licly-owned airports in Minnesota, 118 have paved and lighted run-ways, an increase from 111 in 2006. Minnesota’s 2006 State Aviation System Plan set a target for 90 percent of Minnesota’s population to be within 20 miles of a public airport with a paved and lighted runway. Minnesota exceeds that target at 96 percent. Maintaining this high level of service relies on sustaining local government commitments, a task made more challenging by reductions in local government aid and competing demands for state and local resources.
Preserving critical runway infrastructure is a pri-ority. To help guide state and local investments, Mn/DOT measures the Pavement Condition Index for all public airports (see chart). New targets are being developed for this measure.
Population within 20 miles of an airport with a paved and lighted runway
Most Minnesota airports outside the Twin Cities are owned by a city, county, or a combination of cities and counties. In 2008, the Legislature authorized cities or counties to establish airport authorities with taxing power. Mn/DOT's Office of Aeronautics in St. Paul provides technical support and funding assistance to the public airports. Mn/DOT works with its municipal partners to iden-tify critical short-term needs and long-term main-tenance and expansion plans for airport facilities to provide cost effective investments that enhance the state’s economic vitality and quality of life.
Strategies
Mn/DOT conducts these activities:
• Provides State Airport Fund grants-in-aid for maintenance and improvements.
• Facilitates applications for and receipt of federal Airport Improvement Program grants.
• Monitors runway pavement condition and encourages timely investment to maintain pavements..
• Performs safety inspections
• Conducts pilot safety training
Investment/spending
Funding for local aviation in Minnesota is derived from state, federal and local taxes/fees on users of the system. State funding sources include the Airline Flight Property Tax, the Aviation Fuel Tax and aircraft registration fees. Federal funding sources include collections related to passenger tickets, passenger flight segments, international arrivals/departures, cargo waybills, aviation fuels, and frequent flyer mile awards from non-airline sources like credit cards. Congress and the Minnesota Legislature appropriate funds which are delivered through a grant process. Individual airports can apply for grants to devel-op, or to maintain and operate their facilities. Local airports also receive funding from sur-rounding municipalities. Total State and Federal funding to Minnesota airports is illustrated in the chart below.
What we are doing
2005
$75
$100
State and federal grantsto publically owned airports($ millions)
2009
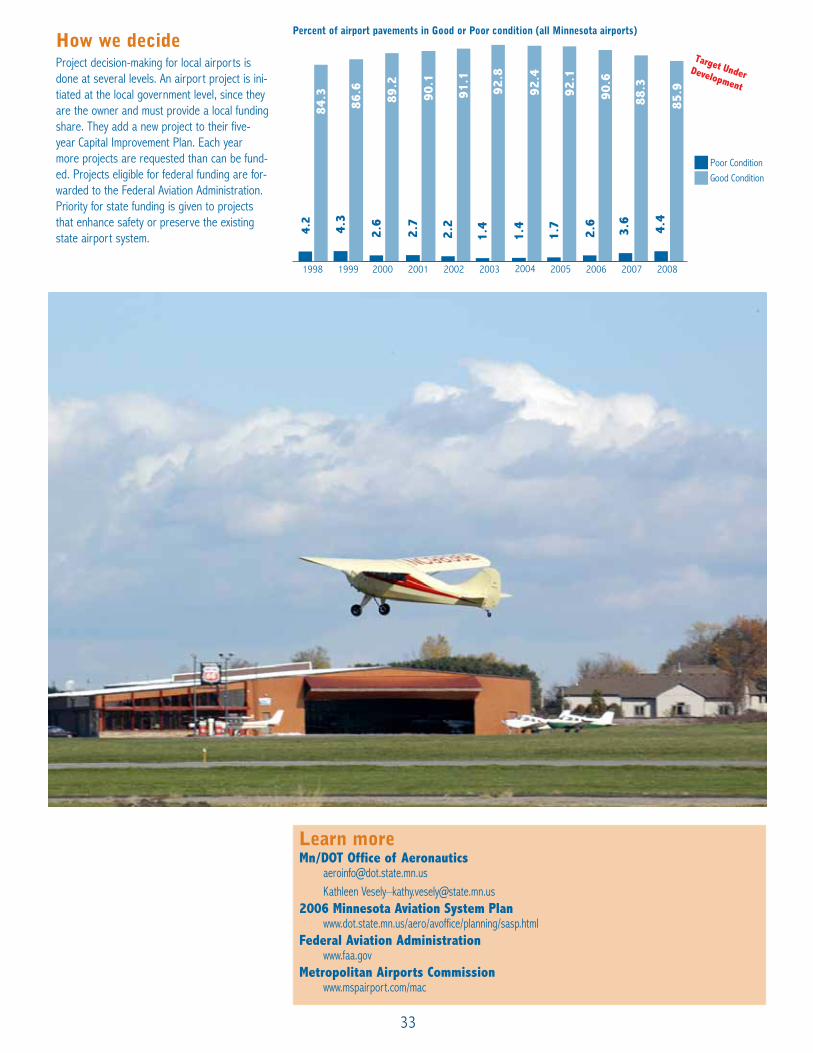
33
Percent of airport pavements in Good or Poor condition (all Minnesota airports)How we decide Project decision-making for local airports is done at several levels. An airport project is ini-tiated at the local government level, since they are the owner and must provide a local funding share. They add a new project to their five-year Capital Improvement Plan. Each year more projects are requested than can be fund-ed. Projects eligible for federal funding are for-warded to the Federal Aviation Administration. Priority for state funding is given to projects that enhance safety or preserve the existing state airport system.
Learn moreMn/DOT Office of Aeronautics
[email protected] Vesely–[email protected]
2006 Minnesota Aviation System Planwww.dot.state.mn.us/aero/avoffice/planning/sasp.html
Federal Aviation Administrationwww.faa.gov
Metropolitan Airports Commissionwww.mspairport.com/mac
Poor ConditionGood Condition
Target UnderDevelopment
4.2
2.6
2.7
2.2
1.4
1.4
1.7
2.6
3.6
4.4
4.3
20052002 2003 20042000 20011998 1999 2006 2007 2008
90.1
91.1
92.8
92.4
92.1
90.6
88.3
85.9
84.3
86.6
89.2

34
MeasuresPercentage of Twin Cities urban freeway sys-tem miles congested
SystemTwin Cities urban freeways (379 miles)
Why this is importantCongestion plays a major role in the daily lives of people in the Twin Cities area. Managing congestion improves the quality of life, safety and air quality. About 50 percent of roadway travel in the state occurs on the nine percent of the highway system in the metropolitan area. The region’s congestion delay compared to other major metropolitan areas is an indica-tor of economic competitiveness. Given finite resources and the growth in the region’s pop-ulation, Mn/DOT's goal is to slow the growth of congestion.
Congestion
TWIN CITIES MOBILITY
Mn/DOT is working closely with the Metropolitan Council and other partners on a wide range of solutions to manage congestion – including cost-effective construction projects to improve traffic flow, freeway management technologies to speed traffic flow, Northstar commuter rail, Central Corridor light rail, bus shoulder bypass lanes, bus rapid transit projects, telecommuting and expanded bike routes.
New ApproachMn/DOT and the Metropolitan Council are partner-ing on the Metropolitan Highway System Investment Study to establish a new 50-year vision for the metro area. Its premise is that expanding highways alone can no longer resolve all congestion issues. MHSIS will assess how effi-ciently Minnesota is using existing capacity and identify long-term mobility needs beyond the cur-rent 20-year plan, and be based in the fiscal reali-ty of limited state and federal funding. The goal is to establish a 21st century technology-based, multi-modal approach that manages existing con-gestion while providing congestion-free alterna-tives. MHSIS will be used to update the Metropolitan Council’s and Mn/DOT’s long range policy and investment plans.
Strategies Strategies to improve congestion on Twin Cities freeways range from expensive major construction projects, such as adding lanes, to less costly opera-tional solutions, such as rapid clearing of incidents, electronic message signs and ramp meters.
• Major projects—Traditional costly major projects to relieve bottlenecks and add capacity, such as the Crosstown Highway 62
project and the Highway 610 extension in Brooklyn Park.
• Lower cost projects—Mn/DOT and the Metropolitan Council are identifying poten-tial low-cost projects with a high benefit, such as recent improvements on Highway 10 in Coon Rapids at Hanson Boulevard and southbound I-35W across the Minnesota River.
• UPA innovations—Mn/DOT and the Metropolitan Council secured a $133 million federal Urban Partnership Grant and $50 million in state funds to cost-effectively improve travel speed on I-35W and Highway 77 south from Minneapolis. Features imple-mented in the fall of 2009 included bus rapid transit lanes, expanded transit and park-and-ride lots, telecommuting and Mn/PASS voluntary toll lanes.
• In October 2009 Governor Tim Pawlenty and Mn/DOT Commissioner Tom Sorel announced statewide initiatives including a study of opportunities to further expand Mn/PASS and permanent lane expansion and technology for Interstate 94 between Minneapolis and St. Paul.
• Mn/DOT and its partners are also working on congestion management solutions for state non-freeway and local routes in the Metro Area.
Investment/SpendingMn/DOT’s Metro District has identified $200 mil-lion (about $50 million per year) in investments for its regular STIP four-year 2010-2013 con-struction program dedicated to addressing con-gestion and mobility improvements.
Our progressMn/DOT defines congestion on the Twin Cities freeway system as traffic flowing below 45 mph in weekday peak periods – from 5 a.m. to 10 a.m., and from 2 p.m. to 7 p.m.
The share of Twin Cities freeways congested increased to 18.2 percent in 2009, up from 17.3 percent in 2008. Congestion decreased four of the previous five years, except for 2007 when the I-35W Bridge collapsed and traffic diverted from that corridor affected other routes. Mn/DOT freeway analysts expect overall system congestion to plateau or be lim-ited to small increases in the next few years, when completion of the Highway 62 Crosstown and Wakota Bridge projects in 2010 is expect-ed to have positive results. However, because future plans include fewer large projects to add capacity, analysts expect congestion to resume its long-term growth trend, unless alternative solutions can mitigate the trend.
Many factors affect congestion levels - the economy, population growth, gas prices, transit ridership and vehicle miles traveled. VMT decreased in 2008 largely due to a declining economy. This helped decrease congestion on metro freeways. In 2009, as the economy sta-bilized, congestion increased in the afternoon, when there are more discretionary trips.
2000 20022001 2003 2004 2005 2006 2007 2008 2009
15.1% 18.1%21.3%
20.8%
19.7%
19.2%
18.3%
20.9%
17.3%
18.2%
Target*
Percentage of Twin Cities urban freeway miles congested*
* Mn/DOT's congestion target was phased out in 2008. Efforts are now under-way to develop new measures, multimodal strategies and lower-cost solu-tions.
What we are doing

35
How we decide Decisions involving day-to-day management of Metro area freeways, such as incident clear-ance, ramp meters and timing of traffic signals are guided by Mn/DOT's Metro District, includ-ing its Regional Transportation Management Center in Roseville, working with the counties and cities.
Decisions on how to address congestion long-term in the Metro Area are made through a complex, collaborative process. Mn/DOT's Metro District develops alternatives and plans and makes decisions in partnership with the Metropolitan Council, cities, counties, regional and county transit authorities. Public input is sought for both the Met Council’s 20-year Transportation Policy Plan and Mn/DOT's Metro Highway Investment Plan. These plans direct projects that go into Mn/DOT's six-year and annual four-year construction programs. Projects to reduce congestion are balanced with projects to improve safety or preserve bridges and pavement.
Actual project decisions each year are affected by changing factors such as revenues, costs, and community input. Corridor measurements of travel speed, throughput, and crashes help identify needs and design options but do not determine which projects are built. Specific designs for highways or transit facilities are shaped by Mn/DOT planners and engineers and contracted engineering firms. Four Mn/DOT area managers work with sectors of the Metro area.
Learn moreMn/DOT Metro District
www.dot.state.mn.us/metro Plans and strategies—Paul Czech—[email protected] Congestion data—Brian Kary—[email protected]
Metropolitan Freeway 2009 Congestion Report www.dot.state.mn.us/rtmc/
Minnesota Department of TransportationReal Time Metro Area Traffic Information www.dot.state.mn.us/tmc/trafficinfo/
Congestion Management Planning Study www.dot.state.mn.us/trafficeng/otepubl/CongestionMgmt2007.pdf
Metropolitan Council Transportationwww.metrocouncil.org/planning/transportation/TPP/2008/
For comparisonBy travel time index (the ratio of peak to free-flow travel time), the Twin Cities area is the 13th most congested of 29 metropolitan areas of similar size (28th of 90 overall), according to 2007 Texas Transportation Institute data.

36
MeasuresClearance time for urban freeway incidents
SystemTwin Cities urban freeways (400 Miles)
Why this is importantTo reduce congestion and secondary crashes Mn/DOT must clear incidents off the freeway system quickly. Each minute an incident is blocking a lane of traffic causes over four min-utes of congestion. The Freeway Incident Response Safety Team or FIRST program has about a 16:1 benefit/cost ratio based on reduced delay, crashes, fuel consumption and emissions.
Incident ClearanceTWIN CITIES MOBILITY
Mn/DOT works with the State Patrol, local police, towing companies and other emergency respond-ers to improve speedy clearance of incidents from freeways, and with the legislature on new laws to allow quick clearance of incidents. Mn/DOT and the State Patrol have also signed an “Open Roads Policy” agreeing to expedite the removal of vehicles, cargo and debris from state highways to more quickly restore traffic flow fol-lowing a crash or incident.
Mn/DOT’s FIRST drivers assisted in the clearance of more than 12,000 incidents in 2008, an increase from 2,400 in 1993 and 5,700 in 2000. Mn/DOT is able to respond to more incidents because FIRST coverage has approximately dou-bled since the program first began.
Strategies
• Expand FIRST coverage—Additional routes on State Highway 10 and Interstate 35W and I-35E when funding becomes available.
• Improve on-site efficiency—The use of automated crash forms by the State Patrol and use of computer-aided State Patrol dispatching on laptops in FIRST trucks has improved effi-ciency.
• Conduct training—Emergency Responder Safety training, which emphasizes keeping traffic moving while safely securing the scene, resulted from guidelines developed with various partners.
• Install new devices—Lane control sig-nals and priced dynamic shoulder lanes have been added to I-35W from Burnsville to downtown Minneapolis.
• Work with external partners—Includes work with truckers and towing associations on quick clearance, with the State Patrol on Open Roads Policy and with FHWA to meet the National Unified Goal for Traffic Incident Management.
Investment/spendingIncident management extends beyond the FIRST program at the Regional Transportation Management Center. Mn/DOT’s supporting activi-ties include maintenance crews and equipment that help clear major incidents, freeway system design and repair, cameras, dynamic message signs and providing traveler information to radio, television, and the internet. Additional resources are committed by the State Patrol, local fire and rescue squads, local law enforcement, EMS/ambulance services and tow-truck operators. The following chart displays expenditures for FIRST only, from 2004 to 2008. Three FIRST routes were added in 2005 and 2006.
In 2008, the 3-year average clearance time for urban freeway incidents was 37.2 minutes, still short of Mn/DOT's performance target of 35 minutes or less. Clearance time has been above the 35 minute target since 2000, but has improved over the last two years benefiting from
increased FIRST truck staffing and new comput-er-aided dispatching. Mn/DOT expects a slight increase in clearance time in the next year or two because the incident detection system has expanded to areas beyond current coverage of FIRST incident response trucks.
34.0
36.2
36.3
37.3 38.0 38
.8
38.8
37.3
??.?
37.2
Target ≤35 Minutes
2000 2001 2002 2003 2004 2005 2006 2007 2008
Clearance time for urban freeway incidents, in minutes (three-year average)
2004
$0.5
$1.5
FIRST expenditures($ millions)
2008
Our progress
What we are doing
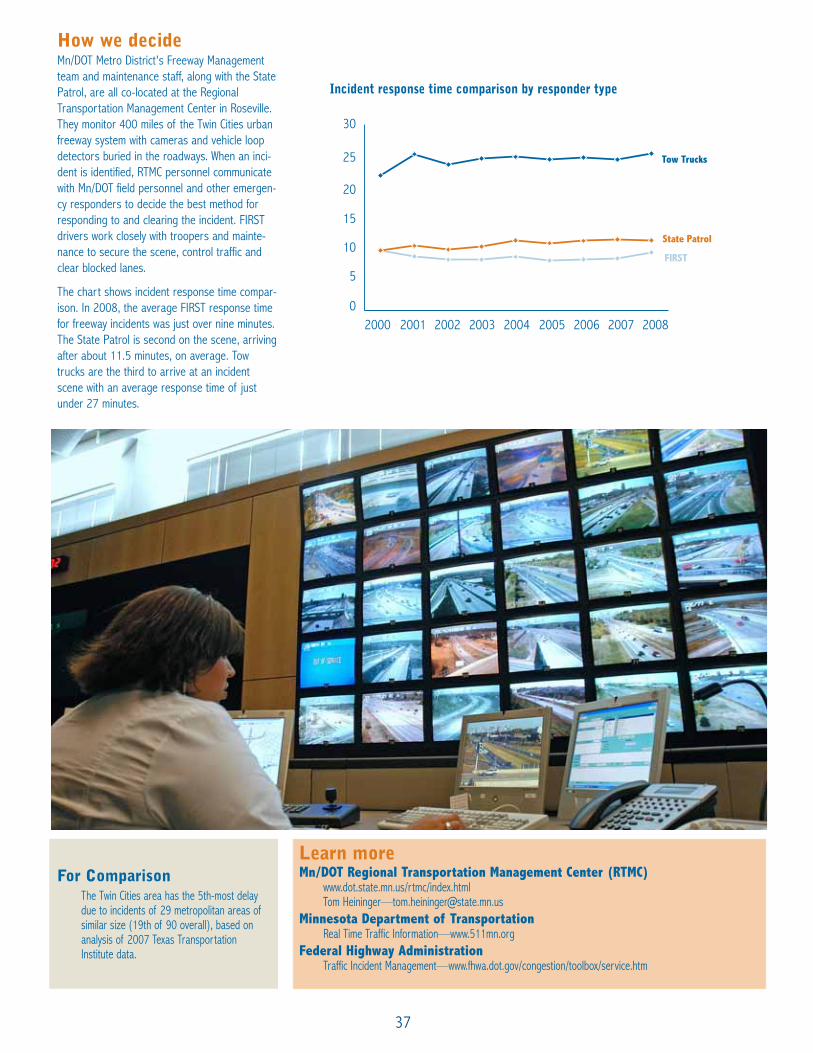
37
Mn/DOT Metro District's Freeway Management team and maintenance staff, along with the State Patrol, are all co-located at the Regional Transportation Management Center in Roseville. They monitor 400 miles of the Twin Cities urban freeway system with cameras and vehicle loop detectors buried in the roadways. When an inci-dent is identified, RTMC personnel communicate with Mn/DOT field personnel and other emergen-cy responders to decide the best method for responding to and clearing the incident. FIRST drivers work closely with troopers and mainte-nance to secure the scene, control traffic and clear blocked lanes.
The chart shows incident response time compar-ison. In 2008, the average FIRST response time for freeway incidents was just over nine minutes. The State Patrol is second on the scene, arriving after about 11.5 minutes, on average. Tow trucks are the third to arrive at an incident scene with an average response time of just under 27 minutes.
Learn moreMn/DOT Regional Transportation Management Center (RTMC)
www.dot.state.mn.us/rtmc/index.html Tom Heininger—[email protected]
Minnesota Department of TransportationReal Time Traffic Information—www.511mn.org
Federal Highway AdministrationTraffic Incident Management—www.fhwa.dot.gov/congestion/toolbox/service.htm
FIRST
Tow Trucks
State Patrol
20000
5
10
15
20
25
30
2001 2002 2003 2004 2005 2006 2007 2008
Incident response time comparison by responder type
For ComparisonThe Twin Cities area has the 5th-most delay due to incidents of 29 metropolitan areas of similar size (19th of 90 overall), based on analysis of 2007 Texas Transportation Institute data.
How we decide

38
MeasureAnnual express transit ridership in the Twin Cities Metropolitan Area: includes express buses (all providers), light rail transit, van pool and commuter rail
SystemSelected services, programs, transit infrastruc-ture and transitways within the existing Twin Cities metropolitan Area's transit system.
Why this is importantTransit plays a key role in the economic devel-opment of the Twin Cities Metropolitan Area. Transit connects people to jobs and schools, shopping, health care centers, cultural events and meetings, providing alternatives to driving on congested highways. Transit use reduces greenhouse emissions and fuel consumption and mitigates congestion.
Express Transit RidershipTWIN CITIES MOBILITY
Our progressTotal transit ridership shows an upward trend over the last three years. Express transit ridership grew by a net of 15 percent from 20.4 million riders in 2006 to 23.5 million in 2009, though it dropped during the recession in 2009. Express transit rider-ship increased from 24.0 percent to 26.5 percent of all Metro transit ridership.
Part of this growth can be traced to increased pric-es for gasoline. Transit is attractive when it offers reliability, time savings and convenience. Recent enhancements in light rail transit, commuter rail, express bus routes, and changes in transit routes, have helped attract more riders.
Twin Cities Metropolitan Area transitways—current and planned
Express BusLRT
Van Pool
North Star Commuter Rail
20.421.7
24.10.223.5
0.20.8
0.20.2
2006 2007 2008 2009
11.3
9.0
12.4 13.7
9.1 10.2
12.7
9.9
Annual express transit ridership in millions
Note: Northstar commuter rail started operations in November 2009. Source: Metropolitan Council
The Metropolitan Council in 2003 set a goal of doubling transit ridership from 73 million riders to 145-150 million riders by 2030, including express, regular local routes, and all other ser-vices. The Council's 2030 Transportation Policy Plan outlines plans for transit development, including several types of express transitways on the map above.
Mn/DOT works with the Metropolitan Council and other transit providers to meet its ridership goal by providing transit advantages on state highway corridors. Mn/DOT also assists the Metropolitan Council and county transit authorities in planning, designing, financing and constructing light rail and commuter rail lines.
Mn/DOT has participated in the Interstate 35 Bus Rapid Transit Mn/Pass Express Lanes proj-ect funded by the Urban Partnership Agreement, portions of the Cedar Avenue BRT project, Chapter 152 transit advantages, and Park and Ride lots throughout the region.
The Counties Transit Improvement Board is a joint powers agreement between Anoka, Dakota, Hennepin, Ramsey and Washington County. It receives and distributes a new one-quarter cent transit sales tax for the development, construc-tion, and operation of transitways serving the five-county area. The CTIB has committed 30 percent of the funding needed to construct the Central Corridor light rail line. It has also commit-ted operating funds for the Hiawatha line, Northstar commuter rail and bus rapid transit
lines on Cedar Avenue and I-35W.
Future transitway development is planned for the corridors indicated by the dashed lines in the map above. Transitways could include light rail or com-muter rail, dedicated busways, or a combination. In the West Metro routes and stations are being identified for the Southwest corridor, and the Bottineau (northwest) corridor is being evaluated. In the East Metro the Rush Line corridor to Forest Lake and Hinckley and the Red Rock corridor to Hastings have been studied for some 10 years. Under exploration are the Highway 65 corridor, Highway 36, and the I94 corridor to the St. Croix River and possibly Wisconsin.
Strategies The most effective strategy to increase transit rid-ership is to expand the network of bus and rail transitways, including light rail, bus rapid transit, commuter rail and express buses with transit advantages. Other measures can also make tran-sit more competitive with automobile travel.
To help make express transit more competitive, Mn/DOT has:
• Reinforced and widened nearly 300 miles of shoulders allowing buses to bypass conges-tion
• Provided ramp meter bypasses for buses
• Constructed MnPass Express Lanes on I-394 and I-35W
The Metropolitan Council and other transit pro-
What we are doingSource: Metropolitan Council 2030Transit Plan

39
Learn moreMn/DOT Metro District
www.dot.state.mn.us/metro Robert Vockrodt, Transitway Project Manager—[email protected]
Metropolitan Council/Metropolitan Transit Commissionwww.metrotransit.org 2030 Transportation Policy Plan—www.metrocouncil.org/planning/transportation/TPP/2008/ Transit Ridership Trends—www.accountability.state.mn.us/Departments/MetCouncil/Goals.htm
Counties Transit Improvement Board (CTIB)http://www.mnrides.org/
Urban Partnership Agreement Projectwww.dot.state.mn.us/upa
viders support express transit by:
• Expanding bus system coverage and fre-quency
• Creating additional express bus routes and park-and-ride facilities
• Adding transit changeable message signs
Investment/spendingCapital investment in transit infrastructure var-ies widely from year to year. A construction project in one corridor can cause total invest-ment to fluctuate greatly. The largest source of funding for the construction of rail projects is generally the federal government. Other major sources are the CTIB, state general funds and local governments. Additional local partners are sometimes involved, such as the Metropolitan Airports Commission on the Hiawatha LRT and the Minnesota Twins on Northstar.
Major expenditures in 2009 included $258 million in Metropolitan Council capital invest-ment, $382 million in Metropolitan Council operating expenditures, $85 million from CTIB, $143 million from Mn/DOT, the Metropolitan Council and local partners toward the Urban Partnership Agreement, $81 million adminis-tered by Mn/DOT toward Northstar Commuter Rail and additional funds from county transit authorities and federal Congestion Mitigation/Air Quality grants.
Strategies (cont.)
Transit infrastructure in the Twin Cities metropolitan area
• 112 Park & Rides with over 26,000 spac-es with bus or rail service
• 27 transit centers and stations built to improve waiting conditions and facilitate transfers among buses and trains
• Transit advantages have been created to improve transit travel times. These advan-tages include 250 miles of bus-only shoulders, ten miles of bus-only lanes on city streets, 88 ramp meter bypasses, 38 miles of HOV/HOT lanes including the I-394 reversible HOT lane and seven miles of exclusive busway
• Northstar Commuter Rail line is supported by six commuter rail stations, six commut-er rail locomotives and 18 passenger cars.
• 19 stations provided access to riders for LRT.
Mn/DOT acts as a partner in all strategic and local planning activities and monitors all proposals for transitways.
Expansion and improvements of express bus enhancements on highways have traditionally been made through a planning and decision process guided by Team Transit. Team Transit consists of transit planners and engineers in the Mn/DOT Metro District, together with personnel from the Metropolitan Council/Metro Transit and other pro-viders in the region. Decisions are made based on the group’s recommendations and available fund-ing. Mn/DOT examines each potential project with its partners and communities for maximum impact on ridership and congestion mitigation.
Mn/DOT's role in light rail and commuter rail devel-opment varies by project depending on the type of service and the other agencies involved. The major agency functions are planning, building, financing
and operating. A separate agency can be in charge of each function, or all can be done by the same agency. For example, on the Hiawatha light rail line, Hennepin County led initial planning, Mn/DOT pro-vided design and construction services, and the Metropolitan Council administered financing and operates the service. For the Central Corridor, the Metropolitan Council is serving as the lead agency and Ramsey County contributed planning. Mn/DOT is providing design assistance as needed, as well as expertise on environmental issues, historical preservation and property acquisition.
By statute, Mn/DOT is responsible for administering commuter rail. Responsibility for light rail rests with the Metropolitan Council and Mn/DOT. At the federal level, the Federal Transit Administration grants fed-eral funds for light rail and commuter rail. The Federal Railroad Administration grants federal funds for passenger rail (intercity and high speed).
How we decide

40
MeasureGreater Minnesota public transportation bus service hours
System60 public transit systems serving 76 out of 80 Greater Minnesota Counties
Why this is importantGreater Minnesota public transportation sys-tems provide thousands of people with access to jobs education, health care, shopping and recreation. Transit provided more than 11 mil-lion trips in 2008 and is one of the primary means people who are elderly and disabled to fully participate in society.
Bus Service Hours
GREATER MINNESOTA METROPOLI-TAN AND REGIONAL MOBILITY
Greater Minnesota's 60 public transit systems are operated by local governments and non-prof-its. Mn/DOT’s Office of Transit manages state and federal transit assistance programs, directs plan-ning and research, and provides technical assis-tance. In 2009, Mn/DOT's Transit Office updated the Greater Minnesota Transit Plan 2010-2030, its long-range plan that describes the challenges, policies and vision for transit in Greater Minnesota. Mn/DOT's vision is a high-quality coordinated transit network that is integrated into the overall state transportation system and meets the mobility needs of the people of Minnesota. Accomplishing this vision requires maintaining and expanding the statewide public transit network while improving efficiency and effectiveness.
Strategies Strategies in the Greater Minnesota Transit Plan include:
• Maintain existing transit systems—Provide operating and financial assistance first to existing public transit services that meet performance targets.
• New transit services—Provide resources
to start new transit services in areas with-out public transit when new financial resources are available.
• Expand core service—Provide resources to expand core service frequencies and weekday or weekend service hours of exist-ing providers.
Ongoing methods to improve service include:
• Establish performance objectives—Mn/DOT recommends local transit systems establish performance objectives for every kind of service, such as fixed routes in larg-er cities like Duluth and St. Cloud, demand response routes, and deviated routes. Service segments that do not meet local objectives are carefully examined and hours of service may be reassigned by the local operator to other segments that are more productive.
• Operational improvements—Local tran-sit operators strive for continuous opera-tional improvements by using such tools as computer-assisted scheduling software and regular assessments of local market needs.
Investment/spendingFunding for public transit service comes from three major sources. Local contributions come from passen-ger fares, contracts for services and local tax levies. State funding comes from the general fund appropri-ated each biennium and the Motor Vehicle Sales Tax. Federal contributions come from the Federal Transit Administration appropriated to each state as part of SAFETEA-LU. Limited availability of federal, state and local funding is the biggest constraint on expanding bus service to meet goals. Unstable economic condi-tions have reduced MVST revenues and state general fund revenues flowing to transit operators. 2008 bus service operating expenditures in Greater Minnesota totaled $55.6 million.
Greater Minnesota Transit operating spending is shown below. Numbers for 2005-2008 are actual reported operating costs while 2009 numbers are estimates.
In 2008, Greater Minnesota transit service hours dropped slightly to 1.01 million hours. Projected hours for 2009 and 2010 are expected to rise back to 2007 levels of 1.03 million hours. A gradual drop in service is forecast for 2020 and 2030 while need will continue to rise. A widening funding gap for both operating and capital expenses is projected after 2010 due to increasing demand and declining purchasing power.
The bus service hours chart shows target transit ser-vice levels, expressed in bus service hours to 2030 along with projected bus service hours, given estimat-ed available funding. The Greater Minnesota Transit
Plan 2010-2030 projected these services levels, tar-gets and available funding. Estimates of available fund-ing assume that the state general fund remains at its base level of $17.3 million, the Motor Vehicle Sales Tax increases by 3 percent annually, federal funds remain at the 2008 base level and local funds match the other three sources at their 2008 average of 30 percent. This 30 percent local match greatly exceeds the local match required by statute, which is 15 percent for rural areas and 20 percent for urban areas.
2000 2001 2002 2003 2004 2005 2006 2007 2008 2009 2010 2020 2030
Long Range Targets
1.03
1.03
1.03
0.99
0.84
0.87 0.91
0.93
0.96
0.92
0.93
0.95 1.01
Projected as of Jan. 2010
1.731.591.42
Source: Mn/DOT Office of Transit. Projections from Greater Minnesota Transit Plan
Greater Minnesota bus service hours (millions)
2005
$40
$60
Greater Minnesota transit operating spending($ millions)
2009
Our progress
What we are doing

41
When determining how to fund local transit agen-cies to sustain or improve bus service, Mn/DOT Office of Transit's first priority is to preserve well-performing existing services, equipment and facil-ities, then provide public transit service in com-munities and areas that are not currently served. The priorities and factors considered in making financial assistance allocation decisions are described in detail in Minnesota Rules Chapter 8835. These include meeting the objectives of the public transit participation program, accessi-bility of the system to the general public and per-sons with disabilities, local support for the sys-tem, planning for on-going service, and coordina-tion of transit services in the geographic area.
The type and extent of transit service is deter-mined locally with input from Mn/DOT's Office of
Transit staff. Broad local participation from citi-zens, government agencies, non-profit organiza-tions, and groups representing the transit-dependent, contribute to the service defined in the transit grant application.
Each year the transit system submits, as part of their application for funds, a service plan that describes the hours of service, the routes or areas served, the number of buses and the fre-quency of service. This is incorporated into the annual contract between the state and the transit system and represents their operating authority.
The Office of Transit regularly collects perfor-mance indicators for reporting and providing guidance for improving local service. These indi-cators are gathered annually:
• Cost efficiency (cost/mile and miles/vehicle)
• Service effectiveness (passenger/service hour, and passenger/mile)
• Cost effectiveness (cost/service hour, cost/passenger trip, and revenue recovery per-cent)
• Availability (hours of service and frequency)
• Ridership productivity (number of trips per year)
• Accident rate (accidents/100,000 miles)
• Maintenance program effectiveness (main-tenance expense/revenue mile)
• Fleet composition (class size and spare ratio)
Learn moreMn/DOT Office Transit
www.dot.state.mn.us/transit Mike Schadauer—[email protected]
Greater Minnesota Transit Plan 2010-2030 and other reports www.dot.state.mn.us/transit/reports.html
Federal Transit Administration Grant Programwww.fta.dot.gov/grants_financing.html
How we decide

42
!Figure 2.2 Regional and Short Line Railroads in Minnesota
MeasurePercentage of mainline miles of short-line rail-road operating above 25 mph
SystemMinnesota is served by both large freight rail-roads and 16 smaller short-line railroads. Rail service is operated over 4,631 miles of track, the eighth largest state rail network in the U.S. The measure covers the mainline trackage of 16 short line and terminal/switching railroads that operate over 30 percent of Minnesota’s rail net-work. Additionally, four Class I railroads, Burlington Northern Santa Fe, Canadian National, Canadian Pacific and Union Pacific provide ser-vice over 70 percent of the network.
Why this is importantOne in 12 railcars in Minnesota operates on short-line railroads. They provide service to farmers, manufacturers, mines and other ship-pers in small cities and urban industrial areas no longer served by the major railroads.
Minnesota’s railroads play a critical role in the state’s economy, carrying 38 percent of all freight tonnage. Major Minnesota industries rely on the rail system for efficient delivery of goods to markets throughout North America and to the world through service to the Great Lakes and coastal seaports. Rail provides critical options to shippers in terms of market access, economics, and service. It increases the state’s attractive-ness to business. Rail is more energy efficient than trucks and reduces the wear of heavy trucks on public highways.
Short-Line Railroad ConditionGREATER MINNESOTA METROPOLI-TAN AND REGIONAL MOBILITY
What we are doingThe new Statewide Freight and Passenger Rail Plan led by Mn/DOT recommends accelerating efforts to meet the rail track standard, in con-junction with other infrastructure investments. These improvements would help ensure that freight railroads have sufficient capacity to meet future demand and provide quality service in the future, and would ensure a modally balanced transportation system. Overall improvement of track will help ensure the long-term viability of rail service that shippers rely upon.
Strategies • Mn/DOT will work with the rail industry, ship-
pers and public officials to identify where track upgrades to 25 mph are needed most. Mn/DOT will measure the costs and benefits of specific proposals, and work with partners on ways to secure resources for projects. These projects have the potential to be pub-lic-private partnerships.
• Mn/DOT also works with partners to identify other needed upgrades, such as extending track access to local shippers, improving bridges, or upgrading weight capacity.
Most funding for short-line railroad improvements in Minnesota comes from the railroads or the state MRSI program. The Minnesota Rail Service Improvement Program was created in 1976. It has received General Fund appropriations total-ing $9.6 million and general obligation bond appropriations totaling $27.0 million over the life of the program, which in turn has leveraged in excess of $100 million in private, federal and local funds. MRSI funds are loaned to rail users and rail carriers for capital improvements, to rehabilitate deteriorating lines and to improve
Our progressThirty-eight percent of short-line track in Minnesota is rated for speeds greater than 25 mph. Sixty-two percent, or 556 miles, do not meet the standard. Related to this measure, 10 percent of Class 1 railroad miles also do not meet the 25 mph standard and 453 miles of all rail trackage are not rated to handle today’s 286,000 pound cars. The State Rail Plan estimates the cost to upgrade all short line and Class 1 rail track to 25 mph at $293 to $342 million.
Not all rail operators see 25 mph operations as essential, especially on local spurs in congested areas. Railroads are responsible for maintaining their infrastructure and determining the appropriate track speeds. State-funded rehabilitation through the Minnesota Rail Service Improvement Program, administered by Mn/DOT, has been limited to small segments of track compared to statewide need.
Short-line railroads in Minnesota
Investment/spending
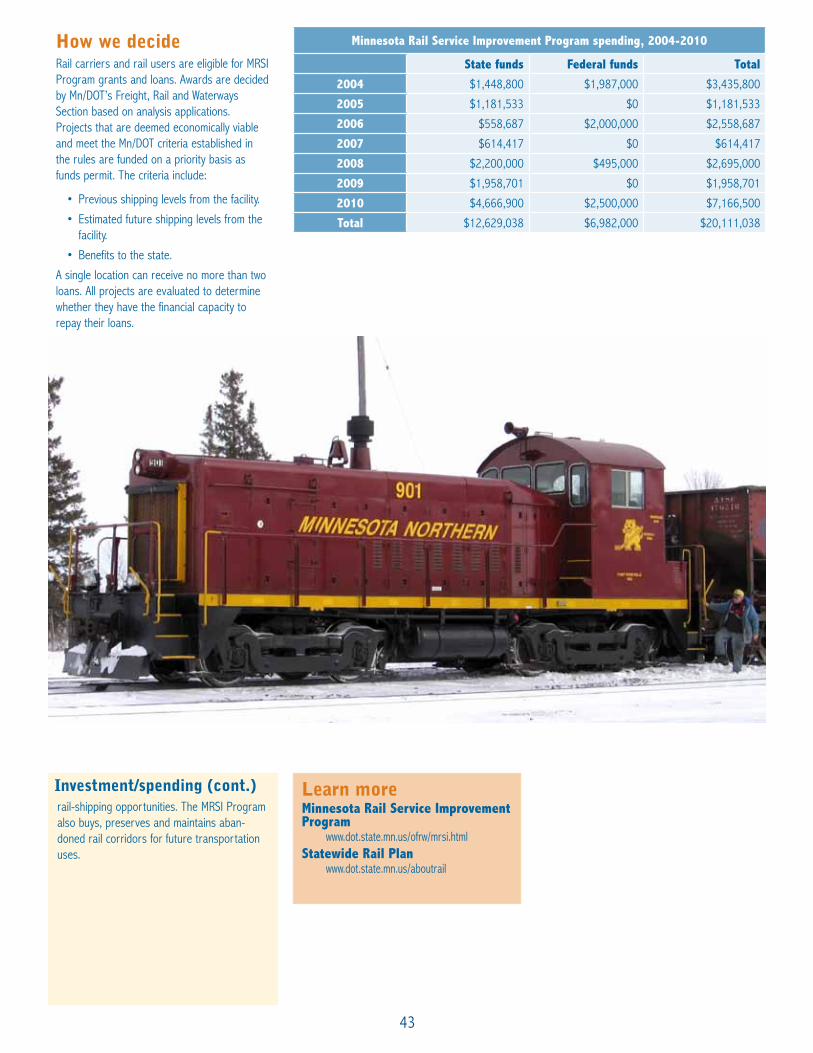
43
How we decide Rail carriers and rail users are eligible for MRSI Program grants and loans. Awards are decided by Mn/DOT’s Freight, Rail and Waterways Section based on analysis applications. Projects that are deemed economically viable and meet the Mn/DOT criteria established in the rules are funded on a priority basis as funds permit. The criteria include:
• Previous shipping levels from the facility.
• Estimated future shipping levels from the facility.
• Benefits to the state.
A single location can receive no more than two loans. All projects are evaluated to determine whether they have the financial capacity to repay their loans.
Learn moreMinnesota Rail Service Improvement Program
www.dot.state.mn.us/ofrw/mrsi.htmlStatewide Rail Plan
www.dot.state.mn.us/aboutrail
Minnesota Rail Service Improvement Program spending, 2004-2010
State funds Federal funds Total
2004 $1,448,800 $1,987,000 $3,435,800
2005 $1,181,533 $0 $1,181,533
2006 $558,687 $2,000,000 $2,558,687
2007 $614,417 $0 $614,417
2008 $2,200,000 $495,000 $2,695,000
2009 $1,958,701 $0 $1,958,701
2010 $4,666,900 $2,500,000 $7,166,500
Total $12,629,038 $6,982,000 $20,111,038
rail-shipping opportunities. The MRSI Program also buys, preserves and maintains aban-doned rail corridors for future transportation uses.
Investment/spending (cont.)
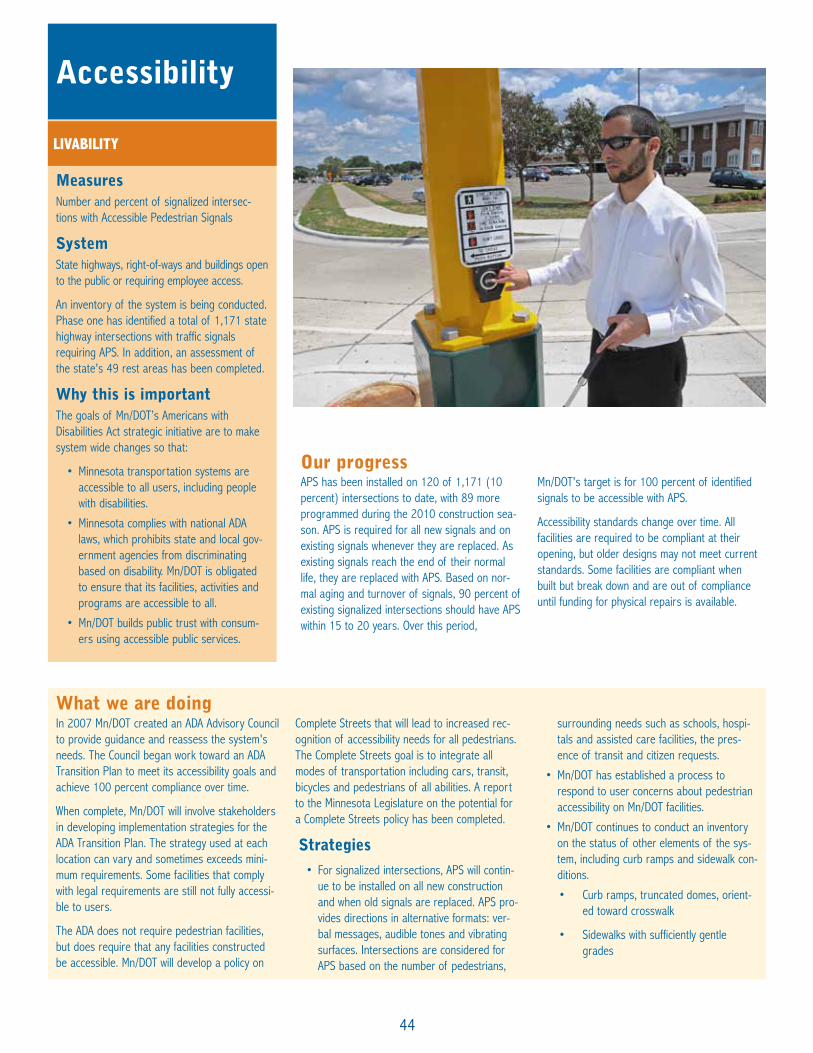
44
MeasuresNumber and percent of signalized intersec-tions with Accessible Pedestrian Signals
SystemState highways, right-of-ways and buildings open to the public or requiring employee access.
An inventory of the system is being conducted. Phase one has identified a total of 1,171 state highway intersections with traffic signals requiring APS. In addition, an assessment of the state's 49 rest areas has been completed.
Why this is importantThe goals of Mn/DOT’s Americans with Disabilities Act strategic initiative are to make system wide changes so that:
• Minnesota transportation systems are accessible to all users, including people with disabilities.
• Minnesota complies with national ADA laws, which prohibits state and local gov-ernment agencies from discriminating based on disability. Mn/DOT is obligated to ensure that its facilities, activities and programs are accessible to all.
• Mn/DOT builds public trust with consum-ers using accessible public services.
Accessibility
LIVABILITY
In 2007 Mn/DOT created an ADA Advisory Council to provide guidance and reassess the system's needs. The Council began work toward an ADA Transition Plan to meet its accessibility goals and achieve 100 percent compliance over time.
When complete, Mn/DOT will involve stakeholders in developing implementation strategies for the ADA Transition Plan. The strategy used at each location can vary and sometimes exceeds mini-mum requirements. Some facilities that comply with legal requirements are still not fully accessi-ble to users.
The ADA does not require pedestrian facilities, but does require that any facilities constructed be accessible. Mn/DOT will develop a policy on
Complete Streets that will lead to increased rec-ognition of accessibility needs for all pedestrians. The Complete Streets goal is to integrate all modes of transportation including cars, transit, bicycles and pedestrians of all abilities. A report to the Minnesota Legislature on the potential for a Complete Streets policy has been completed.
Strategies
• For signalized intersections, APS will contin-ue to be installed on all new construction and when old signals are replaced. APS pro-vides directions in alternative formats: ver-bal messages, audible tones and vibrating surfaces. Intersections are considered for APS based on the number of pedestrians,
surrounding needs such as schools, hospi-tals and assisted care facilities, the pres-ence of transit and citizen requests.
• Mn/DOT has established a process to respond to user concerns about pedestrian accessibility on Mn/DOT facilities.
• Mn/DOT continues to conduct an inventory on the status of other elements of the sys-tem, including curb ramps and sidewalk con-ditions.
• Curb ramps, truncated domes, orient-ed toward crosswalk
• Sidewalks with sufficiently gentle grades
APS has been installed on 120 of 1,171 (10 percent) intersections to date, with 89 more programmed during the 2010 construction sea-son. APS is required for all new signals and on existing signals whenever they are replaced. As existing signals reach the end of their normal life, they are replaced with APS. Based on nor-mal aging and turnover of signals, 90 percent of existing signalized intersections should have APS within 15 to 20 years. Over this period,
Mn/DOT's target is for 100 percent of identified signals to be accessible with APS.
Accessibility standards change over time. All facilities are required to be compliant at their opening, but older designs may not meet current standards. Some facilities are compliant when built but break down and are out of compliance until funding for physical repairs is available.
What we are doing
Our progress
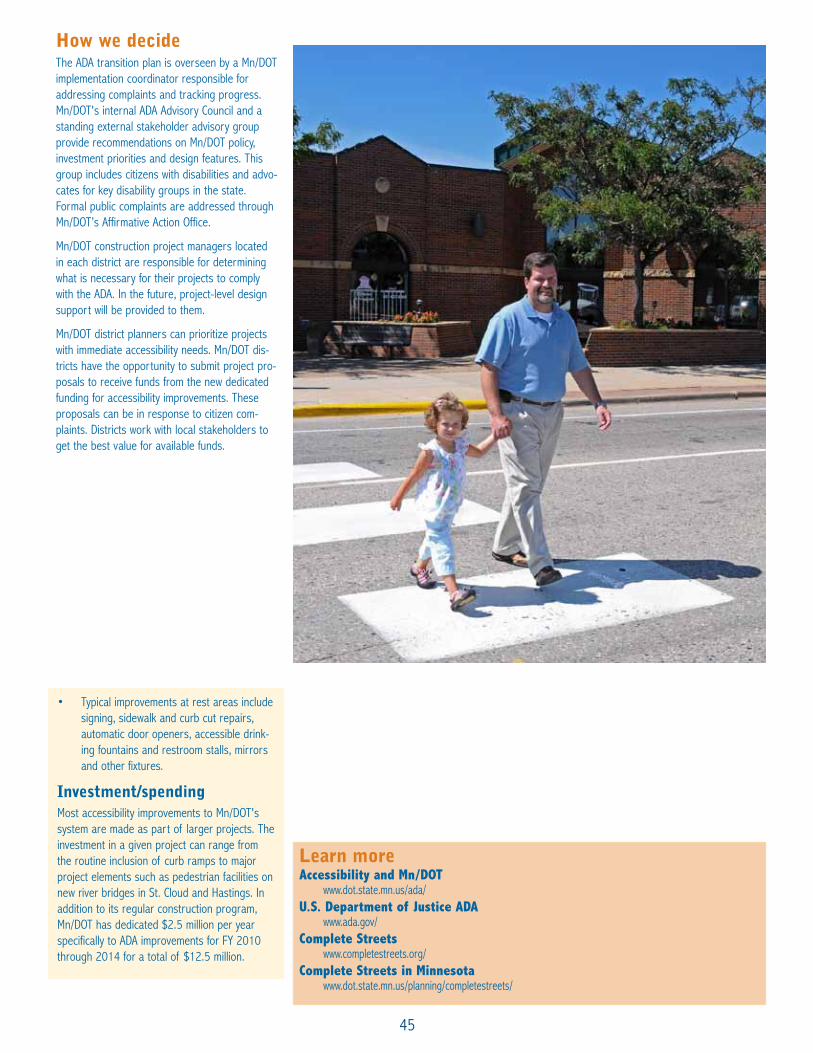
45
How we decide The ADA transition plan is overseen by a Mn/DOT implementation coordinator responsible for addressing complaints and tracking progress. Mn/DOT's internal ADA Advisory Council and a standing external stakeholder advisory group provide recommendations on Mn/DOT policy, investment priorities and design features. This group includes citizens with disabilities and advo-cates for key disability groups in the state. Formal public complaints are addressed through Mn/DOT’s Affirmative Action Office.
Mn/DOT construction project managers located in each district are responsible for determining what is necessary for their projects to comply with the ADA. In the future, project-level design support will be provided to them.
Mn/DOT district planners can prioritize projects with immediate accessibility needs. Mn/DOT dis-tricts have the opportunity to submit project pro-posals to receive funds from the new dedicated funding for accessibility improvements. These proposals can be in response to citizen com-plaints. Districts work with local stakeholders to get the best value for available funds.
Learn moreAccessibility and Mn/DOT
www.dot.state.mn.us/ada/U.S. Department of Justice ADA
www.ada.gov/Complete Streets
www.completestreets.org/Complete Streets in Minnesota
www.dot.state.mn.us/planning/completestreets/
• Typical improvements at rest areas include signing, sidewalk and curb cut repairs, automatic door openers, accessible drink-ing fountains and restroom stalls, mirrors and other fixtures.
Investment/spendingMost accessibility improvements to Mn/DOT's system are made as part of larger projects. The investment in a given project can range from the routine inclusion of curb ramps to major project elements such as pedestrian facilities on new river bridges in St. Cloud and Hastings. In addition to its regular construction program, Mn/DOT has dedicated $2.5 million per year specifically to ADA improvements for FY 2010 through 2014 for a total of $12.5 million.

46
MeasuresGallons of transportation fuel consumed in Minnesota
SystemAll taxable sales of gasoline and diesel fuel, including fuel sold for off-road use (2.2 per-cent in 2009) but not including aviation fuel.
Why this is importantThe 2007 Minnesota Next Generation Energy Act established greenhouse gas reduction goals of 15 percent by 2015, 30 percent by 2025, and 80 percent by 2050 compared with 2005. These goals apply to all sectors of the economy as well as cities, counties and state agencies. In Minnesota, transportation is responsible for about 24 percent of green-house gas emissions. Reducing petroleum fuel consumption along with other strategies can help the state achieve these goals.
Fuel Use
ENERGY AND ENVIRONMENT
In a 2008 report commissioned by the Minnesota Legislature titled A Smaller Carbon Footprint, the University of Minnesota Center for Transportation Studies suggested three broad strategies for reducing transportation’s contribution to green-house gas emissions:
• Reduce vehicle fuel consumption per mile—Improve vehicle fuel efficiency and cre-ate regulations or pricing incentives that cause consumers to purchase more efficient vehicles.
• Reduce fuel carbon content—This strat-egy requires technology shifts to more elec-tric powered vehicles or biomass fuels, eco-nomic incentives and possible legislative mandates.
• Reduce vehicle miles traveled—Provide incentives for more dense develop-ment, increase the use of transit and other alternatives to single-passenger automobile use and facilitate land use patterns that reduce trip making needs.
Mn/DOT strives to reduce emissions and improve energy efficiency through the promotion of travel modes with high occupancy, low-emission vehi-cles, alternative fuels, and property management techniques that offset greenhouse gas emissions.
StrategiesReducing emissions requires broad participation by the traveling public, the private sector and public agencies. Elements of these strategies suggested in the University of Minnesota report are being carried out:
Reducing fuel consumption per mile—The National Highway Traffic Safety Administration is proposing aggressive fuel economy standards for new vehicles. The CTS report estimates that these new standards could contribute up to 64 percent of the target emission reductions for the transportation sector in 2015.
Reducing fuel carbon content—Minnesota already has strong provisions promoting alterna-tive fuel used. The full effect of this strategy will not be realized until the 2025 goal time period. However, the CTS predicts:
“If Minnesota adopts a low-carbon fuel standard requiring low-carbon biofuels and alternative fuels, the study projects that car-bon emissions would fall 10 percent by 2020 and 12 percent by 2025. This policy could contribute 27 percent of Minnesota reduction goals in 2015 and 40 percent in 2025.”
In Minnesota, transportation fuel consumption grew steadily until 2004, when it began a decline that continued through 2009. At about the same time, the state saw a slowing and leveling off in annual vehicle miles of travel (VMT). Vehicle miles traveled began reversing in 2004 and declined by 0.7 percent from 2007 to 2008. The Mn/DOT Office of Finance predicts that fuel sales will remain flat for the next four years.
Rising gas prices, a slowing in the economy and job losses are factors contributing to the leveling off in fuel consumption and travel. Others fac-tors include more efficient vehicles and peaking in the number of vehicles owned per driver. In the Twin Cities area, when gas prices increased more motorists began taking fewer trips, car-pooling and using public transportation. Metro Area transit ridership has been increasing since 2004, and grew by 6.5 percent from 2007 to 2008.
Transportation fuel consumption in Minnesota 1995-2009 (billions of gallons)
For comparisonIn 2008, Minnesota ranked 19th of 50 states by gasoline use in the transportation sector, accord-ing to Mn/DOT analysis of US Energy Information Agency and Census data. Minnesota's gasoline use per capita is about 8 percent higher than the national average. Diesel use data were not avail-able for all states.
3.05
3.11
3.19
3.26
3.28
3.32
3.30
3.25
3.25
3.16
20092000 2001 2002 2003 2004 2005 2006 2007 2008
Mn/DOT gasoline and ethanol use 2002-2009 (millions of gallons)
1.42
.16
1.24 1.30
1.27 1.31
1.23
1.12 1.28
.15
.16
.15 .16 .25 .32
.31
GasolineEthanol
1.581.39 1.46 1.42 1.47 1.48 1.44
1.59
20052002 2003 2004 2006 20092007 2008
Our progress What we are doing
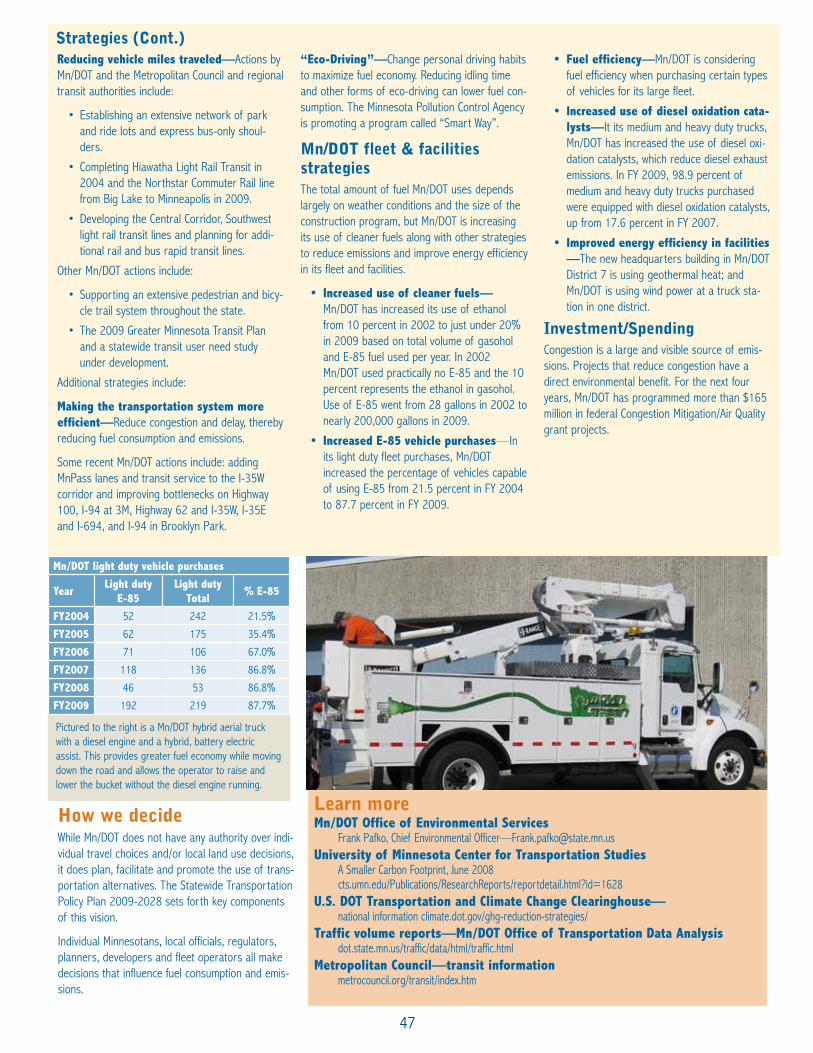
47
How we decide While Mn/DOT does not have any authority over indi-vidual travel choices and/or local land use decisions, it does plan, facilitate and promote the use of trans-portation alternatives. The Statewide Transportation Policy Plan 2009-2028 sets forth key components of this vision.
Individual Minnesotans, local officials, regulators, planners, developers and fleet operators all make decisions that influence fuel consumption and emis-sions.
Learn moreMn/DOT Office of Environmental Services
Frank Pafko, Chief Environmental Officer—[email protected] of Minnesota Center for Transportation Studies
A Smaller Carbon Footprint, June 2008 cts.umn.edu/Publications/ResearchReports/reportdetail.html?id=1628
U.S. DOT Transportation and Climate Change Clearinghouse—national information climate.dot.gov/ghg-reduction-strategies/
Traffic volume reports—Mn/DOT Office of Transportation Data Analysis dot.state.mn.us/traffic/data/html/traffic.html
Metropolitan Council—transit informationmetrocouncil.org/transit/index.htm
Reducing vehicle miles traveled—Actions by Mn/DOT and the Metropolitan Council and regional transit authorities include:
• Establishing an extensive network of park and ride lots and express bus-only shoul-ders.
• Completing Hiawatha Light Rail Transit in 2004 and the Northstar Commuter Rail line from Big Lake to Minneapolis in 2009.
• Developing the Central Corridor, Southwest light rail transit lines and planning for addi-tional rail and bus rapid transit lines.
Other Mn/DOT actions include:
• Supporting an extensive pedestrian and bicy-cle trail system throughout the state.
• The 2009 Greater Minnesota Transit Plan and a statewide transit user need study under development.
Additional strategies include:
Making the transportation system more efficient—Reduce congestion and delay, thereby reducing fuel consumption and emissions.
Some recent Mn/DOT actions include: adding MnPass lanes and transit service to the I-35W corridor and improving bottlenecks on Highway 100, I-94 at 3M, Highway 62 and I-35W, I-35E and I-694, and I-94 in Brooklyn Park.
“Eco-Driving”—Change personal driving habits to maximize fuel economy. Reducing idling time and other forms of eco-driving can lower fuel con-sumption. The Minnesota Pollution Control Agency is promoting a program called “Smart Way”.
Mn/DOT fleet & facilities strategiesThe total amount of fuel Mn/DOT uses depends largely on weather conditions and the size of the construction program, but Mn/DOT is increasing its use of cleaner fuels along with other strategies to reduce emissions and improve energy efficiency in its fleet and facilities.
• Increased use of cleaner fuels— Mn/DOT has increased its use of ethanol from 10 percent in 2002 to just under 20% in 2009 based on total volume of gasohol and E-85 fuel used per year. In 2002 Mn/DOT used practically no E-85 and the 10 percent represents the ethanol in gasohol. Use of E-85 went from 28 gallons in 2002 to nearly 200,000 gallons in 2009.
• Increased E-85 vehicle purchases—In its light duty fleet purchases, Mn/DOT increased the percentage of vehicles capable of using E-85 from 21.5 percent in FY 2004 to 87.7 percent in FY 2009.
• Fuel efficiency—Mn/DOT is considering fuel efficiency when purchasing certain types of vehicles for its large fleet.
• Increased use of diesel oxidation cata-lysts—It its medium and heavy duty trucks, Mn/DOT has increased the use of diesel oxi-dation catalysts, which reduce diesel exhaust emissions. In FY 2009, 98.9 percent of medium and heavy duty trucks purchased were equipped with diesel oxidation catalysts, up from 17.6 percent in FY 2007.
• Improved energy efficiency in facilities —The new headquarters building in Mn/DOT District 7 is using geothermal heat; and Mn/DOT is using wind power at a truck sta-tion in one district.
Investment/SpendingCongestion is a large and visible source of emis-sions. Projects that reduce congestion have a direct environmental benefit. For the next four years, Mn/DOT has programmed more than $165 million in federal Congestion Mitigation/Air Quality grant projects.
Strategies (Cont.)
Mn/DOT light duty vehicle purchases
YearLight duty
E-85Light duty
Total% E-85
FY2004 52 242 21.5%
FY2005 62 175 35.4%
FY2006 71 106 67.0%
FY2007 118 136 86.8%
FY2008 46 53 86.8%
FY2009 192 219 87.7%
Pictured to the right is a Mn/DOT hybrid aerial truck with a diesel engine and a hybrid, battery electric assist. This provides greater fuel economy while moving down the road and allows the operator to raise and lower the bucket without the diesel engine running.

48
MeasuresPercentage of Mn/DOT construction projects put out for bid in the year scheduled
ScopeApplies to all projects in current year of the State Transportation Improvement Program, which is Mn/DOT’s four-year construction pro-gram.
Why this is importantMn/DOT is working to strengthen decision-making accountability and transparency, and to build public trust. This includes setting clear, measurable goals for major services and activi-ties and reporting the results to policy makers and the public. For construction projects, Mn/DOT’s goal is to deliver them on schedule and within budget.
Project DeliveryACCOUNTABILITY AND TRANSPARENCY
Mn/DOT is engaged in a number of new and ongoing initiatives to build transparency and trust with communities and partners through involvement and better sharing of information and ideas.
Strategies
Cost estimating/cost management poli-cies—To improve delivery of construction proj-ects on schedule and on budget, Mn/DOT is car-rying out a major effort to upgrade how it fig-ures project cost estimates and manages costs as projects are designed and constructed. Estimates are becoming Total Project Cost Estimates (TPCE) and include land, engineering and utilities rather than just construction costs.
Performance Reports—During the develop-ment phase of STIP projects, Mn/DOT prepares reports analyzing whether the project is meeting its original schedule. Mn/DOT also does annual performance reports with executive staff to eval-uate progress delivering projects “on schedule, on budget.”
Scoping Process—Mn/DOT has implemented a better way of scoping projects to avoid cost escalation by ensuring that original cost esti-mates incorporate all engineering, community and environmental concerns in line with the proj-ect’s stated purpose.
Investment/spendingMn/DOT awarded $929 million in highway and related construction projects in 2009 and $626 million in 2008. Over $1.2 billion is planned for 2010. 2009 and 2010 are the largest construc-tion programs in Mn/DOT's history. Roughly 17 percent of these amounts are dedicated to proj-ect planning, design, development and to con-struction management and oversight. The chart shows Mn/DOT’s total construction program awards from FY2004 through FY2013.
In 2009, Minnesota received $505.6 million of reimbursable appropriations in federal Highway Infrastructure Investment funds for transporta-tion projects under the American Recovery and Reinvestment Act (ARRA.) The 2009 construction program total includes $165 million in ARRA funds. Of the $1.2 billion planned for 2010, $185 million are ARRA funds. As of January 2010, 198 ARRA projects had been put out for bid, with a value of more than $480 million. Minnesota’s ARRA transportation projects will benefit highway pavement condition, bridges, safety, and travel speed, as well as trails, rail-roads and the Port of Duluth.
Our progressThe target for this measure is to let at least 90 percent of the projects in the current year of the STIP on time. Mn/DOT has improved results for this measure over the last nine years, reaching 93 percent in 2009 compared to 83% in 2000. In 2008, results dipped to 83 percent, largely due to the need to shift resources to rebuild the I-35W Bridge in Minneapolis and respond to floods in southeast Minnesota.
To evaluate performance of delivering projects on schedule, Mn/DOT measures the percentage of its projects that are let for construction (put out for bid) in the year programmed (planned and funded). A project is programmed if it is listed in the state’s four-year construction pro-gram, the STIP.
Once a project is listed in the current year of the STIP, it is usually well along in the process that leads to bidding and final contract approv-al, the target is 90 percent as most of the projects not let on schedule are simply delayed.
Percentage of Mn/DOT projects put out for bid (let for construction) in the year scheduled
93%
78% 80%
79%
81%
87%
86% 92%
83%
20092001 2002 2003 2004 2005 2006 2007 2008
Target ≥90 percent
FY 2005
$400
$1,200 FY 2010 FY 2013
Mn/DOT construction program($ millions—all sources)
What we are doing

49
How we decidePlanners and engineers in each Mn/DOT dis-trict conduct the long process of planning and designing construction projects. They aim to meet the schedule announced to communities and contractors interested in bidding. In a few projects, such as the 2007-2008 I-35W Bridge project, the entire process from design through construction is awarded to a “design-build” contractor that assumes full responsibil-ity for on-time delivery, with incentives and penalties. Each district has an annual budget for construction and typically prepare several (more than 50 in the Twin Cities metro area) new projects for bidding and construction each year, at the same time as it is developing many more projects for future years. The district's project manager and the district engineer are responsible for project delays.
Factors which may cause a delay in bidding for construction include: unforeseen emergency work which diverts resources, unexpected changes requested by communities, inability to obtain municipal approval, delays in getting required permits, not acquiring land on time, and late changes in a project’s cost. Cost increases, state or federal revenue shortfalls, or new priorities set by Mn/DOT or the legisla-ture can also change a district’s program of projects and force delays. If districts have a choice, they try to maintain the schedule for projects benefiting statewide priorities of safe-ty, and bridge and pavement preservation.
Learn moreMn/DOT Office Technical Support
www.dot.state.mn.us/tecsupSteve Ryan—[email protected]
Mn/DOT Office of Project Scope and Cost Managementwww.dot.state.mn.us/cost-estimating/news/
State Transportation Improvement Program (Mn/DOT's four-year construction program)
www.dot.state.mn.us/planning/program/stip.html2009 American Recovery and Reinvestment Act (ARRA)
www.dot.state.mn.us/federalrecoveryMinnesota Management and Budget RECOVERY.MN
www.mmb.state.mn.us/recovery
Minnesota ARRA transportation projects2009—2010

Transportation Systems in Minnesotasystem extent ownership funding source Mn/DOT role
stre
ets,
road
s an
d hi
ghwa
ys
State Trunk Highways
11,883 milesState fuel tax, motor ve-hicle sales tax, registration fees, federal funds
Construction, op-eration, maintenance, management
County State Aid Highways (CSAH)
30,544 milesState fuel tax, motor vehicle sales tax, registra-tion fees, federal funds, local funds
Coordination of proj-ects that impact state trunk highways, ad-ministration of state and federal funding (68% of county roads are eligible for state aid funds)
Other County Roads
14,403 miles
Municipal State Aid Streets (MSAS)
3221 milesState fuel tax, motor vehicle sales tax, registra-tion fees, federal funds, local funds
Coordination of projects that impact state trunk highways, administration of state and federal funding (15% of city streets are eligible for state aid funds)
Other City Streets
18,800 miles
Township 58,166 miles
State and local fundsCoordination of projects that impact state trunk highways
Other 4025 miles
Total 141,042 miles
trans
it
Twin Cities area218 bus routes, 1 light rail route, 1 commuter rail line
Metro Transit, Suburban Transit Providers on public right-of-way
Federal funds, state gen-eral funds, vehicle sales tax, local funds, fares
Construct and maintain transit infrastructure
Greater Min-nesota
60 public transit systems serving 76 out of 80 Greater Mn counties
City and county transit authoritiesPlanning and adminis-tration of funding
rail
Freight 4631 track miles20 railroads operate and own track: 4 Class I (70% of network) and 16 Class III (30%)
Private funds for op-erations, state and private funds for track
Planning and policy, support for infra-structure improve-ments
PassengerAmtrak Empire Builder (Chicago to Seattle)
Federally operated on privately-owned track Federal funds, fares
Planning, policy, research, federal and state program administration
air
Passenger and cargo
136 airports, 8 with commercial service
Metropolitan Airport Commission owns 9 metro airports; Others are owned by Greater Minnesota cities and counties
Aircraft registration tax, airline flight property tax, aviation fuel tax, federal funds
Airport development, planning, research, navigational systems
wate
rway
s Great Lakes4 ports on Lake Superior
Local port authorities and private companies provide port operations. Channels (9 ft. draft on rivers, 29 ft. on Great Lakes) are maintained by the U.S. Army Corps of Engineers.
Local port authority re-ceipts, state general funds, federal funds
Planning and policy, support for infra-structure improve-mentsRivers
5 ports on 222 miles of the Mississippi River system
State 58%County 24%
City 16%
Township 2%
By share of vehicle-miles traveled
Other 3%
By share of centerline miles
State 8%
Township 41% County 32%
City 16%
50
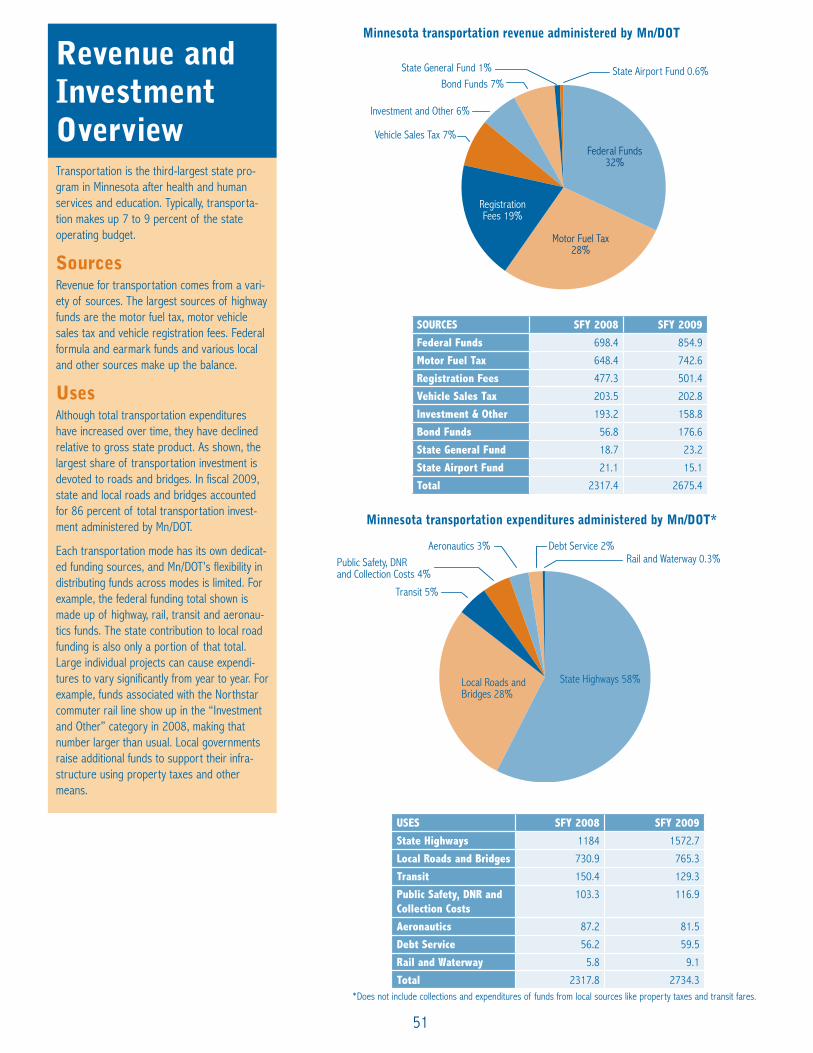
51
Revenue and Investment OverviewTransportation is the third-largest state pro-gram in Minnesota after health and human services and education. Typically, transporta-tion makes up 7 to 9 percent of the state operating budget.
SourcesRevenue for transportation comes from a vari-ety of sources. The largest sources of highway funds are the motor fuel tax, motor vehicle sales tax and vehicle registration fees. Federal formula and earmark funds and various local and other sources make up the balance.
UsesAlthough total transportation expenditures have increased over time, they have declined relative to gross state product. As shown, the largest share of transportation investment is devoted to roads and bridges. In fiscal 2009, state and local roads and bridges accounted for 86 percent of total transportation invest-ment administered by Mn/DOT.
Each transportation mode has its own dedicat-ed funding sources, and Mn/DOT’s flexibility in distributing funds across modes is limited. For example, the federal funding total shown is made up of highway, rail, transit and aeronau-tics funds. The state contribution to local road funding is also only a portion of that total. Large individual projects can cause expendi-tures to vary significantly from year to year. For example, funds associated with the Northstar commuter rail line show up in the “Investment and Other” category in 2008, making that number larger than usual. Local governments raise additional funds to support their infra-structure using property taxes and other means.
SOURCES SFY 2008 SFY 2009
Federal Funds 698.4 854.9
Motor Fuel Tax 648.4 742.6
Registration Fees 477.3 501.4
Vehicle Sales Tax 203.5 202.8
Investment & Other 193.2 158.8
Bond Funds 56.8 176.6
State General Fund 18.7 23.2
State Airport Fund 21.1 15.1
Total 2317.4 2675.4
USES SFY 2008 SFY 2009
State Highways 1184 1572.7
Local Roads and Bridges 730.9 765.3
Transit 150.4 129.3
Public Safety, DNR and Collection Costs
103.3 116.9
Aeronautics 87.2 81.5
Debt Service 56.2 59.5
Rail and Waterway 5.8 9.1
Total 2317.8 2734.3
Vehicle Sales Tax 7%
RegistrationFees 19%
Motor Fuel Tax28%
State General Fund 1%
Federal Funds32%
Investment and Other 6%
Bond Funds 7%State Airport Fund 0.6%
Transit 5%
Public Safety, DNRand Collection Costs 4%
Aeronautics 3% Debt Service 2%Rail and Waterway 0.3%
State Highways 58%Local Roads andBridges 28%
Minnesota transportation revenue administered by Mn/DOT
Minnesota transportation expenditures administered by Mn/DOT*
*Does not include collections and expenditures of funds from local sources like property taxes and transit fares.

52
Bridge Preservation$911M 27%
($729M for Chapter 152,$182M for other bridges)
Other Preservation(signs, rest areas, etc.)
$109M 3%
Pavement Preservation$1,029M 31%
Safety$328M 10%
Right-of-way Supplemental Agreements,Other $370M 11%
Greater MinnesotaMobility $65M 2%
Twin Cities Mobility$197M 6%
Regional & CommunityImprovements
$311M 9%
Bond Accelerated ProjectsARRA
Regular Program I-35Chapter 152 Bonds
*Predicted funding based on the 2010-2013 STIP
414
199
114
476
202
78 123
273
165
185
431
80
482
420
725
72
353
617
546 591
583 615
511
896
619
797
62633
5929
1212
793
661738
2005 2010*2004 2006 20092007 2008 2013*2012*2011*
Priority Share
Preservation 62%
Safety 10%
Mobility 8%
Regional & Community Improvements 9%
Right-of-way, Supplemental Agreements, Other 11%
Distribution of state highway capital investments 2010-2013
Mn/DOT construction program awards: Fiscal years 2004-2013 ($ millions)
Statewide Highway Investment PlanSince highways make up such a large part of over-all transportation investment, a more detailed breakdown is presented. The goal of Mn/DOT's highway investment process for Minnesota is a pro-gram based on balancing performance-based needs for traveler safety, infrastructure preserva-tion and mobility with other projects desired from a community development perspective. The Statewide 20-year Highway Investment Plan 2009-2028 was developed to ensure planned improve-ments address statewide goals and are developed in a consistent, objective manner.
Since the identified needs far exceed projected funding, investment goals are established. Districts are given guidance to sufficiently fund bridges in the Chapter 152 program and to fund about 85 percent of other bridge preservation needs. The recommended allocation for safety needs is three times each district’s Highway Safety Improvement Program goal. Of the remaining funds, 70 percent are to be directed to pavement preservation and the rest can be divided among capacity improve-ments for traveler safety, mobility improvements, and regional and community improvements.
Investments included in the 2010-2013 State Transportation Improvement Program are shown at right. The combined preservation investments for bridges, pavement and other highway assets make up 62% of all highway capital investment.
The trend in total construction program funding is shown below. Chapter 152 and the American Recovery and Reinvestment Act provided an increase in funding for 2009 and 2010, but Mn/DOT regular program funds are not increasing, and overall investment in construction will decline once funds from these temporary sources are spent.
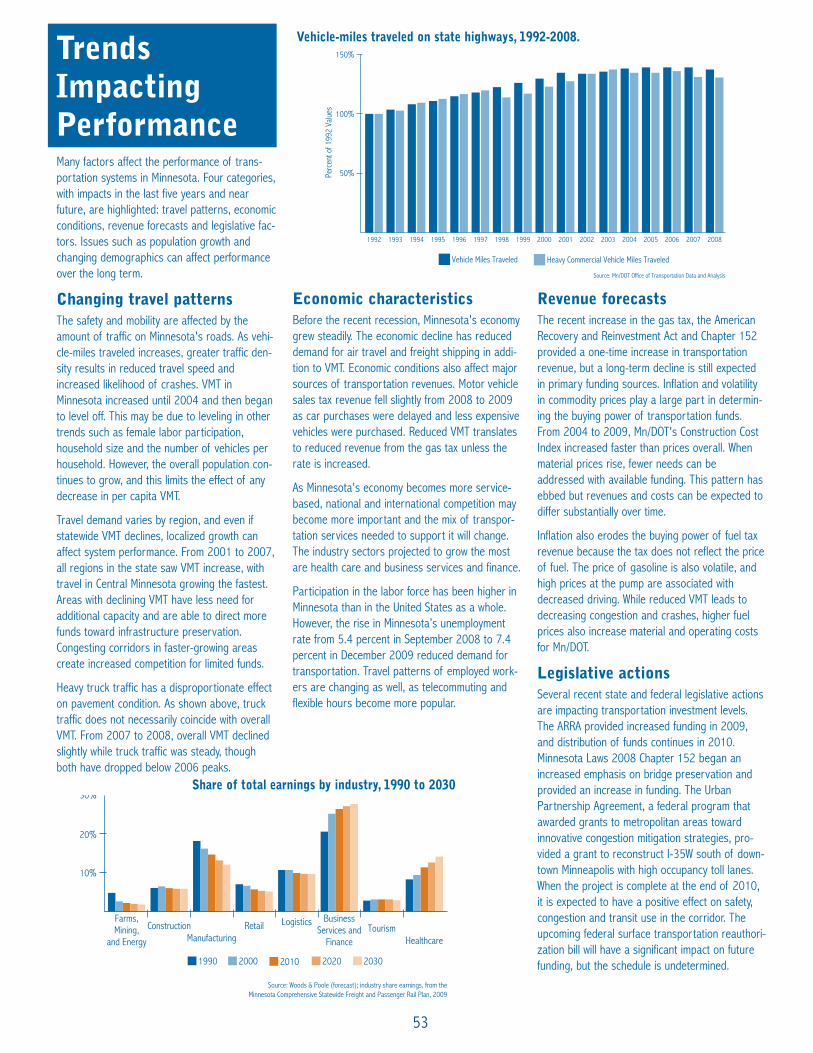
53
Many factors affect the performance of trans-portation systems in Minnesota. Four categories, with impacts in the last five years and near future, are highlighted: travel patterns, economic conditions, revenue forecasts and legislative fac-tors. Issues such as population growth and changing demographics can affect performance over the long term.
Changing travel patternsThe safety and mobility are affected by the amount of traffic on Minnesota's roads. As vehi-cle-miles traveled increases, greater traffic den-sity results in reduced travel speed and increased likelihood of crashes. VMT in Minnesota increased until 2004 and then began to level off. This may be due to leveling in other trends such as female labor participation, household size and the number of vehicles per household. However, the overall population con-tinues to grow, and this limits the effect of any decrease in per capita VMT.
Travel demand varies by region, and even if statewide VMT declines, localized growth can affect system performance. From 2001 to 2007, all regions in the state saw VMT increase, with travel in Central Minnesota growing the fastest. Areas with declining VMT have less need for additional capacity and are able to direct more funds toward infrastructure preservation. Congesting corridors in faster-growing areas create increased competition for limited funds.
Heavy truck traffic has a disproportionate effect on pavement condition. As shown above, truck traffic does not necessarily coincide with overall VMT. From 2007 to 2008, overall VMT declined slightly while truck traffic was steady, though both have dropped below 2006 peaks.
Vehicle-miles traveled on state highways, 1992-2008.
Share of total earnings by industry, 1990 to 2030
1990
10%
20%
30%
2000 2010 2020 2030
Source: Woods & Poole (forecast); industry share earnings, from theMinnesota Comprehensive Statewide Freight and Passenger Rail Plan, 2009
Farms,Mining,
and Energy
ConstructionManufacturing
Retail Logistics BusinessServices and
FinanceTourism
Healthcare
Economic characteristicsBefore the recent recession, Minnesota's economy grew steadily. The economic decline has reduced demand for air travel and freight shipping in addi-tion to VMT. Economic conditions also affect major sources of transportation revenues. Motor vehicle sales tax revenue fell slightly from 2008 to 2009 as car purchases were delayed and less expensive vehicles were purchased. Reduced VMT translates to reduced revenue from the gas tax unless the rate is increased.
As Minnesota's economy becomes more service-based, national and international competition may become more important and the mix of transpor-tation services needed to support it will change. The industry sectors projected to grow the most are health care and business services and finance.
Participation in the labor force has been higher in Minnesota than in the United States as a whole. However, the rise in Minnesota’s unemployment rate from 5.4 percent in September 2008 to 7.4 percent in December 2009 reduced demand for transportation. Travel patterns of employed work-ers are changing as well, as telecommuting and flexible hours become more popular.
Revenue forecastsThe recent increase in the gas tax, the American Recovery and Reinvestment Act and Chapter 152 provided a one-time increase in transportation revenue, but a long-term decline is still expected in primary funding sources. Inflation and volatility in commodity prices play a large part in determin-ing the buying power of transportation funds. From 2004 to 2009, Mn/DOT's Construction Cost Index increased faster than prices overall. When material prices rise, fewer needs can be addressed with available funding. This pattern has ebbed but revenues and costs can be expected to differ substantially over time.
Inflation also erodes the buying power of fuel tax revenue because the tax does not reflect the price of fuel. The price of gasoline is also volatile, and high prices at the pump are associated with decreased driving. While reduced VMT leads to decreasing congestion and crashes, higher fuel prices also increase material and operating costs for Mn/DOT.
Legislative actionsSeveral recent state and federal legislative actions are impacting transportation investment levels. The ARRA provided increased funding in 2009, and distribution of funds continues in 2010. Minnesota Laws 2008 Chapter 152 began an increased emphasis on bridge preservation and provided an increase in funding. The Urban Partnership Agreement, a federal program that awarded grants to metropolitan areas toward innovative congestion mitigation strategies, pro-vided a grant to reconstruct I-35W south of down-town Minneapolis with high occupancy toll lanes. When the project is complete at the end of 2010, it is expected to have a positive effect on safety, congestion and transit use in the corridor. The upcoming federal surface transportation reauthori-zation bill will have a significant impact on future funding, but the schedule is undetermined.
Trends Impacting Performance
Vehicle Miles Traveled
Perc
ent o
f 199
2 Va
lues
Heavy Commercial Vehicle Miles Traveled
Source: Mn/DOT Office of Transportation Data and Analysis
1992 1993 1994 1995 1996 1997 1998 1999 2000 2001 2002 2003 2004 2005 2006 2007 2008
50%
100%
150%
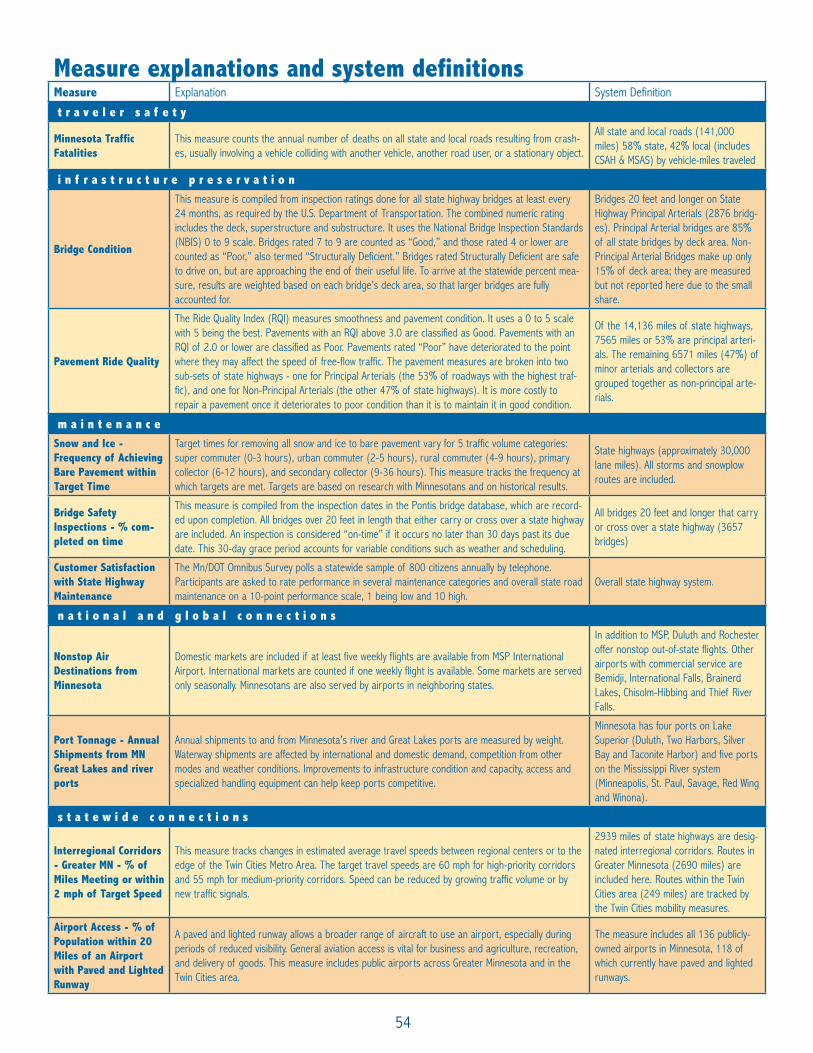
Measure explanations and system definitionsMeasure Explanation System Definition
t r a v e l e r s a f e t y
Minnesota Traffic Fatalities
This measure counts the annual number of deaths on all state and local roads resulting from crash-es, usually involving a vehicle colliding with another vehicle, another road user, or a stationary object.
All state and local roads (141,000 miles) 58% state, 42% local (includes CSAH & MSAS) by vehicle-miles traveled
i n f r a s t r u c t u r e p r e s e r v a t i o n
Bridge Condition
This measure is compiled from inspection ratings done for all state highway bridges at least every 24 months, as required by the U.S. Department of Transportation. The combined numeric rating includes the deck, superstructure and substructure. It uses the National Bridge Inspection Standards (NBIS) 0 to 9 scale. Bridges rated 7 to 9 are counted as “Good,” and those rated 4 or lower are counted as “Poor,” also termed “Structurally Deficient.” Bridges rated Structurally Deficient are safe to drive on, but are approaching the end of their useful life. To arrive at the statewide percent mea-sure, results are weighted based on each bridge’s deck area, so that larger bridges are fully accounted for.
Bridges 20 feet and longer on State Highway Principal Arterials (2876 bridg-es). Principal Arterial bridges are 85% of all state bridges by deck area. Non-Principal Arterial Bridges make up only 15% of deck area; they are measured but not reported here due to the small share.
Pavement Ride Quality
The Ride Quality Index (RQI) measures smoothness and pavement condition. It uses a 0 to 5 scale with 5 being the best. Pavements with an RQI above 3.0 are classified as Good. Pavements with an RQI of 2.0 or lower are classified as Poor. Pavements rated “Poor” have deteriorated to the point where they may affect the speed of free-flow traffic. The pavement measures are broken into two sub-sets of state highways - one for Principal Arterials (the 53% of roadways with the highest traf-fic), and one for Non-Principal Arterials (the other 47% of state highways). It is more costly to repair a pavement once it deteriorates to poor condition than it is to maintain it in good condition.
Of the 14,136 miles of state highways, 7565 miles or 53% are principal arteri-als. The remaining 6571 miles (47%) of minor arterials and collectors are grouped together as non-principal arte-rials.
m a i n t e n a n c eSnow and Ice - Frequency of Achieving Bare Pavement within Target Time
Target times for removing all snow and ice to bare pavement vary for 5 traffic volume categories: super commuter (0-3 hours), urban commuter (2-5 hours), rural commuter (4-9 hours), primary collector (6-12 hours), and secondary collector (9-36 hours). This measure tracks the frequency at which targets are met. Targets are based on research with Minnesotans and on historical results.
State highways (approximately 30,000 lane miles). All storms and snowplow routes are included.
Bridge Safety Inspections - % com-pleted on time
This measure is compiled from the inspection dates in the Pontis bridge database, which are record-ed upon completion. All bridges over 20 feet in length that either carry or cross over a state highway are included. An inspection is considered “on-time” if it occurs no later than 30 days past its due date. This 30-day grace period accounts for variable conditions such as weather and scheduling.
All bridges 20 feet and longer that carry or cross over a state highway (3657 bridges)
Customer Satisfaction with State Highway Maintenance
The Mn/DOT Omnibus Survey polls a statewide sample of 800 citizens annually by telephone. Participants are asked to rate performance in several maintenance categories and overall state road maintenance on a 10-point performance scale, 1 being low and 10 high.
Overall state highway system.
n a t i o n a l a n d g l o b a l c o n n e c t i o n s
Nonstop Air Destinations from Minnesota
Domestic markets are included if at least five weekly flights are available from MSP International Airport. International markets are counted if one weekly flight is available. Some markets are served only seasonally. Minnesotans are also served by airports in neighboring states.
In addition to MSP, Duluth and Rochester offer nonstop out-of-state flights. Other airports with commercial service are Bemidji, International Falls, Brainerd Lakes, Chisolm-Hibbing and Thief River Falls.
Port Tonnage - Annual Shipments from MN Great Lakes and river ports
Annual shipments to and from Minnesota’s river and Great Lakes ports are measured by weight. Waterway shipments are affected by international and domestic demand, competition from other modes and weather conditions. Improvements to infrastructure condition and capacity, access and specialized handling equipment can help keep ports competitive.
Minnesota has four ports on Lake Superior (Duluth, Two Harbors, Silver Bay and Taconite Harbor) and five ports on the Mississippi River system (Minneapolis, St. Paul, Savage, Red Wing and Winona).
s t a t e w i d e c o n n e c t i o n s
Interregional Corridors - Greater MN - % of Miles Meeting or within 2 mph of Target Speed
This measure tracks changes in estimated average travel speeds between regional centers or to the edge of the Twin Cities Metro Area. The target travel speeds are 60 mph for high-priority corridors and 55 mph for medium-priority corridors. Speed can be reduced by growing traffic volume or by new traffic signals.
2939 miles of state highways are desig-nated interregional corridors. Routes in Greater Minnesota (2690 miles) are included here. Routes within the Twin Cities area (249 miles) are tracked by the Twin Cities mobility measures.
Airport Access - % of Population within 20 Miles of an Airport with Paved and Lighted Runway
A paved and lighted runway allows a broader range of aircraft to use an airport, especially during periods of reduced visibility. General aviation access is vital for business and agriculture, recreation, and delivery of goods. This measure includes public airports across Greater Minnesota and in the Twin Cities area.
The measure includes all 136 publicly-owned airports in Minnesota, 118 of which currently have paved and lighted runways.
54

t w i n c i t i e s m o b i l i t yTwin Cities Urban Freeway System Congestion - % of Miles Below 45 mph in AM or PM Peak
The measure tracks the percent of Metro Area freeway miles congested below 45 mph for 5 minutes or more during weekday AM or PM peak periods. Since 2003, the system measured has increased from 320 miles to 379, decreasing the average congestion level with the addition of uncongested suburban freeway miles. The trend graph equalizes the change over all the years shown.
This congestion measure covers 379 centerline miles of freeway in the Twin Cities metropolitan area.
Clearance Time for Metro Urban Freeway Incidents - 3-year average
This measure tracks the time it takes Mn/DOT and partners to clear incidents on the Metro Area freeway system, such as stalled cars, crashes and other disruptions to normal traffic flow. Response may require tow trucks, police or highway patrol, medical help, road maintenance crews, HazMat teams, or other emergency services.
The Freeway Incident Response Safety Team operates on about 400 miles of Twin Cities area freeways.
Annual Express Transit Ridership
This measure determines the total annual ridership of transit service that represents a premium over regular-route bus service in terms of travel time or ride quality. Services included are express bus, bus rapid transit, light rail and van pool. Commuter rail will be included in the future.
All providers are counted. Metro Transit is the largest provider, and others include Southwest Transit, Minnesota Valley Transit, Maple Grove, Shakopee, Minnetonka, Plymouth and Prior Lake.
g r e a t e r m i n n e s o t a m e t r o p o l i t a n a n d r e g i o n a l m o b i l i t y
Greater Minnesota Bus Service Hours
This measure tracks the extent to which transit needs are met in Greater Minnesota’s 80 counties. It compares total bus service hours provided to the total hours of need, calculated by demographic factors of groups likely to use transit.
Greater Minnesota transit systems (60 providers serving 76 of 80 counties). Local transit operators sponsored by cit-ies, counties, or regional authorities pro-vide regularly-scheduled bus service or dial-a-ride services.
Railroad Track Speed - % of miles of short line railroad above 25 mph
This measure represents the percentage of total mileage on Class III railroads that can accommo-date speeds of at least 25 miles per hour. At lower speeds, it is difficult for rail to compete with trucks for freight shipments.
Minnesota has 16 short-line or terminal/switching railroads. Of the 4631 total railroad track miles in the state, 1378 are located on regional and short-line railroads.
c o m m u n i t y l i v a b i l i t y
ADA-Accessible Pedestrian Signals - % of state highway inter-sections with APS
This measure is expressed as a percentage of signalized intersections that meet ADA requirements for accessibility to people with disabilities. Accessible Pedestrian Signals (APS) include such compo-nents as audible signals, reachable push-button detectors and curb ramps oriented toward the crosswalk.
ADA applies to all pedestrian and public right of way facilities, and also to public hearings, meetings, buildings and docu-ments. In addition, Mn/DOT is responsi-ble for assisting local governments with compliance of streets, highways and pedestrian facilities. The measure tracks 1171 intersections, and the state’s 49 rest areas have also been assessed.
e n e r g y a n d e n v i r o n m e n tTransportation Fuel Consumption - Billions of gallons sold in Minnesota
Since fuel sold is fuel burned, fuel sales independent of VMT were judged to be the best measure of transportation emissions. To be consistent with other reports, the DNR share of fuel tax receipts (for boats, ATVs, dirt bikes, snowmobiles) is not subtracted. This share amounts to about 2.2% of total fuel use.
All taxable sales of gasoline and diesel fuel are counted, including fuel sold for off-road use but not including aviation fuel.
a c c o u n t a b i l i t y a n d t r a n s p a r e n c y
Construction Projects Put Out for Bid on Schedule
Mn/DOT’s objective is to deliver construction projects on the schedule announced to communities, contractors and travelers. Mn/DOT measures the percentage of its projects scheduled for the cur-rent year that are actually put out for bid within the year, leading to the start of construction.
This measure includes all Mn/DOT proj-ects in the current year of the four-year State Transportation Improvement Program (STIP). Lettings by agencies other than Mn/DOT are not included.
55


May 12, 2010


