Effects of Marcellus Shale Development on the Criminal Justice System The Marcellus Impacts Project Report #6 Executive Summary Rapid natural resource development in other regions has been linked to growth of criminal activity and increased stress on the criminal justice system. The criminal activity is linked to overall population growth, changes to the demographic composition of the population, changes to the social relationships among community members, greater wealth, and increased reporting of crime. This research used data from public agencies to describe the potential association between Marcellus Shale development and criminal activity and three components of the criminal justice system (law enforcement, courts, corrections). Indicators of criminal activity were examined using both trends over time and annual averages prior to and during active well development in each of the four study counties. Rates were calculated for each indicator to standardize for population differences between places and over time. For comparison, trends and averages were also examined for counties in the northern tier region and the southwest region. Finally, the trends and averages were examined using a five-category Marcellus County Typology, which classifies all counties in Pennsylvania by the presence of Marcellus Shale, level of well development, and urban/rural status. Overall, the findings paint a mixed picture of the trends in criminal activity corresponding with the periods of Marcellus Shale development. Calls for Service to which the Pennsylvania State Police responded: All four study counties experienced increased rates of calls for service during the period of Marcellus Shale development. Counties in the core of the Marcellus area with high levels of activity experienced slightly higher calls-for-service rates during the years of active well development than prior years, in contrast to other Pennsylvania counties. Reports of Serious Crimes: Bradford County experienced an increase in the rates of reports of serious crimes during the years of active well development, but the increasing trend began in 2006, prior to active well development. Greene and Washington counties also experienced increases in the rates of serious crime reports during the years of active well development. The typology analysis does not provide clear conclusions about the impact of Marcellus well development on reports of serious crimes across the commonwealth. Arrests for Serious and Minor Crimes: The analyses suggest no association between arrests for serious or minor crimes and Marcellus Shale well development. Arrests for Driving under the Influence (DUI): Bradford and Lycoming counties experienced higher rates of arrests for DUI during the years of active well development as compared to previous years. Greene and Washington counties also experienced increases during those years, but the annual rates of arrests for DUI were, on average, similar to prior years. The analysis for the rate of arrests for DUI across levels of development was inconclusive. The longitudinal trend suggests an increase in the rate for counties with high levels of Marcellus activity between 2008 and 2010, when other counties stayed steady or declined; however, all county types experienced higher rates, on average, in the years that coincided with well development.
Transcript
Effects of Marcellus Shale Development on the Criminal Justice System
The Marcellus Impacts Project Report #6
Executive Summary Rapid natural resource development in other regions has been linked to growth of criminal activity and increased stress on the criminal justice system. The criminal activity is linked to overall population growth, changes to the demographic composition of the population, changes to the social relationships among community members, greater wealth, and increased reporting of crime. This research used data from public agencies to describe the potential association between Marcellus Shale development and criminal activity and three components of the criminal justice system (law enforcement, courts, corrections).
Indicators of criminal activity were examined using both trends over time and annual averages prior to and during active well development in each of the four study counties. Rates were calculated for each indicator to standardize for population differences between places and over time. For comparison, trends and averages were also examined for counties in the northern tier region and the southwest region. Finally, the trends and averages were examined using a five-category Marcellus County Typology, which classifies all counties in Pennsylvania by the presence of Marcellus Shale, level of well development, and urban/rural status. Overall, the findings paint a mixed picture of the trends in criminal activity corresponding with the periods of Marcellus Shale development.
Calls for Service to which the Pennsylvania State Police responded: All four study counties experienced increased rates of calls for service during the period of Marcellus Shale development. Counties in the core of the Marcellus area with high levels of activity experienced slightly higher calls-for-service rates during the years of active well development than prior years, in contrast to other Pennsylvania counties.
Reports of Serious Crimes: Bradford County experienced an increase in the rates of reports of serious crimes during the years of active well development, but the increasing trend began in 2006, prior to active well development. Greene and Washington counties also experienced increases in the rates of serious crime reports during the years of active well development. The typology analysis does not provide clear conclusions about the impact of Marcellus well development on reports of serious crimes across the commonwealth.
Arrests for Serious and Minor Crimes: The analyses suggest no association between arrests for serious or minor crimes and Marcellus Shale well development.
Arrests for Driving under the Influence (DUI): Bradford and Lycoming counties experienced higher rates of arrests for DUI during the years of active well development as compared to previous years. Greene and Washington counties also experienced increases during those years, but the annual rates of arrests for DUI were, on average, similar to prior years. The analysis for the rate of arrests for DUI across levels of development was inconclusive. The longitudinal trend suggests an increase in the rate for counties with high levels of Marcellus activity between 2008 and 2010, when other counties stayed steady or declined; however, all county types experienced higher rates, on average, in the years that coincided with well development.
The Center for Rural Pennsylvania Page | 2
Arrests for Drug Abuse Violations: Although Bradford County experienced an increase in the arrest rate during the years of active well development, the increase began prior to well development (2004). Lycoming County experienced an increase in arrest rates for drug abuse violations during 2009 and 2010. The arrest rates for drug abuse violations in Greene and Washington counties were lower during the years of active well development. The typology analysis for drug abuse violations did not indicate that increased rates of arrests are linked to Marcellus Shale development.
New Criminal Cases Filed: The relationship between Marcellus Shale well development and the filing of criminal cases was inconclusive. Unlike Lycoming County, which saw a decline in the rate of new criminal cases filed, Bradford, Greene, and Washington counties all experienced increases in the rates of new criminal case filings during some of the years of active well development. These trends were largely similar to those of the counties in the surrounding region. Counties with the highest levels of Marcellus activity experienced increases in the rates of new criminal case filings during 2008 and 2009, when other counties experienced declines, but the average annual rates for all counties were higher during years of active well development.
New Civil Cases Filed: The potential association between Marcellus Shale development and the rate of new civil case filings was unclear. The rates of new criminal cases filed in Pennsylvania courts were higher during the years of active well development in Bradford, Lycoming, and Greene counties. However, the rates were also increasing in other Pennsylvania counties.
New Cases Filed for Traffic Violations: Three of the four study counties (Bradford, Lycoming, and Washington) experienced increased rates of traffic violations during the years of active well development. The typology analysis also indicated that counties with the highest levels of Marcellus Shale well development experienced increased rates of traffic violations, as compared to all other categories of counties that did not have increases during that same time period.
Sentences for Misdemeanors: The analysis does not suggest an association between the rates of sentences for misdemeanors and Marcellus Shale.
County Jail Populations: The analysis of the rates of annual county jail populations was inconclusive. The rates in Bradford County were higher only during the early years of well development (2007 and 2008). Lycoming County also experienced increases in the county jail inmate population rates, but this trend began prior to well development. The trend in Greene County was generally declining until a significant increase in 2010. Washington County experienced higher inmate populations in the early years of well development but this increase was part of a long-term trend. The typology analysis did not suggest that counties with the highest levels of well development experienced increased county jail inmate population rates.
The only indicators for which the data suggest a potential association between well development activity and criminal activity were calls for service, arrests for DUI, and traffic violations. It should be noted that this study examined rates of criminal activity, not the raw counts of violations. As such, this study is limited in its ability to describe impacts on the resources needed within the criminal justice system. However, the potential for increased burdens on emergency management, law enforcement agencies, and magisterial district judges needs to be considered. These parts of the criminal justice system may require additional resources to monitor and address public safety concerns.
For other indicators, the results were inconclusive, suggesting no association, or indicating associations only for specific counties. Further research needs to explore the findings identified here, specifically to understand the mechanisms by which the development of Marcellus Shale wells can lead to increased criminal activity. This research needs to consider several possible explanations, including changes to the local population, differing perceptions of crime among both residents and law enforcement officials, and adaptations by law enforcement officials in how they react to and manage offenses and offenders.
The Center for Rural Pennsylvania Page | 3
Table of Contents
About This Project: ........................................................................................................................................ 4
Study Counties ..................................................................................................................................... 4
Classifying Counties by Marcellus Shale Activity .................................................................................. 6
Introduction .................................................................................................................................................. 4 Criminal Justice System Data Sources and Methods of Analysis .................................................................. 8 Pennsylvania State Police Calls for Service ................................................................................................. 10 Reports of Serious Crimes ........................................................................................................................... 16 Arrests for Serious, Minor, Drug Abuse, and Driving Under the Influence Offenses ................................. 20 New Criminal and Civil Cases Filed in Pennsylvania Courts ........................................................................ 34 New Cases Filed for Traffic Offenses in Magisterial District Courts ........................................................... 40 Sentences for Misdemeanors in Pennsylvania Counties ............................................................................ 44 County Jail Populations ............................................................................................................................... 49 Conclusion ................................................................................................................................................... 55 Acknowledgements ..................................................................................................................................... 57 References .................................................................................................................................................. 58 Appendix A: Unconventional Wells Drilled by County and Year, 2005-2013 ............................................. 60 Appendix B. Marcellus Activity County Typology Definitions for Pennsylvania ......................................... 61
This project was sponsored by a grant from the Center for Rural Pennsylvania, a legislative agency of the
Pennsylvania General Assembly. The Center for Rural Pennsylvania is a bipartisan, bicameral legislative agency that serves as a resource for rural
policy within the Pennsylvania General Assembly. It was created in 1987 under Act 16, the Rural Revitalization Act, to promote and sustain the vitality of Pennsylvania’s rural and small communities.
Information contained in this report does not necessarily reflect the views of individual board members or the Center for Rural Pennsylvania. For more information, contact the Center for Rural Pennsylvania, 625 Forster St., Room 902, Harrisburg, PA 17120, telephone (717) 787-9555, email: [email protected], www.rural.palegislature.us.
The Center for Rural Pennsylvania Page | 4
About This Project: The Marcellus Shale Impacts Project chronicles the effects of shale-based energy development in Pennsylvania by focusing on the experiences of four counties with significant extraction and production activity – Bradford, Lycoming, Greene, and Washington counties. The project examines social and economic changes in these counties within the context of regional and statewide trends. A series of nine reports describes the research results as follows: (1) population, (2) health, (3) education, (4) youth, (5) housing, (6) crime, (7) local government, (8) local economy, and (9) agriculture.
Study Counties
Bradford, Lycoming, Greene, and Washington counties are studied in this project. They have experienced some of the highest levels of Marcellus Shale development in Pennsylvania, yet they have diverse populations, histories, economic bases, and geographic locations. These differences allow comparisons that facilitate understanding of the potential effects of Marcellus Shale development across the commonwealth and by region. The regional comparisons are defined based on adjacency to the four study counties. The northern tier contains 12 counties: Bradford, Lycoming, and the 10 neighboring counties of Clinton, Columbia, Montour, Northumberland, Potter, Sullivan, Susquehanna, Tioga, Union, and Wyoming. The southwest region consists of six counties: Greene, Washington, and the four neighboring counties of Allegheny, Beaver, Fayette, and Westmoreland. All four study counties are classified as rural by the Center for Rural Pennsylvania with population densities of less than 284 people per square mile. Table 1 offers an overview of selected characteristics from 2000 for the four study counties as well as counties in the surrounding region and the state. These data provide important context for understanding differences between the counties and regions prior to Marcellus Shale development. As Table 1 shows how the counties and regions differ across indicators. In the northern tier, Lycoming’s population was nearly twice that of Bradford’s, and Lycoming County had a slightly higher unemployment rate than Bradford County. The percentage employed in mining was very small in 2000 in both northern tier counties, although a larger percentage of people were employed in the industry in Bradford (0.6 percent) than in Lycoming (just 0.1 percent). The two counties had comparable median household incomes. In the southwest, the differences between Greene and Washington are more pronounced. Greene had the smallest population of the four counties (40,672) and 6.7 percent of employed individuals in the county were working in mining. The unemployment rate (9.2 percent) was more than 3 points above the state’s average (5.7 percent), and the median household income ($41,972) was well below average for the region ($52,004) and the state ($55,460). In contrast, the median household income in Washington County was just over $10,000 higher than in Greene. Only 1.3 percent of the employed work in mining and the unemployment rate was notably lower (5.3 percent). The two counties of the southwest had more diversified economies than counties of the northern tier. In Bradford and Lycoming, the same three industries (Manufacturing, Health Care and Social Assistance, and Retail Trade) employed around half the population (52.4 percent and 47.4 percent, respectively (Census 2000). In contrast, just over one-third of the working population in Greene County worked in the same three industries (Health Care and Social Assistance, Retail Trade, and Educational Services). Washington’s top three industries (Manufacturing, Health Care and Social Assistance, Retail Trade, and Manufacturing) employed 41.7 percent of the working population.
The Center for Rural Pennsylvania Page | 5
Table 1. Pre-Marcellus characteristics of study counties in 2000
Population People
per square mile
% employed in
Mining
% Unemployed
Median Household Income
(adjusted for inflation to 2012 values)
Northern Tier* 47,968 83 0.6% 6.0% $47,071
Bradford 62,761 55 0.6% 5.5% $48,451
Lycoming 120,044 97 0.1% 6.3% $47,038
Southwest* 370,881 505 1.8% 6.6% $47,901
Greene 40,672 71 6.7% 9.2% $41,972
Washington 202,897 237 1.3% 5.3% $52,004
Pennsylvania 12,281,054 274 0.3% 5.7% $55,460 The northern tier region contains 12 counties: Bradford, Lycoming, and the 10 neighboring counties of Clinton, Columbia, Montour, Northumberland, Potter, Sullivan, Susquehanna, Tioga, Union, and Wyoming. The southwest region consists of six counties: Greene, Washington, and the four neighboring counties of Allegheny, Beaver, Fayette, and Westmoreland. Source: Social Explorer Tables (SE), Census 2000, U.S. Census Bureau and Social Explorer. * County average, includes study counties.
Marcellus Shale Activity
Table 2 shows the number of unconventional wells drilled in the Marcellus Shale each year in the six Pennsylvania counties with the highest total number of wells drilled between 2005 and mid-year 2013 (Pennsylvania Department of Environmental Protection).
Table 2. Six counties with the most wells drilled and wells drilled each year, 2005-2013*
county name 2005 2006 2007 2008 2009 2010 2011 2012 2013*
mid-year
Total, by county
Bradford+ 1 2 2 24 158 373 396 164 66 1186
Washington+ 5 19 45 66 101 166 155 195 120 872
Tioga 0 1 0 15 124 273 272 122 13 820
Lycoming+ 0 0 5 12 23 119 301 202 89 751
Susquehanna 0 1 2 33 88 125 205 191 102 747
Greene+ 0 2 14 67 101 103 121 105 54 567
Total wells drilled in top six counties: 4943
Source: Pennsylvania Department of Environmental Protection, Office of Oil and Gas Management. *Data through June 30, 2013 (accessed July 4, 2013);
+Study counties.
The four study counties have experienced significant Marcellus Shale well drilling and account for half (3,376) of the 6,833 unconventional wells drilled in the commonwealth. The two counties located in the southwest, Washington and Greene, experienced more well development through 2008 than the other counties. Bradford County experienced significant growth starting in 2009. Despite the late start, Bradford County quickly surpassed all other Pennsylvania counties with nearly 400 new wells drilled in 2011, for a total of 1,186 by June 30, 2013. Lycoming similarly experienced more new drilling activity in 2011 than occurred in the southwest and had the highest number of new wells drilled in 2012.
The Center for Rural Pennsylvania Page | 6
Figure 1 shows the cumulative number of wells drilled from 2005 to 2012 in each of the study counties. Although some wells may no longer be in production by 2012, and some have not yet been put into production, the lines reveal overall trends in the counties and across regions. The northern tier counties (Bradford and Lycoming) had steeper increases in the past 3 years, whereas those in the southwest (Washington and Greene) had more gradual but steady increases in the number of wells drilled.
In 2012, the pace of new drilling slowed in Bradford and Lycoming, likely due to the declining price of natural gas. In contrast, drilling in Greene and Washington counties in 2012 was on par with the previous year. This may be because gas in southwestern Pennsylvania tends to be “wet” gas, meaning it contains more marketable compounds (liquid natural gases such as butane and propane) that can generate higher revenues than “dry” natural gas (i.e. methane) alone. Even so, mid-year figures suggest that new drilling activity across all four counties in 2013 may be comparable to 2012. A table listing well counts for all counties in Pennsylvania is in Appendix A.
Classifying Counties by Marcellus Shale Activity
To further understand the effects of Marcellus Shale activity, the analyses compared counties based on their level of Marcellus Shale activity using a five-category county typology. The typology was created by combining several definitions based on estimated shale value and actual development activity, including publicly available maps of the thickness, depth, and thermal maturity of the shale (McLaughlin et al., 2012). This typology also differentiates urban counties because the population and economic dynamics in these counties are fundamentally different from that of rural counties.
Source: PA Dept. of Environmental Protection, Office of Oil and Gas Management (accessed July 4, 2013).
The Center for Rural Pennsylvania Page | 7
In Pennsylvania, the number of wells is highly concentrated in a small number of counties. There are 7 counties (including the four study counties) that account for 90 percent of the total number of wells drilled through June 30, 2013. These 7 counties are classified as “core” counties with high drilling activity, and are shaded with the darkest gray in Figure 2. The other four typology categories are: “core” counties with low drilling activity, 2nd tier counties (with lower quality shale and limited drilling activity), urban counties with potential or some Marcellus Shale development, and those counties with no Marcellus Shale. For a full description of the typology, see Appendix B.
Introduction
Rapid natural resource development has been linked to growth of criminal activity and increased stress on the criminal justice system (Freudenburg and Jones, 1991). This increase has been attributed to a number of changes associated with rapid natural resource development, including:
overall population growth, which both increases the likelihood that criminal activity will occur and increases the number of potential victims of criminal activity;
changes to the demographic composition of the population, particularly related to the increase in the number of young males who, statistically speaking, have a higher likelihood of committing crimes;
changes to the social relationships among community members, such that they are acquainted with a smaller proportion of the community, which might lead to more crime and/or more reports of crime;
greater wealth, which creates more opportunities and targets for criminal activity; and
increased reporting of crime due to residents’ heightened awareness of potential criminal activity and changing local population.
To date, research on the effects of Marcellus Shale activity has not found significantly increased criminal activity linked to the development of this resource (Kowalski and Zajac, 2012). However, reports by public officials and citizens have raised questions about these findings (at least in specific communities),
Source: Wrightstone, G. (2008)
The Center for Rural Pennsylvania Page | 8
citing increased criminal activity and heightened demand on law enforcement agencies, corrections facilities, and court systems.
In this research, secondary data were examined to describe criminal activity and activity within three parts of the criminal justice system (law enforcement, court systems, correctional facilities) as they related to Marcellus Shale development. Multiple indicators at each stage of the criminal justice system were examined before and after the onset of Marcellus shale activity and, where the data were available, across levels of development.
Criminal Justice System Data Sources and Methods of Analysis
The criminal justice system consists of multiple components, agencies, and procedures. This research attempted to provide a comprehensive analysis of the effects of Marcellus Shale development on the criminal justice system. Appendix C provides a flowchart of the criminal justice system (Bureau of Justice Statistics, n.d.), depicting the flow of individuals through the system from initial reports of a crime through incarceration. For the purposes of this report, the graphic highlights components of the system for which analysis might examine specific indicators of criminal activity. This analysis also suggests the relative levels of activity for the agencies and administrative services that address those parts of the criminal justice system. The parts of the system examined here include:
Reported and observed criminal activity, as indicated by emergency calls for service handled by the Pennsylvania State Police and reports of crimes;
Criminal activity and investigations, as indicated by arrests for specific violations;
Prosecution of alleged violators, as indicated by new criminal cases filed in the magisterial district judge court system and courts of common pleas; and
Sentencing, as indicated by sentencing data and county jail population statistics. Table 3 summarizes the data sources used in this report.
Table 3. Indicators and data sources
Indicators Data source Years Unit
Calls for service for which Pennsylvania State Police responded
Pennsylvania State Police 2001-2012, annually
County
Reports of serious crimes FBI Uniform Crime Reporting (UCR) system
2001-2010, annually
County
Arrests for serious, minor, driving under the influence (DUI) and drug abuse violations
FBI Uniform Crime Reporting (UCR) system
2001-2010, annually
County
New criminal and civil cases filed (Court of Common Pleas, Civil Court)
Pennsylvania Unified Judicial System (UJS), PA Administrative Office of the Courts
2001-2010, annually
County
New traffic cases filed (Magisterial District Judge System)
Pennsylvania Unified Judicial System (UJS), PA Administrative Office of the Courts
2001-2010, annually
County
Offenders sentenced for misdemeanor crimes
Pennsylvania Commission on Sentencing
2001-2010, annually
County
Annual population survey for county jails
Pennsylvania Commission on Crime and Delinquency
2003 – 2010, annually
County
The Center for Rural Pennsylvania Page | 9
Most public agencies have a time lag between collecting data and making data publicly available to allow for database creation, manipulation, cleaning, and creating a data format that will be useful for others. As a result, at the time of data acquisition and analysis (2012), 2010 was the most recent data available.
Because of differences in the data collection procedures and available statistics across data sets, each analysis is described separately below. The data drawn from each of the sources are, for the most part, count data, meaning they are simply the number of times an event (e.g., an arrest for burglary, the filing of a criminal court case) occurred during the year for a given county. The analyses below examined rates, which are counts standardized by the population of the county in that year (e.g., the number of arrests per 1,000 residents in the county for that year). Using rates allowed for comparisons between counties of different sizes and over time.
Rates are calculated as the total counts for a given year divided by a denominator that is the result of dividing the total population by 1,000.1
For example, the number of reports of serious crimes in Bradford County in 2001 was 1,072. The population that year was 62,616. The rate is calculated as:
The rates are shown as trends across time for all the study counties. The trends in the study counties were also compared to the trends in their surrounding region. When interpreting the comparisons between the study counties and the regions, it is important to note that the regions as defined here include the study counties and that counties adjacent to the study counties have also experienced Marcellus Shale well development. The total number of Marcellus Shale wells at the time of this study in the northern tier counties (excluding Bradford and Lycoming) across all years was 1948, ranging from a high of 820 wells in Tioga County to a low of 3 wells in Columbia County; three counties in the northern tier have had no wells developed. The total number of wells in the southwest region (excluding Greene and Washington counties) was 543, ranging from 249 in Westmoreland County to 26 in Beaver County.
Finally, the rates are shown by level of Marcellus Shale activity using the Marcellus Shale County Typology. This five-category typology classifies counties based on the presence of Marcellus Shale, the historic levels of Marcellus Shale activity, and the urban/rural status of the county (see Appendix B for a more detailed explanation).
1Annual population data for counties were obtained from the Intercensal Estimates of the Resident Population for
Counties in Pennsylvania [Table 1. Intercensal Estimates of the Resident Population for Counties of Pennsylvania:
April 1, 2000 to July 1, 2010 (CO-EST00INT-01-42). Source: U.S. Census Bureau, Population Division. Release Date:
September].
Count of events
Total county population
1,000
Rate =
1,072
62,616
1,000
2001 Rate of Reported Serious Crimes = = 17.1 Reports per 1,000 residents
The Center for Rural Pennsylvania Page | 10
Pennsylvania State Police Calls for Service
The first indicator of criminal activity used in this study was the rate of calls for police services for which the Pennsylvania State Police responded. A call-for-service is defined as any incident for which a Pennsylvania State Trooper responds. Incidents can be instigated by calls from citizens (through 911 or other non-emergency call systems), requests for assistance from another law enforcement agency, or something witnessed by a trooper on patrol. Calls for service do not include traffic citations.
The Pennsylvania State Police (PSP) provides either full- or part-time coverage of 67 percent of Pennsylvania municipalities, including 92 percent of rural municipalities (Zajac and Kowalski, 2012). Of those municipalities covered by the PSP, 75 percent are covered “full-time,” meaning that the municipality does not employ their own local police force and relies exclusively on the PSP for law enforcement (Zajac and Kowalski, 2012). In those municipalities that have a limited police force, PSP provides “part-time” law enforcement services when local police officers are not working. Note that PSP patrols interstate highways in all municipalities, regardless of coverage responsibilities, as well as assists with other law enforcement activities (e.g., investigation, prevention activities, specialized task forces) as requested. Zajac and Kowalski (2012: 24) found that between 2006 and 2010, 61 percent of the calls handled by PSP occurred in municipalities for which the PSP provides full-time coverage; 11 percent were in municipalities for which PSP provides part-time coverage, and 25 percent in municipalities for which PSP provides no coverage. The coverage differences will be important for interpreting data analyzed below.
PSP provides significant coverage in three of the four study counties (Table 4). PSP provides full-time coverage for 82.4 percent of the municipalities in Bradford County, 71.2 percent of the municipalities in Lycoming County, 80.8 percent of the municipalities in Greene County, but only 34.8 percent of municipalities in Washington County. The percentages in Bradford and Lycoming counties are similar to other counties in the northern tier region; of the 10 adjacent counties, six have full PSP coverage for more than two-thirds of the municipalities within the counties. The high percentage of municipalities in Greene County with full-time PSP coverage is dissimilar to adjacent counties in the southwest region, reflecting the largely rural composition of Greene County. The relatively high percentages of municipalities with local police coverage in Washington County reflect the county’s mix of urban and rural areas.
The Center for Rural Pennsylvania Page | 11
Table 4.Percentage of Municipalities in Study Counties and Adjacent Counties with Full-Time and Part-Time Pennsylvania State Police Coverage and Local Police Coverage
Local police
coverage
Pennsylvania State Police part-
time coverage
Pennsylvania State Police full-time coverage
Total
County Average across all Northern Tier counties 12.4 17.2 70.4 100.0 Bradford 11.8 5.9 82.4 100.0 Lycoming 19.2 9.6 71.2 100.0 County average for Adjacent counties only 11.8 19.1 69.1 100.0 Clinton 3.4 27.6 69.0 100.0 Columbia 39.4 30.3 30.3 100.0 Montour 18.2 0.0 81.8 100.0 Northumberland 30.6 11.1 58.3 100.0 Potter 0.0 16.7 83.3 100.0 Sullivan 0.0 0.0 100.0 100.0 Susquehanna 0.0 22.5 77.5 100.0 Tioga 5.1 20.5 74.4 100.0 Union 21.4 14.3 64.3 100.0 Wyoming 0.0 47.8 52.2 100.0
County Average across all Southwest counties 46.6 15.3 38.1 100.0 Greene 3.8 15.4 80.8 100.0 Washington 42.4 22.7 34.8 100.0 County average for Adjacent counties only 58.3 13.5 28.2 100.0 Allegheny 98.5 0.0 1.5 100.0 Beaver 72.2 13.0 14.8 100.0 Fayette 16.3 25.6 58.1 100.0 Westmoreland 46.2 15.4 38.5 100.0
County average for all Pennsylvania counties 27.5 15.6 56.9 100.0 Source: Pennsylvania State Police.
Calls-for-service (CFS) data are one indication of criminal activity but they have limitations, particularly when comparing across places.2 The data examined here reflect the response of only one law enforcement agency (PSP), although the PSP provides coverage to the majority of municipalities in the study counties. Further, there is a direct relationship between the amount of coverage by PSP and whether the municipality is rural or urban. Consequently caution must be used when comparing rates across counties, particularly across rural and urban counties. The data are also reported for the county as a whole, even though PSP coverage varies within a county. Despite these limitations, the data provided a picture of the relative levels of criminal activity across time within the study counties. They also allowed for the consideration of the impacts of Marcellus Shale development on PSP in places where coverage is provided.
Figures 3-6 show the annual calls-for-service rates (standardized by the Census annual population estimates) for which PSP responded for the four study counties between 2001 and 2012 in relation to
2 Klinger and Bridges (2006) found that calls for service data were limited measures of criminal activity, particularly
when compared to other data sources (such as arrests). The main limitation applicable to the data examined here
was that the amount of error associated with using calls for service as a measurement of criminal activity varies by
location.
The Center for Rural Pennsylvania Page | 12
the number of Marcellus Shale wells drilled. Table 5 provides the annual average rate before active well development (2001-2007) and during active well development (2008-2012) for the study counties, counties adjacent to the study counties, all counties in the northern tier and southwest region, and all counties in the state.
Figure 6. Washington County Rate of Pennsylvania State Police Incident Responses and Wells Drilled, 2001-2012
.Washington County wells
The rate for PSP incident responses in Bradford County was increasing in the years prior to well development, with a rate of 65.6 incidents per 1,000 residents in 2004 to 85.5 incidents per 1,000 residents in 2007 (Figure 3). The rates stayed relatively steady in 2008 (84.6 incidents per 1,000 residents), decreased slightly in 2009 (80.6 incidents per 1,000 residents), then increased to the highest levels of the study period in 2010, 2011, and 2012 (rates of 87.6, 98.9, and 92.8 incidents per 1,000 residents, respectively). The higher rates in 2010-2012 mirror well development activity. Table 5 indicates that the average annual rate prior to development (2001-2007) was 75.4 incidents per 1,000 residents; the annual average rate during well development (2008-2012) was 88.9 incidents per 1,000 residents.
The rate for PSP incident responses in Lycoming County also seemed to mirror well development activity (Figure 4). The highest rate occurred in 2004 (74.7 incidents per 1,000 residents), with a declining trend until 2009 (65.2 incidents per 1,000 residents). The rate then increased in 2010 and 2011 (69.2 and 72.2 incidents per 1,000 residents, respectively), the years of most active well development. The rate declined in 2012 (69.7 incidents per 1,000 residents), as the number of wells also declined. The average annual rate, however, was slightly lower in the years during active well development (2008-2012), with a rate of 69.0 incidents per 1,000 residents, compared to the average annual rate prior to development (2001-2007) of 71.0 incidents per 1,000 residents (Table 5).
Source: Pennsylvania Department of Environmental Protection; Pennsylvania State Police.
The Center for Rural Pennsylvania Page | 13
The rate of PSP incident responses in Greene County was declining prior to well development, from a rate of 162.0 incidents per 1,000 residents in 2001 to 128.3 incidents per 1,000 residents in 2007 (Figure 5). The first year of significant well development, 2008, saw an increase to a rate of 139.7 incidents per 1,000 residents but then a drop in 2009 to a rate similar to 2007 (129.1 incidents per 1,000 residents). The following years (2010 and 2011) saw increased rates (130.4 and 134.6 incidents per 1,000 residents, respectively) followed by a decline in 2012 to the lowest rate in the study period (120.5 incidents per 1,000 residents). The average annual rate before development (2001-2007) was higher (139.2) than the rate (130.9) during well development (2008-2012) (Table 5).
The rate of PSP incident responses in Washington County were trending slightly downward in the early part of the decade (Figure 6). The rate was 63.6 incidents per 1,000 residents in 2001, and decreased to 58.8 by 2006. The rate began to increase in 2007, coincident with the increase in the number of wells drilled in Washington County. The rate in 2007 was 67.4 incidents per 1,000 residents, and grew to a high of 74.6 in 2010 and 74.5 in 2011. The rate decreased again in 2012 to 67.9 incidents. The rate in 2012 dropped, although the number of wells drilled in that year was the highest to date (195 wells). The average annual rates also suggest a potential relationship between Marcellus Shale development and incident rates in Washington County. The average annual rate in 2001-2007 was 63.4 incidents per 1,000 residents; the average annual rate during the years of active well development was 71.7 incidents per 1,000 residents (Table 5).
Table 5. Average Annual Rates (per 1,000 Residents) of Calls for Service for which Pennsylvania State Police Responded Before and During Marcellus Shale Well Development by County, Region, and Typology
Average annual rate 2001-2007
Average annual rate 2008-2012
Pennsylvania Counties 48.1 47.3
Northern Tier* 106.5 103.5
Bradford County 75.4 88.9
Lycoming County 71.0 69.0
Southwest Region* 74.5 74.0
Greene County 139.2 130.9
Washington County 63.4 71.7
Typology
No Marcellus 63.5 61.4
Urban Marcellus 47.9 46.8
2nd Tier 108.0 91.3
Core, Low Activity 130.4 122.6
Core, High Activity 98.0 100.2 * County average, includes study counties The northern tier region consists of 12 counties: Bradford, Lycoming, and ten neighboring counties (Clinton, Columbia, Montour, Northumberland, Potter, Sullivan, Susquehanna, Tioga, Union, Wyoming). The southwest region consists of six counties: Greene, Washington, and four neighboring counties (Allegheny, Beaver, Fayette, and Westmoreland). Data source: Pennsylvania State Police.
The rates of incidents in the four study counties need to be understood in the broader regional context (Figures 7 and 8). The northern tier region experienced a slight increase in rates during the years of well
The Center for Rural Pennsylvania Page | 14
development, with a decline in 2012. The average annual rate for the northern tier during the years of active drilling (2008-2012) was only slightly higher (106.5 incidents per 1,000) than earlier years (103.5 incidents per 1,000 during 2001-2007) (Table 5).
The rate of incidents in the southwest region mirrored that of the two study counties, with increased rates in 2008, a decline in 2009, increases 2010-2011, and decline in 2012. The average annual rates between the two time periods (2001-2007 and 2008-2012) were relatively the same (74.5 and 74.0 incidents per 1,000, respectively).
The higher rates in some years of active well development for counties in both the northern tier and southwest regions stand in contrast to the relatively steady rates for all Pennsylvania counties. The decline in 2012 noted for the study counties and regions is also found in all Pennsylvania counties.
Figure 8. Rate of Pennsylvania State Police Incident Responses in the Southwest Region,
2001-2012
Greene County
Washington County
Southwest Region
Pennsylvania
A comparison of rates by the Marcellus Shale County Typology suggests a potential relationship to Marcellus Shale development (Figure 9). Counties without Marcellus well development (“No Marcellus”) had a general decline in the rates of incidents to which PSP responded from 2001 through 2004, a slight increase from 2004 through 2007, then a decrease from 2007 through 2012. Urban counties in the footprint of the Marcellus Shale region (“Urban Marcellus”) generally followed this same trend, with the exception of an increase in the rate of incidents in 2011. In contrast, all other counties within the Marcellus Shale region (Core/High Activity, Core/Low Activity, and 2nd Tier) experienced increases in the rates in 2010 and 2011.
Figure 9. Rate of Pennsylvania State Police Incident Responses by Typology, 2001-2012
No Marcellus
Urban Marcellus
2nd Tier
Core, Low Activity
Core, High Activity
Counties in the core area of Marcellus with high levels of activity had a higher average annual rate during the years of well development (100.2 incidents per 1,000 residents 2008-2012) than the years prior to development (98.0 incidents per 1,000 residents 2001-2007). The average annual rates for all other categories (in and out of the Marcellus Shale footprint) were lower during the years of well development than prior years (Table 5).
Summary:
Although there were differences in the levels and types of coverage provided by PSP across municipalities, the longitudinal trends suggested a potential relationship between Marcellus well development and the rates of incidents for which PSP responded in the study counties. Bradford and Washington counties experienced increased rates of incidents in 2010 and 2011 as compared to the rates in previous years; the average annual rate was higher in years of well development than in previous years. Lycoming County also experienced an increase during 2010 and 2011; however, the average annual rate during the years of well development was lower than the average annual rate from prior years. The potential impact of well development on incident rates in Greene County was unclear. The general trend over the years prior to development was a decline, with increases in 2008, 2010, and 2011. However, the average annual rate was lower during the years of active well development than the pre-drilling period.
The regional analysis suggests that the trends in the counties largely mirrored those of their adjacent counties. However, these trends over time were different from that of the state as a whole; although the state had a relatively stable rate of incidents to which PSP responded, study counties experienced increased rates during the years of active well development. The typology comparison supports this finding; unlike counties with no Marcellus or lower levels of activity within the Marcellus, counties in the core of the Marcellus area with high levels of well development experienced slightly higher rates during the years of active well development than prior years.
Source: Pennsylvania State Police.
The Center for Rural Pennsylvania Page | 16
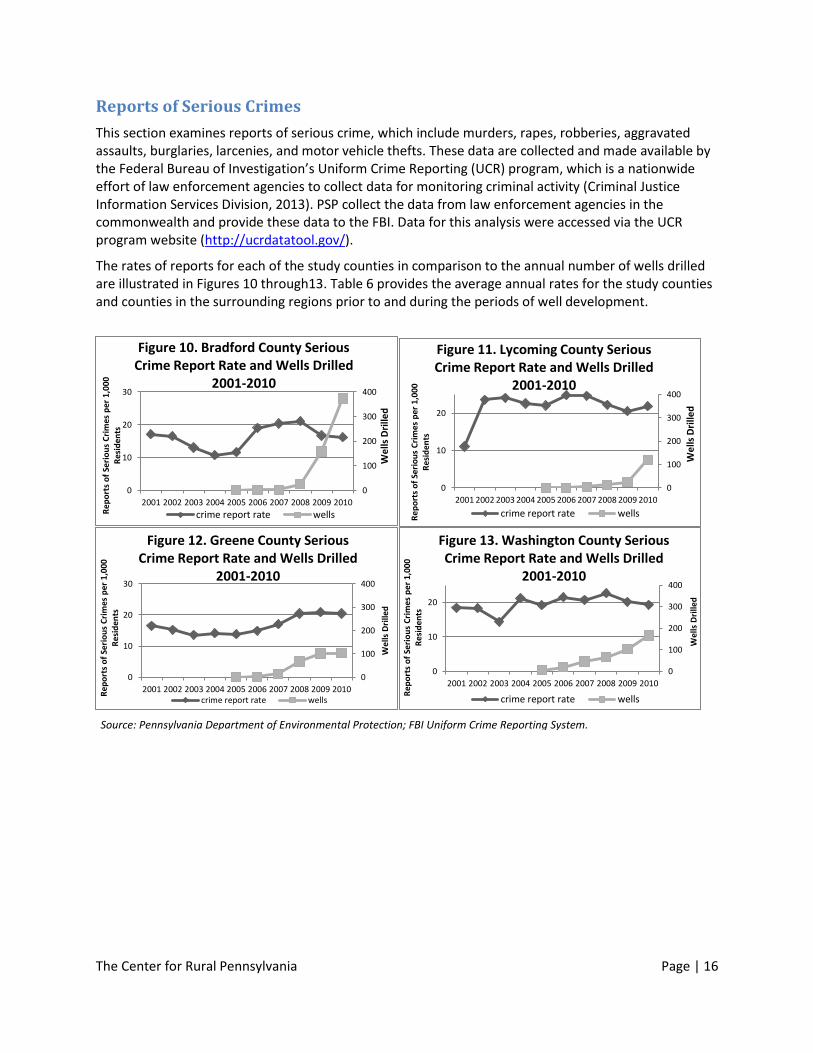
Reports of Serious Crimes
This section examines reports of serious crime, which include murders, rapes, robberies, aggravated assaults, burglaries, larcenies, and motor vehicle thefts. These data are collected and made available by the Federal Bureau of Investigation’s Uniform Crime Reporting (UCR) program, which is a nationwide effort of law enforcement agencies to collect data for monitoring criminal activity (Criminal Justice Information Services Division, 2013). PSP collect the data from law enforcement agencies in the commonwealth and provide these data to the FBI. Data for this analysis were accessed via the UCR program website (http://ucrdatatool.gov/).
The rates of reports for each of the study counties in comparison to the annual number of wells drilled are illustrated in Figures 10 through13. Table 6 provides the average annual rates for the study counties and counties in the surrounding regions prior to and during the periods of well development.
0
100
200
300
400
0
10
20
30
2001 2002 2003 2004 2005 2006 2007 2008 2009 2010
We
lls D
rille
d
Rep
ort
s o
f Se
rio
us
Cri
mes
per
1,0
00
Res
iden
ts
Figure 10. Bradford County Serious Crime Report Rate and Wells Drilled
2001-2010
crime report rate wells
0
100
200
300
400
0
10
20
2001 2002 2003 2004 2005 2006 2007 2008 2009 2010
We
lls D
rille
d
Rep
ort
s o
f Se
rio
us
Cri
mes
per
1,0
00
Res
iden
ts
Figure 11. Lycoming County Serious Crime Report Rate and Wells Drilled
2001-2010
crime report rate wells
0
100
200
300
400
0
10
20
30
2001 2002 2003 2004 2005 2006 2007 2008 2009 2010
Wel
ls D
rille
d
Rep
ort
s o
f Se
rio
us
Cri
mes
per
1,0
00
Res
iden
ts
Figure 12. Greene County Serious Crime Report Rate and Wells Drilled
Table 6. Average Annual Rates (per 1,000 residents) of Serious Crime Reports by County, Region, and State Before and During Marcellus Shale Well Development
Average annual rate 2001-2007
Average annual rate 2008-2010
Pennsylvania Counties 26.8 26.2
Northern Tier* 16.9 17.5
Bradford County 15.5 18.0
Lycoming County 21.8 20.6
Southwest Region* 25.7 24.7
Greene County 15.0 20.6
Washington County 19.1 20.7
Typology
No Marcellus 30.3 28.9
Urban Marcellus 25.7 25.5
2nd Tier 19.9 20.4
Core, Low Activity 17.4 18.3
Core, High Activity 19.2 20.2 * County average, includes study counties The northern tier region consists of 12 counties: Bradford, Lycoming, and the10 neighboring counties of Clinton, Columbia, Montour, Northumberland, Potter, Sullivan, Susquehanna, Tioga, Union, Wyoming. The southwest region consists of six counties: Greene, Washington, and the four neighboring counties of Allegheny, Beaver, Fayette, and Westmoreland. Data source: Uniform Crime Reports, FBI.
The rates of reports of serious crime in Bradford County swung significantly over the decade (Figure 10). The rate was on a downward trend from 2001 (17.1 reports per 1,000 residents) through 2004 (10.7 reports per 1,000 residents), then increased from a rate of 11.5 reports per 1,000 residents in 2005 to a high of 21.1 reports per 1,000 residents in 2008. The rate then decreased to 16.2 reports per 1,000 residents, slighly lower than at the beginning of the data series. The increase in the serious crime rate began in 2006, which was prior to significant well development; well development significantly grew in 2009, but the rate of reports of serioues crimes was lower that year. The average annual serious crime rate was higher in the years of active well development (18.0 reports per 1,000 residents from 2008-2010) than in the years prior to well development (15.5 reports per 1,000 residents from 2001-2007) (Table 6).
Lycoming County started the decade with a relatively low rate of 11.1 reports of serious crimes per 1,000 residents, then increased to 23.6 reports per 1,000 residentsin 2002 (Figure 11). The rate stayed relatively steady throughout the decade, ranging from a low of 20.5 reports of serious crime per 1,000 residents in 2009 to a high of 24.8 reports of serious crime per 1,000 residents in 2006. The report rates for serious crimes do not seem to fluctuate in relation to the number of wells drilled. A comparison of the average annual rates before and during well development support this conclusion, as the rate was lower during well development than in prior years (Table 6).
Greene County saw a slight decrease in the rate of serious crime reports in the beginning of the decade, from 16.5 reports per 1,000 residents in 2001 to 13.5 reports per 1,000 residents in 2003 (Figure 12). The rate was relatively steady through 2005, then started a gradual increase in 2006 (14.9 reports of serious crime per 1,000 residents) through 2008 (20.4 reports of serious crime per 1,000 residents). The rate was steady in 2008, 2009, and 2010. The increase in the serious crime rate in 2007 and 2008 coincides with an increase in well development in Greene County, in which the number of wells went
The Center for Rural Pennsylvania Page | 18
from two in 2006, 14 in 2007, 67 in 2008 and 101 in 2009. A comparison of the average annual rate of serious crimes support this conclusion; the average annual rate in 2001-2007 was 15.0 reports per 1,000 residents, whereas the rate in 2008-2010 was 20.6 reports per 1,000 residents (Table 6).
Washington County experienced a slight decrease in the rates of reports of serious crimes from 2001 (18.4 reports per 1,000 residents) through 2003 (14.3 reports per 1,000 residents), then an increase in 2004 to 21.1 reports (Figure 13). The rate of reports stayed relatively steady from 2004 through 2010. The slight increase between 2005 (19.1 reports per 1,000 residents) and 2008 (22.6 reports per 1,000 residents) coincides with the beginning of well development, but the largest number of wells were developed in 2009 and 2010, years that saw decreases in the rate of reported serious crimes (from 22.6 reports per 1,000 residentsin 2008 to 19.3 reportsper 1,000 residents in 2010). The average annual rates before and after development indicate a higher rate of reports of serious crimes during well development (20.7 reports per 1,000 residents) than prior to development (19.1 reports per 1,000 residents) (Table 6).
Figures 14 and 15 compare the rates of reports of serious crimes in the four study counties to the rates for all counties in the regions and the state. The rates in the northern tier counties are generally lower than the rates for the state, and show more variability over the decade. Table 6 indicates that the average annual rate for northern tier counties was higher during the well development period (17.5 reports per 1,000 residents) than prior to development (16.9 reports per 1,000 residents). Lycoming County had rates of reports of serious crime higher than the region across most years, but largely mimicked the overall regional trend with the exception of 2010. The northern tier region saw a continuation of the downard trend that year whereas Lycoming County experienced an increase. It is not clear what caused this increase in 2010 in Lycoming County. Bradford Countyexperienced a rate of reports of serious crime that was higher than the region experienced in 2006, 2007, and 2008, then fell to a rate similar to that of the region in 2009 and 2010.
Figure 14. Rate of Reports of Serious Crimes Northern Tier Counties, 2001-2010
Bradford
Lycoming
Northern Tier
Pennsylvania
Source: FBI Uniform Crime Reporting System
The Center for Rural Pennsylvania Page | 19
The rates for the counties in the southwest region largely mimic that of the state, but at a lower rate than all counties in the state (Figure 15). Washington County, although more variable across the decade, generally followed the downward trend of the region and the state in the years in which Marcellus Shale activity occurred (2008-2010). In contrast, Greene County saw increases in 2008 and 2009, at rates close to or higher than Washington County, and maintained a rate between 20 and 21 reports of serious crimes per 1,000 residents. Unlike the northern tier counties, the average annual rate during well development among southwest region counties was lower during the years of active well development, with a rate of 24.7 reports per 1,000 residents in 2008-2010 as compared to 25.7 reports per 1,000 residents in 2001-2007 (Table 6). This difference for the region stands in contrast with the study county rates, which were both higher during active well development, particularly for Greene County.
0
5
10
15
20
25
30
2001 2002 2003 2004 2005 2006 2007 2008 2009 2010
Nu
mb
er
of
Inci
de
nts
pe
r 1
,00
0 R
esi
de
nts
Figure 15. Rate of Reports of Serious Crimes Southwest Region Counties, 2001-2010
Figure 16. Rate of Reports of Serious Crimes by County Typology, 2001-2010
Core, High Activity
Core, Low Activity
2nd Tier
Urban Marcellus
No Marcellus
Source: FBI Uniform Crime Reporting System
Source: FBI Uniform Crime Reporting System.
The Center for Rural Pennsylvania Page | 20
To further explore the relationship between Marcellus Shale development and reports of crime, the researchers examined the rates of reports of serious crimes across county typology. Counties in the Marcellus region (Core, High Activity; Core, Low Activity; 2nd Tier; and Urban Marcellus) had relatively similar trends across the decade (Figure 16). They experienced a general increase in the first half of the decade, with a peak between 2006 and 2008, followed by a general decline. These trends are similar to that of the counties without Marcellus Shale. However, a comparison of the average annual rates prior to and during well development across the typology categories indicates that counties with Marcellus Shale (2nd tier, core/low activity, core/high activity) had higher rates during years of active well development whereas counties without Marcellus had lower rates during years of active well development (Table 6).
Summary
The potential relationship between Marcellus Shale development and the rates of reports of serious crime in the study counties is unclear. The rates in Bradford County increased in the years prior to significant well development; however, the annual average was higher for 2008-2010 than in prior years (2001-2007). Lycoming County’s rate did not seem to fluctuate in relation to well development, and the annual average rate of serious crime reports was lower during active well development. Greene County experienced increases in the rates of serious crime reports during the years of active well development; the annual average rate was higher for these years as well. Washington County also experienced increased average annual rates of serious crime reports during the years of active well development. This higher average stands in contrast to the region, which experienced a decrease in the average annual rate. The typology analysis does not provide clear conclusions. Although the average annual rates during development were higher for Marcellus counties than for non-Marcellus counties, the overall trends depicted in Figure 16 are not substantively different across the typology categories.
Arrests for Serious, Minor, Drug Abuse, and Driving Under the Influence Offenses
This section examines the rates of arrests by all law enforcement agencies across two groups of criminal offenses. Data were drawn from the FBI’s Uniform Crime Reporting system. The criminal offense groups included: serious crimes (murder, forcible rape, robbery, aggravated assault, burglary, larceny-theft, and motor vehicle theft) and minor crimes (arsons, other assaults, forgery, fraud, embezzlement, possession of stolen property, vandalism, weapons violations, prostitution and commercial vice, sex offenses, gambling, offenses against families and children, liquor law violations, drunkenness, disorderly conduct, vagrancy, all other offenses, and suspicion). The researchers also examined the crimes of driving under the influence and drug abuse violations (including possession and sales) as these are reported as concerns related to well development in the media. Figures 17 through 20 provide the rates of arrests for each of these categories for the four study counties in relation to the number of Marcellus Shale wells developed. Table 7 provides the average annual rates of arrests for study counties, regions, and typology categories prior to (2001-2007) and during (2008-2010) well development.
The Center for Rural Pennsylvania Page | 21
In Bradford County, the rates of arrests for serious crimes declined in the years prior to Marcellus well development (from 6.2 arrests per 1,000 residents in 2001 to 4.7 arrests per 1,000 residents in 2006) then increased in 2007 (to 5.7 arrests per 1,000 residents) and stayed relatively steady in subsequent years (Figure 17). The annual average prior to and during well development stayed relatively steady, with rates of 5.8 and 5.7 arrests per 1,000 residents over the 2001-2007 and 2008-2010 periods (Table 7). The arrest rates for minor crimes show a general decline from 2001 to 2006, followed by an increase in 2007. The subsequent years of very active well development saw a slight decline in arrest rates for minor offenses, but rates in 2010 were slightly higher than rates in the beginning of the decade (20.0 arrests per 1,000 residents in 2010, 19.8 arrests per 1,000 residents in 2001). The average annual rate increased slightly, from 19.0 to 19.5 arrests per 1,000 residents between the 2001-2007 and 2008-2010 periods. The arrest rates for driving under the influence were slowly increasing prior to significant well development, from 2.6 arrests per 1,000 residents in 2001 to 3.7 arrests per 1,000 residents in 2006. The rate dipped in 2007 (to a rate of 3.1 arrests per 1,000 residents) then returned to rates similar to those in prior years in 2008 (3.2) and 2009 (3.3). The data for 2010 suggested a relatively large increase in the arrest rate for DUI, jumping to 4.6 arrests per 1,000 residents. The annual average rate also increased slightly between the two periods, from 3.4 arrests per 1,000 residents over 2001-2007 to 3.7 arrests per 1,000 residents over 2008-2010. The arrest rate for drug abuse violations increased in the early part of the decade, from 1.1 arrests per 1,000 residents in 2001 to 2.0 arrests per 1,000 residents in 2005. The rate then stayed relatively steady through the remainder of the study period, ranging from a rate of 1.7 arrests per 1,000 residents in 2007 to a rate of 2.1 arrests per 1,000 residents in 2009. The average annual rate was higher during the years of well development (an average of 2.0 arrests per 1,000 residents in 2008-2010) than the previous period (1.6 arrests per 1,000 residents over 2001-2007), but note that the rates increased prior to active well development.
0
100
200
300
400
0
5
10
15
20
25
30
35
2001 2002 2003 2004 2005 2006 2007 2008 2009 2010
Wel
ls D
evel
op
ed
Nu
mb
er o
f A
rres
ts p
er 1
,00
0 R
esid
ents
Figure 17. Bradford County Arrest Rates and Wells Developed, 2001-2010
serious crimes minor offenses DUI drug abuse wells
Source: FBI Uniform Crime Reporting System.
The Center for Rural Pennsylvania Page | 22
The arrest rates for serious crimes in Lycoming County held relatively steady throughout the decade, with no major changes after the start of Marcellus Shale activity as indicated both by Figure 18 and the average annual rates in Table 7. The arrest rates for minor offenses increased slightly in 2008 but overall continued the general declining trend during the years with significant well development. The average annual rate of arrests was lower during the years of well development (26.8 arrests per 1,000 residents in 2008-2010) than prior to development (24.2 arrests per 1,000 residents in 2001-2007). Arrest rates for driving under the influence generally declined from 2001 (5.0 arrests per 1,000 residents) through 2007 (3.8 arrests), then increased in 2008 (4.8 arrests) and 2009 (5.5 arrests), coincident with well development, although the rate dipped slightly again in 2010 (5.1 arrests). The average annual rate was higher during the period of well development (4.5 arrests per 1,000 residents in 2001-2007 and 5.1 arrests per 1,000 residents in 2008-2010). The arrest rate for drug abuse violations in Lycoming County was generally declining in the early part of the decade, from a high of 2.4 arrests per 1,000 residents in 2002 to 1.3 arrests per 1,000 residents in 2006. The following year, 2007, saw the highest rate of the decade, 2.6 arrests per 1,000 residents, which was followed by the lowest rate of the decade in 2008. The rates in 2009 and 2010 increased again to 1.9 and 2.2 arrests per 1,000 residents, respectively. Overall, the average annual rate was higher prior to active well development (2.1 arrests per 1,000 residents in 2001-2007) than during development (1.7 arrests per 1,000 residents in 2008-2010).
0
100
200
300
400
0
5
10
15
20
25
30
35
2001 2002 2003 2004 2005 2006 2007 2008 2009 2010
We
lls D
eve
lop
ed
Nu
mb
er
of
Arr
est
s p
er
1,0
00
Re
sid
en
ts
Figure 18. Lycoming County Arrest Rates and Wells Developed, 2001-2010
serious crimes minor offenses DUI drug abuse wells
Source: FBI Uniform Crime Reporting System.
The Center for Rural Pennsylvania Page | 23
As indicated in Figure 19, Greene County experienced general declines in arrest rates for both serious crimes and minor offenses both before and after well development began. These trends are supported by the average annual rates in Table 7, which are lower during well development (2008-2010) than prior to development (2001-2007) for serious crimes and minor offenses. The arrest rate for driving under the influence, although variable, was following a slightly downward trend from 2001 through 2005, from 7.9 arrests per 1,000 residents in 2001 to 5.2 arrests per 1,000 residents in 2007 (with the exception of the jump in 2006). The trend changed beginning in 2008, rising from 5.3 arrests per 1,000 residents to 6.8 arrests in 2010. The average annual rate for DUI is about the same across the two periods. The annual arrest rates for drug abuse violations in Greene County were highest in the years immediately preceding development (3.0 arrests per 1,000 residents in 2005 and 2006) and then declined slightly during the years of active well development (rates of 2.8, 2.4, 2.4, and 2.5 arrests per 1,000 residents in 2007-2010, respectively). The average annual rate is largely the same across the two study periods (an average of 2.5 arrests per 1,000 residents over the years 2001-2007 and an average of 2.4 arrests per 1,000 residents for 2008-2010).
0
100
200
300
400
0
5
10
15
20
25
30
35
2001 2002 2003 2004 2005 2006 2007 2008 2009 2010
We
lls D
eve
lop
ed
Nu
mb
er
of
Arr
est
s p
er
1,0
00
Re
sid
en
ts
Figure 19. Greene County Arrest Rates and Wells Developed, 2001-2010
serious crimes minor offenses DUI drug abuse wells
Source: FBI Uniform Crime Reporting System.
The Center for Rural Pennsylvania Page | 24
The arrest rates for serious crimes in Washington County remained fairly consistent over the course of the decade, with no significant changes in the trends before and after well development began. The average annual rates were lower during the period of active well development (2008-2010) than prior years (2001-2007) (Figure 20). Arrest rates for minor offenses decreased overall from 2001 to 2010, with a slight uptick in 2004. The average annual rate for minor offense arrests was also lower during the period of active well development than in prior years. The arrest rate for driving under the influence was generally decreasing from 2001 (5.1 arrests per 1,000 residents) through 2006 (3.3 arrests per 1,000 residents), then held relatively steady during 2007-2009 (between 3.4 and 3.7 arrests per 1,000 residents), then increased in 2010 (to 4.6 arrests per 1,000 residents) (Table 7). The average annual rate was slightly lower during active well development than in prior years (4.1 arrests per 1,000 residents 2001-2007, 3.9 arrests per 1,000 residents 2008-2010). The arrest rates for drug sales in Washington County, similar to Greene County, were at their highest in the years prior to well development and declining thereafter. The highest rate (2.9 arrests per 1,000 residents) occurred in 2003, and the lowest occurred in 2010 (1.2 arrests per 1,000 residents). The average annual arrest rates for drug abuse violations were higher in the years prior to development (2.1 arrests per 1,000 residents in 2001-2007) than during development (1.6 arrests per 1,000 residents in 2008-2010).
0
100
200
300
400
0
5
10
15
20
25
30
35
2001 2002 2003 2004 2005 2006 2007 2008 2009 2010
We
lls D
eve
lop
ed
Nu
mb
er
of
Arr
est
s p
er
1,0
00
Re
sid
en
ts
Figure 20. Washington County Arrest Rates and Wells Developed, 2001-2010
serious crimes minor offenses DUI drug abuse wells
Source: FBI Uniform Crime Reporting System.
The Center for Rural Pennsylvania Page | 25
Table 7. Average Annual Rates of Arrests (per 1,000 Residents) for Serious Crimes, Minor Offenses, DUI, and Drug Abuse by County, Region, and Typology Categories Before and During Marcellus Shale Well Development
Average Annual Rates for: Serious Crimes Minor Offenses
Southwest Region* 9.2 9.0 23.1 20.5 3.8 4.1 2.4 2.5 Greene County 7.2 5.5 25.5 19.8 6.0 5.9 2.5 2.4 Washington County 8.1 7.5 21.9 16.7 4.1 3.9 2.1 1.6
Typology No Marcellus 11.2 10.9 21.4 19.9 3.8 4.2 3.0 2.9 Urban Marcellus 9.0 8.9 23.8 21.0 3.8 4.0 2.5 2.2 2nd Tier 7.9 8.4 25.1 21.5 4.2 4.5 2.5 2.6 Core, Low Activity 7.2 7.5 25.0 21.7 4.8 4.8 2.7 2.9 Core, High Activity 7.6 7.3 24.2 20.9 4.2 4.5 2.6 2.6 * County average, includes study counties. * County average, includes study counties. The northern tier region consists of 12 counties: Bradford, Lycoming, and the 10 neighboring counties of Clinton, Columbia, Montour, Northumberland, Potter, Sullivan, Susquehanna, Tioga, Union, and Wyoming. The southwest region consists of six counties: Greene, Washington, and the four neighboring counties of Allegheny, Beaver, Fayette, and Westmoreland. Data source: Uniform Crime Reports, FBI.
Comparing the arrest rates in the study counties to the regional and state arrest rates allows for comparison of trends and rates to the broader region (Figures 21 through 28).
The Center for Rural Pennsylvania Page | 26
The arrest rates from 2007-2010 for serious crimes in Bradford and Lycoming counties largely followed those of the northern tier, with the exception of 2010. In that year, the region experienced a slight decrease while Bradford and Lycoming experienced a slight increase (Figure 21). The average annual rates for counties in the region were slightly lower during the period of active well development (average annual rate of 6.9 arrests per 1,000 residents in 2008-2010) than earlier years (7.2 arrests per 1,000 residents), a pattern similar to Bradford County (Table 7). Lycoming County had equal average annual rates over the two periods (8.9 arrests per 1,000 residents). Washington County largely followed the trend in the southwest region during this time period as well, whereas Greene County saw a faster decrease after 2006 than the region experienced. The average annual rates also indicate similar patterns
0
2
4
6
8
10
12
2001 2002 2003 2004 2005 2006 2007 2008 2009 2010
Nu
mb
er
of
Arr
est
s p
er
1,0
00
Re
sid
en
ts
Figure 21. Rate of Arrests for Serious Crimes Northern Tier Region, 2001-2010
Bradford Lycoming Northern Tier Pennsylvania
0
2
4
6
8
10
12
2001 2002 2003 2004 2005 2006 2007 2008 2009 2010
Nu
mb
er
of
Arr
est
s p
er
1,0
00
Re
sid
en
ts
Figure 22. Rate of Arrests for Serious Crimes Southwest Region, 2001-2010
Greene Washington Southwest Region Pennsylvania
Source: FBI Uniform Crime Reporting System.
The Center for Rural Pennsylvania Page | 27
of decline in arrest rates for serious crimes during active well development for the study counties and the region (Table 7).
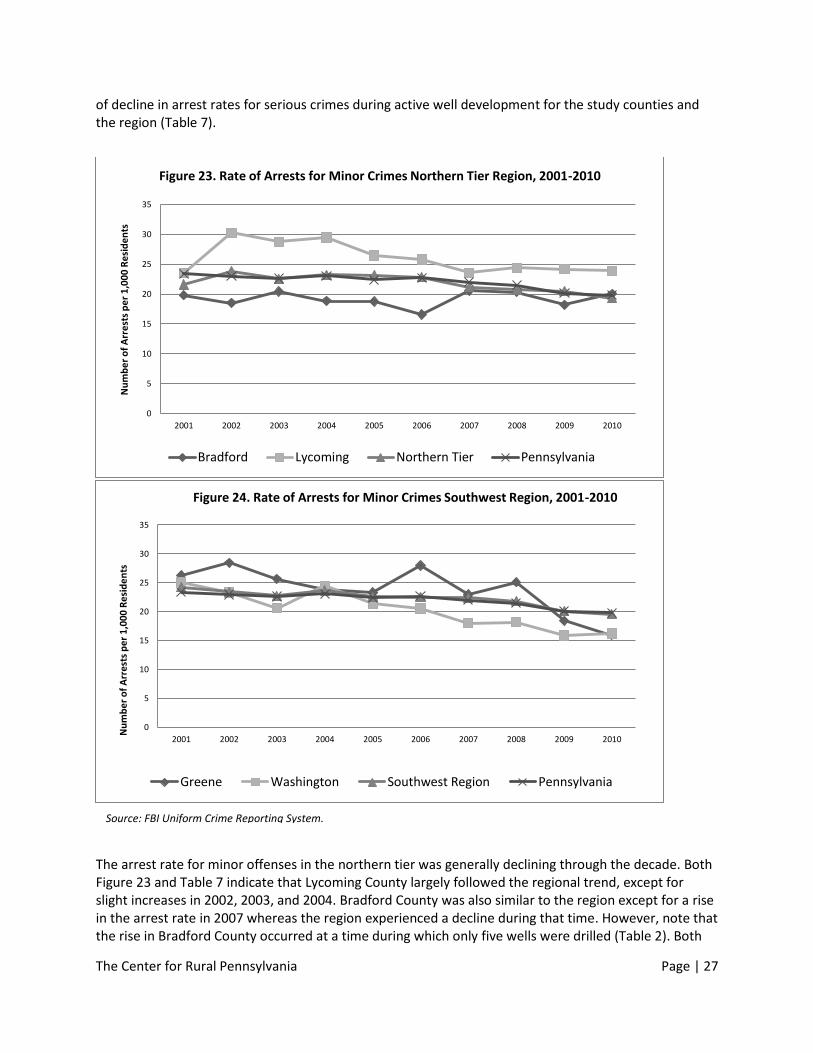
The arrest rate for minor offenses in the northern tier was generally declining through the decade. Both Figure 23 and Table 7 indicate that Lycoming County largely followed the regional trend, except for slight increases in 2002, 2003, and 2004. Bradford County was also similar to the region except for a rise in the arrest rate in 2007 whereas the region experienced a decline during that time. However, note that the rise in Bradford County occurred at a time during which only five wells were drilled (Table 2). Both
0
5
10
15
20
25
30
35
2001 2002 2003 2004 2005 2006 2007 2008 2009 2010
Nu
mb
er
of
Arr
est
s p
er
1,0
00
Re
sid
en
ts
Figure 23. Rate of Arrests for Minor Crimes Northern Tier Region, 2001-2010
Bradford Lycoming Northern Tier Pennsylvania
0
5
10
15
20
25
30
35
2001 2002 2003 2004 2005 2006 2007 2008 2009 2010
Nu
mb
er
of
Arr
est
s p
er
1,0
00
Re
sid
en
ts
Figure 24. Rate of Arrests for Minor Crimes Southwest Region, 2001-2010
Greene Washington Southwest Region Pennsylvania
Source: FBI Uniform Crime Reporting System.
The Center for Rural Pennsylvania Page | 28
study counties in the southwest region largely followed the regional trends for arrest rates for minor offenses, with a general decline over the decade (Figure 24, Table 7).
The arrest rate for DUI in the northern tier region increased from 2007 through 2010 (Figure 25). Bradford County generally followed this trend. The arrest rate in Bradford County increased slightly from 2007 through 2009 and increased significantly in 2010, to a level close to that of the region. Lycoming
0
2
4
6
8
10
2001 2002 2003 2004 2005 2006 2007 2008 2009 2010
Nu
mb
er
of
Arr
est
s p
er
1,0
00
Re
sid
en
ts
Figure 25. Rate of Arrests for DUI Northern Tier Region, 2001-2010
Bradford Lycoming Northern Tier Pennsylvania
0
2
4
6
8
10
2001 2002 2003 2004 2005 2006 2007 2008 2009 2010
Nu
mb
er
of
Arr
est
s p
er
1,0
00
Re
sid
en
ts
Figure 26. Rate of Arrests for DUI Southwest Region, 2001-2010
Greene Washington Southwest Region Pennsylvania
Source: FBI Uniform Crime Reporting System.
The Center for Rural Pennsylvania Page | 29
County increased at a steeper rate from 2007 through 2009, then decreased in 2010. These increases in the counties of the northern tier region, including the study counties, are reflected in the higher average annual rates during well development (2008-2010) as comapred to prior years (2001-2007) (Table 7). The arrest rates for DUI in Washington County were very similar to those of the southwest region, with the exception of 2010 (Figure 26). In that year, the Washington County rate increased while the region decreased. Similarly, the arrest rate in Greene County increased in 2009 and 2010 whereas the region experienced a decrease. However, note that the average annual rate for the region was slightly higher during active well development (4.1 arrests per 1,000 residents over the 2008-2010 period) than prior years (3.8 arrests per 1,000 residents over the 2001-2007 period). In contrast, the study counties experienced similar (Greene) or slightly lower (Washington) average annual rates during the period of active well development (Table 7).
0
1
1
2
2
3
3
4
2001 2002 2003 2004 2005 2006 2007 2008 2009 2010
Nu
mb
er
of
Arr
est
s p
er
1,0
00
Re
sid
en
ts
Figure 27. Rate of Arrests for Drug Violations Northern Tier Region, 2001-2010
Bradford Lycoming Northern Tier Pennsylvania
0
1
1
2
2
3
3
4
2001 2002 2003 2004 2005 2006 2007 2008 2009 2010
Nu
mb
er
of
Arr
est
s p
er
1,0
00
Re
sid
en
ts
Figure 28. Rate of Arrests for Drug Violations Southwest Region, 2001-2010
Greene Washington Southwest Region Pennsylvania
Source: FBI Uniform Crime Reporting System.
The Center for Rural Pennsylvania Page | 30
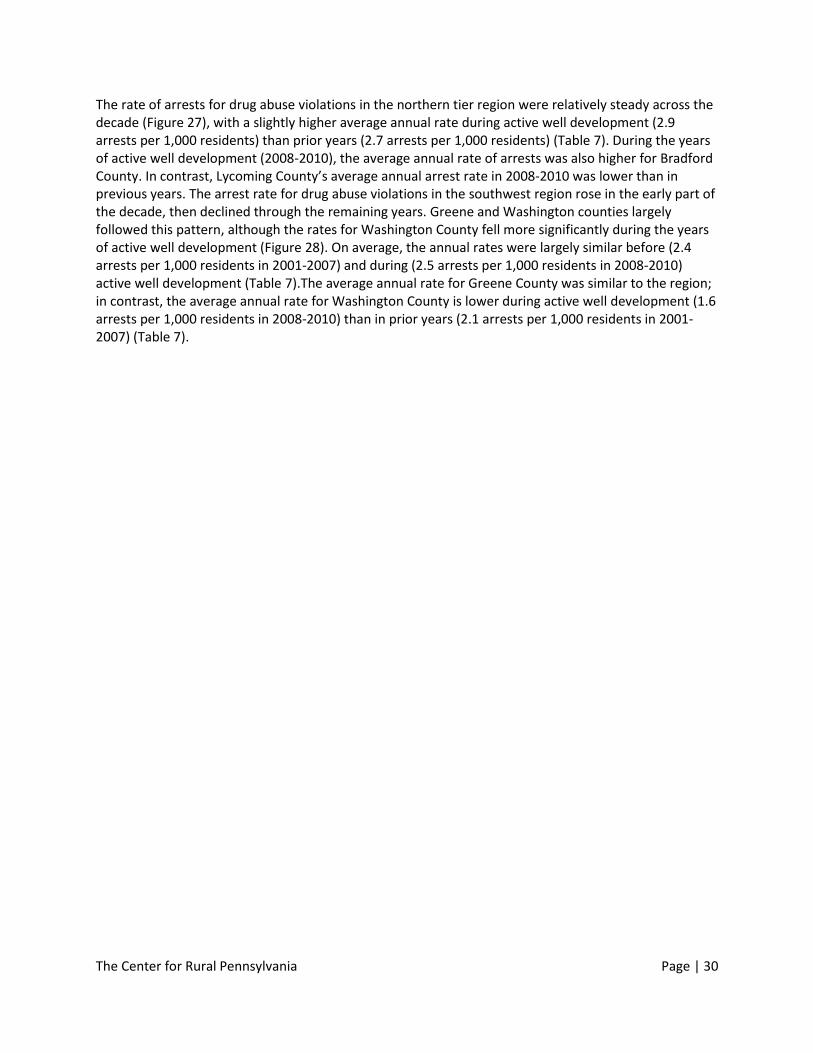
The rate of arrests for drug abuse violations in the northern tier region were relatively steady across the decade (Figure 27), with a slightly higher average annual rate during active well development (2.9 arrests per 1,000 residents) than prior years (2.7 arrests per 1,000 residents) (Table 7). During the years of active well development (2008-2010), the average annual rate of arrests was also higher for Bradford County. In contrast, Lycoming County’s average annual arrest rate in 2008-2010 was lower than in previous years. The arrest rate for drug abuse violations in the southwest region rose in the early part of the decade, then declined through the remaining years. Greene and Washington counties largely followed this pattern, although the rates for Washington County fell more significantly during the years of active well development (Figure 28). On average, the annual rates were largely similar before (2.4 arrests per 1,000 residents in 2001-2007) and during (2.5 arrests per 1,000 residents in 2008-2010) active well development (Table 7).The average annual rate for Greene County was similar to the region; in contrast, the average annual rate for Washington County is lower during active well development (1.6 arrests per 1,000 residents in 2008-2010) than in prior years (2.1 arrests per 1,000 residents in 2001-2007) (Table 7).
The Center for Rural Pennsylvania Page | 31
.
Figures 29 through 32 illustrate the rates of arrests for serious crimes, minor crimes, driving under the influence, and drug abuse violations by the Marcellus County Typology. Table 7 provides the average annual rates prior to (2001-2007) and during (2008-2010) active well development. The pattern of rates of arrests for serious crimes for Urban Marcellus and Core, High Activity counties are largely similar to those of No Marcellus counties across the decade (Figure 29). Two county categories (2nd Tier and Core, Low Activity) experienced increased arrest rates for serious crimes in 2008 and 2009, and Table 7
0
2
4
6
8
10
12
14
2001 2002 2003 2004 2005 2006 2007 2008 2009 2010
Nu
mb
er
of
Arr
est
s p
er
1,0
00
Re
sid
en
ts
Figure 29. Rate of Arrest for Serious Crimes by Typology, 2001-2010
Core, High Activity
Core, Low Activity
2nd Tier
Urban Marcellus
No Marcellus
0
5
10
15
20
25
30
2001 2002 2003 2004 2005 2006 2007 2008 2009 2010
Nu
mb
er
of
Arr
est
s p
er
1,0
00
Re
sid
en
ts
Figure 30. Rate of Arrest for Minor Offenses by Typology, 2001-2010
Core, High Activity
Core, Low Activity
2nd Tier
Urban Marcellus
No Marcellus
Source: FBI Uniform Crime Reporting System.
The Center for Rural Pennsylvania Page | 32
reflects higher average annual rates during well development than prior to development. The arrest rates for minor offenses across the categories of the Marcellus Typology suggest no differences between counties with and without Marcellus Shale, as indicated by similar patterns in Figure 30 and lower average annual rates during well development than prior years in Table 7.
The rates of arrests for driving under the influence in No Marcellus counties were generally increasing from 2002 through 2008, then began to decrease. A similar pattern holds for Urban Marcellus and Core, Low Activity counties. In contrast, Core, High Activity and 2nd Tier counties experienced increases in the arrest rates for driving under the influence from 2008 through 2010 (Figure 31). However, the average annual rates of arrests for driving under the influence for most county categories (with the exception of Core, Low Activity) were higher during the period of active well development than prior years (Table 7).
Finally, Figure 32 illustrates the trends for the rates of arrests for drug abuse violations by typology. A general decline in arrest rates for drug abuse violations occurred from 2007-2010 in counties without Marcellus and Urban Marcellus counties. Core, High Activity and Core, Low Activity counties experienced an increase from 2007 to 2008 then a general decrease through 2010. Counties labeled 2nd Tier experienced more variability over that time period. A comparison of the average annual rates between 2001-2007 and 2008-2010 suggest that 2nd Tier and Core/Low Activity counties experienced slightly increased averages during active well development than prior years, whereas other counties (both in and out of the Marcellus Shale region) experienced slight decreases in the average annual rate (Table 7).
0
1
2
3
4
5
6
2001 2002 2003 2004 2005 2006 2007 2008 2009 2010
Nu
mb
er
of
Inci
de
nts
pe
r 1
,00
0 R
esi
de
nts
Figure 31. Rate of Arrests for DUI by Typology, 2001-2010
Core, High Activity
Core, Low Activity
2nd Tier
Urban Marcellus
No Marcellus
The Center for Rural Pennsylvania Page | 33
Summary
The analyses described above suggest a very mixed picture of the impacts of Marcellus Shale activity on criminal activity, as indicated by arrest rates. The patterns in the study counties over time and in comparison to their respective region as well as the typology analysis suggest that there were no increases in arrests for serious crimes or minor crimes associated with Marcellus Shale well development.
The conclusions for driving under the influence (DUI) differ by county and type of analysis. The arrest rates for DUI in Bradford County were higher in the years of well development (particularly 2010), the increase generally follows the regional pattern. Lycoming County experienced an increase in the arrest rates for DUI that was greater than the general increase in surrounding counties, but then experienced a decrease in 2010. In contrast, both Greene and Washington Counties experienced increased arrest rates in 2009 and 2010 when the southwest region experienced decreased rates. The typology analysis is inconclusive. In contrast to other categories, counties with high levels of well development activity experienced increasing rates of arrests from 2008 through 2010; however, the average annual rates were higher across all categories of the typology.
The patterns for arrests for drug abuse violations were less clear. Although Bradford County experienced an increase in arrest rates during the years of active well development, the increase actually began prior to development (2004). Lycoming County experienced an increase in arrest rates for drug abuse violations during 2009 and 2010 that differs from the regional trend. The arrest rates for drug abuse violations in Greene and Washington counties were lower during the years of active well development. The typology analysis for drug abuse violations does not indicate that increased rates of arrests are associated with Marcellus Shale development.
0
1
2
3
4
2001 2002 2003 2004 2005 2006 2007 2008 2009 2010
Nu
mb
er
of
Arr
ets
pe
r 1
,00
0 R
esi
de
nts
Figure 32. Rate of Arrests for Drug Violations by Typology, 2001-2010
Core, High Activity
Core, Low Activity
2nd Tier
Urban Marcellus
No Marcellus
Source: FBI Uniform Crime Reporting System.
The Center for Rural Pennsylvania Page | 34
New Criminal and Civil Cases Filed in Pennsylvania Courts
This analysis now turns to examining the potential association between Marcellus Shale development and the investigation, prosecution, and adjudication portions of the criminal justice system. The Administrative Office of the Pennsylvania Courts records statistics on the caseloads within the criminal, civil, family, orphan, and magisterial district court systems through the Pennsylvania Unified Judicial System (UJS): Common Pleas Case Management System and Magisterial District Judge System. The UJS system defines “Cases Filed” as “the number of cases initiated during the year” either through a citation, a complaint, or a petition. These data are available annually by county. The following section examines the rates of new cases filed in criminal, civil, and magisterial courts (number of new cases per 1,000 residents in that year). The rate of new cases filed provides an indication of the level of criminal activity from the preceding time period (stretching from a few days to a few years) and the load carried by agencies and offices that investigate, prosecute, defend, and adjudicate offenders; it does not provide a measure of the total case load in the system because it does not include cases carried forward from previous years.
Figures 33 through 36 present the rate of new criminal and civil cases filed per year in each of the study counties in relation to the number of wells drilled. Table 8 presents the average annual rates of new criminal and civil cases filed prior to (2001-2007) and during (2008-2010) well development.
0
100
200
300
400
0
5
10
15
20
2001 2002 2003 2004 2005 2006 2007 2008 2009 2010
Wel
ls D
rille
d
Ne
w C
ase
s Fi
led
per
1,0
00 R
esid
ents
Figure 33. Rate of New Case Filings by Wells Bradford County 2001-2010
Criminal Civil wells
0
100
200
300
400
0
5
10
15
20
2001 2002 2003 2004 2005 2006 2007 2008 2009 2010
Wel
ls D
rille
d
Ne
w C
ase
s Fi
led
per
1,0
00 R
esid
ents
Figure 34. Rate of New Case Filings by Wells Lycoming County 2001-2010
Criminal Civil wells
0
100
200
300
400
0
5
10
15
20
2001 2002 2003 2004 2005 2006 2007 2008 2009 2010
We
lls D
rille
d
Ne
w C
ases
File
d p
er 1
,000
Re
sid
ents
Figure 35. Rate of New Case Filings by Wells Greene County 2001-2010
Criminal Civil wells
0
100
200
300
400
0
5
10
15
20
2001 2002 2003 2004 2005 2006 2007 2008 2009 2010
We
lls D
rille
d
New
Cas
es F
iled
per
1,0
00
Res
iden
ts
Figure 36. Rate of New Case Filings by Wells Washington County 2001-2010
Criminal Civil wells
Source: Pennsylvania Unified Judicial System (UJS), Administrative Office of the PA Courts.
The Center for Rural Pennsylvania Page | 35
Table 8. Average Annual Rates (per 1,000 Residents) of New Criminal and Civil Cases Filed by County, Region, and Typology Categories Before and During Marcellus Shale Well Development
Average Annual Rates for: New Criminal Cases Filed New Civil Cases Filed
2001-2007 2008-2010 2001-2007
2008-2010
Pennsylvania Counties 12.5 13.2 5.9 10.7
Northern Tier* 11.2 12.5 5.5 9.4 Bradford County 9.5 10.3 6.5 10.3 Lycoming County 16.5 16.3 7.2 11.4
Southwest Region* 13.3 14.3 6.6 11.0 Greene County 13.1 13.4 5.0 9.6 Washington County 12.7 13.8 1.8 4.3
* County average, includes study counties. The northern tier region consists of 12 counties: Bradford, Lycoming, and the 10 neighboring counties of Clinton, Columbia, Montour, Northumberland, Potter, Sullivan, Susquehanna, Tioga, Union, and Wyoming. The southwest region consists of six counties: Greene, Washington, and the four neighboring counties of Allegheny, Beaver, Fayette, and Westmoreland. Data source: Pennsylvania Unified Judicial System (UJS), Administrative Office of the PA Courts.
In Bradford County the rate of new criminal cases filed was trending downward from 2004 (10.5 cases per 1,000 residents) through 2007 (9.2 cases per 1,000 residents), prior to significant well development. The rate increased in 2008 (10.1 cases per 1,000 residents) and 2009 (10.9 cases per 1,000 residents), commensurate with well development, and then decreased in 2010 (10.1 cases per 1,000 residents) (Figure 33). The average annual rate for new criminal cases filed was slightly higher in years of well development (10.3 cases per 1,000 residents in 2008-2010) than previous years (9.5 cases per 1,000 residents in 2001-2007) (Table 8). The rate of new civil case filings in Bradford County was relatively stable from 2002 through 2005, and then increased significantly from 2006 through 2008 (from 5.8 cases per 1,000 residents in 2005 to 10.9 cases per 1,000 residents in 2008) through 2008 (Figure 33). Although the rate decreased somewhat in 2009 (9.4 cases per 1,000 residents), it increased again in 2010 (10.6 cases per 1,000 residents). It is possible that the civil cases in the years prior to significant well development could reflect legal contentions over leasing, which was occurring in the years prior to the actual drilling activity. The average annual rate was higher during active well development (10.5 cases per 1,000 residents in 2008-2010) than prior years (6.5 cases per 1,000 residents in 2001-2007) (Table 8).
The rates of new criminal cases filed in Lycoming County were increasing slightly in the years just prior to well development, from 16.0 new cases filed per 1,000 residents in 2005 to 17.7 new cases filed per 1,000 residents in 2007, and then began a general decline to a rate of 15.1 new cases per 1,000 residents in 2010 (Figure 34). The average annual rate of new criminal cases filed is roughly the same
The Center for Rural Pennsylvania Page | 36
during the years of active well development (16.3 new criminal cases filed per 1,000 residents over the 2008-2010 period) than prior years (16.5 new criminal cases filed per 1,000 residents over the 2001-2007 period) (Table 8). Similar to Bradford County, the rates of new civil case filings in Lycoming County increased in the years prior to well development, from 5.1 new civil cases per 1,000 residents in 2004 to 11.3 new civil cases per 1,000 residents in 2007 (Figure 34). The rated then stayed steady through the rest of the decade. The average annual rate of new civil cases filed is higher during the years of active well development (11.4 new civil cases filed per 1,000 residents over the 2008-2010 period) than prior years (7.2 new civil cases filed per 1,000 residents over the 2001-2007 period) (Table 8).
The rate of new criminal cases filed in Greene County was variable across the decade, with the highest and lowest rates occurring prior to well development (Figure 35). During the period of active well development, 2008-2010, there was a trend toward increasing rates of new criminal cases; however, like other study counties, the rate dips again in 2010. The average annual rate of new criminal cases filed was slightly higher during the years of active well development (13.4 new criminal cases filed per 1,000 residents over the 2008-2010 period) than prior years (13.1 new criminal cases filed per 1,000 residents over the 2001-2007 period) (Table 8).The rate of new civil cases filed in Greene County generally increased throughout the decade. The rates steadily increased from 2001 through 2006, then increased significantly in 2007 and again in 2010, commensurate with well development (Figure 35). The average annual rate of new civil cases filed in Greene County was higher during the years of active well development (9.6 new civil cases filed per 1,000 residents over the 2008-2010 period) than prior years (5.0 new civil cases filed per 1,000 residents over the 2001-2007 period) (Table 8).
The rate of new criminal cases filed in Washington County declined from 13.5 new criminal cases per 1,000 residents in 2005 to 12.1 new criminal cases per 1,000 residents in 2006, the first years of well development activity in the county (Figure 36). The rate then was steady in 2007 (12.0 new criminal cases per 1,000 residents) then increased to 14.0 cases per 1,000 residents in 2008 and 2009, followed by a slight decline to 13.3 cases per 1,000 residents in 2010. The average annual rate of new criminal cases filed was only slightly higher during the years of active well development (13.4 new criminal cases filed per 1,000 residents over the 2008-2010 period) than prior years (13.1 new civil cases filed per 1,000 residents over the 2001-2007 period) (Table 8). The rate of new civil cases filed in Washington County was steadily decreasing throughout the decade, from 2.2 new civil cases per 1,000 residents in 2001 to 1.4 new civil cases per 1,000 residents in 2009, with the exception of a large spike in the rate in 2010 (10.2 new civil cases per 1,000 residents) (Figure 36). This spike contributes to a higher average annual rate of new civil cases filed during the years of active well development (4.3 new civil cases filed per 1,000 residents over the 2008-2010 period) than prior years (1.8 new civil cases filed per 1,000 residents over the 2001-2007 period) (Table 8). It is unclear what led to this significant increase.
0
5
10
15
20
2001 2002 2003 2004 2005 2006 2007 2008 2009 2010
Ne
w C
ase
s Fi
led
per
1,0
00 R
esid
ents
Figure 37. New Criminal Cases Filed Northern Tier Region, 2001-2010
Figure 38. New Criminal Cases Filed Southwest Region, 2001-2010
Greene Washington Southwest
Source: Pennsylvania Unified Judicial System (UJS), Administrative Office of the PA Courts.
The Center for Rural Pennsylvania Page | 37
Next the trends in the four study counties were examined in relation to the regional patterns. The rates for new criminal cases filed in the northern tier were generally increasing between 2003 and 2009 (Figure 37). Bradford County, in contrast, had a slightly decreasing trend from 2004 through 2007, and then experienced an increase, similar to the region, in 2008 and 2009. The rates of new criminal cases filed in Lycoming County were similar to the region, generally increasing from 2003 to 2007, but then declined throughout the rest of the decade. The average annual rate of new criminal cases filed across the counties in the northern tier region increased from the period prior to well development (11.2 new criminal cases filed per 1,000 residents in 2001-2007) to the period of active well development (12.5 new criminal cases filed per 1,000 residents in 2008-2010) (Table 8).
The rates for new criminal cases filed in the southwest region were increasing slightly from 2001 through 2005, and then gradually decreasing through the rest of the decade. The rates in both Greene and Washington counties were more variable during the decade, but did not differ dramatically in direction or magnitude from the regional trends (Figure 38). The average annual rate of new criminal cases filed across the counties in the southwest region was 14.3 new criminal cases filed per 1,000 residents in 2008-2010 and 13.3 new criminal cases filed per 1,000 residents in 2001-2007 (Table 8).
The rates for civil cases filed in the northern tier region were generally climbing between 2005 and 2010 (Figure 39). The rates for Bradford County were similar to the region in the early part of the decade but increased more quickly and at a higher absolute rate than the region beginning in 2005. Bradford and Lycoming Counties have quite similar rates of new civil cases filed during the latter half of the decade, with the exception of the rate in 2009. As noted above, the rates increased prior to well development (up to 2007) then stay relatively level through the years of rapid well development (2008-2010). The average annual rates for Bradford and Lycoming counties, as well as counties in the northern tier region, were higher during the years of active well development (9.4 new civil cases filed per 1,000 residents in 2008-2010) than previous years (5.5 new civil cases filed per 1,000 residents in 2001-2007) (Table 8).
The pattern for the rates of new civil case filings in the southwest region look similar to those of the northern tier, increasing from 2004 through 2008 (Figure 40). The rates in Greene County followed those for the region. The rates in Washington County were quite different in both magnitude and direction. As noted above, the rate of new civil cases declined from 2001 through 2009, followed by a sharp increase in 2010. The average annual rates for Greene and Washington counties, as well as counties in the southwest region, were higher during the years of active well development (11.0 new civil cases filed per 1,000 residents in 2008-2010) than previous years (6.6 new civil cases filed per 1,000 residents in 2001-2007) (Table 8).
0
5
10
15
20
2001 2002 2003 2004 2005 2006 2007 2008 2009 2010
Ne
w C
ase
s Fi
led
per
1,0
00 R
esid
ents
Figure 39. New Civil Cases Filed Northern Tier Region, 2001-2010
Bradford Lycoming Northern Tier
0
5
10
15
20
2001 2002 2003 2004 2005 2006 2007 2008 2009 2010
Ne
w C
ase
s Fi
led
per
1,0
00 R
esid
ents
Figure 40. New Civil Cases Filed Southwest Region, 2001-2010
Greene Washington Southwest
Source: Pennsylvania Unified Judicial System (UJS), Administrative Office of the PA Courts.
The Center for Rural Pennsylvania Page | 38
Examining the rates of new criminal cases filed by Marcellus typology provides an additional opportunity to examine the potential association with Marcellus Shale activity. (The dramatic dip in New Criminal Cases Filed in 2004 for both the Urban Marcellus Shale and No Marcellus Shale counties likely reflects incomplete data3). For most categories, the trend was quite similar, reaching a high rate in 2006 and slowly decreasing over the remaining years of the decade. The exception is counties classified as Core, High Activity, which saw increased rates in 2008 and 2009 when other counties experienced decreased rates (Figure 40). However, the average annual rates for all categories increased between the period before development (2001-2007) and during development (2008-2010) (Table 8).
3 The data are likely incomplete because of a change in collection procedures that occurred in 2004. Counties with incomplete
data for 2004 include Adams, Armstrong, Beaver, Bedford, Butler, Cambria, Cameron, Clarion, Crawford, Cumberland, Elk,
Forest, Indiana, Jefferson, Lawrence, McKean, Warren, Westmoreland, and York.
0
2
4
6
8
10
12
14
16
2001 2002 2003 2004 2005 2006 2007 2008 2009 2010
Nu
mb
er
of
Filin
gs p
er
1,0
00
Re
sid
en
ts
Figure 40. New Criminal Cases Filed by County Typology, 2001-2010
Core, Active
Core, Less Active
2nd Tier
Urban MS
No MS
Source: Pennsylvania Unified Judicial System (UJS), Administrative Office of the PA Courts.
The Center for Rural Pennsylvania Page | 39
The potential effects of Marcellus Shale development on the rate of new civil case filings is unclear. Counties with Marcellus Shale, regardless of activity level, had relatively similar trends during the decade (Figure 41). The average annual rates for all categories of the Marcellus typology increased from the period before development (2001-2007) and during development (2008-2010) (Table 8).
Summary:
It is difficult to identify impacts of Marcellus Shale development on the rate of new criminal case filings in Pennsylvania courts. In Lycoming County, the rate was declining during the years of active well development. The analysis described here does not provide the ability to discern if the rate of that decrease would have been different in the absence of Marcellus Shale development. Bradford, Greene, and Washington counties all experienced increases in the rates of new criminal case filings during some of the years of active well development, but those increases are hard to distinguish from broader regional trends. The typology analysis suggested that counties with the highest levels of activity experienced increases in the rates of new criminal case filings during 2008 and 2009 when other counties experienced declines. However, the average annual rates for all categories of the Marcellus Shale typology were higher during years that saw active Marcellus Shale development than previous years.
The potential impacts of Marcellus Shale development on the rate of new civil case filings are also unclear. The rates of new criminal cases filed in Pennsylvania courts were higher during the years of active well development in Bradford, Lycoming, and Greene Counties. However, the rates were also increasing in other Pennsylvania counties, as indicated by the regional analyses. Further, the typology analysis indicates that the general pattern of increases were similar for all county categories, regardless of the presence of Marcellus Shale well development.
0
2
4
6
8
10
12
14
16
18
2001 2002 2003 2004 2005 2006 2007 2008 2009 2010
Nu
mb
er o
f Fi
lings
per
1,0
00 R
esid
ents
Figure 41. New Civil Cases Filed by County Typology, 2001-2010
Core, Active
Core, Less Active
2nd Tier
Urban MS
No MS
Source: Pennsylvania Unified Judicial System (UJS), Administrative Office of the PA Courts.
The Center for Rural Pennsylvania Page | 40
New Cases Filed for Traffic Offenses in Magisterial District Courts
Magisterial District Judges handle minor offenses (e.g., traffic, private civil complaints, landlord-tenant disputes, protection from abuse order, etc.) in most counties in Pennsylvania (Philadelphia and Pittsburgh have separate municipal courts). This section examines the rates of new case filings for traffic violations only (number of cases per 1,000 residents), as this is a concern expressed frequently by residents of areas experiencing Marcellus Shale development.
Figures 42 through 45 present the rate of traffic offenses per year in each of the study counties in relation to the number of wells drilled. Table 9 presents the average annual rates of traffic offenses prior to (2001-2007) and during (2008-2010) well development.
Source: Pennsylvania Unified Judicial System (UJS), Administrative Office of the PA Courts.
The Center for Rural Pennsylvania Page | 41
Table 9. Average Annual Rates (per 1,000 Residents) of New Case Filings for Traffic Violations Before and During Marcellus Shale Well Development by County, Region, and Typology
Average annual rate 2001-2007
Average annual rate 2008-2012
Pennsylvania Counties 153.0 157.0
Northern Tier* 151.3 155.6
Bradford County 89.1 100.1
Lycoming County 105.5 112.9
Southwest Region* 124.6 148.4
Greene County 130.9 140.8
Washington County 139.3 179.9
Typology
No Marcellus 170.5 174.3
Urban Marcellus 129.1 129.7
2nd Tier 147.6 150.8
Core, Low Activity 167.3 166.9
Core, High Activity 109.0 125.8
* County average includes study counties. The northern tier region consists of 12 counties: Bradford, Lycoming, and the 10 neighboring counties of Clinton, Columbia, Montour, Northumberland, Potter, Sullivan, Susquehanna, Tioga, Union and Wyoming. The southwest region consists of six counties: Greene, Washington, and the four neighboring counties of Allegheny, Beaver, Fayette, and Westmoreland. Data source: Pennsylvania Unified Judicial System (UJS), Administrative Office of the PA Courts.
Bradford County maintained fairly steady rates of traffic offenses between 2004 and 2008, then experienced a large increase in the rates in 2010 (Figure 43). Overall, the average annual rate of traffic offenses was higher during Marcellus Shale development (2008-2010) than prior years, with an average of 100.1 traffic violations per 1,000 residents compared to the average annual rate prior to Marcellus Shale development of 89.1 traffic violations per 1,000 residents (Table 9).
Lycoming County experienced a general decline in the rate of traffic violations from 2001 to 2006 followed by a trend toward increased rates from 2006 through 2010 (Figure 43). The average annual rate of traffic violations was higher during the period of Marcellus Shale development (2008-2010), with an average of 112.9 traffic violations per 1,000 residents compared to the average annual rate prior to Marcellus Shale development (2001-2007) of 105.5 traffic violations per 1,000 residents (Table 9).
The trend for the rate of traffic violations in Greene County was very slowly increasing from 2004 through 2008. The rate dropped in 2009, but then rebounded to earlier levels in 2010 (Figure 44). The average annual rate of traffic violations were higher during Marcellus Shale development (2008-2010) with an average of 140.8 traffic violations per 1,000 residents compared to the average annual rate prior to Marcellus Shale development (2001-2007), which was 130.9 traffic violations per 1,000 residents (Table 9).
The Center for Rural Pennsylvania Page | 42
Washington County experienced a decline in the rates for traffic violations from 2002 through 2006, followed by steep increases in 2007 and 2008 (Figure 45). The rate decreased in 2009 followed again by a slight increase in 2010. The average annual rate of traffic offenses were higher during Marcellus Shale development (2008-2010) with an average of 179.9 traffic violations per 1,000 residents compared to the average annual rate prior to Marcellus Shale development (2001-2007), which was 139.3 traffic violations per 1,000 residents (Table 9).
The rates for traffic violations for all counties in the northern tier were similar to the rates for all Pennsylvania counties (Figure 46). However, during the years of active well development, the counties in the northern tier experienced slightly increased rates for traffic violations in 2009 and 2010 when the rates for all counties in the state declined slightly. The average annual rate was slightly higher during active well development than before, with a rate or 155.6 traffic violations per 1,000 residents over the 2008-2010 period and 151.3 traffic violations over the 2001-2007 period. Similar to the region, both Bradford and Lycoming counties experienced higher rates in 2009 and 2010 (Table 9).
0
20
40
60
80
100
120
140
160
180
200
2001 2002 2003 2004 2005 2006 2007 2008 2009 2010
Nu
mb
er o
f Tr
affi
c Fi
lings
per
1,0
00
Re
sid
ents
Figure 46. Rate of New Traffic Case Filings in the Northern Tier, 2001-2010
Northern Tier
Bradford
Lycoming
Pennsylvania
Source: Pennsylvania Unified Judicial System (UJS), Administrative Office of the PA Courts.
The Center for Rural Pennsylvania Page | 43
Counties in the southwest region experienced a slow but steady increase in rates of traffic offenses over the course of the decade, increasing from just over 120 filings per 1,000 residents in 2001 to close to 150 filings per 1,000 residents in 2010 (Figure 47). Consistent with the trend, the average annual rate was higher during active well development (148.4 traffic violations per 1,000 residents over the 2008-2010 period) than prior years (124.6 traffic violations per 1,000 residents over the 2001-2007 period). The overall trends for Greene and Washington Counties were similar to that of the region.
0
20
40
60
80
100
120
140
160
180
200
2001 2002 2003 2004 2005 2006 2007 2008 2009 2010
Nu
mb
er o
f Tr
affi
c Fi
lings
per
1,0
00
Re
sid
ents
Figure 47. Rate of New Traffic Case Filings in the Southwest Region, 2001-2010
SouthwestRegionGreene
Washington
Pennsylvania
0
20
40
60
80
100
120
140
160
180
200
2001 2002 2003 2004 2005 2006 2007 2008 2009 2010
Nu
mb
er o
f Tr
affi
c Fi
lings
per
1,0
00 R
esi
den
ts
Figure 48. Rate of New Traffic Case Filings by Typology, 2001-2010
Core, High Activity
Core, Low Activity
2nd Tier
Urban Marcellus
No Marcellus
Source: Pennsylvania Unified Judicial System (UJS), Administrative Office of the PA Courts.
Source: Pennsylvania Unified Judicial System (UJS), Administrative Office of the PA Courts.
The Center for Rural Pennsylvania Page | 44
In terms of new traffic filings for citations from 2008 to 2010, all of the categories experienced a general decline in the rates of traffic violations except the counties in the Core, High Activity category (Figure 48). The Core, High Activity counties had a decline in rates from approximately 120 filings per 1,000 residents in 2001 to approximately 100 filings per 1,000 residents in 2006. The rate then increased in each subsequent year through the end of the decade, surpassing Urban Marcellus Counties by 2010, to over 120 new case filings per 1,000 residents in 2010. Table 9 indicates that the average annual rate of traffic violations in the Core, High Activity counties was significantly higher in the years of active well development; the rate was 108.96 violations per 1,000 residents prior to Marcellus Shale development (2001-2007) and 125.78 violations per 1,000 residents during Marcellus Shale development (2008-2010). The other county classifications experienced relatively similar (Urban Marcellus, Core, Low Activity) or slightly higher (2nd Tier, No Marcellus) rates over the two time periods.
Summary:
Three of the four study counties (Bradford, Lycoming, and Washington) experienced increased rates of traffic violations during the years of active well development, as indicated both by the trends over the decade as well as higher average annual rates in 2008-2010 than previous years. The typology analysis also suggests a potential association between Marcellus Shale development and traffic violation rates. The rates were higher in counties experiencing the most active well development in 2008-2010 than in previous years.
Sentences for Misdemeanors in Pennsylvania Counties
The analysis below describes the rates of individuals (adults age 18 and over) sentenced for misdemeanors (such as DUI, assault, drug possession, etc.) in the Court of Common Pleas as classified by the Pennsylvania Commission on Sentencing for the study counties and regions, as well as the Marcellus typology. Sentencing data can approximate the number of convictions for various crimes. This analysis only examined misdemeanors, as they were the criminal offenses most likely to be affected by rapid natural resource development in previous studies. Sentencing data also provide an indication of the levels of activity in the court system and the potential impacts on the correctional system. The sentencing data were acquired from the Pennsylvania Commission on Sentencing repository through Penn State’s Population Research Institute (PRI).4
Figures 49 through 52 present the rate of individuals sentenced for misdemeanors per year for those 18 and older in each of the study counties in relation to the number of wells drilled. Table 10 presents the average annual rates of individuals sentenced for misdemeanors prior to (2001-2007) and during (2008-2010) well development.
4 Pennsylvania Commission on Sentencing. Pennsylvania Sentencing Data [2001-2010]. Population Research Institute, Penn
State. University Park, PA.
The Center for Rural Pennsylvania Page | 45
Source: Pennsylvania Department of Environmental Protection; Pennsylvania Commission on Sentencing.
The Center for Rural Pennsylvania Page | 46
Table 10. Average Annual Rates (per 1,000 Residents) of Individuals Sentenced for Misdemeanors Before and During Marcellus Shale Well Development by County, Region, and Typology
Average annual rate 2001-2007
Average annual rate 2008-2012
Pennsylvania Counties 7.3 7.9
Northern Tier 6.1 7.0 Bradford County 5.2 6.5 Lycoming County 9.5 10.2
Southwest Region 8.6 10.0 Greene County 10.7 12.3 Washington County 5.3 5.0
* County average, includes study counties. The northern tier region consists of 12 counties: Bradford, Lycoming, and the 10 neighboring counties of Clinton, Columbia, Montour, Northumberland, Potter, Sullivan, Susquehanna, Tioga, Union, and Wyoming. The southwest region consists of six counties: Greene, Washington, and the four neighboring counties of Allegheny, Beaver, Fayette, and Westmoreland. Data source: Pennsylvania Commission on Sentencing.
The rate of individuals sentenced for misdemeanor crimes in Bradford County was relatively steady from 2001 through 2006, then increased through the remainder of the decade (Figure 49). The average annual rate of individuals sentenced for misdemeanors in Bradford County was slightly higher during Marcellus Shale development (6.5 individuals sentenced for misdemeanors per 1,000 residents in 2008-2010) than prior years (5.2 individuals sentenced for misdemeanors per 1,000 residents in 2001-2007) (Table 10).
In the years immediately preceding well development the rate of individuals sentenced for misdemeanors in Lycoming County was relatively steady (Figure 50). The rate increased slightly in 2008, and then declined in subsequent years. The average annual rate of individuals sentenced for misdemeanors in Lycoming County was slightly higher during Marcellus Shale development (10.2 individuals sentenced for misdemeanors per 1,000 residents than prior years (9.5 individuals sentenced misdemeanors per 1,000 residents) (Table 10).
Greene County experienced a steady increase in rates of individuals sentenced for misdemeanors from 2001 to 2004 (Figure 51). After a slight dip in 2005, the rate sharply increased in 2006, which quickly declined by 2007 and 2008. The decade ended with rates that were higher than those at the beginning of the decade. The average annual rate was higher during Marcellus Shale development (2008-2010), with an average of 12.3 individuals sentenced for misdemeanors per 1,000 residents compared to the average annual rate prior to Marcellus Shale development (2001-2007), which was 10.7 individuals sentenced for misdemeanors per 1,000 residents (Table 10).
Washington County experienced steady rates of individuals sentenced for misdemeanors from 2001 through 2005, which was followed by a decline in 2006 (Figure 52). The rate rebounded in 2007 and 2008, which was again followed by a general decline in 2009 and 2010. The average annual rate was about the same during both periods of study (an average annual rate of 5.3 individuals sentenced for
The Center for Rural Pennsylvania Page | 47
misdemeanors per 1,000 residents in the 2001-2007 period and 5.0 individuals sentenced for misdemeanors per 1,000 residents in 2008-2010) (Table 10).
The rates of individuals sentenced for misdemeanors for all counties in the commonwealth were generally increasing from 2001 to 2010 (Figure 53).The trend for counties in the northern tier generally mimicked that of the commonwealth. The average annual rate for the northern tier counties was slightly higher during the years of active well development (7.0 individuals sentenced for misdemeanors per 1,000 residents) than prior years (6.3 individuals sentenced for misdemeanors per 1,000 residents) (Table 10). The trends in Bradford County were very similar to that of the region and the commonwealth; in contrast, Lycoming County’s rates were higher and more variable over the decade, experiencing a decline in 2009 when the region experienced an increase in the rates from the previous year.
Source: Pennsylvania Commission on Sentencing.
The Center for Rural Pennsylvania Page | 48
The counties in the southwest region experienced an overall upward trend in the rate of individuals sentenced for misdemeanors over the decade, similar to all counties in the commonwealth (Figure 54). The average annual rate during active well development was 10.0 individuals sentenced for misdemeanors per 1,000 residents over the 2008-2010 period, as compared to 8.6 individuals sentenced for misdemeanors per 1,000 residents over the 2001-2007 period (Table 10). Both Greene and Washington counties experienced more variability in the rates of misdemeanor sentences than the counties in the region. During the 2008-2010 period, the rates in the region were relatively steady. In contrast, the rates in Greene County increased in 2009 and then decreased in 2010; the rates in Washington County decreased both years.
Source: Pennsylvania Commission on Sentencing.
The Center for Rural Pennsylvania Page | 49
Figure 55 illustrates the trends in the rates of sentences for misdemeanors by the Marcellus typology. All categories experienced a steady increase over the course of the decade. Table 10 indicates that all categories of the typology, regardless of Marcellus Shale activity, had higher average annual rates during the period of active well development than prior years.
Summary
The above analysis does not suggest an association between the rates of sentences for misdemeanors and Marcellus Shale development. Although Bradford and Greene counties experienced higher rates during the latter part of the decade, the increases began prior to well development. The rates in Lycoming and Washington counties were highly variable over the decade, and it is not possible to discern a trend associated with Marcellus Shale development with this data. In addition, the typology analysis does not suggest an association between Marcellus Shale well development and the rate of sentences for misdemeanors.
County Jail Populations
The 63 county jails in Pennsylvania are managed by county governments. The populations of county jails are unpredictable and vary significantly across counties and over time. The county jail populations are comprised of a mix of inmates convicted and sentenced to short incarcerations and those awaiting trial. Offenders with sentences of 2 years or less are sentenced to county jail, and those with sentences of 5 years or more to state prison. For those with sentences of between 2 and 5 years, the sentencing judge has discretion to decide whether he/she should be committed to county jail or state prison (Zajac and
0
1
2
3
4
5
6
7
8
9
10
2001 2002 2003 2004 2005 2006 2007 2008 2009 2010
Nu
mb
er o
f M
isd
emea
no
rs p
er 1
,00
0 R
esid
ents
Figure 55. Rate of Adults Sentenced for Misdemeanors by Typology, 2001-2010
Core, Active
Core, Less Active
2nd Tier
Urban Marcellus
No Marcellus
Source: Pennsylvania Commission on Sentencing.
The Center for Rural Pennsylvania Page | 50
Kowalski, 2012b)5. There is some contention that county jails serve as a ‘relief valve’ for stressed state prisons (Zajac and Kowalski, 2012b).
The data examined here are the average daily populations based on the inspections of county jails completed by the Office of County Inspection and Services in the Pennsylvania Department of Corrections. The data were drawn from annual reports (2003-2010) made available through the Pennsylvania Commission on Crime and Delinquency website (e.g., PCCD 2010). The average daily count was used to account for the variability in the inmate population over time. The analysis below uses the rates calculated by PCCD (counts standardized by the population of each county as inmates per 100,000 residents). Because some counties house inmates from other counties, it cannot be assumed that the population rates for each county jail indicate criminal activity levels in that county. They can, however, suggest the relative levels of local government resources (primarily through the county sheriff’s offices) required to manage the county jails over time. Four counties (Cameron, Forest, Fulton, and Sullivan) do not have county jails and are excluded from the analyses (PCCD, 2010).
0
50
100
150
200
250
300
350
400
0
50
100
150
200
250
300
350
2003 2004 2005 2006 2007 2008 2009 2010
We
lls D
rille
d
Ave
rage
Dai
ly P
op
ula
tio
n p
er
10
0,0
00
Re
sid
en
ts
Figure 56. Rate of County Jail Populations by Marcellus Wells, Bradford County 2003-2010
inmate population rate wells
0
50
100
150
200
250
300
350
400
0
50
100
150
200
250
300
350
2003 2004 2005 2006 2007 2008 2009 2010
We
lls D
rille
d
Ave
rage
Dai
ly P
op
ula
tio
n p
er
10
0,0
00
Re
sid
en
ts
Figure 57. Rate of County Jail Populations by Marcellus Wells, Lycoming County 2003-2010
inmate population rate wells
0
50
100
150
200
250
300
350
400
0
50
100
150
200
250
300
350
2003 2004 2005 2006 2007 2008 2009 2010
We
lls D
rille
d
Ave
rage
Dai
ly P
op
ula
tio
n p
er
10
0,0
00
Re
sid
en
ts
Figure 58. Rate of County Jail Population by Marcellus Wells, Greene County 2003-2010
inmate population rate wells
0
50
100
150
200
250
300
350
400
0
50
100
150
200
250
300
350
2003 2004 2005 2006 2007 2008 2009 2010
We
lls D
rille
d
Ave
rage
Dai
ly P
op
ula
tio
n p
er
10
0,0
00
Re
sid
en
ts
Figure 59. Rate of County Jail Population by Marcellus Wells, Washington County 2003-
2010
inmate population rate wells
5Act 81 (passed in 2008 but not effective until November 2011) changed these guidelines such that offenders sentenced to more than 2 years
are to be committed to state prison (with some exceptions) (Zajac and Kowalski, 2012b:5). This regulatory change does not affect the analysis
presented here, as the last year of data is 2010. Future analyses will need to contend with the implications of Act 81 for understanding changes
in county jail populations.
Source: Pennsylvania Department of Environmental Protection; Pennsylvania Commission on Crime and Delinquency.
The Center for Rural Pennsylvania Page | 51
Table 11. Average Annual Rates (per 100,000 Residents) of Average Daily Inmate Populations for County Jails by County, Region, State, and Typology Categories Before and During Marcellus Shale Well Development
Average Annual Rates for Average Daily Inmate Population (per 100,000 residents)
2001-2007 2008-2010
Pennsylvania Counties 236.2 245.5
Northern Tier* 252.7 263.1 Bradford County 215.0 227.6 Lycoming County 287.7 286.3
Southwest Region* 195.6 192.8 Greene County 263.8 237.1 Washington County 167.4 192.2
Typology No Marcellus 264.5 263.9 Urban Marcellus 242.1 232.8 2nd Tier 212.8 235.2 Core, Low Activity 232.4 257.6 Core, High Activity 207.9 208.4 * County average, includes study counties. The northern tier region consists of 12 counties: Bradford, Lycoming, and the 10 neighboring counties of Clinton, Columbia, Montour, Northumberland, Potter, Sullivan, Susquehanna, Tioga, Union, and Wyoming. The southwest region consists of six counties: Greene, Washington, and the four neighboring counties of Allegheny, Beaver, Fayette, and Westmoreland. Data source: Pennsylvania Commission on Crime and Delinquency.
The average daily population rate in the Bradford County jail was at the lowest levels of the decade in 2006, with 174.5 inmates per 100,000 residents (Figure 56). The rate rose in the early years of well development, 2007 and 2008 (211.0 and 230.3 inmates per 100,000 residents, respectively), then declined slightly in 2009 and 2010 (227.4 and 225.2 inmates per 100,000 residents, respectively). The average annual rate of the county jail population was higher during the years of well development (227.6 inmates per 100,000 residents in 2008-2010) as compared to previous years (215.0 inmates per 100,000 residents in 2003-2007) (Table 11).
The average daily population rate in Lycoming County’s jail declined from 2003 to 2005, then gradually increased (Figure 57). The rate in 2005 was 267.1 inmates per 100,000 residents, then rose gradually to 291.4 inmates per 100,000 residents in 2008. The rate gradually decreased in 2009 and 2010. The average annual rates between the two periods is generally the same, an average of 287.7 inmates per 100,000 residents over the 2003-2007 period and 286.3 inmates per 100,000 residents over the 2008-2010 period (Table 11).
The average daily population rate of inmates in the county jail in Greene County declined from a high of 279.1 inmates per 100,000 residents in 2004 to 208.9 inmates per 100,000 residents in 2009 (Figure 58). The rate then increased to 253.3 inmates per 100,000 residents in 2010. The average annual rate during the years prior to well development (2003-2007) was lower (263.8 inmates per 100,000 residents) than during active well development (average annual rate of 237.1 inmates per 100,000 residents over the 2008-2010 period) (Table 11).
The Center for Rural Pennsylvania Page | 52
The average daily population rate in Washington County jail increased from 2003 to 2005, dipped in 2006 then climbed again through 2008, and declined gradually in 2009 and 2010 (Figure 59). The rate in 2006, when well development began to pick up in Washington County, was 149.1 inmates per 100,000 residents, and rose to 249.1 inmates per 100,000 residents in 2008. The rate decreased slightly to 188.6 inmates per 100,000 residents in 2010. The average annual rate for 2003-2007 was 167.4 inmates per 100,000 residents as compared to 192.2 inmates per 100,000 residents on average for 2008-2010 (Table 11).
The average daily population rate for county jails in the northern tier showed a slight increase from 2006 through 2008, then a decline in 2009 and 2010 (Figure 60). The average annual rate for all counties in the northern tier during the years of well development (2008-2010) was 263.1 inmates per 100,000 residents, as compared to a rate of 252.7 over the years prior to well development (2003-2007) (Table 11). The rates for both Bradford and Lycoming counties, though more variable in the early part of the decade, experienced increased rates 2006-2008 (though larger than the counties in the region) and decreased rates 2009-2010 similar to the counties in the region.
The Center for Rural Pennsylvania Page | 53
0
50
100
150
200
250
300
350
2003 2004 2005 2006 2007 2008 2009 2010
Ave
rage
Dai
ly P
op
ula
tio
n p
er
10
00
Re
sid
en
tsFigure 60. Rate of County Jail Populations,
Northern Tier, 2003-2010
Bradford Lycoming Northern Tier all Pennsylvania counties
0
50
100
150
200
250
300
350
2003 2004 2005 2006 2007 2008 2009 2010
Ave
rage
Dai
ly P
op
ula
tio
n p
er
10
00
Re
sid
en
ts
Figure 61. Rate of County Jail Populations, Southwest Region, 2003-2010
Greene Washington Southwest all Pennsylvania counties
The average daily population rate for county jails in the southwest region held relatively steady across the study period, with a very slight decrease during 2007-2009 followed by a slight increase in 2010
Source: Pennsylvania Commission on Crime and Delinquency.
The Center for Rural Pennsylvania Page | 54
(Figure 61). The average annual rate was slightly lower in the period with active well development than prior years; the average annual rate was 195.6 inmates per 100,000 residents for the 2003-2007 period and 192.8 for the 2008-2010 period (Table 11). Greene County, in contrast, experienced a declining rate of the county jail population until an uptick in 2010. Washington County also did not follow the regional trend, as it experienced an increase in the rates from 2006 through 2008 followed by a slight decline.
0
50
100
150
200
250
300
350
2003 2004 2005 2006 2007 2008 2009 2010
Ave
rage
Dai
ly P
op
ula
tio
n p
er
10
00
Re
sid
en
ts
Figure 62. Rate of County Jail Populations by Marcellus County Typology, 2003-2010
Core/High Activity
Core/Low Activity
2nd Tier
Urban Marcellus
No Marcellus
Comparing the county jail population rates across categories of the Marcellus typology does not suggest a relationship between Marcellus Shale well development and changes in the sizes of inmate populations. Counties in the Core, High Activity category experienced a slight decrease in 2007 and 2008 followed by a slight increase in 2010. Counties in the Core, Low Activity category had increasing rates throughout the study period. Counties in the 2nd Tier category also were generally increasing throughout the study period, although they were more variable. Counties in the Urban Marcellus category increased in the early years, peaking in 2006, then generally decreased through 2010. Counties in the No Marcellus category were steady in 2007 and 2008 then declined in 2009 and 2010. The only categories showing an increased average annual rate during the years of active well development as compared to prior years were the 2nd Tier and Core, Low Activity categories (Table 11).
Summary:
The analysis of the rates of annual county jail populations does not clearly suggest a link between Marcellus Shale well development and incarcerations. The rates in Bradford County were higher during the early years of well development (2007 and 2008). Lycoming County also experienced increases in the county jail inmate population rates, but this trend began prior to well development. It is important to note, however, that counties in the northern tier region also experienced an increase in county jail inmate populations during the same time period. A limitation of this analysis is that some of these same counties also experienced Marcellus Shale well development, so it is difficult to clearly identify Marcellus Shale development as the cause of increased county jail population rates.
Source: Pennsylvania Commission on Crime and Delinquency.
The Center for Rural Pennsylvania Page | 55
It is difficult to interpret the trend in Greene County, which was declining until a significant increase in 2010. It is unclear if the increase in 2010 was related to well development, as counties in the southwest region also experienced a slight increase that year. Washington County experienced an increase in the early years of well development, which was in contrast to the region. However, like Lycoming County, there was a general trend toward increasing rates of the county jail inmates in prior years.
The typology analysis does not suggest that counties with the most well activity experienced increases in the county jail inmate population rates during years of active well development.
Conclusion
The analyses described in this report examine indicators of criminal activity in multiple stages of the criminal justice system, including emergency response, law enforcement, prosecution, adjudication, and corrections. It does not, however, use data that can establish a causal link between Marcellus Shale activity and crime. The mechanisms by which the presence of the natural gas industry could lead to increased criminal activity are unclear. Research from other places experiencing natural resource development has indicated several potential mechanisms, but the reseach described here could not directly assess these. For example, some research does indicate that those employed in the oil and mining industries are more likely to engage in risky behaviors (e.g., alcohol, drug abuse, etc.) that can lead to criminal actions (Parkins and Angell, 2010; Lockie et al., 2009). However, there are no data to assess this claim for Pennsylvania; only minimal information about offenders is systematically recorded until the sentencing phase of the system. Defining a link to the natural gas industry is also complicated. An offender may have come to the area because they are employed in the industry, because they are a family member of someone employed in the industry, or because they are looking for work in the industry. An offender may also be someone who has lived in the area previously but gained employment in the industry. Consequently, defining the link to the industry is complex.
Further, other studies suggest that increased crime rates are due to other factors. For example, some studies suggest that fear of crime is enhanced during rapid community change, which might lead to greater likelihood that crimes will be reported to law enforcement (Freudenburg and Jones, 1991; Krannich, Greider and Little, 1985). Particularly in rural areas, changes to the local population can also lead residents and law enforcement officials to charge someone with a crime rather than seek to work out the situation informally. Law enforcement agencies experiencing increased demand for their services may adapt to changing crime patterns by shifting resources (Ruddell 2011), which can lead to more frequent reporting of certain types of crime. Another issue is that changes in crime rates in counties with low populations (such as Greene and Bradford in this analysis) can appear artificially large compared to counties with higher populations. In addition, changes in deployment strategies can affect arrest rates, such as those efforts that target specific offenses (e.g., DUI roadblocks, drug task forces).
Finally, other developments that occurred during the decade that were examined in this study also may have played a role in any changing trends in crime, particularly the economic recession that coincided with the rapid increase in wells. In addition, a casino was built in Washington County between 2007 and 2009, and casinos have been linked to increased criminal activity in many of the same ways as natural resource development (Stokowski, 1996).
Several limitations of the data analysis need to be acknowledged. This analysis examined rates. Although rates allow comparisons across places with differing populations and across time, they do not indicate absolute impacts on agencies and systems. For example, the number of arrests may be higher between two points in time, but the rate may not change because the population changed at the same pace. However, the increase in the actual number of arrests does require additional resources to manage. Since population changes in Pennsylvania counties seem linked to larger population trends and not
The Center for Rural Pennsylvania Page | 56
Marcellus Shale (see the Marcellus Impacts Project Report #1), changes in the absolute number of arrests (or other indicators of criminal activity) cannot be directly attributed to Marcellus Shale development.
This research examined the most recent data available. In many cases, the data series end in 2010, a time when Marcellus Shale activity was just beginning to dramatically increase in many counties in Pennsylvania. This poses multiple challenges. First, it is difficult to identify trends or to understand averages using only 3 years of data during well develoment, as was attempted in the analyses above. Second, a few data sets indicate increases in 2010, but it is difficult to understand the meaning of those increases without subsequent years’ data. Third, for some components of the criminal justice system, there could be a lag in the impacts of Marcellus Shale development, particularly for the courts and prisons. Analyses using more recent data will potentially alleviate these problems.
This research also attempted to compare four case study counties to their respective regions. As a whole, these regions – both the case study counties and many of the adjacent counties – were also experiencing Marcellus Shale development. Therefore, comparisons of study counties to their respective regions may not bear evidence of differences or similarities, but rather provide context.
There are other data sources that might be examined in the future, many of them available from the Bureau of Justice Statistics. However, they were not included here because they either were not avialable for the units of interest (counties in the Marcellus region) or covered insufficient time periods to allow a before-after comparison. Future analyses will revisit these data sources to see if additional data collection has occurred. One important data set not included here is the National Crime Victimization Survey (NCVS), which collects data from a representative sample of households and calculates the likelihood of victimization for a number of crimes across different segments of the population. The NCVS provides an indication of the degree of under-reporting of crimes, especially when used in concert with the Uniform Crime Reporting System (which are only reported crimes). As a national sample, the NCVS does not provide an appropriate comparsion at the county level.
Future research needs to more adequately examine the potential associations described here, including understanding the backgrounds of offenders. There must also be research conducted on those agencies (such as the Pennsylvania State Police, local police, criminal courts, and magisterial courts) that could be particularly affected by the activity described in this report. Of partiuclar interest will be identifying changes within these agencies, such as new personnel or procedures, that might influence the rates noted in this analysis. Further, there needs to be a better understanding of how the agencies within the criminal justice system have managed to adapt to and address changes, if any, to the frequency and/or types of crimes occurring in their jurisdictions.
The Center for Rural Pennsylvania Page | 57
Acknowledgements
Report authors: Kathryn Brasier, associate professor of Rural Sociology and Danielle Rhubart, graduate assistant in Rural Sociology and Demography, Pennsylvania State Universtiy.
The Marcellus Shale Impacts Study Project Team Kathryn J. Brasier, Associate Professor of Rural Sociology Lisa A. Davis, Director of the Pennsylvania Office of Rural Health and Outreach Associate Professor of Health Policy and Administration Leland Glenna, Associate Professor of Rural Sociology Timothy W. Kelsey, Professor of Agricultural Economics and Co-Director of Penn State’s Center for Economic and Community Development Diane K. McLaughlin, Professor of Rural Sociology and Demography Kai A. Schafft, Associate Professor of Education and Director of Penn State Center on Rural Education and Communities Kristin Babbie, Graduate Assistant in Rural Sociology Catharine Biddle, Graduate Assistant in Educational Leadership Anne DeLessio-Parson, Graduate Assistant in Rural Sociology Danielle Rhubart, Graduate Assistant in Rural Sociology and Demography Namrata Uberoi, Ph.D. candidate in Health Policy and Administration
The project team gratefully acknowledges support from the following: the Department of Agricultural Economics, Sociology and Education in the College of Agricultural Sciences at Penn State; the Pennsylvania Office of Rural Health; the Department of Education Policy Studies in the College of Education at Penn State; The Pennsylvania State Univeristy Children, Youth, & Families Consortium; and the Penn State Institutes for Energy and the Environment. We also thank Penn State’s Survey Research Center for their assistance with the focus groups. Several individuals contributed to the project through background research, data collection and analysis, including Matthew Filteau, Mark Leach, Kylie Davis, Kirsten Hardy, and Kaitlyn Chajkowski. We appreciate their hard work.
We gratefully acknowledge the members of our advisory committees who provided us with important insights at key points in the project and gave us access to data sets. We also thank the community members and county commissioners who shared their experiences through focus groups and interviews. We greatly appreciate their time, assistance, and insights.
Finally, we thank two reviewers for providing feedback on this report prior to its release. The authors maintain responsibility for any errors.
The Center for Rural Pennsylvania Page | 58
References
Bureau of Justice Statistics. N.d. Criminal Justice System Flowchart. URL: http://bjs.ojp.usdoj.gov/content/largechart.cfm, accessed January 16, 2013.
Criminal Justice Information Services Division, 2013. National Incident-Based Reporting System (NIBRS) User Manual. US Department of Justice, Federal Bureau of Investigation. URL:http://www.fbi.gov/about-us/cjis/ucr/additional-ucr-publications/ucr_handbook.pdf. Accessed June 3, 2013.
Dell, Ben P., Noam Lockshin, and Scott Gruber. 2008. “Bernstein E&Ps: Where Is the Core of the Marcellus?” Report published by Sanford C. Bernstein & Co., LLC, a subsidiary of AllianceBernstein L.P. New York, NY.
DEP Office of Oil and Gas Management: Wells Drilled by County. Pennsylvania Department of Environmental Protection. http://www.depreportingservices.state.pa.us/. Accessed October 6, 2010.
Freudenburg, William R., and Robert Emmett ]ones. 1991. “Criminal Behavior and Rapid Community Growth: Examining the Evidence.” Rural Sociology 56(4);619-645.
Harper, John A. 2008. “The Marcellus Shale – An Old “New” Gas Reservoir in Pennsylvania.” Pennsylvania Geology 38:2-13.
Klinger, David A., and George S. Bridges. 1997. “Measurement error in calls-for-service as an indicator of crime.” Criminology 35(4):705-726.
Kowalski, Lindsay, and Gary Zajac. 2012. A Preliminary Examination of Marcellus Shale Drilling Activity and Crime Trends in Pennsylvania. Justice Center for Research, Pennsylvania State University.URL: http://justicecenter.psu.edu/research/documents/MarcellusFinalReport.pdf. Accessed July 11, 2013.
Krannich, R. S., T. Greider, and R. L. Little. 1985. "Rapid Growth and Fear of Crime: A Four-Community Comparison." Rural Sociology 50 (2): 193-209.
Lockie, S., M. Franettovich, V. Petkova-Timmer, J. Rolfe, and G. Ivanova. “Coal Mining and the Resource Community Cycle: a Longitudinal Assessment of the Social Impacts of the Coppabella Coal Mine.” Environmental Impact Assessment Review 29, no. 5 (2009): 330–339.
McLaughlin, Diane K., Molly A. Martin, April L. Gunsallus, Kathy Brasier and Kelly D. Davis. 2012. “Does Marcellus Shale Natural Gas Extraction Contribute to Increasing Inequality Among Pennsylvania’s Families and Communities?” Paper presented at the Annual Meeting of the Rural Sociological Society, Chicago, Il., August.
Parkins, J. R, and A. C Angell.“Linking Social Structure, Fragmentation, and Substance Abuse in a Resource-based Community.” Community, Work & Family 14, no. 1 (2010): 39–55.
Pennsylvania Commission on Crime and Delinquency.2010. County Jail Population. URL: http://www.portal.state.pa.us/portal/server.pt?open=512&objID=5403&&PageID=505946&level=3&css=L3&mode=2. Accessed July 19, 2013.
Pennsylvania Sentencing Commission. Pennsylvania Sentencing Data [2001-2010]. Pennsylvania Sentencing Commission. University Park, Pa.: Population Research Institute, Penn State.
Ruddell, Rick. 2011. “Boomtown Policing: Responding to the Dark Side of Resource Development.” Policing 5 (4): 328- 342.
Snyder, Howard N. 2012. Arrest in the United States, 1990-2010. U.S. Department of Justice, Office of Justice Programs, Bureau of Justice Statistics. NCJ 239423. URL: http://www.bjs.gov/index.cfm?ty=pbdetail&iid=4515. Accessed January 17, 2013.
Social Explorer Tables: Census 2000 (SE), Social Explorer; U.S. Census Bureau. http://www.socialexplorer.com/ Accessed 12 July 2013.
Stokowski, Patricia A. 1996. “Crime Patterns and Gaming Development in Rural Colorado.” Journal of Travel Research. 34:63-69.
US Census Bureau. Table 1.Intercensal Estimates of the Resident Population for Counties of Pennsylvania: April 1, 2000 to July 1, 2010 (CO-EST00INT-01-42). Source: US Census Bureau, Population Division.
United States Department of Justice. Federal Bureau of Investigation. Uniform Crime Reporting Program Data [United States]: County-Level Detailed Arrest and Offense Data, 2008. ICPSR27644-v1. Ann Arbor, MI: Inter-university Consortium for Political and Social Research [distributor], 2011-04-21. doi:10.3886/ICPSR27644.v1
United States Department of Justice. Office of Justice Programs. Bureau of Justice Statistics. Census of State and Local Law Enforcement Agencies (CSLLEA), 2008. ICPSR27681-v1. Ann Arbor, MI: Inter-university Consortium for Political and Social Research [distributor], 2011-08-03. doi:10.3886/ICPSR27681.v1
Wrightstone, G. (2008). Marcellus Shale Geologic Controls on Production. Texas Keystone Incorporated. http://www.papgrocks.org/wrightstone_p.pdf. Accessed 8 Oct 2012.
Zajac, Gary, and Lindsay Kowalski. 2012a. An Examination of Pennsylvania State Police Coverage of Municipalities. Justice Center for Research, Pennsylvania State University. http://justicecenter.psu.edu/research/documents/PSPFinalReportJusticeCenterversion.pdf. Accessed July 11, 2013.
Zajac, Gary, and Lindsay Kowalski. 2012b. An Examination of Pennsylvania Rural County Jails. Center for Rural Pennsylvania. http://www.rural.palegislature.us/documents/reports/rural_county_jails_2012.pdf. Accessed July 19, 2013.
bNote this category includes all four study counties.
cThese counties are excluded from those analyses that use American Community Survey (ACS) three-year
estimates, as their populations are too small to be estimated.
*For more on maps, see the Penn State University Marcellus Center for Outreach and Research (http://marcellus.psu.edu) and Dell, Lockshin, and Guber (2008).
The Center for Rural Pennsylvania Page | 62
Appendix C: Criminal Justice System Flowchart
(Source: Bureau of Justice Statistics)
The Center for Rural Pennsylvania Page | 63
Appendix D: Definitions The following are definitions of offenses used in the Uniform Crime Reporting Program:
Part I Offenses (Adapted from Criminal Justice Information Services 2013) Label Definition Criminal Murder: Murder and Nonnegligent Manslaughter: The willful (nonnegligent) killing of one human
being by another. Manslaughter by Negligence: The killing of another person through gross negligence.
Forcible Rape:
Rape by force: The carnal knowledge of a female forcibly and against her will. By definition, sexual attacks on males are excluded from the rape category and must be classified as assaults or other sex offenses depending on the nature of the crime and the extent of injury. Attempts to commit forcible rape
Robbery: The taking or attempting to take anything of value from the care, custody, or control of a person or persons by force or threat of force or violence and/or by putting the victim in fear. Robbery involves a theft or larceny but is aggravated by the element of force or threat of force (through use of a firearm, knife or cutting instrument, other dangerous weapon, or hands, fists, feet, etc.)
Aggravated Assault:
An unlawful attack by one person upon another for the purpose of inflicting severe or aggravated bodily injury. This type of assault usually is accompanied by the use of a weapon or by means likely to produce death or great bodily harm.
Burglary: The unlawful entry of a structure to commit a felony or a theft.
Larceny-theft: The unlawful taking, carrying, lending, or riding away of property from the possession or constructive possession of another.
Motor Vehicle Theft:
The theft or attempted theft of a motor vehicle.
Arson: Any willful or malicious burning or attempt to burn, with or without intent to defraud, a dwelling house, public building, motor vehicle or aircraft, personal property of another, etc.
Part II Offenses (Quoted from: http://www.fbi.gov/about-us/cjis/ucr/additional-ucr-publications/ucr_handbook.pdf):
Label Definition Curfew and Loitering Laws
(Persons under 18) - Violations by juveniles of local curfew or loitering ordinances.
Drug Abuse Violations:
The violation of laws prohibiting the production, distribution, and/or use of certain controlled substances and the equipment or devices utilized in their preparation and/or use. The unlawful cultivation, manufacture, distribution, sale, purchase, use, possession, transportation, or importation of any controlled drug or narcotic substance. Arrests for violations of state and local laws, specifically those relating to the unlawful possession, sale, use, growing, manufacturing, and making of narcotic drugs.
possession or use sale or manufacture
Disorderly Conduct:
Any behavior that tends to disturb the public peace or decorum, scandalize the community, or shock the public sense of morality.
Driving Under the Influence:
Driving or operating a motor vehicle or common carrier while mentally or physically impaired as the result of consuming an alcoholic beverage or using a drug or narcotic.
Drunkenness: To drink alcoholic beverages to the extent that one’s mental faculties and physical coordination are substantially impaired. Exclude driving under the influence.
Embezzlement: The unlawful misappropriation or misapplication by an offender to his/her own use or purpose of money, property, or some other thing of value entrusted to his/her care, custody, or control.
The Center for Rural Pennsylvania Page | 64
Forgery and Counterfeiting:
The altering, copying, or imitating of something without authority or right, with the intent to deceive or defraud by passing the copy or thing altered or imitated as that which is original or genuine; or the selling, buying, or possession of an altered, copied, or imitated thing with the intent to deceive or defraud.
Fraud:
The intentional perversion of the truth for the purpose of inducing another person or other entity in reliance upon it to part with something of value or to surrender a legal right. Fraudulent conversion and obtaining of money or property by false pretenses.
Gambling To unlawfully bet or wager money or something else of value; assist, promote, or operate a game of chance for money or some other stake; possess or transmit wagering information; manufacture, sell, purchase, possess, or transport gambling equipment, devices or goods; or tamper with the outcome of a sporting event or contest to gain a gambling advantage.
Liquor Laws The violation of state or local laws or ordinances prohibiting the manufacture, sale, purchase, transportation, possession, or use of alcoholic beverages, not including driving under the influence and drunkeness.
Offenses Against the Family and Children
Unlawful nonviolent acts by a family member (or legal guardian) which threaten the physical, mental, or economic well-being or morals of another family member and which are not classifiable as other offenses, such as Assault or Sex Offenses.
Prostitution and Commercialized Vice
The unlawful promotion of or participation in sexual activities for profit.
Runaways (Persons under 18) - Limited to juveniles taken into protective custody under the provisions of local statutes.
Sex Offenses Offenses against chastity, common decency, morals, and the like.
Stolen Property Buying, Receiving, Possessing - Buying, receiving, possessing, selling, concealing, or transporting any property with the knowledge that it has been unlawfully taken, as by burglary, embezzlement, fraud, larceny, robbery, etc.
Suspicion Arrested for no specific offense and released without formal charges being placed.
Vagrancy The violation of a court order, regulation, ordinance, or law requiring the withdrawal of persons from the streets or other specified areas; prohibiting persons from remaining in an area or place in an idle or aimless manner; or prohibiting persons from going from place to place without visible means of support.
Vandalism To willfully or maliciously destroy, injure, disfigure, or deface any public or private property, real or personal, without the consent of the owner or person having custody or control by cutting, tearing, breaking, marking, painting, drawing, covering with filth, or any other such means as may be specified by local law.
Weapons Carrying, Possessing, etc. - The violation of laws or ordinances prohibiting the manufacture, sale, purchase, transportation, possession, concealment, or use of firearms, cutting instruments, explosives, incendiary devices, or other deadly weapons.
The Center for Rural Pennsylvania Page | 65
The Center for Rural Pennsylvania Board of Directors
Chairman Senator Gene Yaw
Vice Chairman
Senator John Wozniak
Treasurer Representative Garth D. Everett
Secretary
Dr. Nancy Falvo Clarion University
Representative Rick Mirabito
Dr. Livingston Alexander University of Pittsburgh
Dr. Theodore R. Alter
Pennsylvania State University
Stephen M. Brame Governor’s Representative
Taylor A. Doebler III
Governor’s Representative
Dr. Stephan J. Goetz Northeast Regional Center for Rural Development
Dr. Karen M. Whitney
Clarion University
The Center for Rural Pennsylvania, 625 Forster St., Room 902, Harrisburg, PA 17120 (717) 787-9555 www.rural.palegislature.us