97


• Request for Proposals
– Lotto and Video Lottery Central Gaming Systems
• FY17 Audit
– No audit findings
• Commissioners Dykstra and Faehn

BRAND PERCEPTION STUDY
December 2017
CONFIDENTIAL. © LAWRENCE & SCHILLER. ALL RIGHTS RESERVED

AGENDA
GOOD FUN CAMPAIGN
5
2017 BRAND PERCEPTION STUDY
PERCEPTIONS
LOTTERY REVENUE
PLAYING HABITS
DISCUSSION

• Goal: Move the audience past their indifference to the lottery and:
- View the Lottery in positive light
- Consider it an entertainment option
• Focus: Gaming is entertainment with a bigger purpose in mind – improving
South Dakota.
GOOD FUN CAMPAIGN OBJECTIVES
6

4
7

FUN AND GOOD FOR SOUTH DAKOTA
8

2017 BRAND
9
PERCEPTION STUDY

2017 RESEARCH GOALS
1. Understand SD residents’ perceptions of the South Dakota Lottery and
its’ family of games.
2. Gain an understanding as to whether the perceptions of the South Dakota
Lottery have changed since 2015 and if so, how they have changed.
3. Identify ways to move the South Dakota Lottery brand forward in the
future.
1
0
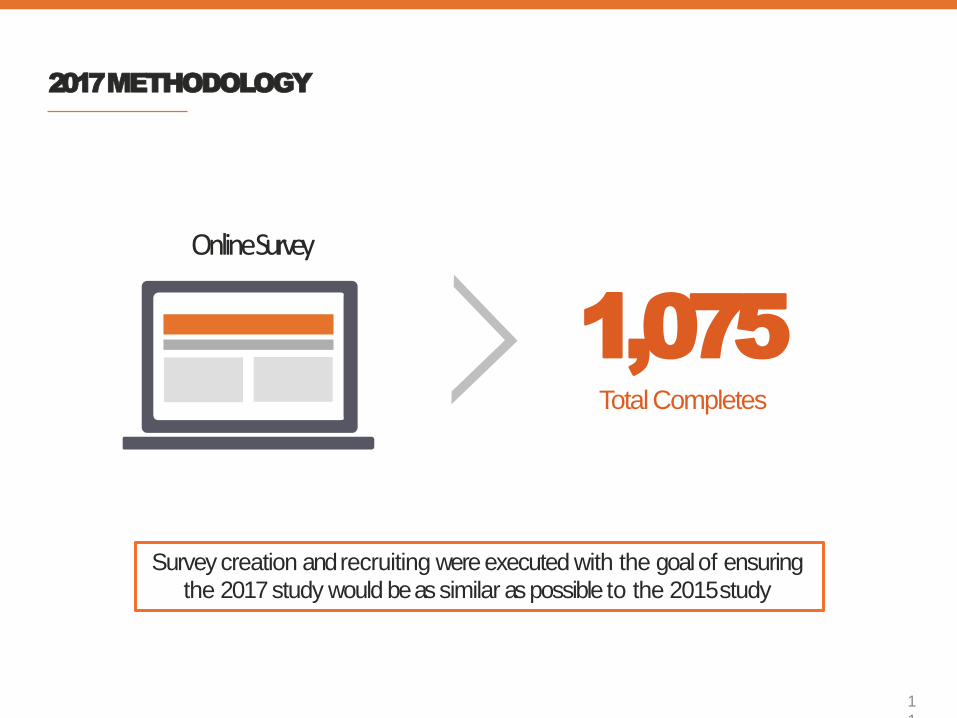
2017 METHODOLOGY
Online Survey
1,075
1
1
Total Completes
Survey creation and recruiting were executed with the goal of ensuring the 2017 study would be as similar as possible to the 2015 study

2015 v. 2017 RESPONDENTS BY GEOGRAPHY
The studies have very similar geographic distributions
1%
9%
11% 8%
24%
5%
21%
2015: 22%
2015: 1% 2015: 7%
2015: 10% 2015: 9%
2015: 7%
2015: 23%
1
2
21%
2015: 23%
*unweighted values

2017 v. 2015 DEMOGRAPHICS
12% 13%
8% 10%
3% 3%
10% 9%
HOUSEHOLD INCOME
35%36%
31% 29%
2017 2015
40% 60%
*unweighted values
10
2017
44% 56% 2015

2017 v. 2015 DEMOGRAPHICS
*unweighted values
2017 AGE BREAKDOWN
21-35 16%
36-45 18%
46-55 24%
56+ 42%
2015 AGE BREAKDOWN
21-35 27%
36-45 16%
46-55 20%
56+ 37%
2017 PLAYERS CLUB
MEMBERSHIP
70
%
YES
30
%
NO
2015 PLAYERS CLUB
MEMBERSHIP
57
%
YES
43
%
NO
11

WEIGHTING
Random Iterative Method
RIM weighting provides an even distribution of survey
results across an entire dataset, while balancing certain
categories, such as age or gender, to pre-determined totals
(in this case the sample characteristics of the 2015 study).
BY WEIGHTING THE 2017 SAMPLE DATA
WE CAN ENSURE THAT THE TWO
DATASETS CAN BE ACCURATELY
COMPARED
15

PERCEPTIONS
16
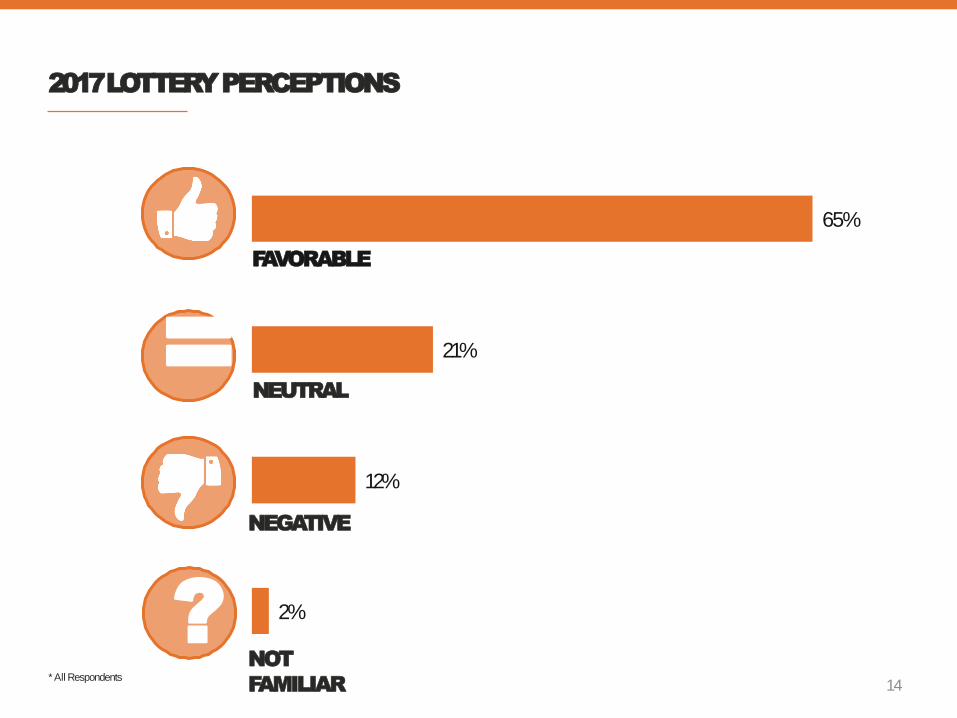
21%
2%
2017 LOTTERY PERCEPTIONS
12%
NEGATIVE
NEUTRAL
14
NOT
FAMILIAR
=
?
65%
FAVORABLE
* All Respondents

2015 v. 2017 PERCEPTIONS COMPARISON
15
=
?
45%
9%
9%
37%
65%
21%
12%
2%
2015 2017
NEGATIVE
NEUTRAL
NOT
FAMILIAR
FAVORABLE
* All Respondents

16
18%
11%
1%
70%
58%
25%
13%
4%
Players Club Non-Players Club
NEGATIVE
NEUTRAL
NOT
FAMILIAR
FAVORABLE
2017 LOTTERY PERCEPTIONS
=
?
* Players Club v. Non-Players Club Responses

51%
64%
34%
25%
9% 7%
10% 1%
Favorable Neutral Unfavorable Not familiar
21%
17%
41% 14% 29%
35%
2017
2015
2017
2015
2017 v. 2015 PERCEPTIONS OF THE PLAYERS CLUB PROGRAM
Non-Players Club
41% 7%
Players Club
2017
2015
20
2017
2015

53%
62%
31%
21%
9%
12%
7%
5%
Favorable Neutral Unfavorable Not familiar
2017 v. 2015 PLAY IT AGAIN PROGRAM PERCEPTIONS
21%
26%
31%
32%
20172017
20152015
2017
2015
* All Respondents
Non-Players Club
34% 8%
35% 12%
Players Club
2017
2015
21
2017
2015
Scratch Lotto Video

2017 v. 2015 SCRATCH TICKETS PERCEPTIONS
49%
53%
33%
29%
13%
14%
4%
3%
59% 31%
68% 18% 13%
8% 2%
1%
2017
2015
2017
2015
* All Respondents
Favorable Neutral Unfavorable Not familiar
2017
2015
Non-Players Club
Players Club
Non-Players Club
Players Club
2017
2015
23
2017
2015

2017 v. 2015 LOTTO GAMES PERCEPTIONS
50%
57%
33%
25%
13%
13%
3%
4%
61% 30% 7%
70% 17% 11%
2%
1%
2017
2015
LOTTO
GAMES
2017
2015
* All Respondents
Favorable Neutral Unfavorable Not familiar
2017
2015
Non-Players Club
Players Club
Non-Players Club
Players Club
2017
2015
24
2017
2015

2017 v. 2015 VIDEO LOTTERY PERCEPTIONS
32%
37%
36%
29%
26%
29%
6%
6%
34%
39%
38%
33%
22%
26%
6%
2%
2017
2015
VIDEO
2017
LOTTERY 2015
* All Respondents
Favorable Neutral Unfavorable Not familiar
2017
2015
Non-Players Club
Players Club
Non-Players Club
Players Club
2017
2015
25
2017
2015
2017 LOTTERY PERCEPTIONS
The overall
perception of the
South Dakota
Lottery is far more
favorable in 2017
26

DETERMINING THE EFFECT OF THE GOOD FUN CAMPAIGN
=
IS THE GOOD FUN MESSAGING WORKING?
27

PEOPLE REMEMBER LOTTERY ADS
Do you recall seeing or hearing advertising messaging from
the South Dakota Lottery within the last year?
YES 84%
* All Respondents 28

PEOPLE REMEMBER LOTTERY ADS
Do you recall seeing or hearing advertising messaging from
the South Dakota Lottery within the last year? (Those who answered “Yes”)
90%
76%
* Players Club v. Non-Players Club Responses 29
Player
s Club
Non-
Players
Club
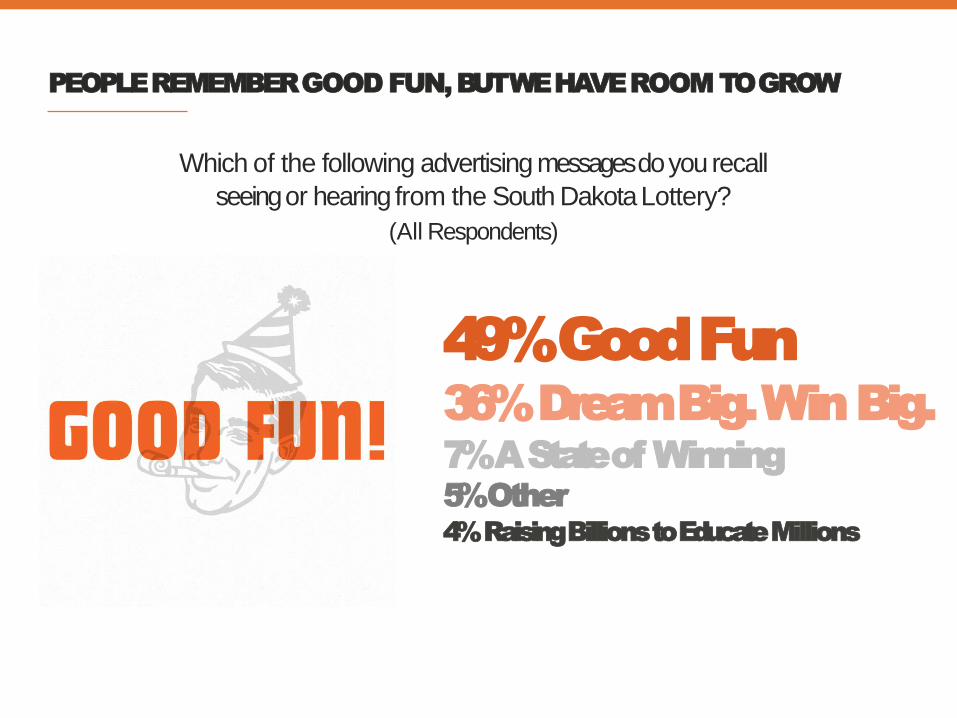
49% Good Fun
36% Dream Big. Win Big.
7% A State of Winning
5% Other
4% Raising Billions to Educate Millions
PEOPLE REMEMBER GOOD FUN, BUT WE HAVE ROOM TO GROW
Which of the following advertising messages do you recall
seeing or hearing from the South Dakota Lottery?
(All Respondents)

LOTTERY PERCEPTIONS AND GOOD FUN RECALL
28
Good Fun.
Perceptions of the Lottery 2
69%
19%
10%
Favorable Neutral Unfavorable Not Familiar
%
Participants who
recalled seeing
Good Fun ads
* All Respondents

LOTTERY REVENUE
20

SHOW THE GOOD THAT THE LOTTERY DOES
The fun of the South
Dakota Lottery
The good the South Dakota
Lottery does for the state
30

All Participants
Lapsed Players
52%
71%
2017: MORE KNOWLEDGEABLE OVERALL
“I don’t know how the South Dakota Lottery money is used”
2015 Respondents 2017 Respondents
All Participants
Lapsed Players
50%
60%
34

PLAYING HABITS
35

OVERALL LOTTERY
36
RECENCY

RECENCY
PLAYED WITHIN
THE LAST YEAR
37
8(Of Non-Pl
0ayers Club M
%embers)
- Compared to 78% in 2015

RECENCY
64%
72%
28%
36%
When Was the Last Time You Played the SD Lottery?
(Non-Players Club Members)
2015 2017
Played within the last
6 months
Has not played within
the last 6 months
38

RECENCY
When Was the Last Time You Played the SD Lottery?
(Non-Players Club Members)
2015 2017
28%
36%
64%
72%
Has not played within Played within the last
the last 6 months 6 months
8%
INCREASE IN
ACTIVE PLAYERS
39
(Non-Players Club)

PLAY FREQUENCY
40
BY GAME
SCRATCH TICKETS
41

2015 v. 2017 PLAY FREQUENCY- SCRATCH
17%
29%
46%
44%
55%
2017
10%
2015
How Often Do You Purchase Scratch Tickets?
(Non-Players Club Members)
INFREQUENT FREQUENT NEVER
42

2015 v. 2017 PLAY FREQUENCY- SCRATCH
17%
40
INCREASE IN FREQUENT SCRATCH PLAYERS
(Non-Players Club)
7%
DECREASE IN PEOPLE WHO HAVE NEVER
PURCHASED SCRATCH TICKETS
(Non-Players Club)

VIDEO LOTTERY
44
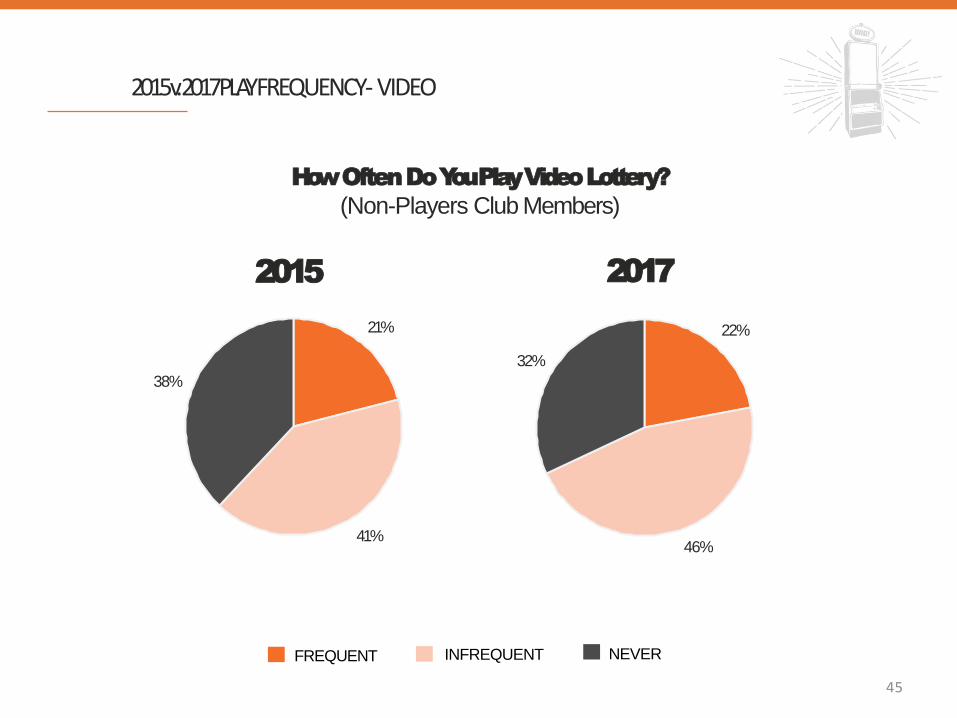
2015 v. 2017 PLAY FREQUENCY- VIDEO
22%
46%
How Often Do You Play Video Lottery?
(Non-Players Club Members)
2015 2017
21%
41%
32%
38%
INFREQUENT FREQUENT NEVER
45

2015 v. 2017 PLAY FREQUENCY- VIDEO
5%
INCREASE IN INFREQUENT VIDEO
LOTTERY PLAYERS
(Non-Players Club)
6%
DECREASE IN PEOPLE WHO HAVE
NEVER PLAYED VIDEO LOTTERY
(Non-Players Club)
46

LOTTO GAMES
47

2015 PLAY FREQUENCY- LOTTO
46%
INFREQUENT NEVER FREQUENT
48
• How Often Do You Purchase Lotto Tickets? • (Non-Players Club Members)
• 2015
• 21%
• 33%

2017 PLAY FREQUENCY- LOTTO
How Often Do You Purchase Lotto Tickets?
(Non-Players Club Members)
2017
43%
34%
29%
36%
48%
39%
47%
39%
29% 27%
9%
28%
23% 25%
44%
Powerball Hot Lotto Mega Millions Dakota Cash Lucky For Life
INFREQUENT NEVER FREQUENT
49

SALES
$800,000,000
$750,000,000
$700,000,000
$650,000,000
$600,000,000
$550,000,000 FY12 FY13 FY14 FY15 FY16 FY17
TOTAL SALES
50

SALES
TOTAL SALES
$800,000,000
$750,000,000
$700,000,000
$650,000,000
$600,000,000
$550,000,000
FY12 FY13 FY14 FY15 FY16 FY17
2%
51
INCREASE IN SALES
(FY2016 to FY2017)

INCREASING
52
PLAY

*Non-Players Club Members
80% of participants responded
yes or maybe to playing the lottery more
INCREASING PLAY
Would You Consider Playing the Lottery More?
50

INCREASING PLAY- AGE
8% 14% 18%
26%
45%
47%
57% 53%
47% 38%
25% 20%
21-35 36-45 46-55 56+
Yes
Maybe
No
54
Would You Consider Playing the Lottery More?
(All Respondents)

CONCLUSION
55

TAKEAWAYS
- Perceptions of the SD Lottery have greatly improved since the implementation of Good Fun.
- Residents have a better understanding of where the revenue from the
lottery goes in the state.
- Recency and frequency have both increased which has led to an increase in
lottery sales.
- An increasing number of people are willing to play the lottery more often
and there are many opportunities to continue to growing lottery sales.
- A large proportion of people recall Good Fun. - Consider implementing ongoing Good Fun branding campaigns to continue to
improve familiarity and perceptions.
56

DISCUSSION
57

• Two Budgets
– Instant/Online – Informational Budget
– Video Lottery
• FY19 Request
– No increases requested
• Budget Amounts
– Instant/Online - $38,405,766
– Video Lottery - $2,674,153

59

60

61
$15,000,000
$16,000,000
$17,000,000
$18,000,000
$19,000,000
$20,000,000
$21,000,000
July August September October November December January February March April May June
Ne
t R
eve
nu
e
Video Lottery Net Machine Income - 3 Year Monthly Comparison
FY2016
FY2017
FY2018

62

63
619
492
151
541
465
25
0
100
200
300
400
500
600
700
FY16 FY17 FY18 (YTD)
New & Destroyed Terminals
New Destroyed

64
Over Performing Counties Under Performing Counties Rank County % Change Rank County % Change Rank County % Change Rank County % Change
1 HAAKON 50.7% 17 EDMUNDS 11.5% 34 PERKINS 4.3% 47 LAKE -2.6%
2 HUTCHINSON 35.7% 18 GRANT 10.5% 35 WALWORTH 4.2% 48 HUGHES -3.1%
3 DOUGLAS 26.4% 19 MCCOOK 9.9% 36 MINNEHAHA 4.1% 49 BEADLE -3.2%
4 CLARK 22.4% 20 BUTTE 9.3% 37 MARSHALL 3.8% 50 TRIPP -3.7%
5 SULLY 21.5% 21 DAY 9.0% 38 CUSTER 3.4% 51 POTTER -5.9%
6 AURORA 16.8% 22 GREGORY 8.8% 39 PENNINGTON 2.4% 52 HANSON -8.0%
7 BRULE 16.8% 23 STANLEY 8.2% 40 JACKSON 1.8% 53 LYMAN -8.8%
8 CODINGTON 15.5% 24 TURNER 7.0% 41 YANKTON 1.1% 54 MINER -9.0%
9 ROBERTS 14.8% 25 UNION 6.6% 42 DAVISON 0.4% 55 JONES -9.3%
10 BENNETT 14.5% 26 LINCOLN 6.2% 43 BROWN 0.4% 56 MCPHERSON -9.9%
11 HARDING 13.7% 27 MELLETTE 6.1% 44 BON HOMME 0.2% 57 CAMPBELL -17.0%
12 JERAULD 13.3% 28 FALL RIVER 5.3% 45 BROOKINGS -0.1% 58 HAND -17.3%
13 HAMLIN 13.1% 29 SANBORN 5.2% 46 KINGSBURY -2.0% 59 HYDE -18.2%
14 CHARLES MIX 13.0% 30 CLAY 4.9% 60 FAULK -23.0%
15 MOODY 12.9% 31 SPINK 4.9%
16 LAWRENCE 12.2% 32 MEADE 4.8%
33 DEUEL 4.7%

65
N/A
Loss
No Video Lottery
Counties by Percent Loss (16)
Legend
Gain
Top 1/3 of Counties by Percent Gain (15)
Middle 1/3 of Counties by Percent Gain (14)
Bottom 1/3 of Counties by Percent Gain (15)
4.3%13.7%
1.8%
3.8%
0.4%
9.0%
-9.9%
11.5%
-23.0%
4.7%
-17.3%
13.3% 5.2
%
-2.0% -0.1%
12.9
%
16.8
% 9.9% 4.1%
6.2%7.0%35.7%
6.6%
9.3%
2.4%
12.2%
-17.0%
5.3%
3.4%
8.8%
-9.3%
14.5%
6.1%
50.7%
4.2%
-5.9%
13.0%
26.4%
0.2%1.1% 4.9
%
-3.7%
19.5%
-18.2
%
-3.2%
4.9%15.5%
22.4
%
13.1%
-3.1%
-8.8%
21.5%
8.2%
4.8%
14.8%
10.5
%
-9.0
%
-8.0%
0.4%
-2.6%
CORSON
DEWEYZEIBACH
STANLEY
JONESLYMAN
MELLETTE
TRIPP
TODD
SULLY HYDE HAND
POTTER FAULK
WALWORTH EDMUNDS
McPherson
BUFFALO
BRULE AURORA
SANBORN
GREGORY
CHARLES
MIX
BROWN MARSHALL
DAY
SPINK
CLARK CODINGTON
GRANT
BEADLE
HAMLIN
DEUEL
KINGSBURY BROOKINGS
MINER LAKE MOODY
McCOOK
HUTCHINSON TURNER
LINCOLN
CLAY
YANKTONBONHOMME
DOUGLAS
HUGHES
JERAULD
BENNETT
CAMPBELL

66
Rank City FY17 NMI FY18 NMI % of Total NMI YoY % Change YoY $$ Change
1 Sioux Falls $22,163,479 $23,118,056 25.58% 4.31% $954,577
2 Rapid City $10,658,686 $10,994,792 12.16% 3.15% $336,106
3 North Sioux City $5,078,113 $5,423,812 6.00% 6.81% $345,699
4 Aberdeen $5,090,494 $5,088,091 5.63% -0.05% -$2,403
5 Yankton $3,315,792 $3,354,978 3.71% 1.18% $39,185
6 Mitchell $2,795,467 $2,793,846 3.09% -0.06% -$1,621
7 Watertown $2,965,474 $3,417,578 3.78% 15.25% $452,104
8 Pierre $2,380,041 $2,300,991 2.55% -3.32% -$79,050
9 Huron $2,692,774 $2,622,012 2.90% -2.63% -$70,761
10 Brookings $1,881,683 $1,799,345 1.99% -4.38% -$82,337
11 Box Elder $1,034,428 $1,042,060 1.15% 0.74% $7,632
12 Vermillion $867,311 $918,075 1.02% 5.85% $50,764
13 Hot Springs $874,403 $899,600 1.00% 2.88% $25,197
14 Sturgis $811,380 $826,275 0.91% 1.84% $14,895
15 Brandon $871,444 $913,394 1.01% 4.81% $41,950
$63,480,969 $65,512,904 72.48% 3.20% $2,031,935
$23,391,162 $24,870,311 27.52% 6.32% $1,479,149
$86,872,131 $90,383,215 100.00% 4.04% $3,511,084Statewide Total
Subtotal (Top 15)
All Other Towns

4.04% ahead of FY17; Projecting $220.96 M for FY18
On course to top 2009 levels for Net Machine Income.
Since the lowest point in 2012, Video Lottery NMI has
almost completely recovered, growing over 25% in six
years.
3.8% geometric average annual growth.
67

Legacy Terminals


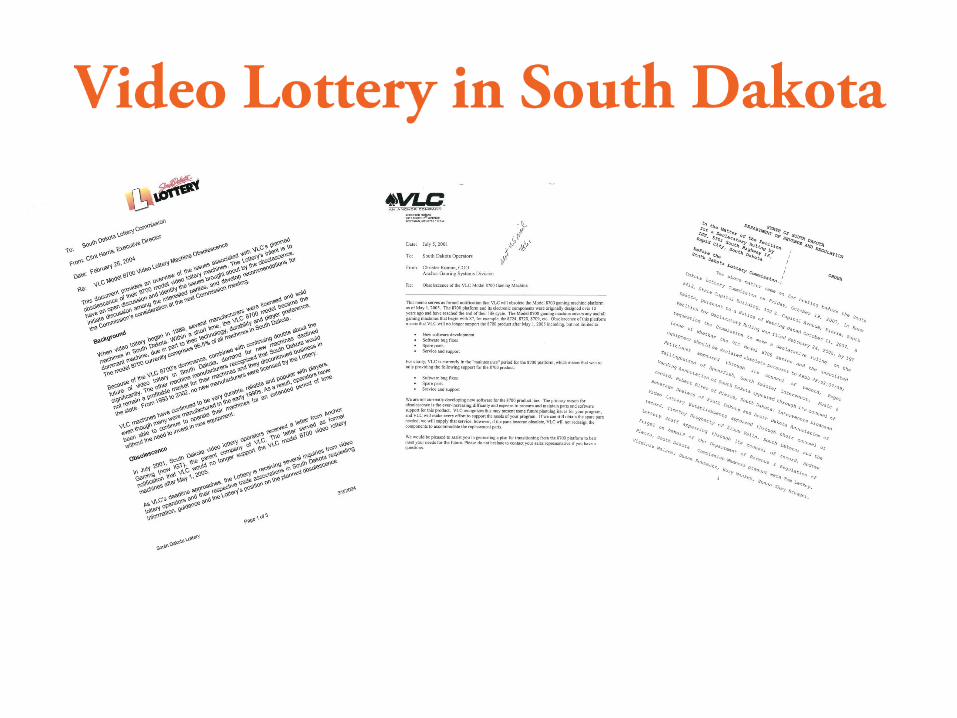
1988 Video Lottery Approved by South Dakota Legislature
1989 First VLC enrolled at Belle Fourche Lodge under Black Hills Novelty Co., Inc. (10/14/1989)
2000 Last date a new VLC was purchased and enrolled in the Video Lottery system.(May)
2001 Last software released and approved in South Dakota. (137B1 Software)
2001 IGT states they are no longer supporting VLC machines(July)

2004 Lottery Commission discusses obsolescence letter received from IGT during meeting. (March)
2007 Lottery Commission hold obsolescence hearing.
2008 Lottery Commission obsoletes VLC’s. (1-4-08)
2011 Lottery Commission approves Line Games for use in South Dakota(May)
2012 September the first line games introduced into South Dakota video lottery market.(Game Tech)
2013 Legislature approved Linear pay tables and penny denomination.
2016 New background check legislation passed.

$150
$200
$250
$300
$350
$400
$450
No
v
De
c
Jan
Feb
Mar
Ap
r
May Jun
July
FY1
7
Au
g
Sep
Oct
No
v
De
c
Jan
Feb
Mar
Ap
r
May Jun
July
FY1
8
Au
g
Sep
Oct
No
v
$50
$60
$70
$80
$90
$100
$110
$120
$130
$140
$150
Cas
h In
(M
illio
ns)
NM
I (M
illio
ns)
Cash In & NMI - Legacy vs. Line
Legacy NMI (Old Machines) Line NMI (New Machines) Legacy Cash In (Old Machines) Line Cash In (New Machines)

52.05549756
51.16049062 49.69917107
90.11734381 91.92302176
92.47837873
$40
$50
$60
$70
$80
$90
$100
No
v
De
c
Jan
Feb
Mar
Ap
r
May Jun
July
FY1
7
Au
g
Sep
Oct
No
v
De
c
Jan
Feb
Mar
Ap
r
May Jun
July
FY1
8
Au
g
Sep
Oct
No
v
NMI/Terminal/Day - Legacy vs. Line
Legacy NMI per Machine per Day (Old Machines) Line NMI per Machine per Day (New Machines)

• Top 100 Performing Machines for November
– 35 GMMS
– 62 SAS, 3 Line (Spielos with line games running on legacy protocol)

• NMI for top 100 GMMS machines: $1,007,938.60
• NMI for top 100 SAS machines: $1,219,173.23

• 70% of NMI comes from just under 30% of machines
– 1,423 SAS machines making up $7,142,494.67;
– 1,106 GMMS machines making up $5,117,436.28;
– 128 Line machines making up $531,250.90

0
100
200
300
400
500
600
700
FY14 FY15 FY16 FY17 FY18 (YTD)
New & Destroyed Terminals
New Destroyed

42-7A-21. Rules and regulations. The commission shall promulgate rules pursuant to chapter 1-26 governing the establishment and operation of a state lottery as necessary to carry out the purposes of this chapter. The commission shall promulgate rules concerning the following: (10) The mechanical and electronic specifications for each video lottery machine. At a minimum, each video lottery machine shall meet the requirements of § 42-7A-37; (17) Such other matters necessary or desirable for the efficient or economical operation of the lottery or for the convenience of the public. 42-7A-63. State's percentage of net machine income--Deposit into general fund and video lottery operating fund. The commission shall maximize revenues to the state from video lottery. The state's percentage of net machine income shall be fifty percent. The state's percentage of net machine income shall be directly deposited to the general fund, except for one-half of one percent of net machine income authorized for deposit into the video lottery operating fund.

48:02:05:01. General duties of all video lottery licensees. The general duties required of each video lottery licensee are as follows:
(5) Assist the lottery to maximize revenues to the state of South Dakota; and

Items to consider:
• Age of current machines in market(30 years) • Availability of approved parts for older machines • Video System RFP (Available Extensions) • Advantage or Disadvantage of running Multiple Protocols • Line Game Performance vs Legacy Performance • Current rate of machine investment.(New vs Destroyed) • Cost of replacement machines

Open and transparent discussion with the Industry that helps maintain and grow the video lottery industry now and into the future. Keeping it as a positive and sustainable revenue source for the State of South Dakota and our partners.


Testing 44 new games
Using 6 current “control”
games. (100 Index)
Testing in January, 2018
Ticket Price Number of Games Tested
$1 9
$2 10
$3 9
$5 11
$10 3
$20 2
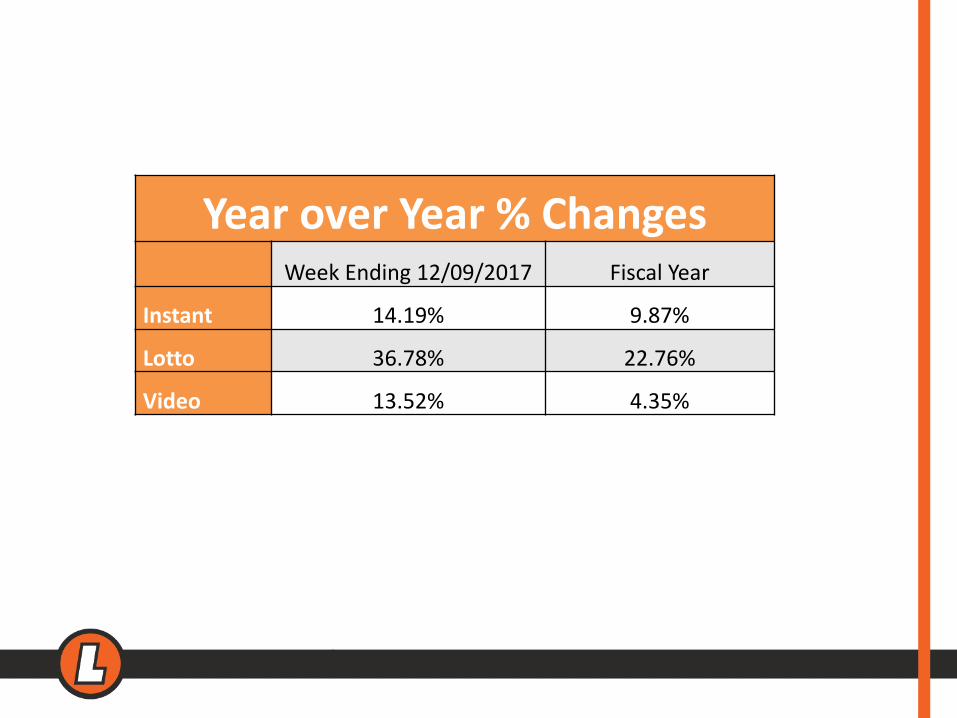
Year over Year % Changes Week Ending 12/09/2017 Fiscal Year
Instant 14.19% 9.87%
Lotto 36.78% 22.76%
Video 13.52% 4.35%


