RM/363/07.07.2014 ISO 9001:2008: Reliance Securities Limited holds a certificate issued by BSI Management System India Pvt. Ltd to the effect that it operates a Quality Management System that complies with the requirements of ISO 9001:2008 for providing equity & equity derivative trading services through online trading system. Investment in securities market is subject to market risk.Please read the risk disclosure document before investing. Reliance Securities is a distributor for MF, IPO, Bonds, NCDs and Corporate FDs Registered Office: Reliance Securities Limited, 11th Floor, R-Tech IT Park, Western Express Highway, Goregaon (East), Mumbai - 400063. Tel: +91 22 3320 1212, CIN: U65990MH2005PLC154052. (NSE - INB / INF / INE 231234833; BSE - INB / INF / INE 011234839; AMFI ARN No.29889). 1 From the desk of Business Head Research Desk | Reliance My Gold Plan | Mutual Fund Desk | Monthly Economic Calendar | Rgurukool Corner Customer Service | Product of the Month | Currency Research Desk Indian market consolidates; awaits next trigger Dear Customer, The Indian stockmarket went into consolidation mode in July, Going forward, on the domestic front, the progress of the monsoon will awaiting the next trigger, while simultaneously analyzing the continue to influence short-term market sentiments. Considering that probable challenges on the horizon. Thus, while the Nifty the monsoon was at marginal deficit at the end of July, not only restrained itself within the 8,300 – 8,650 range, the Sensex too sustained recovery of the same but also the spatial distribution of oscillated in ~1,200 points range. Post this ranged volatility, the monsoon is of importance from the crops sowing point of view. On the Sensex ended the month with a 1.2% gain while the Nifty ended other hand, any material monsoon shortfall will pose a risk to the 2% higher. Further, considerable action was witnessed in the domestic inflation trajectory, which in turn will prevent the RBI Mid-cap and the Small-cap space, which can also be gauged by considering rate cuts. Moreover, on the earnings front, the 1Q results the fact that these indices clocked in gains of 5.5% and 7.5% season has so far been mixed with no considerable earnings respectively. FIIs, after two consecutive months of selling, turned downgrade. net buyers of Indian equity last month to the tune of ~Rs2,400cr. Going forward into August, while the month will begin with the RBI While the good monsoon in June helped the Indian stockmarket Monetary Policy (August 4) wherein we expect the governor to to put on some weight in the initial part of July, the optimism maintain status quo for now, we continue to believe that the interest started to fizzle out as the above average monsoon (28% above rates trajectory, in the backdrop of a supportive inflation trend, long period average) started to wane away and turned into a continues to remain on the downside. Apart from this, with the 1Q deficit (4%) by the month end. This, coupled with adverse global results season still pending, market participants will be closely developments put investors into the risk-off mode during the watching not just what the companies deliver for the June quarter, but month. The two events which took centre-stage last month were also what the management commentaries have in store for them with the incessant slide in the Chinese stockmarket and the Greek respect to the outlook for the next few quarters. Thus, stock specific drama. In the case of the former, the Chinese government came valuation re-alignments would continue depending upon the actual to the rescue of its stockmarket by implementing various policy numbers delivered by companies. Further, expectations of continued decisions to stabilize the market, which included restrictive as newsflow from the government quarters and gradual strengthening of well as funding activities. Whereas, on the other hand, in another the Indian economy will support Indian equities over the medium-term. part of the world, the Eurozone and global Central Banks worked Yours Sincerely hard and successfully avoided a Grexit by extending a bailout to Greece. However, while short-term resolutions to these challenges have been arrived at, the long-term challenges with respect to the Chinese stockmarket euphoria and the Eurozone Rajeev R. Srivastava Business Head debt scenario continue to remain. AUGUST 2015
Transcript
RM
/363/0
7.0
7.2
014
ISO 9001:2008: Reliance Securities Limited holds a certificate issued by BSI Management System India Pvt. Ltd to the effect that it operates a Quality Management System that complies with the requirements of ISO 9001:2008 for providing equity & equity derivative trading services through online trading system. Investment in securities market is subject to market risk.Please read the risk disclosure document before investing. Reliance Securities is a distributor for MF, IPO, Bonds, NCDs and Corporate FDs Registered Office: Reliance Securities Limited, 11th Floor, R-Tech IT Park, Western Express Highway, Goregaon (East), Mumbai - 400063. Tel: +91 22 3320 1212, CIN: U65990MH2005PLC154052. (NSE - INB / INF / INE 231234833; BSE - INB / INF / INE 011234839; AMFI ARN No.29889).
1
From the desk of Business Head
Research Desk |
Reliance My Gold Plan | Mutual Fund Desk | Monthly Economic Calendar | Rgurukool Corner
Customer Service | Product of the Month | Currency Research Desk
Indian market consolidates;awaits next triggerDear Customer,
The Indian stockmarket went into consolidation mode in July, Going forward, on the domestic front, the progress of the monsoon will
awaiting the next trigger, while simultaneously analyzing the continue to influence short-term market sentiments. Considering that
probable challenges on the horizon. Thus, while the Nifty the monsoon was at marginal deficit at the end of July, not only
restrained itself within the 8,300 – 8,650 range, the Sensex too sustained recovery of the same but also the spatial distribution of
oscillated in ~1,200 points range. Post this ranged volatility, the monsoon is of importance from the crops sowing point of view. On the
Sensex ended the month with a 1.2% gain while the Nifty ended other hand, any material monsoon shortfall will pose a risk to the
2% higher. Further, considerable action was witnessed in the domestic inflation trajectory, which in turn will prevent the RBI
Mid-cap and the Small-cap space, which can also be gauged by considering rate cuts. Moreover, on the earnings front, the 1Q results
the fact that these indices clocked in gains of 5.5% and 7.5% season has so far been mixed with no considerable earnings
respectively. FIIs, after two consecutive months of selling, turned downgrade.
net buyers of Indian equity last month to the tune of ~Rs2,400cr.Going forward into August, while the month will begin with the RBI
While the good monsoon in June helped the Indian stockmarket Monetary Policy (August 4) wherein we expect the governor to
to put on some weight in the initial part of July, the optimism maintain status quo for now, we continue to believe that the interest
started to fizzle out as the above average monsoon (28% above rates trajectory, in the backdrop of a supportive inflation trend,
long period average) started to wane away and turned into a continues to remain on the downside. Apart from this, with the 1Q
deficit (4%) by the month end. This, coupled with adverse global results season still pending, market participants will be closely
developments put investors into the risk-off mode during the watching not just what the companies deliver for the June quarter, but
month. The two events which took centre-stage last month were also what the management commentaries have in store for them with
the incessant slide in the Chinese stockmarket and the Greek respect to the outlook for the next few quarters. Thus, stock specific
drama. In the case of the former, the Chinese government came valuation re-alignments would continue depending upon the actual
to the rescue of its stockmarket by implementing various policy numbers delivered by companies. Further, expectations of continued
decisions to stabilize the market, which included restrictive as newsflow from the government quarters and gradual strengthening of
well as funding activities. Whereas, on the other hand, in another the Indian economy will support Indian equities over the medium-term.
part of the world, the Eurozone and global Central Banks worked Yours Sincerelyhard and successfully avoided a Grexit by extending a bailout to
Greece. However, while short-term resolutions to these
challenges have been arrived at, the long-term challenges with
respect to the Chinese stockmarket euphoria and the Eurozone Rajeev R. SrivastavaBusiness Headdebt scenario continue to remain.
AUGUST 2015
BUY – PIDILITE (CMP: Rs558)
Thus, we recommend BUY on the stock in the range of Rs558 and
on dips with a strict stop loss of Rs505 and a Target Price of Rs638.
– HCL TECH (CMP: Rs998)
Nonetheless, any declines should be used to
Accumulate the stock, especially towards Rs920, for an upside
Target of Rs1,200 with a stop loss of Rs870.
Pidilite Industries has undergone narrow ranged consolidation
since past few weeks, after registering a high of about Rs638.
Stock has good support around its 50 week exponential moving
average that is placed around Rs509. MACD above the zero mark,
RSI above 50 and stochastic giving positive cross-over indicate the
probability of the beginning of a fresh up move towards Rs638.
HCL Tech witnessed sharp correction from a high of about Rs1,058
to a low of about Rs835 in April 2015, thus re-testing strength at its
50 week exponential moving average placed around Rs870. The
Andrew pitch fork study suggests good strength in the stock with
potential move towards Rs1,200 in the short term. Further, a cross
over on MACD and RSI can push the stock above its previous
peak. The concern only arises from the overbought nature of the
stock on daily charts.
BUY
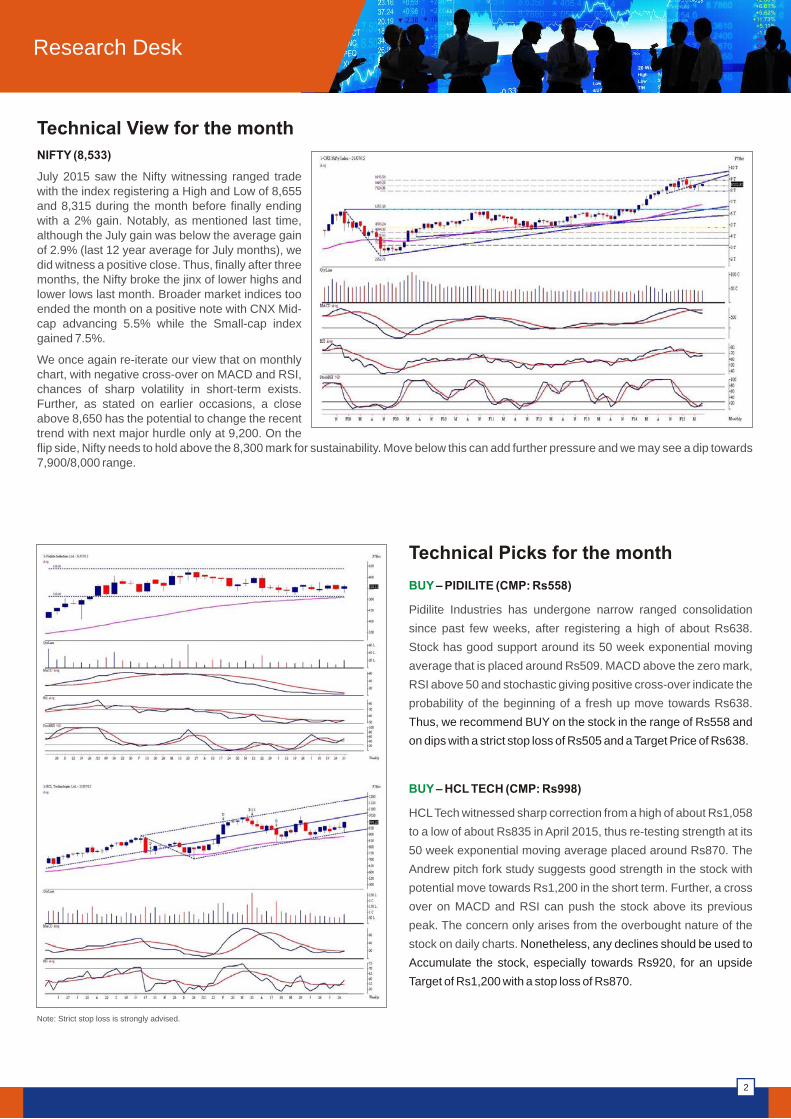
Technical View for the month
Technical Picks for the month
NIFTY (8,533)
July 2015 saw the Nifty witnessing ranged trade with the index registering a High and Low of 8,655 and 8,315 during the month before finally ending with a 2% gain. Notably, as mentioned last time, although the July gain was below the average gain of 2.9% (last 12 year average for July months), we did witness a positive close. Thus, finally after three months, the Nifty broke the jinx of lower highs and lower lows last month. Broader market indices too ended the month on a positive note with CNX Mid-cap advancing 5.5% while the Small-cap index gained 7.5%.
We once again re-iterate our view that on monthly chart, with negative cross-over on MACD and RSI, chances of sharp volatility in short-term exists. Further, as stated on earlier occasions, a close above 8,650 has the potential to change the recent trend with next major hurdle only at 9,200. On the flip side, Nifty needs to hold above the 8,300 mark for sustainability. Move below this can add further pressure and we may see a dip towards 7,900/8,000 range.
Research Desk
2
Note: Strict stop loss is strongly advised.
Research Desk
Strike Rates – June 2015
Fundamental / Technical Calls Performance
Note: As on July 31, 2015; Source: Refer Daily Market Lens / LIVE Market Calls data
3
Some Fundamental Call updates:
Disclaimer at the last page
Step 1: https://trade.rsec.co.in/
Step 2: Select Rofferings > Model Portfolio
How to Invest online
To know more visit: http://www.rsec.co.in/why-us/research/r-model-portfolio
4
Research Desk
* Current Model Portfolio performance as on July 31, 2015
* Performance adjusted for Split (SBI) and Bonus (INFY)
Reliance Securities Model Portfolio Performance
Since inception in October 2011, the Reliance Securities
Model Portfolio has outperformed its benchmark (Sensex)
by ~47%!
Thus, while the Sensex has given a return of ~78% in this
period, the R-Model Portfolio has given a return of ~115%,
which is ~37% higher (in absolute terms) than Sensex
returns.
a) A bracket order is a special order type(Intraday order) which allows you to place the main order as
well as the stop-loss and the profit taking order, all in a single click. It is a three leg order.
b) Now you can place the Bracket order in Nest trader .
Follow the below mentioned Steps to place an Bracket order through Nest trader :
1. After login in Nest trader
2. In market watch option select the particular script
3. Right click on that particular script
4. Click Bracket order -----Click on Buy Bracket order /Sell bracket order
5. Shortcut keys for placing Bracket order :Click on Shift +F3 –Buy order and Shift +F4 Sell order
Path: Login to trading portal – Trade Booster - Screeners
Currency Research Desk
Indian rupee tumbled down sharply to surge negative note in the end of the month of July 2015, particularly in last two week its
weakened around further 0.75% as compared to the month of June. However, the unit depreciated sharply during the whole month
ahead of the data of Indian Industrial Production and Wholesale price Index Inflation, along with global events of Greece and
China.
The index of industrial production (IIP) for the month of May which
released on second week of the July Month that came in at 2.7
percent, falling from 4.1 percent, led by a sharp fall in capital goods
and consumer goods data. The relatively weak data would stir the
Reserve Bank of India into effecting one more rate cut in next
policy minutes. While later in the third week of July The wholesale
price index-(WPI) based inflation fell to -2.4 percent lower than
previous month's number of -2.35% and 5.66% during the
corresponding month of the previous year. The accompanying
news of Iran deal will be a big positive for India's commodity
prices. Both WPI number and Iran deal brought down bond yields
marginally.
For Indian Rupee to be appreciating further there is positive cues
remain supportive. First, domestic equities remain higher to found
good capital inflow may keep Rupee firm. Secondly, Two times
price cut in Oils during the month of July while in Mid of the month the price of petrol was cut by Rs 2 per Litre and that of diesel was
by Rs 2 per liter And end of the month of July the price of petrol was cut by Rs 2.43 per Litre and that of diesel was by Rs 3.60 per
Litre. This makes it the second reduction in the mid of the July and third reduction in the end of the July in the fuel price this month.
Prices of Petrol and Diesel were last revised on July 1.
Global economic cues likely observed to be volatile to cautious sentiment for the single currency while the Federal Reserve held
interest rates steady at zero and provided only faint clues about when the first hike in nine years might occur. Adhering to market
expectations, the Fed's Open Market Committee voted essentially to maintain the status quo that has prevailed since the US
central bank first went to zero rates in late-2008. The Fed wants to "keep rates lower for longer, but when it comes time to hike, hike
faster. Keep rates low, but allow inflation pressures to build. Before they get out of hand, hike rates faster to stop any inflation.
7Disclaimer: This report is prepared exclusively for Reliance Commodities. The information and opinions contained in the document have been compiled from sources believed to be reliable. Use of data and information contained in this report is at your own risk. This document is not, and should not be construed as, an offer to sell or solicitation to buy any commodity. Reliance Commodities Ltd. do not accept responsibility for any losses or damages arising either directly or indirectly from the use of this document.
Indian rupee shrinks to smash weakest point
The USDINR ended lower at 64.50 during the July month 2015 Down 0.78% as against 64.00 in the previous month. The pair may
find Major trend reversal support near 63.90 to 63.40 levels, as indicated by the upward Blue trend line and moving averag. While
immediate support seen at the level of 64.15 followed to 63.85. Simple moving average of 14 and 21 days in weekly chart
indicates subdued to upside level of 63.91 to 63.57 in the above chart. If INR sustains Above 63.90 levels that is above the moving
average level may move drag rupee towards 64.60 followed by 65.00 as finding resistance to upward blue resistance line. In the
near term resistance may be seen at INR 64.60 which is previous highest level of the last month as indicated in the above chart.
64.60 per dollar may be major resistance break out level while next resistance is likely to be found at 65.1. As per technical chart,
USDINR is still on upward direction slightly as Indicated by Stochastic Oscillator upside cross over to move towards the level of
64.60 to 65.20 per dollar with a further expected trading range of 65.85 to 63.50 per. While any close above the level of 64.6 per
Dollar may drag to 66.20 to 66.50 levels per Dollar. While Among technical indicators, like Stochastic and Moving Average which
may see Dollar trading in the sideways to up above the level of 63.00 -63.60. While on higher side 65.6 to 66.10 levels which in turn
may be a selling opportunity in short term. Overall, near term scenario looks subdued between 65.60 to 63.90 levels per dollar and
it is advisable to adopt buy in dips around the level of 63.90 to 64.10 for aiming the target of 64.60 and then 65.20 and from that
level it may come corrections till 63.85-63.50 levels. Contrary to above view, any weekly close below INR 64.0 could change the
trend with major downward bias that could push the pair towards INR 63.25 to 62.50 levels. As such major down side fall not be
expecting below the level of 63.90 followed by 63.50 per Dollar.
8Disclaimer: This report is prepared exclusively for Reliance Commodities. The information and opinions contained in the document have been compiled from sources believed to be reliable. Use of data and information contained in this report is at your own risk. This document is not, and should not be construed as, an offer to sell or solicitation to buy any commodity. Reliance Commodities Ltd. do not accept responsibility for any losses or damages arising either directly or indirectly from the use of this document.
Saving 24 Karat gold is easy and convenient online by subscribing to Reliance My Gold Plan. Just follow the below mentioned
steps and start accumulating physical gold every day.
1. Visit and click on “Buy Online”.
2. Just enter your mobile number and e-mail ID in the respective fields and click on “Submit”.
3. Enter the mandatory details in the Personal Details section and click “Next”.
4. You also have the option of uploading scanned images of your KYC documents.
5. In case you do not have the scanned images of the KYC, you can choose to submit your KYC documents offline.
6. In the initial subscription details section, just enter the amount and tenure that you would like to subscribe with.
7. Select the Initial payment mode as “Online Banking”.
8. Enter your monthly subscription details and select the payment mode as NACH/ECS/Direct Debit.
9. Enter the nominee details (nomination is compulsory) and accept the terms and conditions of the plan.
10.On clicking “Submit”, you will be taken to the safe and secure payment gateway where you can complete the transaction via
Credit Card, Debit Card or Net Banking.
11. On transaction success, an e-mail will be sent to your registered e-mail ID with the application form attached and your
details already pre-filled.
Your Reliance My Gold Plan customer ID will be generated on the next day of successful realization of funds by Reliance My
Gold Plan. Gold grams allotment will begin on the same day as generation of customer ID.
For successful registration of monthly payments, all you need to do is download the application form sent to your registered e-
mail ID and sign the duly filled NACH/ECS/Direct Debit mandate (page 5 of the form) and send it to the address of our service
provider mentioned in the confirmation e-mail.
The registration of the signed mandate is done by sending the scanned image of your signed mandate to your bank and
confirmation of registration is received within 5 days, thus providing the most convenient experience for you.
In case you do not have scanned images of your KYC documents to upload while subscribing online, then a valid photo ID
proof, address proof and passport size photo need to be sent along with the NACH/ECS/Direct Debit mandate.
Therefore, subscribing to Reliance My Gold Plan and saving in 24 Karat physical gold everyday is as convenient as ever.
Reliance My Gold Plan is .
www.reliancemgp.com
brought to you by Reliance Money in association with World Gold Council
Disclaimer: “RELIANCE MY GOLD PLAN” is offered by Reliance Money Precious Metals Pvt. Ltd. Reliance Securities is offering such products as distributor only and it shall not be held responsible for any financial loss / liability.
Subscribe to Reliance My Gold Plan from the comfort of your home/office
Reliance My Gold Plan
For more information:
Visit Our Branch
SMS <RSEC GOLD> to 53636022-3988 6000www.reliancemgp.com
Investors have pulled out a little over Rs 25,000 crore from various The June net inflows are second only to Rs 13,700 crore seen in mutual fund (MF) schemes in June, with money markets January 2008.contributing the most to the outflow.
However, liquid or money market category witnessed an outflow of The move comes following an inflow of about Rs 1.12 lakh crore into about Rs 47,330 crore, whileGold ETF (Exchange Traded Funds) mutual fund products in the preceding two months (April-May). saw a pull out of Rs 76 crore.
According to data from the Association of Mutual Funds in India, With the latest outflow, the net inflow in the schemes was at Rs investors withdrew a net Rs 25,085 crore in MF schemes last 85,727 crore in the first quarter (April-June)of the current fiscal, month. Investors withdrew capital from the liquid or money market 2015-16.instrument last month but they continued to be bullish on the equity
There are 44 mutual funds in the country and their total Average schemes.Asset Under Management stands at Rs 11.73 lakh crore at the end
Equity and equity linked schemes saw an inflow of Rs 12,273 crore of June.last month, the second-highest into equity MFs ever.
Mutual Fund Desk
Mutual Funds Update:
10
Data as on 15th July 2015
Data as on 15th July 2015
Recommended Mutual Fund Schemes (EQUITY FUNDS)
Debt Funds:
Scheme Name AUM(Cr.) 1 Month 3 Months 6 Months 1 Year 3 Years 5 Years SD Beta Sharpe
Birla SL Frontline Equity Fund 9,364 6.75 -0.63 3.90 23.02 25.95 14.82 16.75 1.36 1.23
Visit Our BranchSMS <RSEC MF> to 53636022-3988 6000
Step 1: https://trade.rsec.co.in/
Step 2: Select Investment Offering > Mutual Fund > Choose a Fund of your choice
How to Invest online in Mutual Fund
Disclaimer at the last page
11
Mutual Fund Schemes Scheme Theme Aggressive % Moderate% Conservative%
Reliance Equity Opportunities Fund Diversified 15% 15% 5%
HDFC Equity Fund Diversified 15% 10% 5%
Birla SL Frontline Equity Fund Large cap 15% 10% 10%
ICICI Pru Focused Bluechip Fund Large cap 10% 10% 5%
ICICI Pru Value Discovery Fund Mid cap 10% 5% Nil
HDFC Mid Cap Opportunity Fund Mid cap 10% Nil Nil
Templeton India ST Income Fund Short term income Nil 10% 15%
Reliance RSF - Debt Plan Long term income 5% 5% 15%
Birla Sun Life Dynamic Bond Fund Medium Term Income 10% 10% 15%
1 Year FMP Short term FMP Nil 10% 15%
HDFC Cash Mgmt Fund-Savings Liquid 5% 10% 10%
Gold Fund Gold Fund 5% 5% 5%
EQUITY 75% 50% 25%
DEBT 25% 50% 75%
Total 100% 100% 100%
Disclaimer:
For further information please contact:
Registered Office: Reliance Securities Limited, 11th Floor, R-Tech IT Park, Western Express Highway, Goregaon (East), Mumbai - 400063. Tel: +91 22 3320 1212.
This document is meant for the customers of Reliance Securities Limited only. In case you are a non resident, please note that you need to comply with the relevant local laws of the country of your residence, before investing. Mutual Funds and securities investments are subject to market risks, and there is no assurance or guarantee that the objectives of the Scheme will be achieved. As with any investment in securities, the Net Asset Value (NAV) of the Units issued by Mutual Fund Schemes can go up or down depending on the factors and forces affecting the securities market. There are no assurances or guarantees that the objectives of any of the mutual fund schemes will be achieved. The investments may not be suited to all categories of investors. Please read the Scheme Information Document and Statement of Additional Information of the respective mutual fund carefully before investing.The views herein constitute only the opinions and do not constitute any guidelines or recommendation on any course of action to be followed by the readers. This information is meant for general reading purpose only and is not meant to serve as a professional investment guide for the readers. This document has been prepared on the basis of publicly available information, internally developed data and other sources believed to be reliable. Reliance Securities Limited (RSL) or its directors, employees, affiliates or representatives do not assume any responsibility for, or warrant the accuracy, completeness, adequacy and reliability of such information. Due care has been taken to ensure that the disclosures and opinions given fair and reasonable. No action has been solicited based upon the information provided herein, and the information is not intended to be an offer or solicitation for the purchase or sale of any financial product or instrument. Recipients of this information should rely on information/data arising out of their own investigations. Readers are advised to seek independent professional advice and arrive at an informed investment decision before making any investments. None of the directors, employees, affiliates or representatives of RSL shall be liable for any direct, indirect, special, incidental, consequential, punitive or exemplary damages, including lost profits arising in any way whatsoever from the information contained in this material. RSL, the directors, employees, affiliates or representatives of RSL, associate companies, affiliates, and representatives including persons involved in the preparation or issuance of this material may from time to time, have long or short positions in, and buy or sell the securities thereof, of company(ies) / specific economic sectors / mutual funds, if mentioned herein.
Reliance Securities Limited,
Corporate Fixed Deposits
Corporate Fixed Deposits
How to choose a good Corporate FD Scheme?
are Fixed Deposits placed by investors with companies for a fixed term carrying a prescribed rate of interest. The
companies in turn use these funds to fulfill their capital requirement from time to time.
Corporate FDs are attractive investment avenue for conservative investors who do not want to take the risk of vagaries of stock market.
Corporate FDs also offer higher interest rates than normal bank FDs.
However unlike Bank FDs your investment in Corporate FD is not guaranteed by Govt of India or RBI or by any government sponsored
agencies.
Ignore the un rated Company Deposit Schemes: Chose only AA+ and above rated FD issuing corporate .Within a given rating grade, choose
the company with a better reputation. It is better to make shorter deposit of around 1 year to 3 years check on the servicing standards of the
company before investing. Based on our research, we recommend the following Corporate FDs to suit your requirements.
12
Name of the Company Minimum Amount Senior Citizen Credit Rating (Interest rate %) ( Period in Months)
Shriram Transport Finance Company Ltd (Shriram Unnati FD Scheme ) 12 24 36-60 Frequency
SMS <RSEC RGURU> to 53636022-3988 6000 Visit Our Branch
Visit us at –
http://www.rgurukool.com/Home.aspx
Register for our trainings at:
http://www.rgurukool.com/Registration.aspx
For more information:
Hope this article has been useful… for further
knowledge on the subject visit us at
www.rgurukool.com
Stock Support and Resistance Levels for Trading
CORNER
14
Stock Support and Resistance Levels for TradingHave you ever thought how come the Nifty/Sensex/individual stock takes support at a point and resistance at another throughout the
day’s trading?
We had observed a very key way of coming up with these supports & resistances are based on the Pivot Points.
A pivot point analysis is often used in conjunction with calculating support and resistance levels. In a pivot point analysis, the first support
and resistance levels are calculated by using the open, high, low, and close. Daily pivot points are the most commonly used, but weekly
and monthly pivot points are also available. Pivot points are displayed on charts with the price bars, and the horizontal lines.
Pivot points are used as support and resistance levels, and as areas where significant price movement should be expected (such as
reversals, or breakouts). There are several trading systems that use pivot points, so there are several different uses of pivot points, but in
general they are used as support and resistance levels.
A pivot point and the associated support and resistance levels are often turning points for the direction of price movement in a market. In
an up-trending market, the pivot point and the resistance levels may represent a ceiling level in price above which the uptrend is no
longer sustainable and a reversal may occur. In a declining market, a pivot point and the support levels may represent a low price level of
stability or a resistance to further decline.
If the market in the following period trades above the pivot point it is usually evaluated as a bullish sentiment, whereas trading below the
pivot point is seen as bearish.
Pivot Point :-
P = (H + L + C) / 3.
H=previous day HighL=Previous day LowC=Previous day Closing
Support and resistance levels:-
• R3 = High+2*(Pivot- Low)
• R2 = Pivot + (R1-S1)
• R1 = 2*pivot-Low
• P(Pivot Point) = (H + L + C) / 3.
• S1 =2*Pivot- High
• S2 =Pivot-(R1-S1)
• S3 =Low-2*(High-Pivot)
Calculation
Refer to the Pivot points how it has worked in below picture -
Underline Nifty Futures
High 5678.25
Low 5643.6
Close 5669.85
R3
R2
R1
PV 5664
S1
S2
S3
5719
5699
5684
5650
5629
5615
Example:
General Disclaimers:
Risks:
Disclaimers in respect of jurisdiction:
Disclosure of Interest:
Copyright:
ISO 9001:2008: Reliance Securities Limited
This document is meant for the customers of Reliance Securities Limited only. In case you are a non resident, please note that you need to comply with the relevant local laws of the country of your residence, before investing. Mutual Funds and securities investments are subject to market risks, and there is no assurance or guarantee that the objectives of the Scheme will be achieved. As with any investment in securities, the Net Asset Value (NAV) of the Units issued by Mutual Fund Schemes can go up or down depending on the factors and forces affecting the securities market. There are no assurances or guarantees that the objectives of any of the mutual fund schemes will be achieved. The investments may not be suited to all categories of investors. Please read the Scheme Information Document and Statement of Additional Information of the respective mutual fund carefully before investing.The views herein constitute only the opinions and do not constitute any guidelines or recommendation on any course of action to be followed by the readers. This information is meant for general reading purpose only and is not meant to serve as a professional investment guide for the readers. This document has been prepared on the basis of publicly available information, internally developed data and other sources believed to be reliable. Reliance Securities Limited (RSL) or its directors, employees, affiliates or representatives do not assume any responsibility for, or warrant the accuracy, completeness, adequacy and reliability of such information. Due care has been taken to ensure that the disclosures and opinions given fair and reasonable. No action has been solicited based upon the information provided herein, and the information is not intended to be an offer or solicitation for the purchase or sale of any financial product or instrument. Recipients of this information should rely on information/data arising out of their own investigations. Readers are advised to seek independent professional advice and arrive at an informed investment decision before making any investments. None of the directors, employees, affiliates or representatives of RSL shall be liable for any direct, indirect, special, incidental, consequential, punitive or exemplary damages, including lost profits arising in any way whatsoever from the information contained in this material. RSL, the directors, employees, affiliates or representatives of RSL, associate companies, affiliates, and representatives including persons involved in the preparation or issuance of this material may from time to time, have long or short positions in, and buy or sell the securities thereof, of company(ies) / specific economic sectors / mutual funds, if mentioned herein.
Trading and investment in securities are subject market risks. There are no assurances or guarantees that the objectives of any of trading / investment in securities will be achieved. The trades/ investments referred to herein may not be suitable to all categories of traders/investors. The names of securities mentioned herein do not in any manner indicate their prospects or returns. The value securities referred to herein may be adversely affected by the performance or otherwise of the respective issuer companies, changes in the market conditions, micro and macro factors and forces affecting capital markets like interest rate risk, credit risk, liquidity risk and reinvestment risk. Derivative products may also be affected by various risks including but not limited to counter party risk, market risk, valuation risk, liquidity risk and other risks. Besides the price of the underlying asset, volatility, tenor and interest rates may affect the pricing of derivatives.
The possession, circulation and/or distribution of this Report may be restricted or regulated in certain jurisdictions by appropriate laws. No action has been or will be taken by RSL in any jurisdiction (other than India), where any action for such purpose(s) is required. Accordingly, this Report shall not be possessed, circulated and/or distributed in any such country or jurisdiction unless such action is in compliance with all applicable laws and regulations of such country or jurisdiction. RSL requires such recipient to inform himself about and to observe any restrictions at his own expense, without any liability to RSL. Any dispute arising out of this Report shall be subject to the exclusive jurisdiction of the Courts in India.
The research analysts who have prepared this Report hereby certify that the views /opinions expressed in this Report are their personal independent views/opinions in respect of the securities and their respective issuers. Neither RSL nor the research analysts did have any known direct /indirect conflict of interest including any long/short position(s) in any specific security on which views/opinions have been made, during the preparation of this Report.
The copyright in this Report belongs exclusively to RSL. This Report shall only be read by those persons to whom it has been delivered. No reprinting, reproduction, copying, distribution of this Report in any manner whatsoever, in whole or in part, is permitted without the prior express written consent of RSL.
Important These disclaimers, risks and other disclosures must be read in conjunction with the information / opinions / views of which they form part of.
holds a certificate issued by BSI Management System India Pvt. Ltd to the effect that it operates a Quality Management System that complies with the requirements of ISO 9001:2008 for providing equity & equity derivative trading services through online trading system. Investment in securities market is subject to market risk.Please read the risk disclosure document before investing. Reliance Securities is a distributor for MF, IPO, Bonds, NCDs and Corporate FDs Registered Office: Reliance Securities Limited, 11th Floor, R-Tech IT Park, Western Express Highway, Goregaon (East), Mumbai - 400063. Tel: +91 22 3320 1212, CIN: U65990MH2005PLC154052. (NSE - INB / INF / INE 231234833; BSE - INB / INF / INE 011234839; AMFI ARN No.29889).
General Disclaimers
15
As part of regulatory requirement you are required to update your following KYC details with us:
Correspondence Address | Mobile Number | Email Id | Annual Income
To update above details login to your online trading account or send Email/Letter along with the Pan Card copy or visit any of our branches. Kindly quote your client code and PAN while sending the aforesaid KYC update.