Research Reports AUGUST 2002 The Performance of Native Speakers of English and ESL Speakers on the Computer-Based TOEFL and GRE General Test Lawrence J. Stricker TEST OF ENGLISH AS A FOREIGN LANGUAGE TM
Transcript
ResearchReports AUGUST 2002
The Performance of Native Speakers of English and ESL Speakers on the Computer-Based TOEFLand GRE General Test
Lawrence J. Stricker
TEST OF ENGLISH AS A FOREIGN LANGUAGE TM
The Performance of Native Speakers of English and ESL Speakers
on the Computer-Based TOEFL and GRE General Test
Lawrence J. Strieker
Educational Testing ServicePrinceton, New Jersey
RR-02-16
Educational Testing Service is an Equal Opportunity/Affirmative Action Employer.
No part of this report may be reproduced or transmitted in any form or by any means,electronic or mechanical, including photocopy, recording, or any information storageand retrieval system, without permission in writing from the publisher. Violators willbe prosecuted in accordance with both U.S. and international copyright laws.
EDUCATIONAL TESTING SERVICE, ETS, the ETS logos, Graduate RecordExaminations, GRE, TOEFL, and the TOEFL logo are registered trademarks ofEducational Testing Service. The Test of English as a Foreign Language is a trademarkof Educational Testing Service.
College Board is a registered trademark of the College Entrance Examination Board.
Graduate Management Admission Test and GMAT are registered trademarks of theGraduate Management Admission Council.
Abstract
The purpose of this study was to replicate previous research on the construct validity of the
paper-and-pencil version of the TOEFL test and extend it to the computer-based TOEFL. Two
samples of GRE test takers were used: native speakers of English specially recruited to take the
computer-based TOEFL, and ESL test takers who had routinely taken the computer-based
TOEFL recently. Native speakers performed well on TOEFL, relative to ESL test takers and to
the maximum possible scores on the test, and varied less in their test performance than did ESL
test takers; TOEFL scores were highly but not perfectly correlated with the computer-based
General Test scores for both groups of test takers; regressions of the General Test verbal scores
on the TOEFL scores for ESL test takers were nonlinear, and the regressions of the other General
Test scores were linear; and trends in the variances of the General Test verbal scores associated
with TOEFL scores were also nonlinear, and the trends were either unsystematic or negatively
linear for the other General Test scores. All of the findings are consistent with previous results
with the paper-and-pencil TOEFL, support the construct validity of the computer-based
TOEFL, and illuminate its interplay with ability tests for ESL test takers.
Key words: TOEFL, GRE General Test, ESL test takers, native speakers, construct validity,score interpretation
i
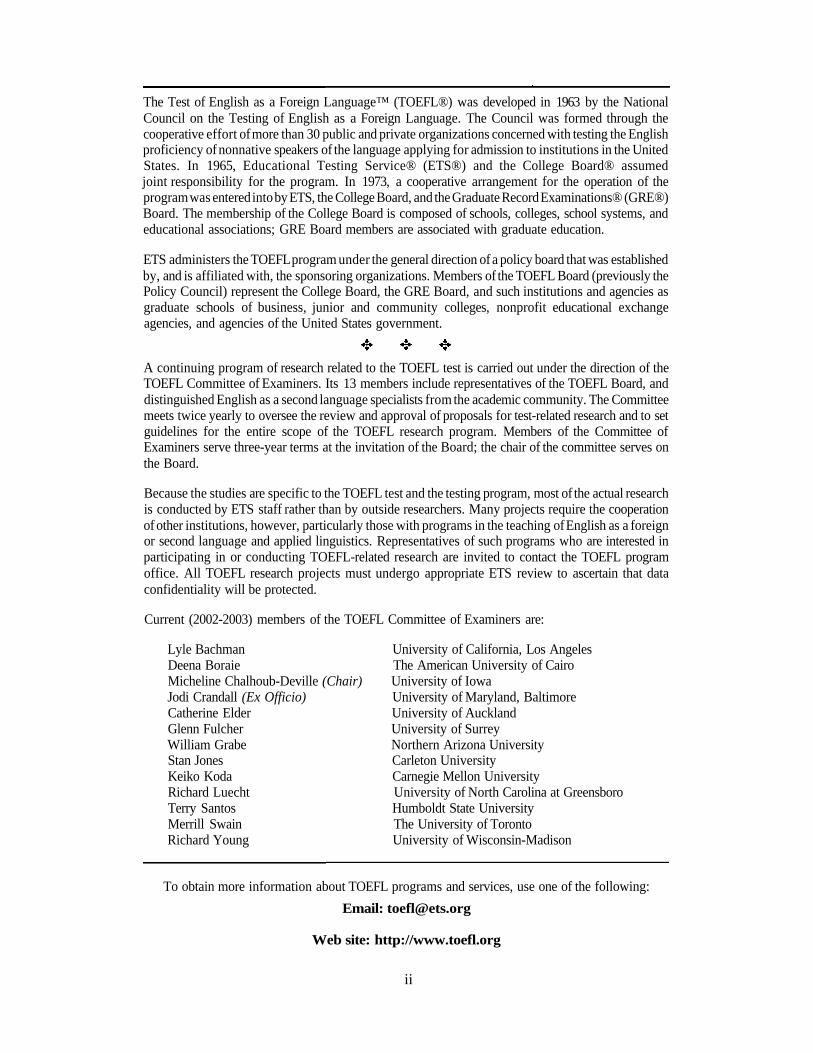
The Test of English as a Foreign Language™ (TOEFL®) was developed in 1963 by the NationalCouncil on the Testing of English as a Foreign Language. The Council was formed through thecooperative effort of more than 30 public and private organizations concerned with testing the Englishproficiency of nonnative speakers of the language applying for admission to institutions in the UnitedStates. In 1965, Educational Testing Service® (ETS®) and the College Board® assumedjoint responsibility for the program. In 1973, a cooperative arrangement for the operation of theprogram was entered into by ETS, the College Board, and the Graduate Record Examinations® (GRE®)Board. The membership of the College Board is composed of schools, colleges, school systems, andeducational associations; GRE Board members are associated with graduate education.
ETS administers the TOEFL program under the general direction of a policy board that was establishedby, and is affiliated with, the sponsoring organizations. Members of the TOEFL Board (previously thePolicy Council) represent the College Board, the GRE Board, and such institutions and agencies asgraduate schools of business, junior and community colleges, nonprofit educational exchangeagencies, and agencies of the United States government.
A continuing program of research related to the TOEFL test is carried out under the direction of theTOEFL Committee of Examiners. Its 13 members include representatives of the TOEFL Board, anddistinguished English as a second language specialists from the academic community. The Committeemeets twice yearly to oversee the review and approval of proposals for test-related research and to setguidelines for the entire scope of the TOEFL research program. Members of the Committee ofExaminers serve three-year terms at the invitation of the Board; the chair of the committee serves onthe Board.
Because the studies are specific to the TOEFL test and the testing program, most of the actual researchis conducted by ETS staff rather than by outside researchers. Many projects require the cooperationof other institutions, however, particularly those with programs in the teaching of English as a foreignor second language and applied linguistics. Representatives of such programs who are interested inparticipating in or conducting TOEFL-related research are invited to contact the TOEFL programoffice. All TOEFL research projects must undergo appropriate ETS review to ascertain that dataconfidentiality will be protected.
Current (2002-2003) members of the TOEFL Committee of Examiners are:
Lyle Bachman University of California, Los AngelesDeena Boraie The American University of CairoMicheline Chalhoub-Deville (Chair) University of IowaJodi Crandall (Ex Officio) University of Maryland, BaltimoreCatherine Elder University of AucklandGlenn Fulcher University of SurreyWilliam Grabe Northern Arizona UniversityStan Jones Carleton UniversityKeiko Koda Carnegie Mellon UniversityRichard Luecht University of North Carolina at GreensboroTerry Santos Humboldt State UniversityMerrill Swain The University of TorontoRichard Young University of Wisconsin-Madison
To obtain more information about TOEFL programs and services, use one of the following:
University of Minnesota, Minneapolis, MN; University of Missouri-Kansas City, Kansas City,
MO), and they reported on the GRE background information form that they were U.S. citizens
and that English was their best language ("Do you communicate better [or as well] in English
than in any other language?"). ETS- and university-controlled testing centers in large cities were
used to simplify data collection and increase the availability of test takers for subsequent testing
with the computer-based TOEFL after the end of the school year.
b. Took the computer-based TOEFL at the same testing center where they had taken
the General Test, between March 23, 2000, and June 30, 2000, and without special
accommodations; tested after being screened in a telephone interview to ensure that English was
their native language ("Where were you born?", "What was the first language you learned?");
and received $75 for their participation, plus a bonus of $100 promised to the 10 of 200
scheduled test takers with the highest TOEFL total scores.
These 168 test takers took both tests without any irregularity.
The 168 test takers were among 189 students who had been recruited for the study. Two
waves of mailings — March 10, 2000, and March 24, 2000 — each to 600 test takers, were sent
6
to randomly chosen test takers from the five testing centers who had taken the General Test
without special accommodations during the specified period (September 1, 1999, to February 28,
2000) and reported on the background information form that they were U.S. citizens and that
English was their best language. (A copy of the letter appears in the Appendix.) Participants
were sent excerpts from the 1999-2000 TOEFL Information Bulletin for Computer-Based
Testing (Educational Testing Service, 1999) covering background information about the test,
computer-based tutorials, and sample test items. Twenty-one test takers were excluded from the
study because the General Test they had taken was not their first such test, it was not
administered by computer, or they inadvertently canceled their TOEFL scores. Thirteen of the
189 test takers (all of whom were among the 168 in the study) received a bonus for earning the
highest TOEFL total scores (300, the maximum possible score).
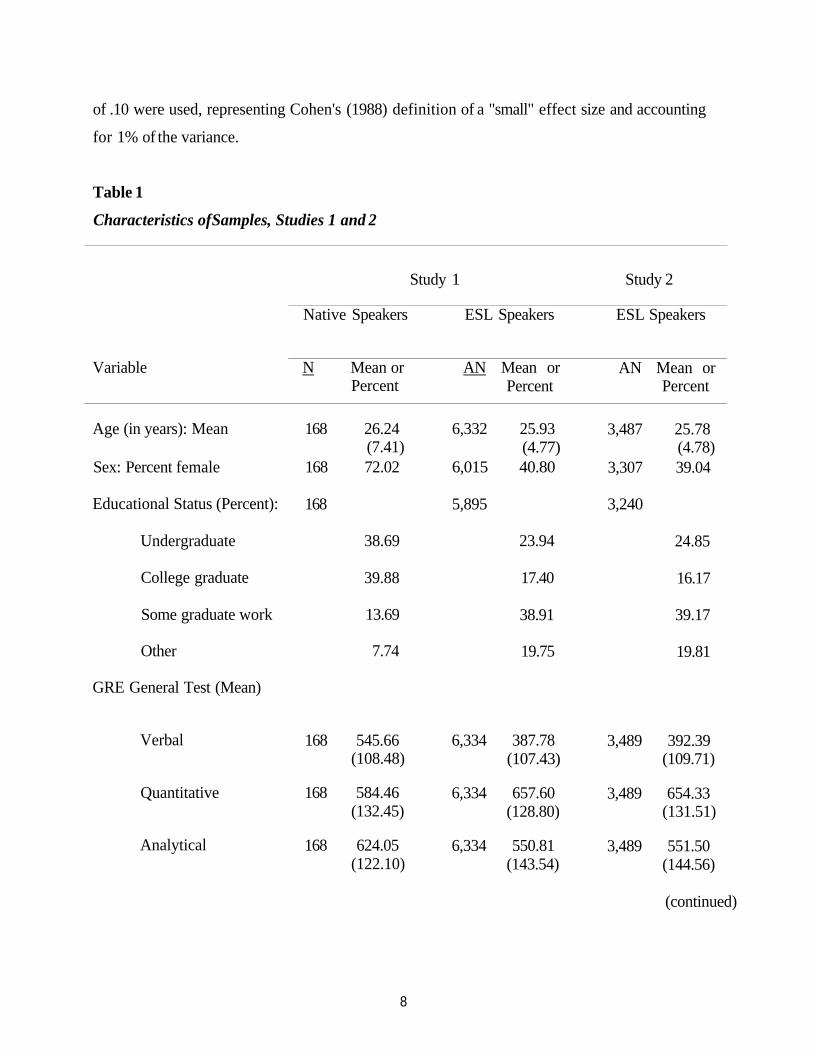
The characteristics of the ESL and native speakers of English samples are summarized in
Table 1. The two samples were similar in age, but differed appreciably in their sex (more native
speakers were women), their educational status (more native speakers were undergraduates or
college graduates), and their General Test and TOEFL scores (all of the scores were lower for
the ESL speakers, except for the General Test quantitative score).
Analysis
Differences between the mean TOEFL total score and the mean score on each of the three
sections — Listening, Structure/Writing, and Reading — for the native speakers of English and
the ESL speakers were evaluated by t tests of the two sample means. Corresponding differences
between the variances of the scores for the two groups were evaluated by t tests based on the
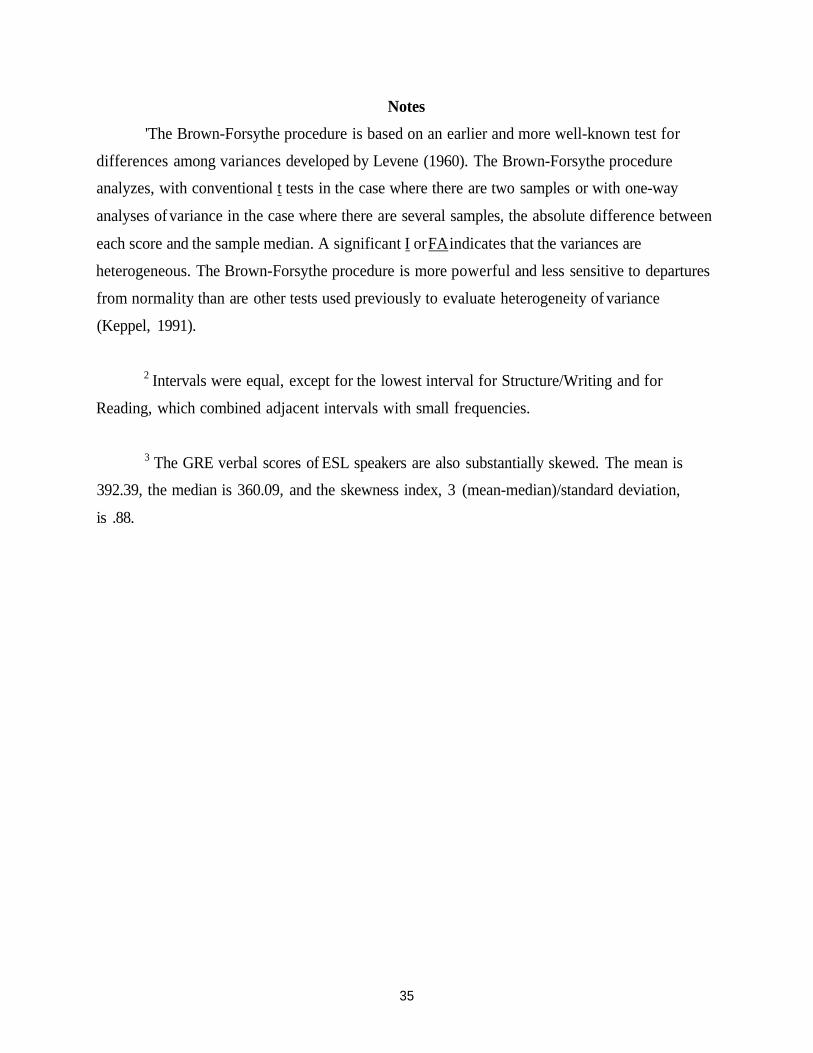
Brown-Forsythe procedure (1974).l
Differences between the mean TOEFL total scores and mean section scores for native
speakers and maximum possible scores (300 for the total score, 30 for the section scores) were
evaluated by one-sample t tests of the sample mean.
Both statistical and practical significance were considered in evaluating the results. For
statistical significance, an .05 alpha level was used. For practical significance, a d of .20 and an r
7
of .10 were used, representing Cohen's (1988) definition of a "small" effect size and accounting
for 1% of the variance.
Table 1
Characteristics of Samples, Studies 1 and 2
Variable
Age (in years): Mean
Sex: Percent female
Educational Status (Percent):
Undergraduate
College graduate
Some graduate work
Other
GRE General Test (Mean)
Verbal
Quantitative
Analytical
Study 1
Native Speakers
N Mean orPercent
168 26.24(7.41)
168 72.02
168
38.69
39.88
13.69
7.74
168 545.66(108.48)
168 584.46(132.45)
168 624.05(122.10)
ESL Speakers
AN Mean orPercent
6,332 25.93(4.77)
6,015 40.80
5,895
23.94
17.40
38.91
19.75
6,334 387.78(107.43)
6,334 657.60(128.80)
6,334 550.81(143.54)
Study 2
ESL Speakers
AN Mean orPercent
3,487 25.78(4.78)
3,307 39.04
3,240
24.85
16.17
39.17
19.81
3,489 392.39(109.71)
3,489 654.33(131.51)
3,489 551.50(144.56)
(continued)
8
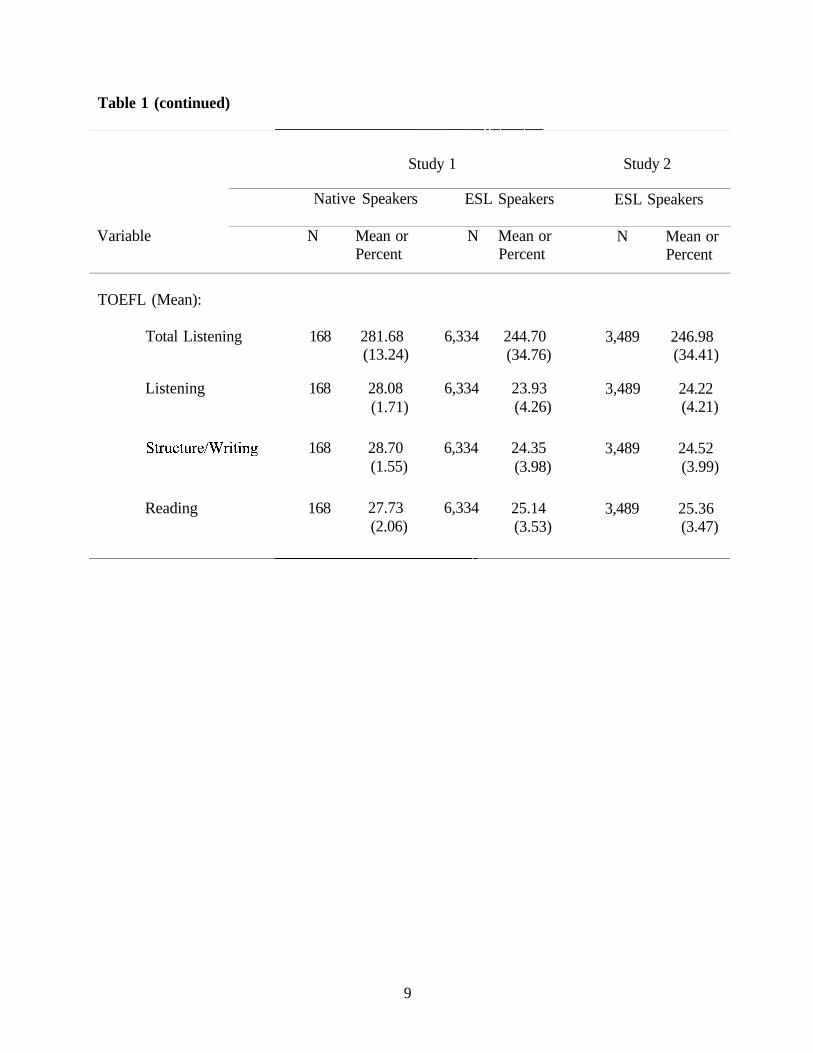
Table 1 (continued)
Study 1 Study 2
Variable
Native Speakers
N Mean orPercent
ESL Speakers
N Mean orPercent
ESL Speakers
N Mean orPercent
TOEFL (Mean):
Total Listening 168
Listening 168
168
Reading 168
281.68(13.24)
28.08(1.71)
28.70(1.55)
27.73(2.06)
6,334
6,334
6,334
6,334
244.70(34.76)
23.93(4.26)
24.35(3.98)
25.14(3.53)
3,489
3,489
3,489
3,489
246.98(34.41)
24.22(4.21)
24.52(3.99)
25.36(3.47)
9
Results
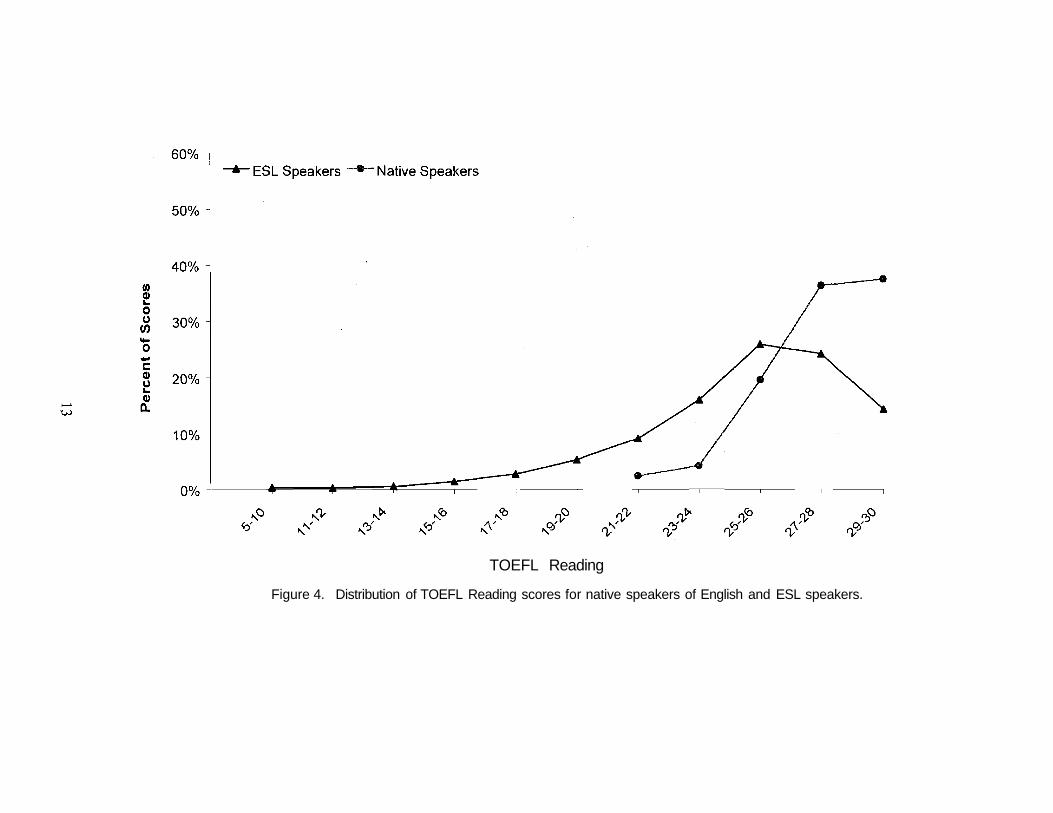
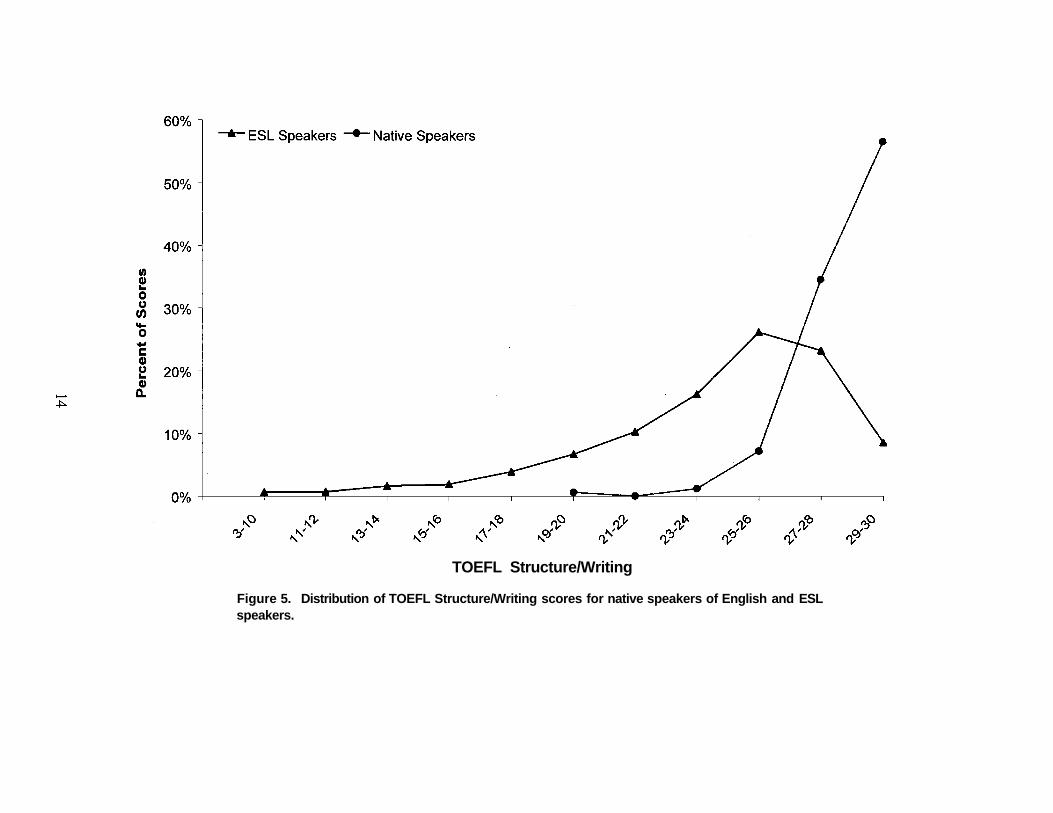
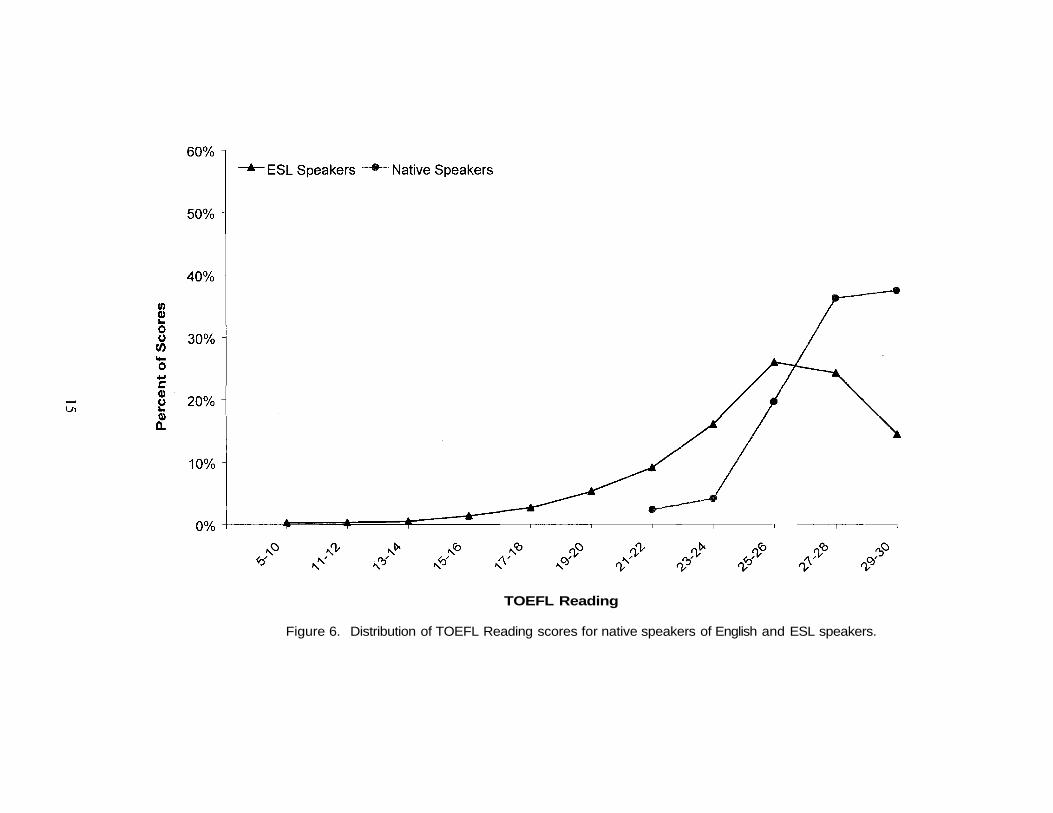
Differences Between Performance of Native Speakers and ESL Speakers
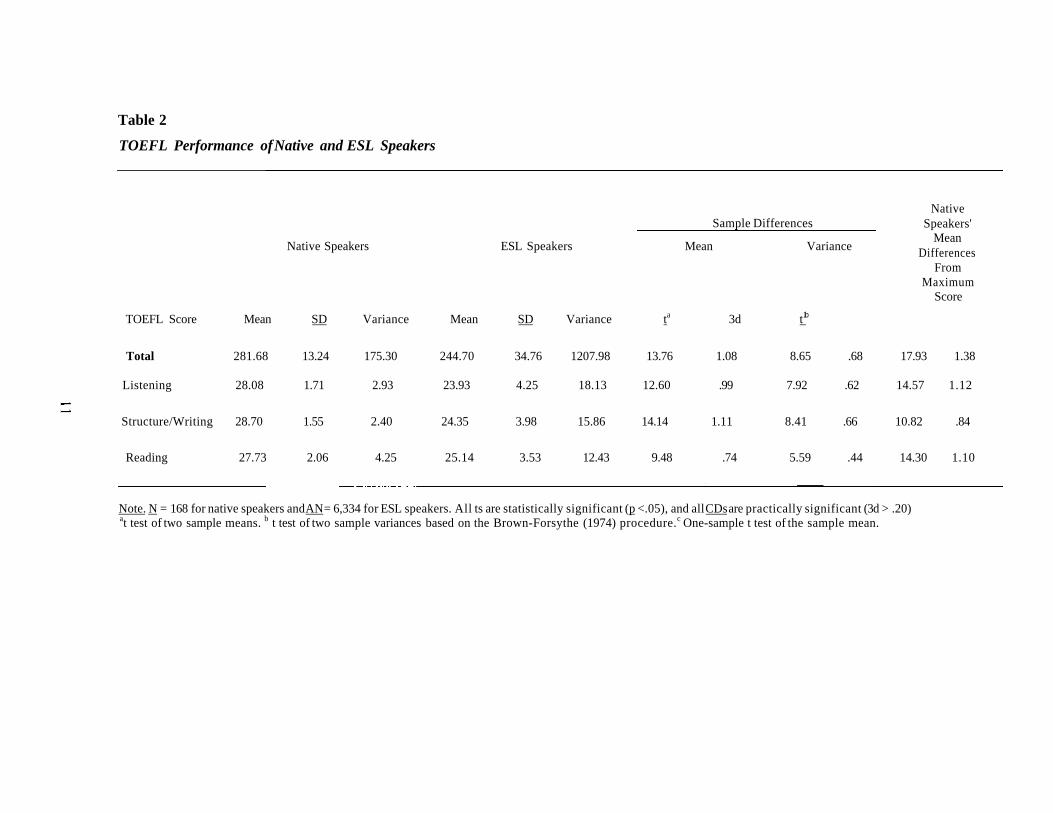
The means and standard deviations for the TOEFL total and section scores for the native
speakers of English and ESL speakers, t tests, and corresponding ds for mean differences and
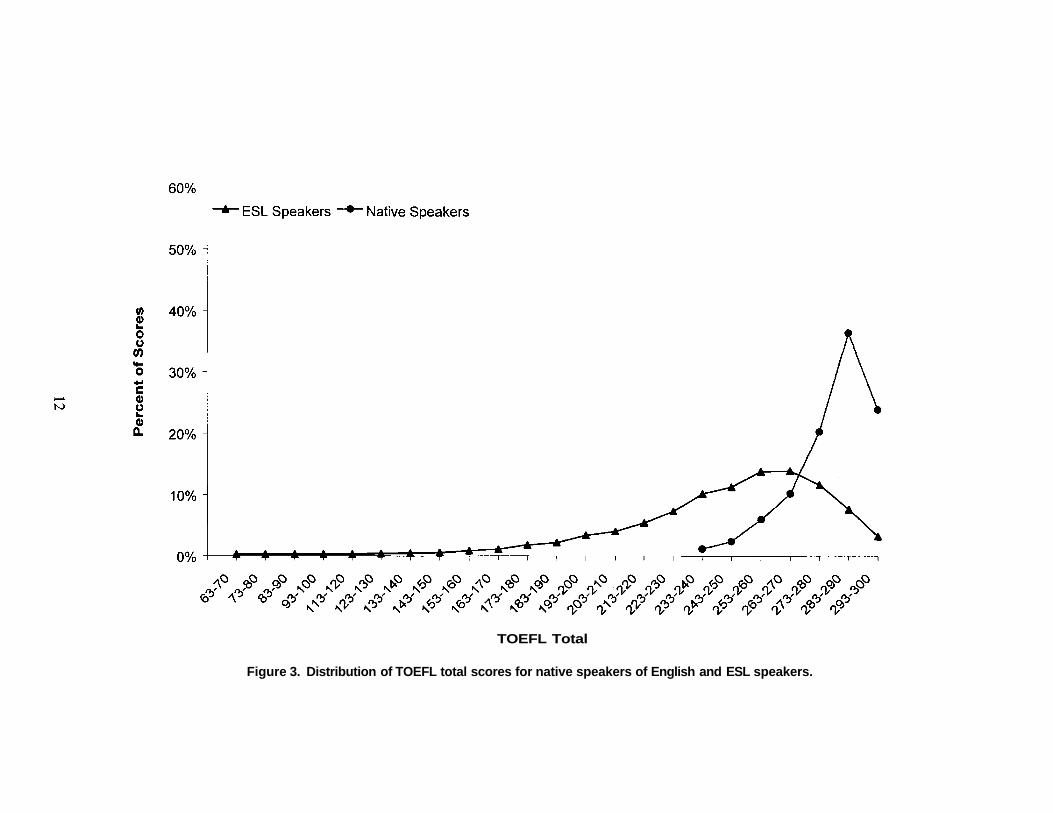
variance differences are reported in Table 2. The frequency distributions for the two groups are
shown in Figures 3-6. Note that most of the TOEFL scores were moderately or highly correlated,
with correlations ranging from .18 to .84 (all statistically, p. < .05, and practically, r > .10,
significant).
All of the differences in means were statistically (p< .05) and practically (d> .20)
significant: native speakers consistently had higher means. The d for the total score was 1.08 (a
large effect), and the ds for the section scores ranged from .74 for Reading to 1.11 for
Structure/Writing (all medium or large effects).
All of the differences in variances were also significant: native speakers had consistently
smaller variances. The d for the total score was .68, and the ds for the section scores ranged from
.44 for Reading to .66 for Structure/Writing (all medium effects).
There was substantial skewness in the distributions of all TOEFL scores for the native
speakers, with scores piled up at the top of the distributions, and minimal overlap
between the two groups' distributions for all scores.
Differences Between Performance Levels of Native Speakers and Maximum Possible Scores
The one-sample t tests and corresponding ds for the comparisons of the means for the
TOEFL scores for the native speakers with maximum possible scores are also reported in Table
2. All of the mean differences were significant: native speakers had consistently lower means
than the maximum scores. The d was 1.38 for the total score (a large effect), and the ds for the
section scores ranged from .84 for Structure/Writing to 1.12 for Listening (all large effects).
10
Table 2
TOEFL Performance of Native and ESL Speakers
Note. N = 168 for native speakers and AN = 6,334 for ESL speakers. All ts are statistically significant (p <.05), and all CDs are practically significant (3d > .20)at test of two sample means. b t test of two sample variances based on the Brown-Forsythe (1974) procedure.c One-sample t test of the sample mean.
TOEFL Score Mean SD Variance Mean SD Variance ta 3d t1.b
Figure 3. Distribution of TOEFL total scores for native speakers of English and ESL speakers.
TOEFL Reading
Figure 4. Distribution of TOEFL Reading scores for native speakers of English and ESL speakers.
TOEFL Structure/Writing
Figure 5. Distribution of TOEFL Structure/Writing scores for native speakers of English and ESLspeakers.
TOEFL Reading
Figure 6. Distribution of TOEFL Reading scores for native speakers of English and ESL speakers.
Discussion
The present findings are broadly congruent with previous studies (Angoff & Sharon,
1971; Clark, 1977; Johnson, 1977) that found native speakers of English performed well on
TOEFL, both in relative terms vis-a-vis ESL speakers and in absolute terms vis-a-vis the
maximum possible scores on the test, and varied less in their test performance than did ESL
speakers. However, there were some substantial differences from these studies in the pattern of
results for the comparisons of native and ESL speakers. For instance, in the Johnson study,
differences in mean performance for the native and ESL speakers were appreciably greater (e.g.,
the ds for the corresponding sections of the test, Listening Comprehension in the Johnson study
and Listening in the present study, were 1.82 and .99, respectively), as were differences in their
variances (e.g., the ratios of native speaker variance to ESL speaker variance for this same
section of the test were .07 in the Johnson study and .16 in the present study).
These and other divergent results are probably attributable in large part to differences in
the populations of native and ESL speakers being compared. All of the previous studies
contrasted native speakers (college-bound high school seniors [Clark, 1977] and college students
[Angoff & Sharon, 1971; Johnson, 1977]) with all TOEFL test takers, whereas the present study
contrasted native speakers with TOEFL test takers who were from the same GRE General Test
population, making the two groups comparable in educational level, verbal ability, and the like.
One feature of the results deserves emphasis. Although the native speakers did well on
TOEFL, they did not perform perfectly, and the variation in their test performance, though
considerably less than that of ESL speakers, was nontrivial. These outcomes reinforce the point
made previously (e.g., Alderson, 1980; Bachman, 1990; Hamilton et al., 1993; Lantolf &
Frawley, 1985) that native speakers may vary in their education in English and linguistic ability.
Study 2
The purpose of this study was to evaluate the relationships between performance on the
computer-based TOEFL and the GRE General Test for native speakers of English and ESL
speakers.
16
Method
Sample
Two samples of General Test takers were used:
1. The sample of 168 native born speakers of English used in Study 1.
2. A sample of 3,489 ESL speakers from the larger sample of 6,334 ESL test takers in
Study 1, limited to those who took the computer-based TOEFL and General Test within 15 days
of each other. (This restriction was imposed to minimize discrepancies in performance on the
two tests produced by English acquisition during the time between the administration of the
tests.)
The characteristics of the two samples are summarized in Table 1. Paralleling the
comparisons of native and ESL speakers in Study 1, the two samples were similar in age but
differed appreciably in their sex, educational status, and General Test and TOEFL scores.
Analysis
The product-moment correlations of the TOEFL total and section scores with the General
Test verbal, quantitative, and analytical scores were computed separately for the native and ESL
speakers.
The regression of each General Test score on each TOEFL score for the ESL speakers
was evaluated by analysis of variance, assessing both linearity and nonlinearity (Hays, 1994). In
these analyses, TOEFL scores were grouped into intervals: nine for the total score, nine for
Listening, eight for Structure/Writing, and seven for Reading.2
Heterogeneity in variance of each GRE score across the score range for each TOEFL
score for the ESL speakers was also evaluated by analysis of variance, using the Brown-Forsythe
(1974) procedure, and assessing both linear and nonlinear trends in the variances. TOEFL scores
were grouped into the same intervals used in the regression analyses.
17
Both statistical and practical significance were again considered in evaluating the results,
using the same guidelines as Study 1. For practical significance, an r or of. 10, a difference in
correlations of approximately .10 (a difference of .10 in Z-transformed correlations), and a
difference of .02 in variance proportions for 2 and r2 in assessing nonlinearity of regression or
trends in variances were used. These values represent Cohen's (1988) definition of a small effect
size and account for 1% of the variance (2% for the difference in variance proportions).
Results
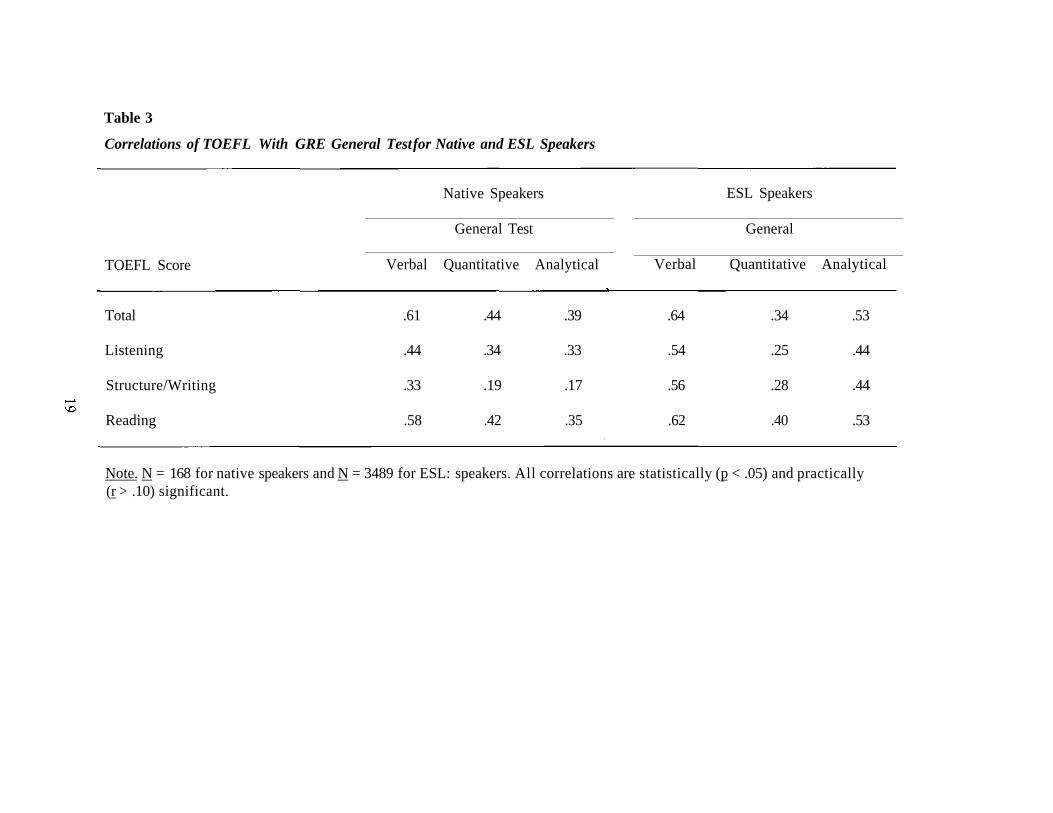
Correlations of TOEFL With General Test
The correlations of the TOEFL scores with the General Test scores are reported in Table
3 for the native speakers of English and ESL speakers. All of the correlations of the TOEFL
scores with the General Test scores were statistically (p < .05) and practically (r > .10)
significant for native speakers. For this group, the TOEFL scores' correlations with the General
Test's verbal scores were consistently highest, with moderate or high correlations ranging from
.33 to .61.
Paralleling the results for the native speakers, all of the TOEFL scores' correlations with
the General Test scores for ESL speakers were significant, and the correlations with the General
Test's verbal scores were consistently highest, with high correlations ranging from .54 to .64.
Most of the correlations were higher for ESL speakers than for native speakers, including
four pairs of correlations that were significantly different (statistically, 2 < .05, and practically,
|r1-r2| > .10) for the two groups. Three of the four pairs involved the General Test analytical
score — TOEFL total, Structure/Writing, Reading — and one involved the General Test verbal
score — TOEFL Structure/Writing. In contrast, one correlation was significantly lower for ESL
speakers: General Test quantitative with TOEFL total.
Note that all of the TOEFL scores were highly correlated, ranging from .66 to .89, and
most of the General Test scores were moderately to highly correlated, ranging from .27 to .66
(all significant).
18
Table 3
Correlations of TOEFL With GRE General Test for Native and ESL Speakers
Native Speakers
General Test
Verbal Quantitative Analytical
ESL Speakers
General
Verbal Quantitative AnalyticalTOEFL Score
Total .61 .44 .39 .64 .34 .53
Listening .44 .34 .33 .54 .25 .44
Structure/Writing .33 .19 .17 .56 .28 .44
Reading .58 .42 .35 .62 .40 .53
Note. N = 168 for native speakers and N = 3489 for ESL: speakers. All correlations are statistically (p < .05) and practically(r > .10) significant.
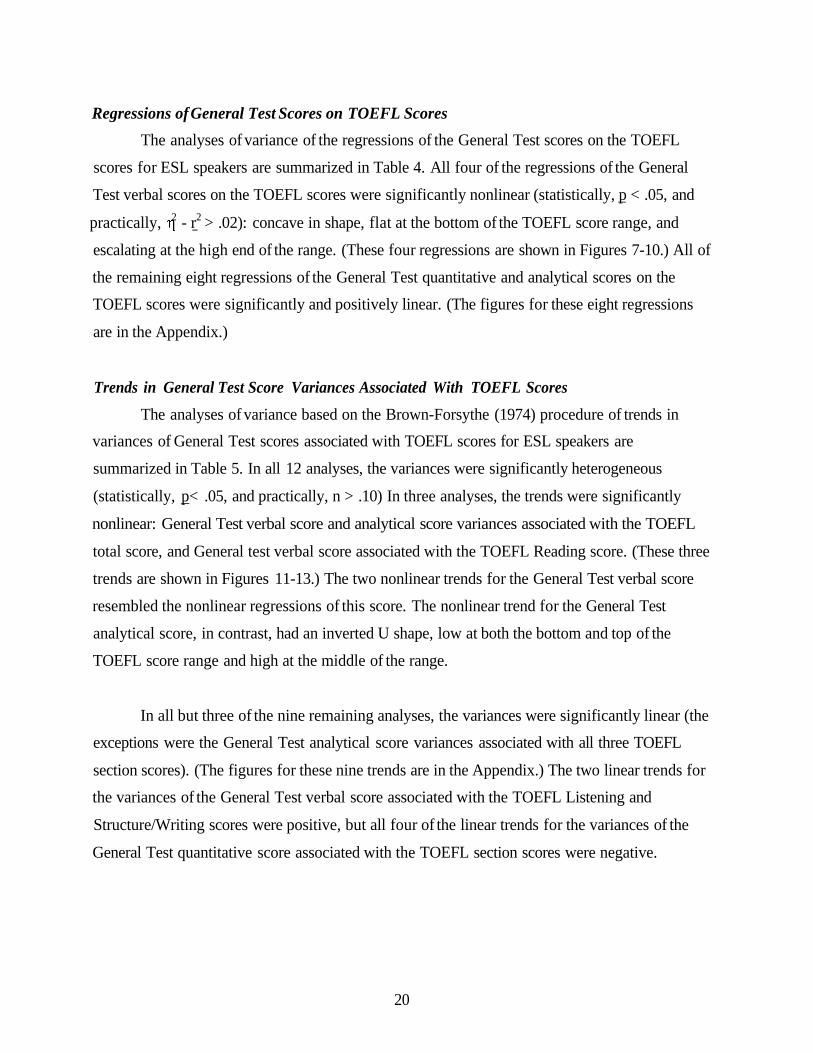
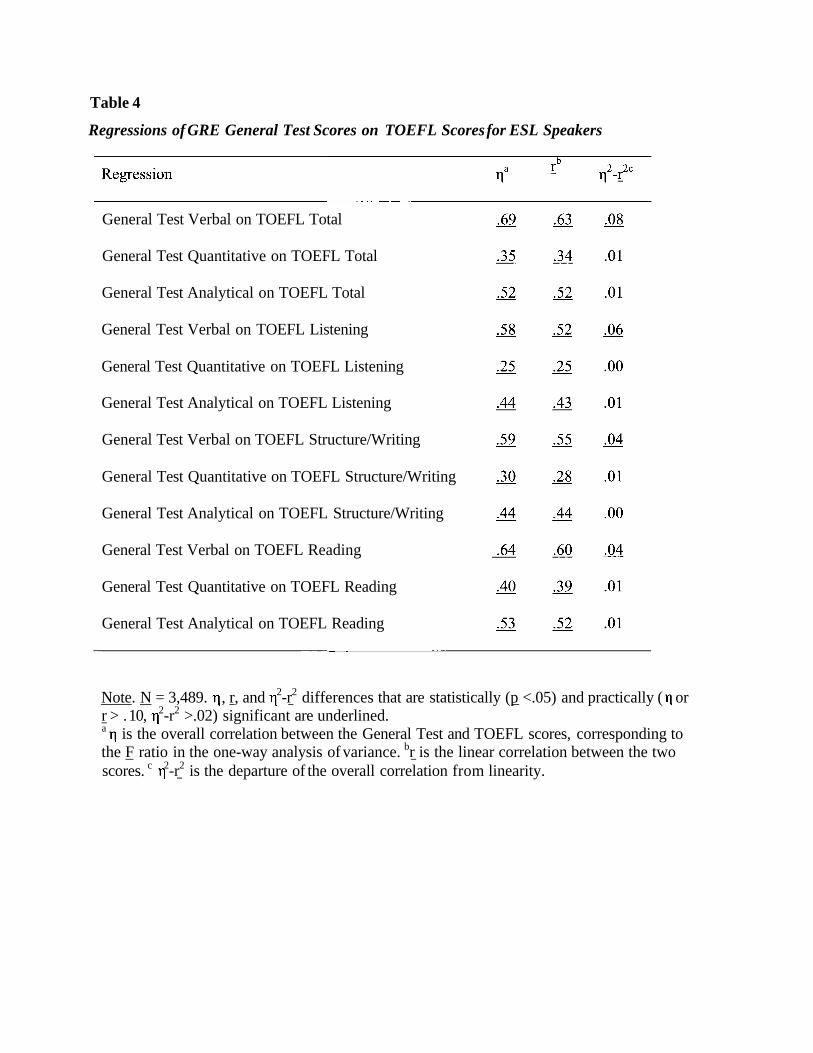
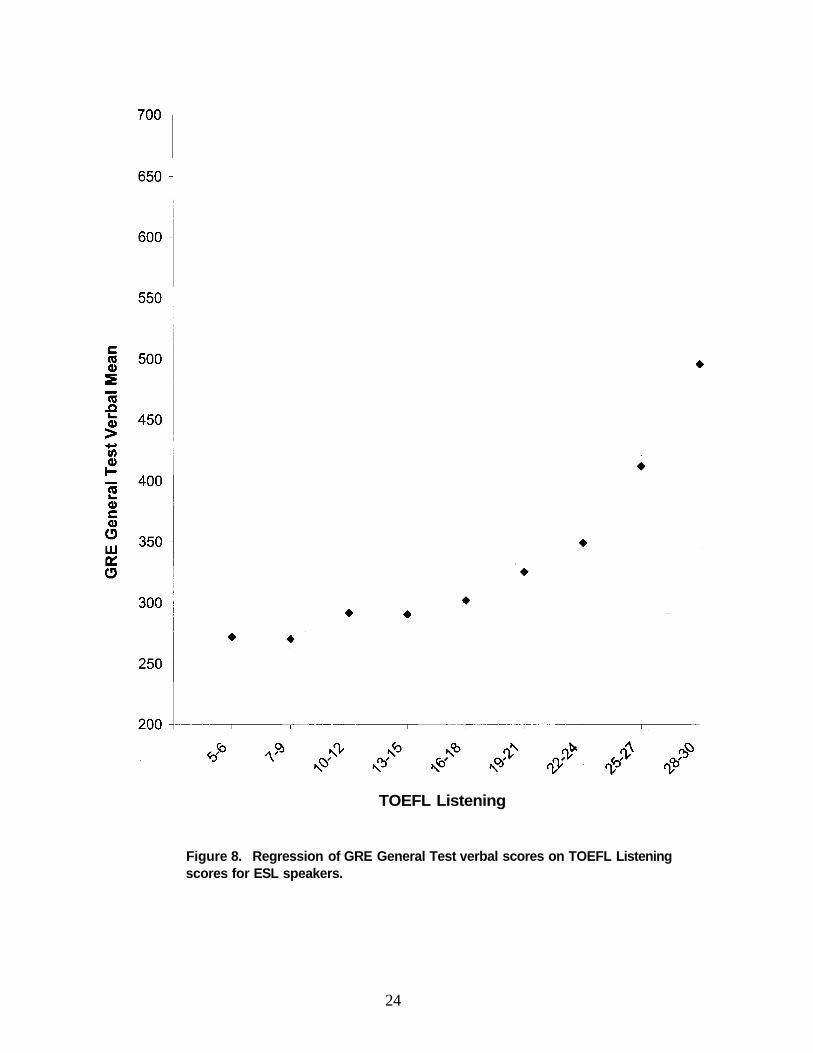
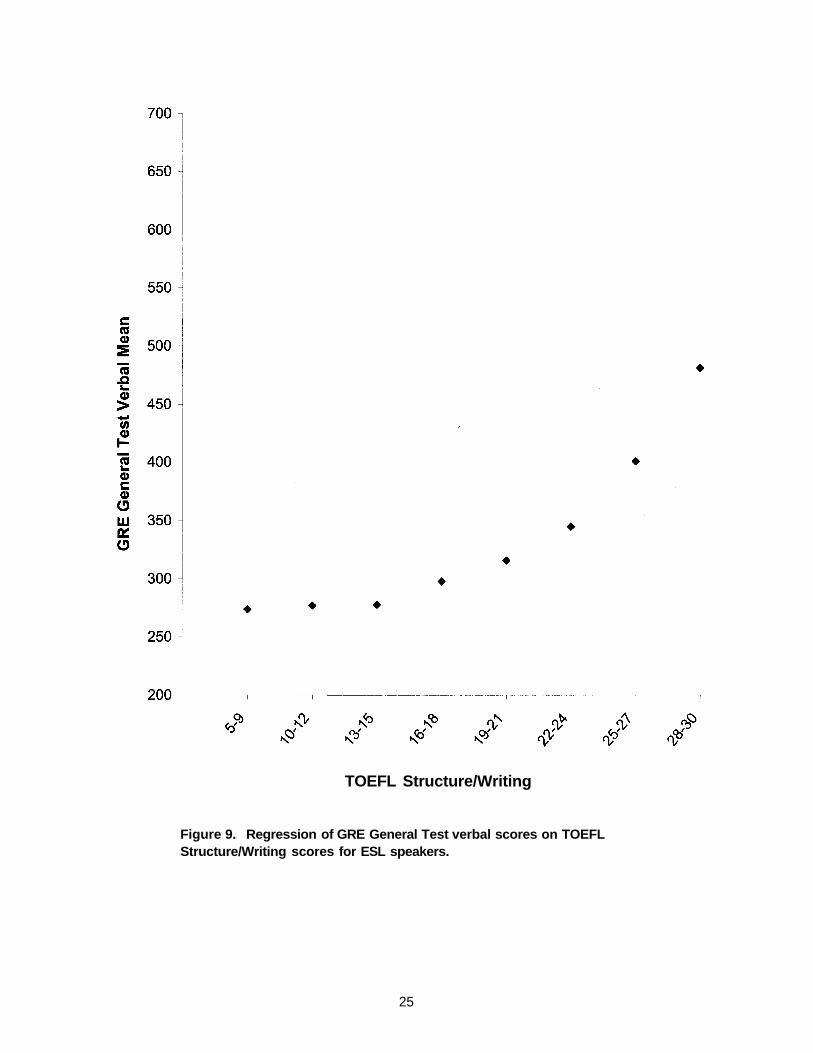
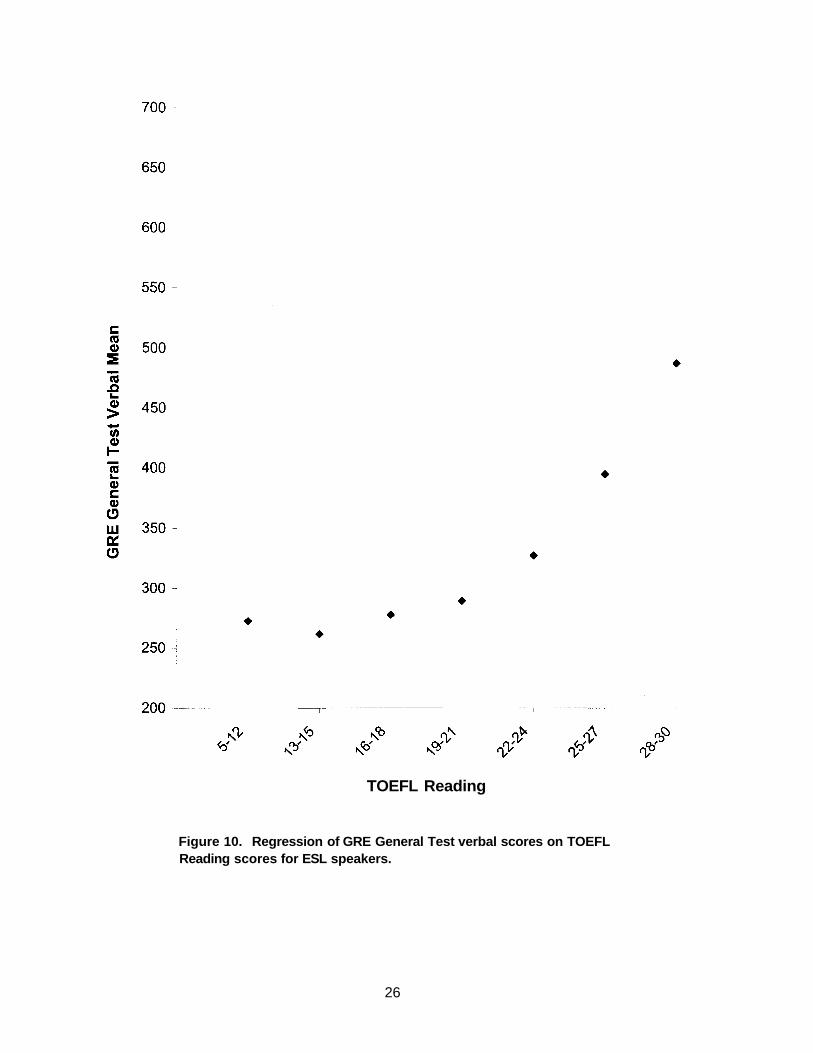
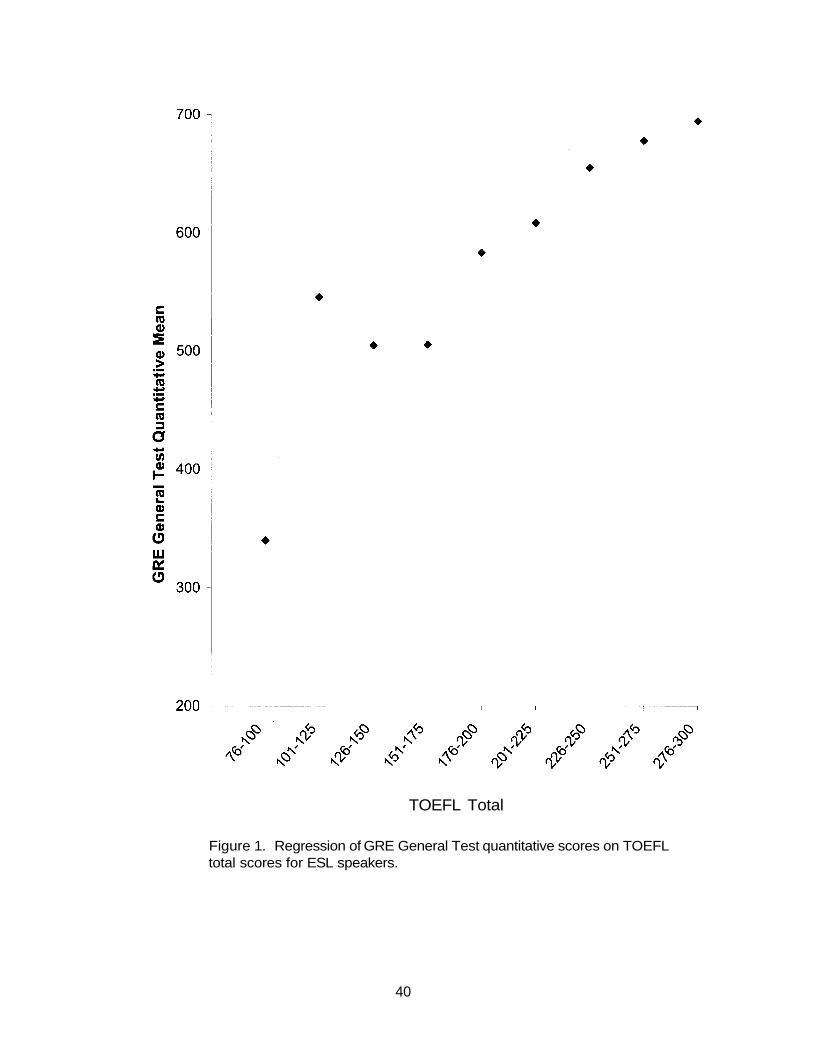
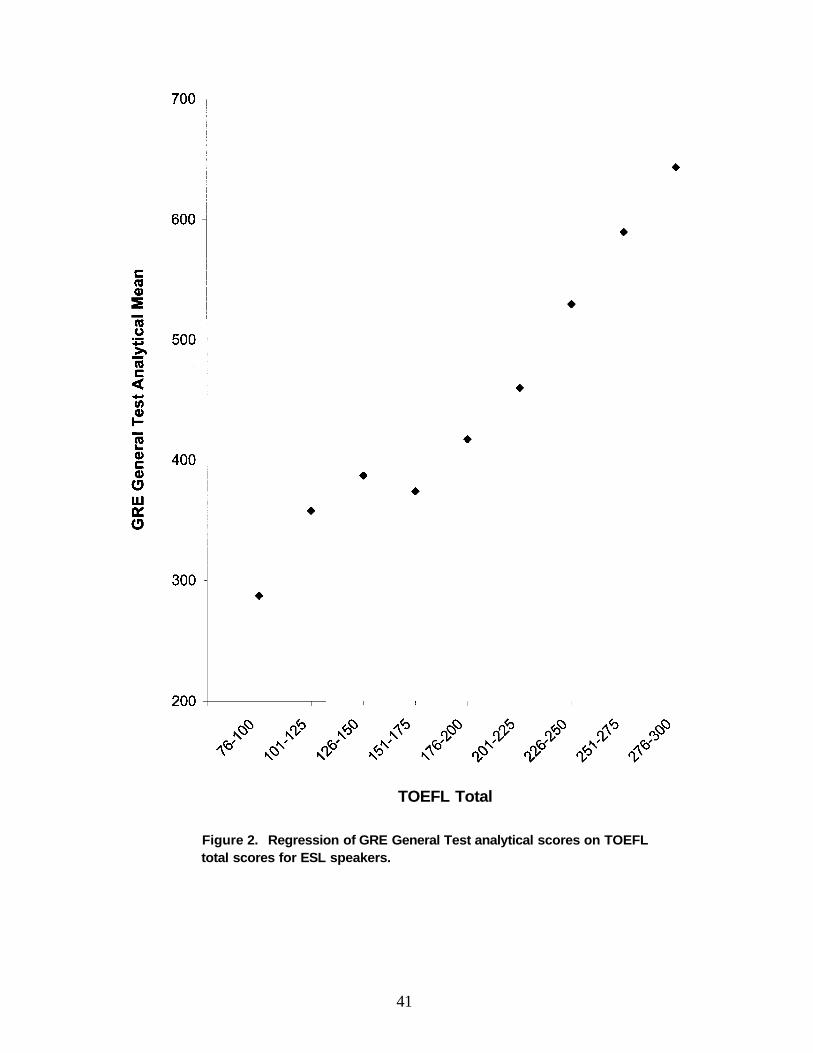
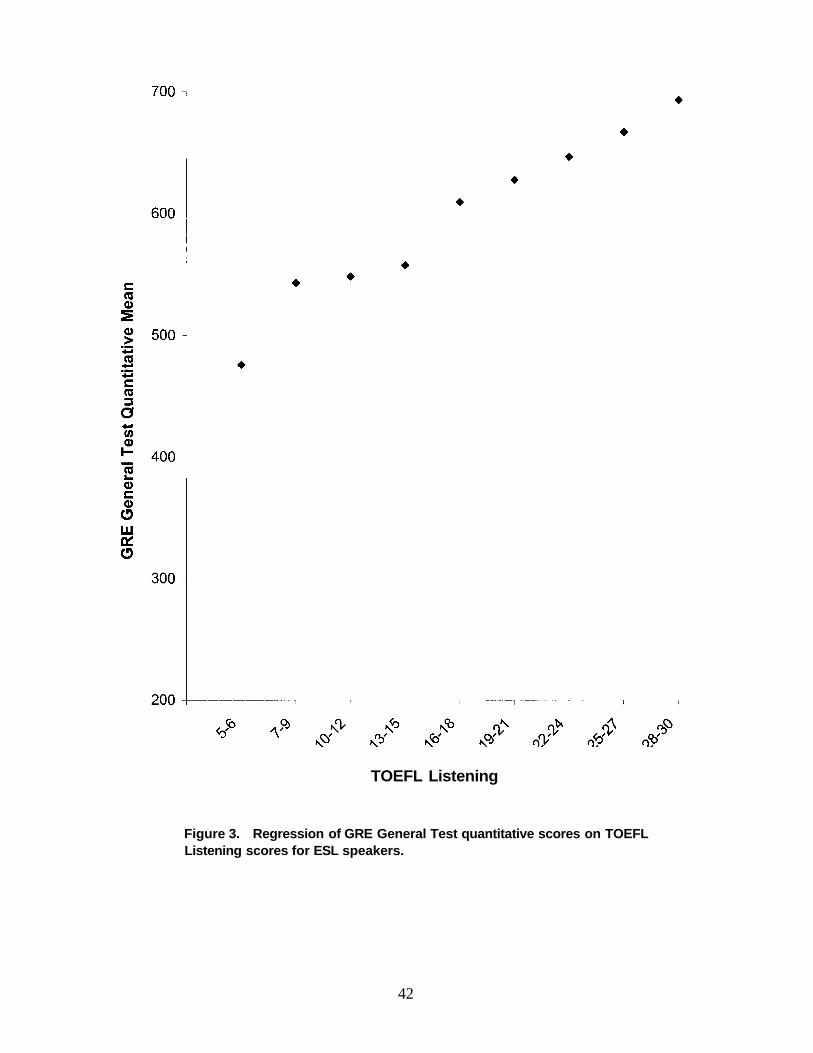
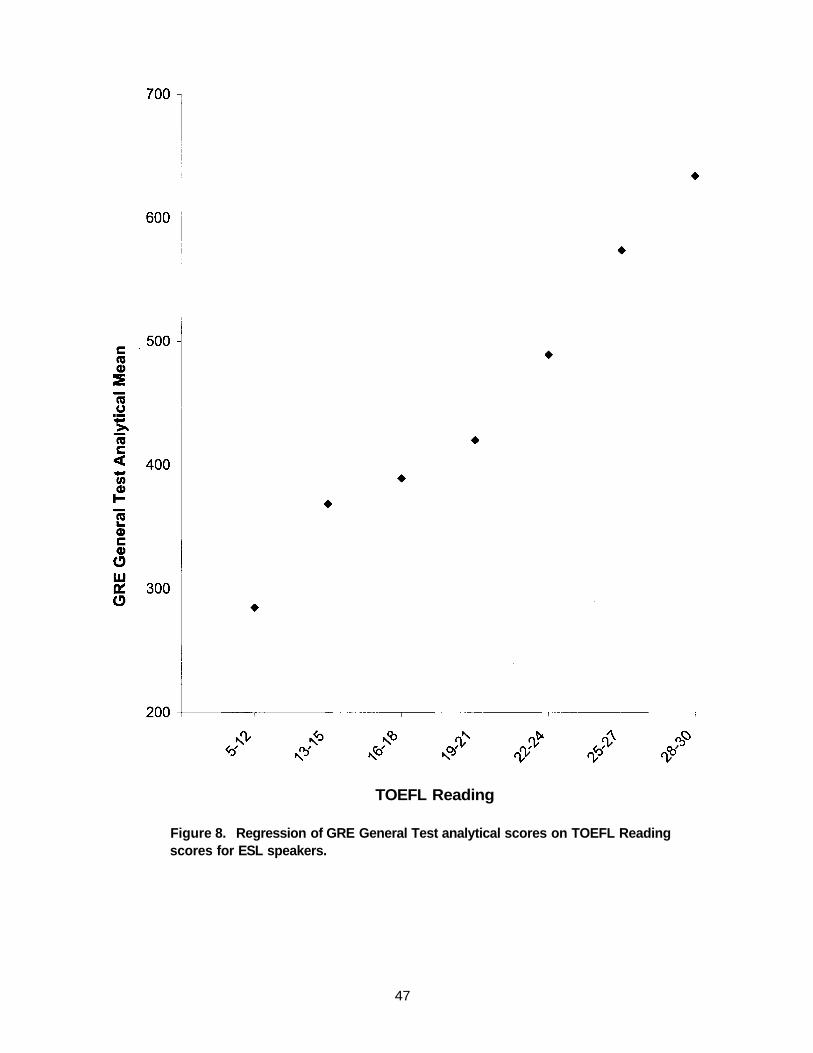
Regressions of General Test Scores on TOEFL Scores
The analyses of variance of the regressions of the General Test scores on the TOEFL
scores for ESL speakers are summarized in Table 4. All four of the regressions of the General
Test verbal scores on the TOEFL scores were significantly nonlinear (statistically, p < .05, and
practically, 2 - r2 > .02): concave in shape, flat at the bottom of the TOEFL score range, and
escalating at the high end of the range. (These four regressions are shown in Figures 7-10.) All of
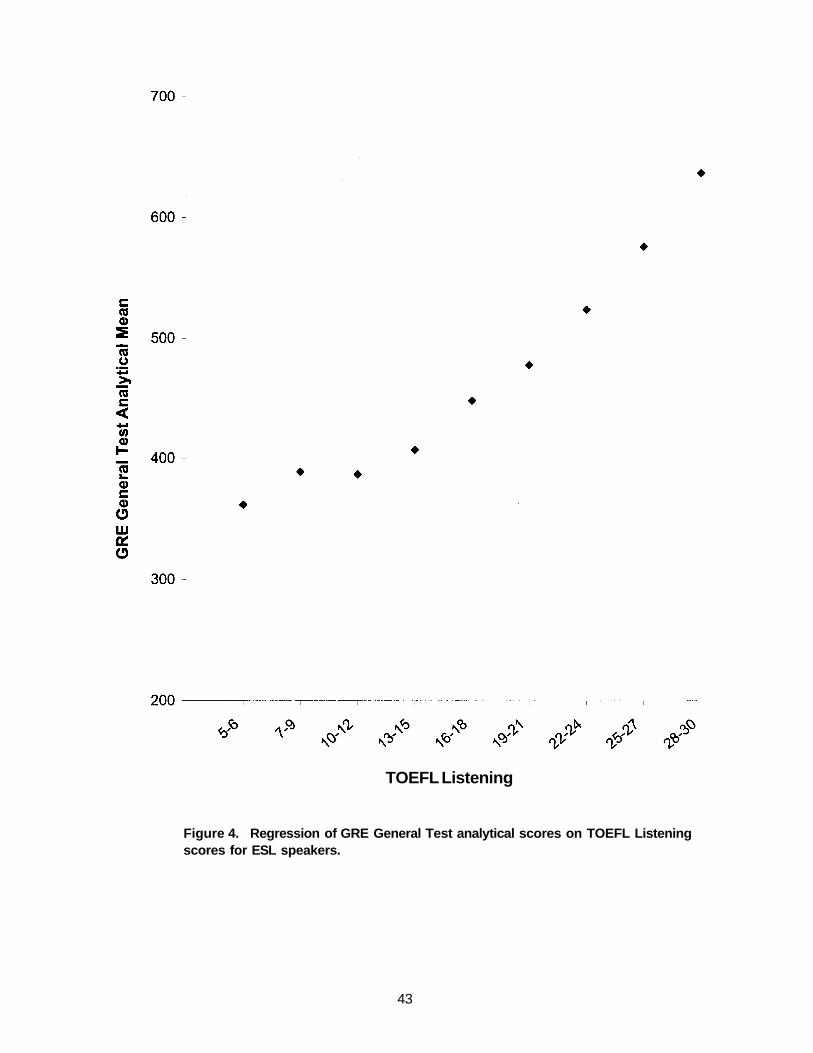
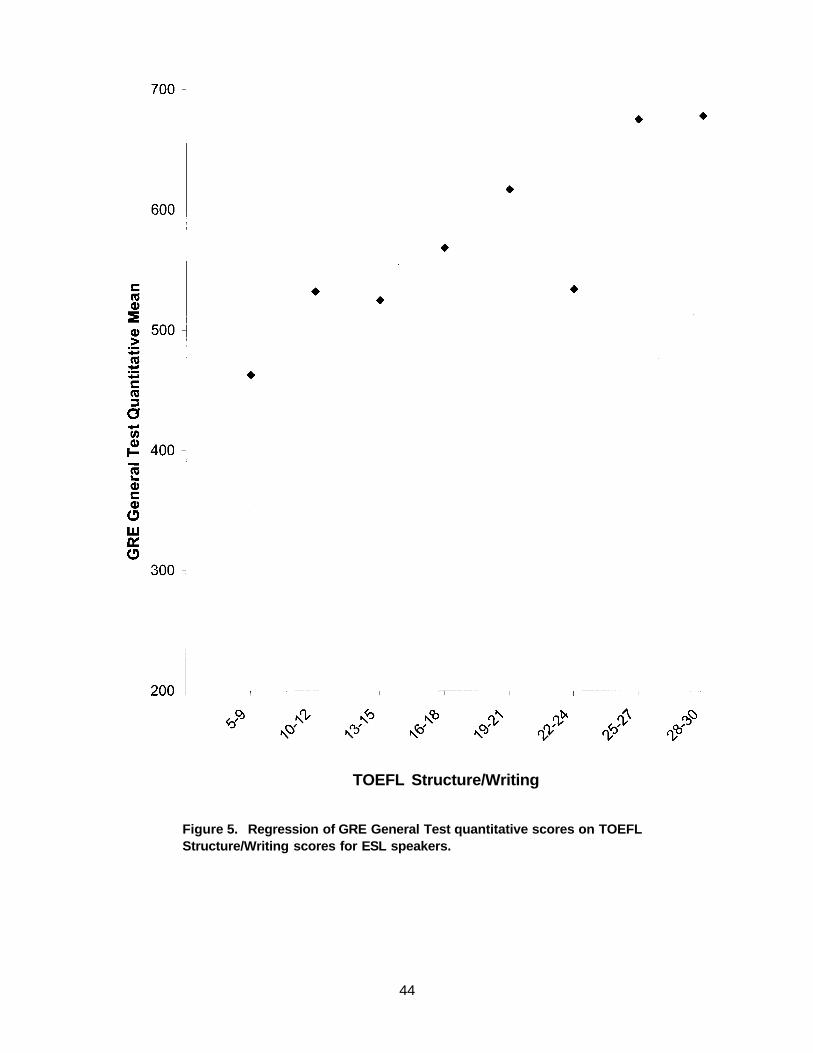
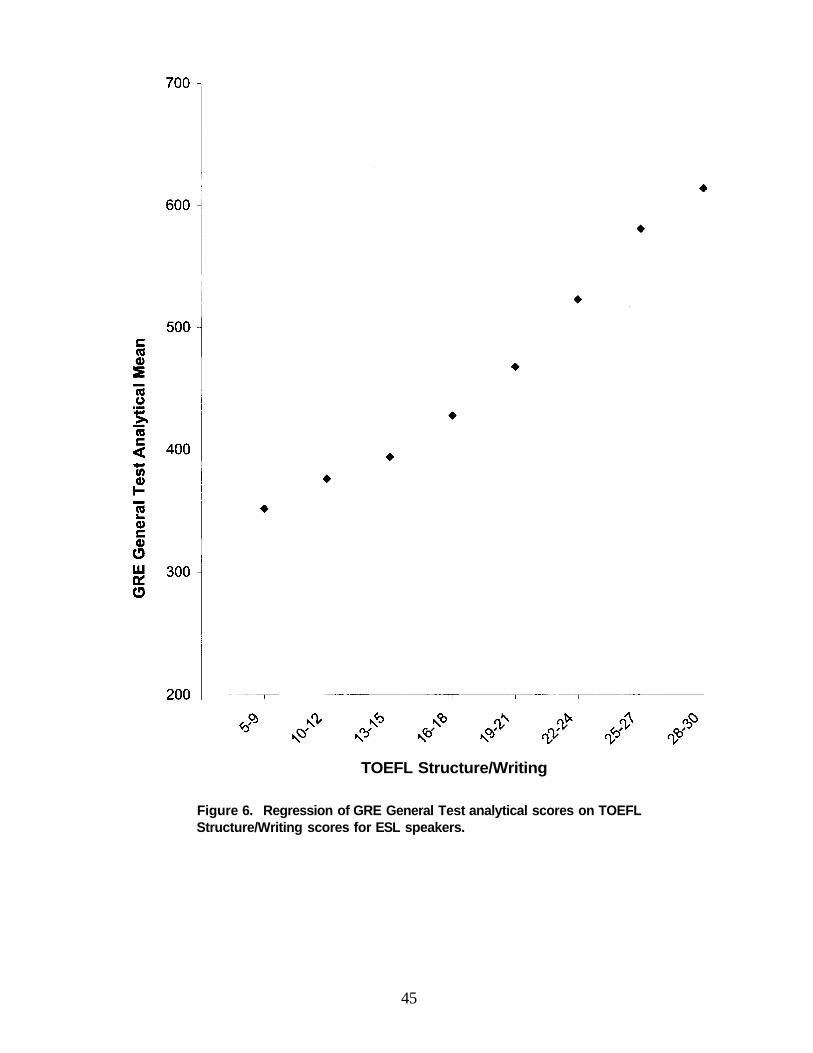
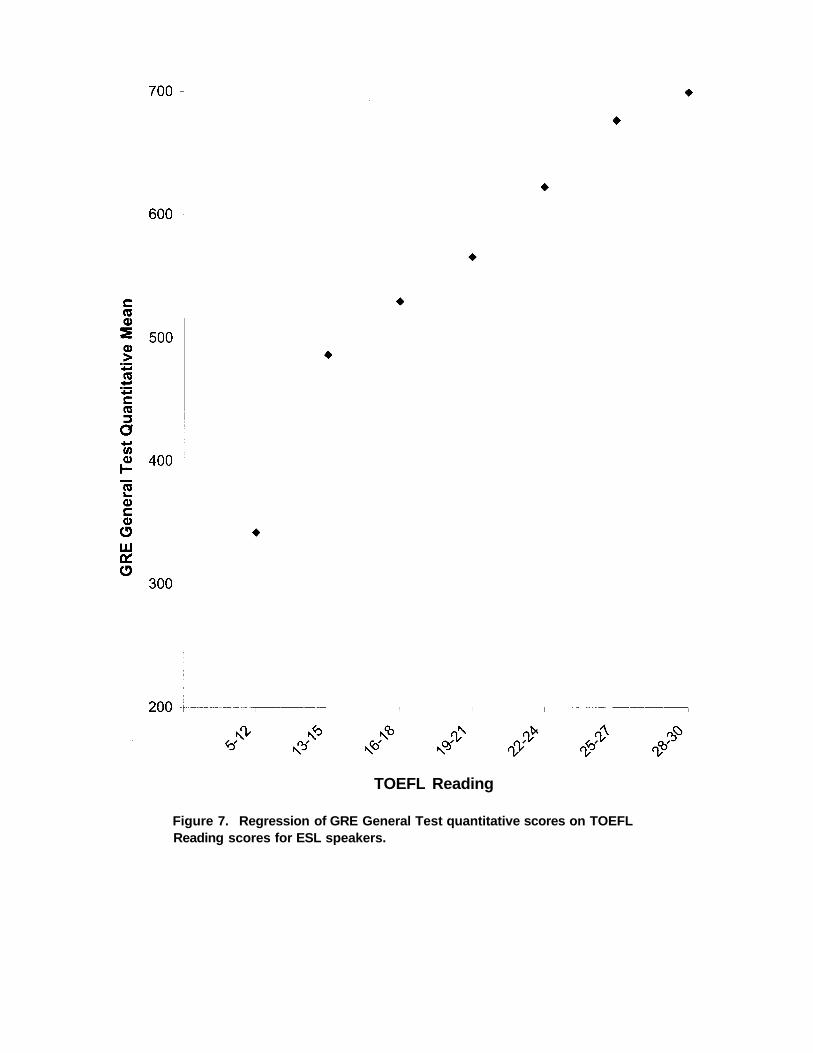
the remaining eight regressions of the General Test quantitative and analytical scores on the
TOEFL scores were significantly and positively linear. (The figures for these eight regressions
are in the Appendix.)
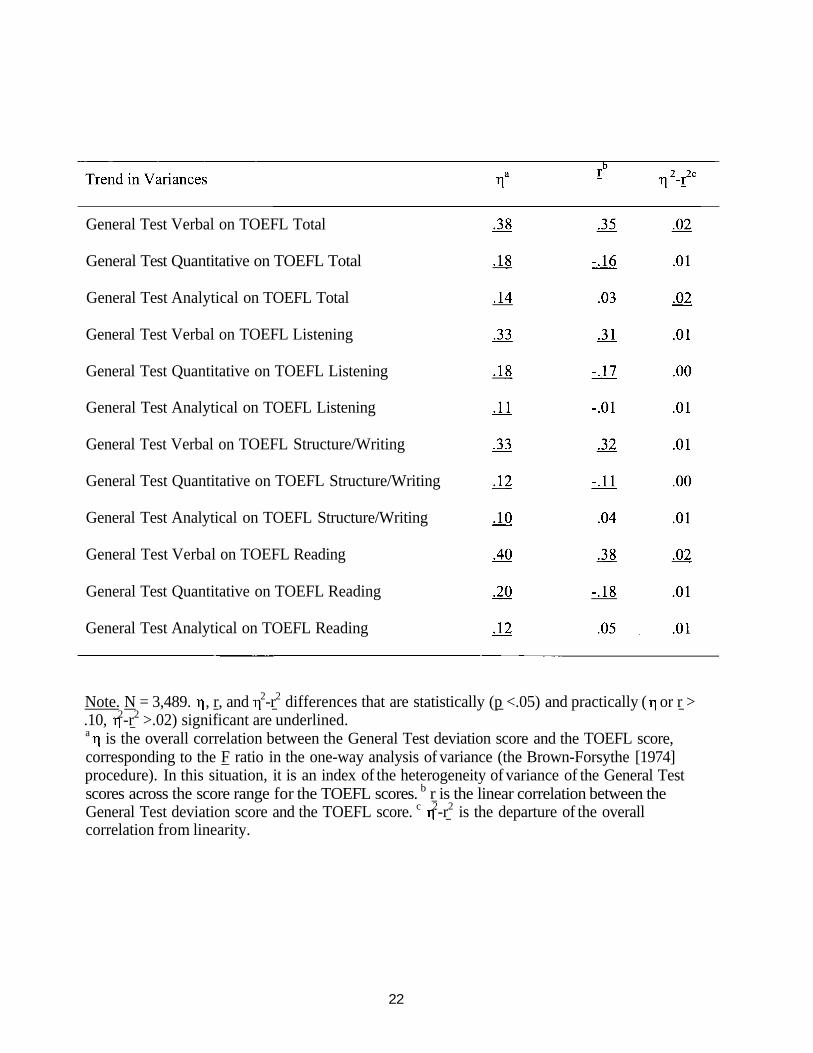
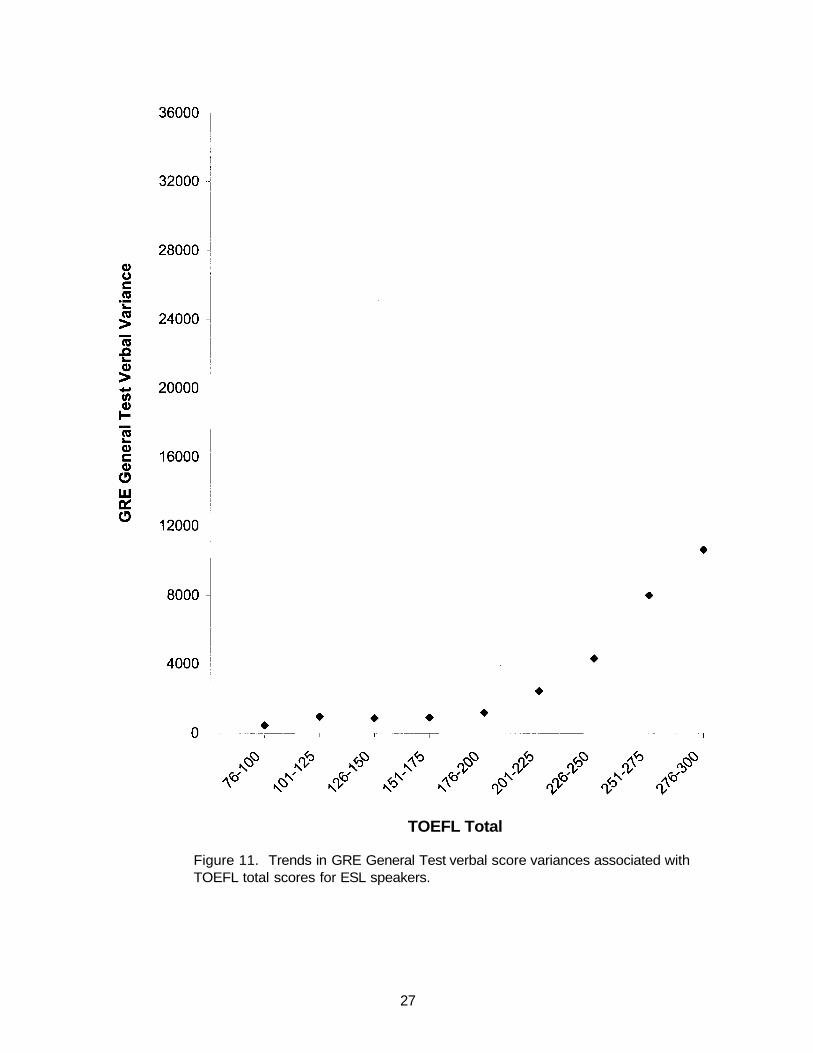
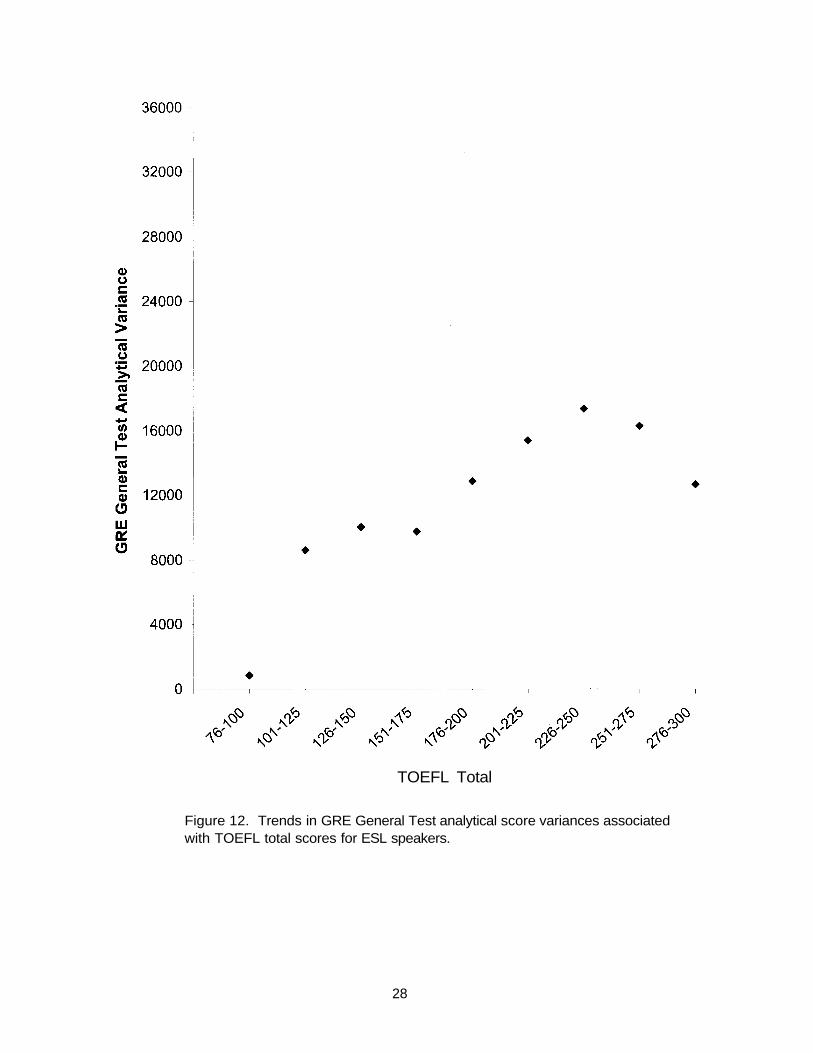
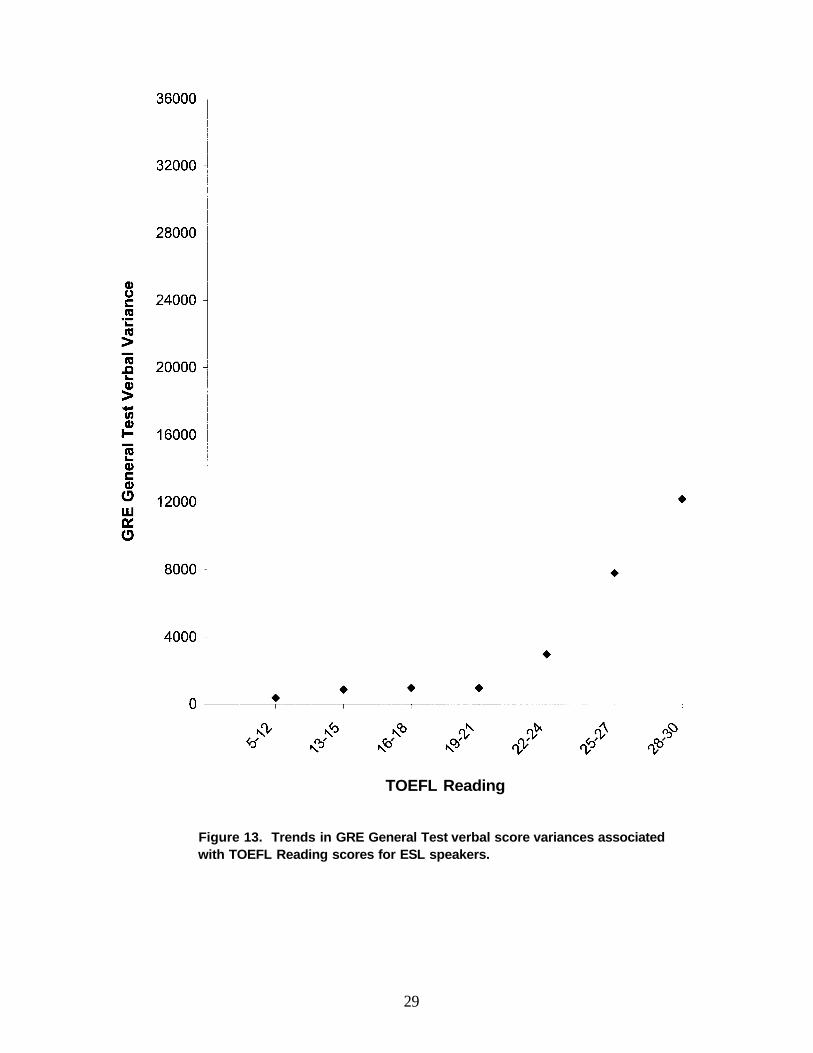
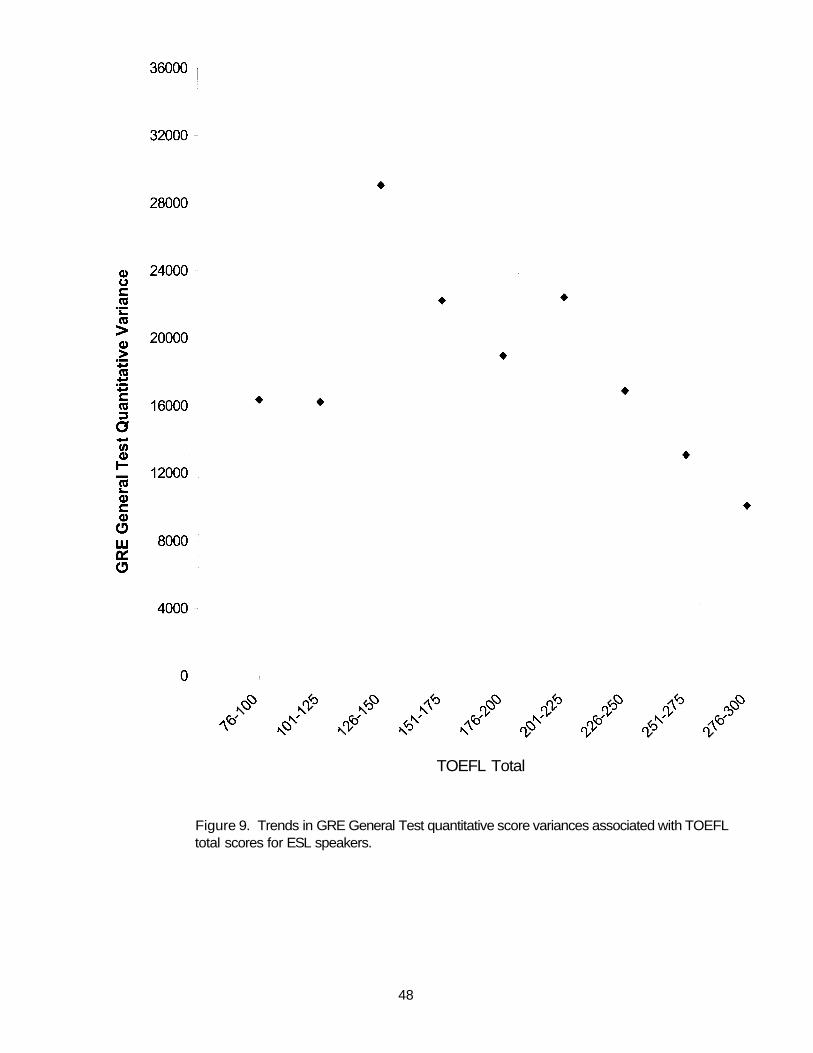
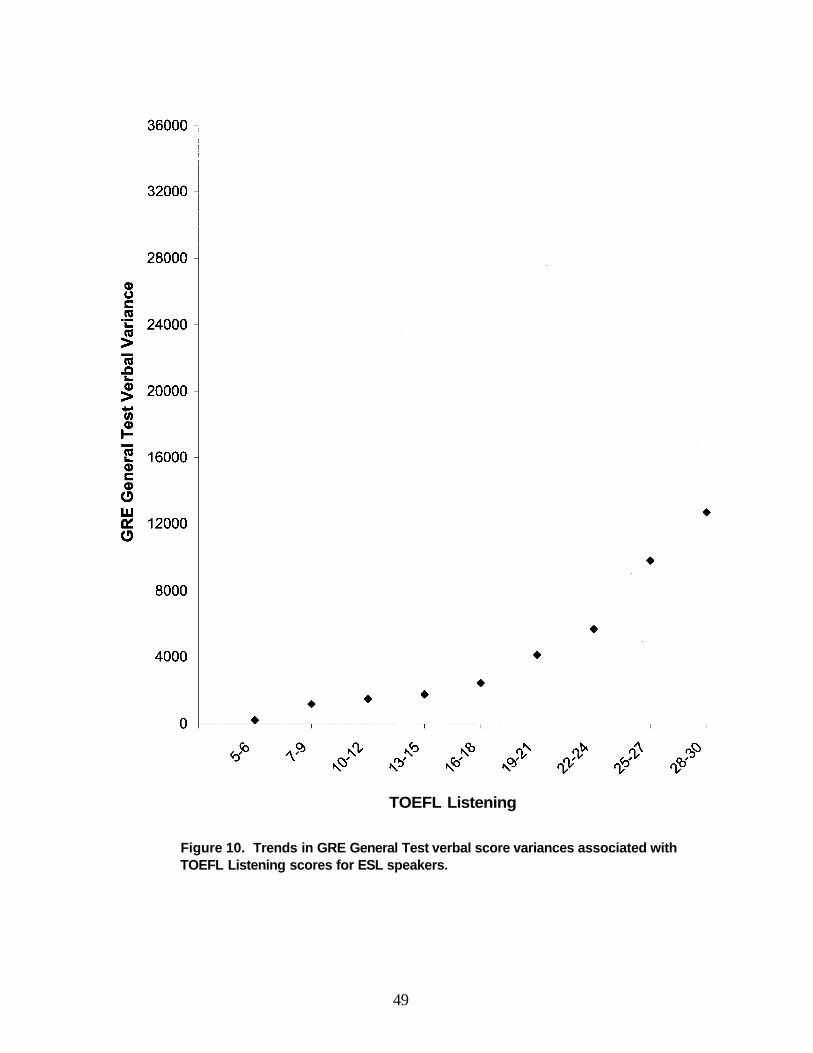
Trends in General Test Score Variances Associated With TOEFL Scores
The analyses of variance based on the Brown-Forsythe (1974) procedure of trends in
variances of General Test scores associated with TOEFL scores for ESL speakers are
summarized in Table 5. In all 12 analyses, the variances were significantly heterogeneous
(statistically, p< .05, and practically, n > .10) In three analyses, the trends were significantly
nonlinear: General Test verbal score and analytical score variances associated with the TOEFL
total score, and General test verbal score associated with the TOEFL Reading score. (These three
trends are shown in Figures 11-13.) The two nonlinear trends for the General Test verbal score
resembled the nonlinear regressions of this score. The nonlinear trend for the General Test
analytical score, in contrast, had an inverted U shape, low at both the bottom and top of the
TOEFL score range and high at the middle of the range.
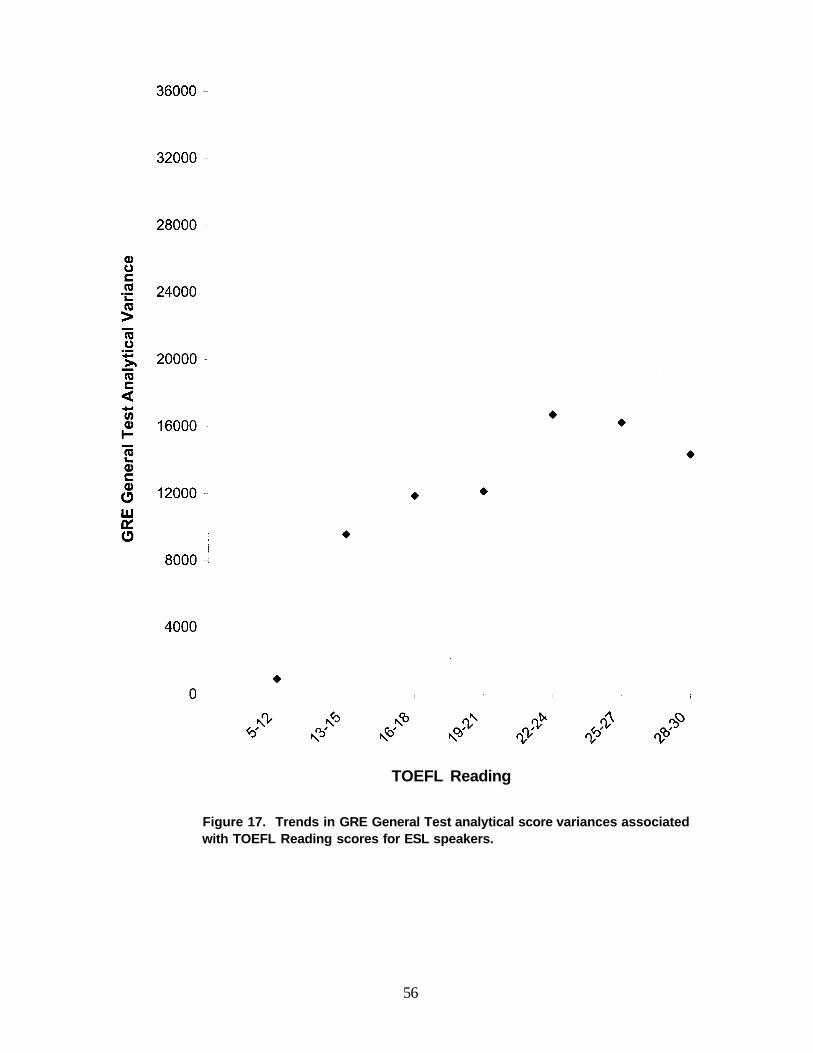
In all but three of the nine remaining analyses, the variances were significantly linear (the
exceptions were the General Test analytical score variances associated with all three TOEFL
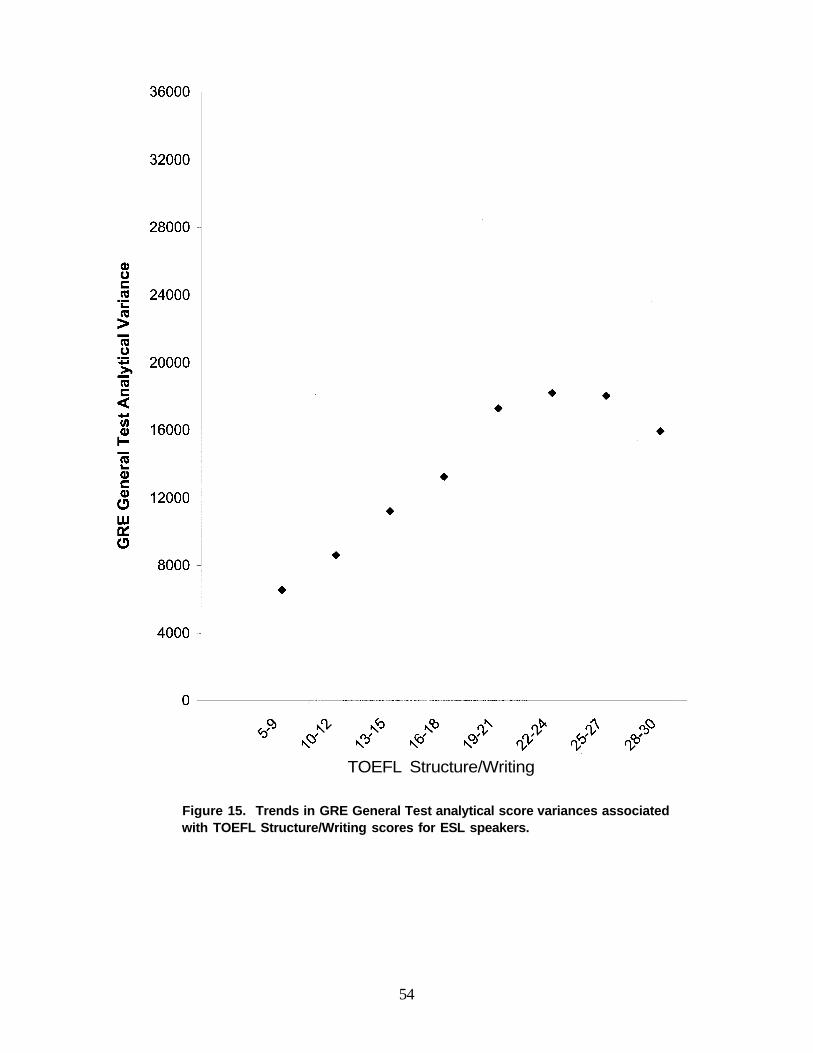
section scores). (The figures for these nine trends are in the Appendix.) The two linear trends for
the variances of the General Test verbal score associated with the TOEFL Listening and
Structure/Writing scores were positive, but all four of the linear trends for the variances of the
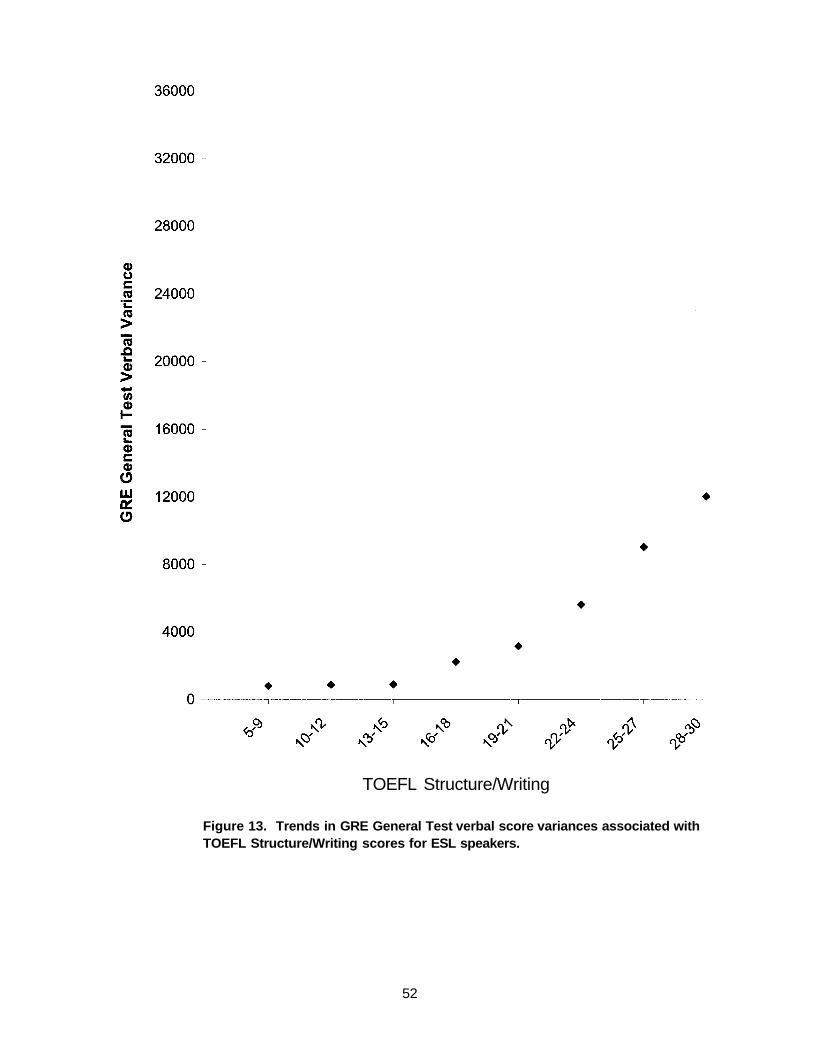
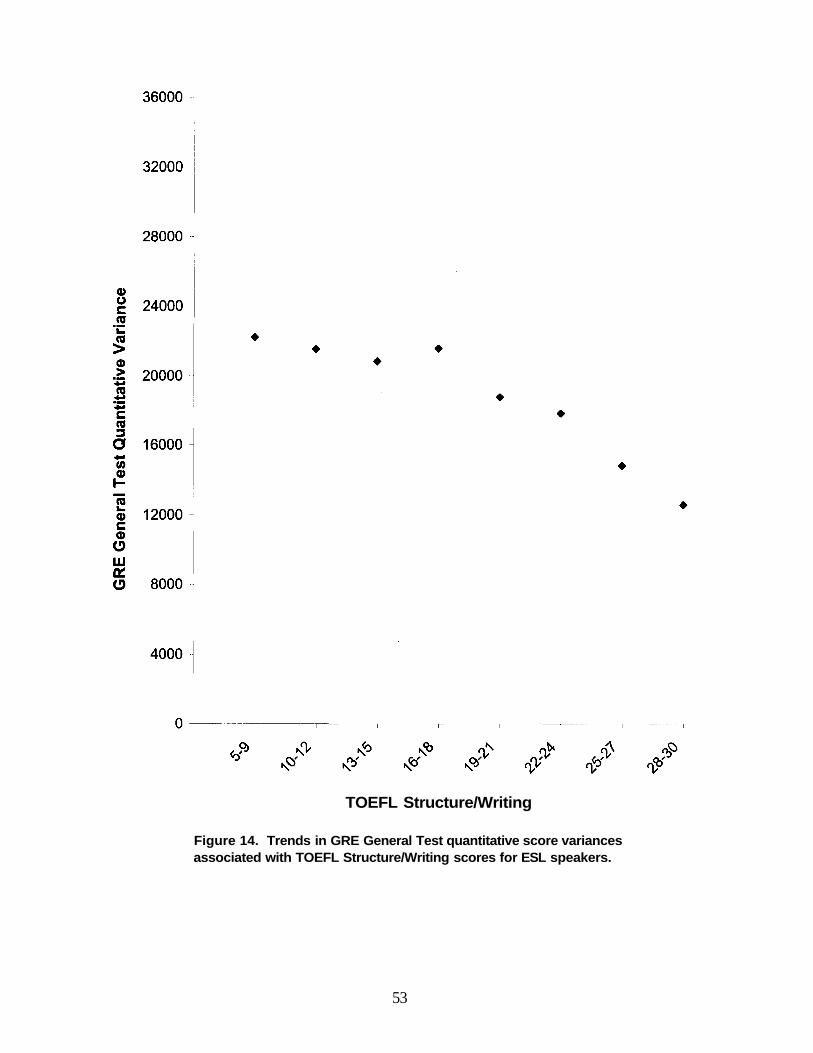
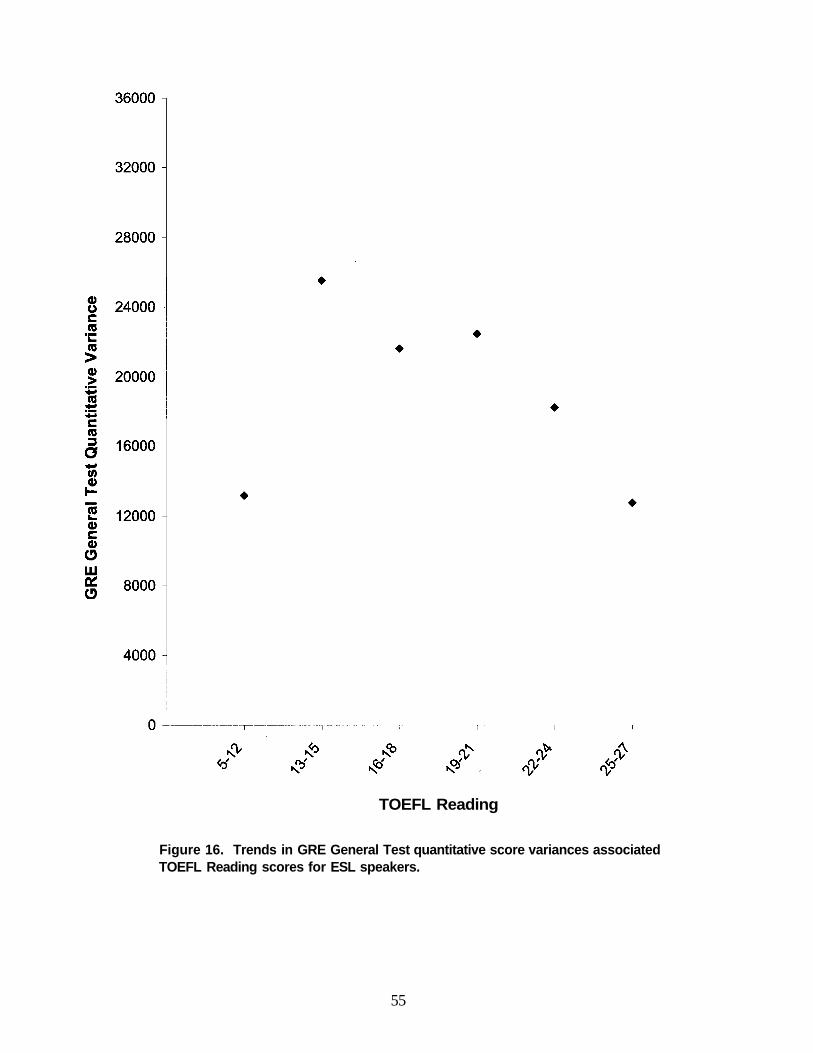
General Test quantitative score associated with the TOEFL section scores were negative.
20
Table 4
Regressions of GRE General Test Scores on TOEFL Scores for ESL Speakers
General Test Verbal on TOEFL Total
General Test Quantitative on TOEFL Total
General Test Analytical on TOEFL Total
General Test Verbal on TOEFL Listening
General Test Quantitative on TOEFL Listening
General Test Analytical on TOEFL Listening
General Test Verbal on TOEFL Structure/Writing
General Test Quantitative on TOEFL Structure/Writing
General Test Analytical on TOEFL Structure/Writing
General Test Verbal on TOEFL Reading
General Test Quantitative on TOEFL Reading
General Test Analytical on TOEFL Reading
Note. N = 3,489. , r, and 2-r2 differences that are statistically (p <.05) and practically ( orr > . 10, 2-r2 >.02) significant are underlined.a is the overall correlation between the General Test and TOEFL scores, corresponding tothe F ratio in the one-way analysis of variance. br is the linear correlation between the twoscores. c 2-r2 is the departure of the overall correlation from linearity.
General Test Verbal on TOEFL Total
General Test Quantitative on TOEFL Total
General Test Analytical on TOEFL Total
General Test Verbal on TOEFL Listening
General Test Quantitative on TOEFL Listening
General Test Analytical on TOEFL Listening
General Test Verbal on TOEFL Structure/Writing
General Test Quantitative on TOEFL Structure/Writing
General Test Analytical on TOEFL Structure/Writing
General Test Verbal on TOEFL Reading
General Test Quantitative on TOEFL Reading
General Test Analytical on TOEFL Reading
Note. N = 3,489. , r, and 2-r2 differences that are statistically (p <.05) and practically ( or r >.10, 2-r2 >.02) significant are underlined.a is the overall correlation between the General Test deviation score and the TOEFL score,corresponding to the F ratio in the one-way analysis of variance (the Brown-Forsythe [1974]procedure). In this situation, it is an index of the heterogeneity of variance of the General Testscores across the score range for the TOEFL scores. b r is the linear correlation between theGeneral Test deviation score and the TOEFL score. c 2-r2 is the departure of the overallcorrelation from linearity.
22
TOEFL Total
Figure 7. Regression of GRE General Test Verbal scores on TOEFL total scores for ESLspeakers.
23
TOEFL Listening
Figure 8. Regression of GRE General Test verbal scores on TOEFL Listeningscores for ESL speakers.
24
TOEFL Structure/Writing
Figure 9. Regression of GRE General Test verbal scores on TOEFLStructure/Writing scores for ESL speakers.
25
TOEFL Reading
Figure 10. Regression of GRE General Test verbal scores on TOEFLReading scores for ESL speakers.
26
TOEFL Total
Figure 11. Trends in GRE General Test verbal score variances associated withTOEFL total scores for ESL speakers.
27
TOEFL Total
Figure 12. Trends in GRE General Test analytical score variances associatedwith TOEFL total scores for ESL speakers.
28
TOEFL Reading
Figure 13. Trends in GRE General Test verbal score variances associatedwith TOEFL Reading scores for ESL speakers.
29
Discussion
The high correlations of the TOEFL total score with the GRE General Test verbal and
analytical scores and its moderate correlation with the General Test quantitative score for ESL
speakers are very similar to those reported previously (Wilson, 1982). The TOEFL section scores
had the same pattern of correlations in this study. (Wilson did not report correlations for section
scores.)
Although native speakers of English had the same differential pattern as ESL speakers of
correlations of TOEFL scores with General Test verbal and quantitative scores, the correlations
with the General Test analytical score were considerably lower for the native speakers than for
the ESL speakers, suggesting that the General Test analytical score has a substantial verbal load
for ESL speakers. These results for native speakers cannot be directly compared with previous
findings, for there are no other studies with both TOEFL and General Test data for such test
takers. However, Angoff and Sharon (1971) and Johnson (1977) found high correlations of the
TOEFL total score with ACT scores for native speakers.
The correlational findings for the native and ESL speakers indicate that TOEFL has
discriminant validity, given its higher correlations with the more verbally loaded sections of the
General Test, as previously noted (Wilson, 1982). These correlations actually underestimate the
associations with the verbal-loaded sections, in view of the skewness in the TOEFL scores for
native speakers and the nonlinearity in the regressions of these General Test section scores
observed in this study.3
The regression analyses uncovered the same nonlinearity for General Test verbal scores
observed previously (Angelis et al., 1979; Wilson, 1982). In contrast to the present findings for
the verbal score, the regressions were linear for the General Test quantitative and analytical
scores. In the only other study that evaluated the regressions for either of these scores (Wilson,
1982), the analytical score had a nonlinear regression. A likely explanation for this discrepancy
between the present study and the earlier one is the difference in the analytical section in the two
studies: the present study used the current two-item type version, and the previous study used the
original four-item type version.
30
The nonlinear regressions for the General Test verbal score reflect the unreliable, chance-
level scores, as pointed out previously (Angelis et al., 1979; Wilson, 1982): the verbal score
means were between 200 and 300 (on the GRE score range of 200 to 800) for test takers with
low TOEFL scores (below 200 for the TOEFL total score). In contrast, most General Test
quantitative and analytical scores were considerably higher, even for test takers with low TOEFL
scores. The elevated General Test scores reflect the quantitative content of these sections of the
test and the presumably good quantitative background of the ESL speakers (judging from
international comparisons of mathematics achievement [e.g., LaPointe, Mead, & Askew, 1992;
Medrich & Griffith, 1992; National Center for Education Statistics, 1998]), which enables them
to achieve relatively high scores on these sections of the General Test despite their limited
English proficiency.
The trends in the variances of the General Test scores are broadly congruent with the
regression analyses. The nonlinear trends in the variances for the verbal score mirror the
nonlinear regressions for this score. The unsystematic trends for the analytical score are
consistent with the linear regression for this score. The negative linear trends for the quantitative
score appears to reflect a ceiling effect: the quantitative score means were between 600 and 700
for test takers with high TOEFL scores (above 200 for the TOEFL total score). The same
positive trends in General Test verbal and analytical score variances are apparent from visual
inspection of the data reported previously (Angelis et al., 1979; Wilson, 1982); no quantitative
analyses of these trends were made.
The nonlinearity in the regressions of the General Test verbal scores and in the trends of
the variances of these scores suggests that verbal scores for test takers with low TOEFL scores
cannot be meaningfully interpreted. The linearity in the regressions and in the trends of the
variances of the General Test's quantitative and analytical scores, on the other hand, implies that
these scores can be interpreted regardless of the test takers' TOEFL scores. This latter
observation is obviously counterintuitive because both sections have verbal loads in their
instructions and in the content of their items (Powers, 1980).
31
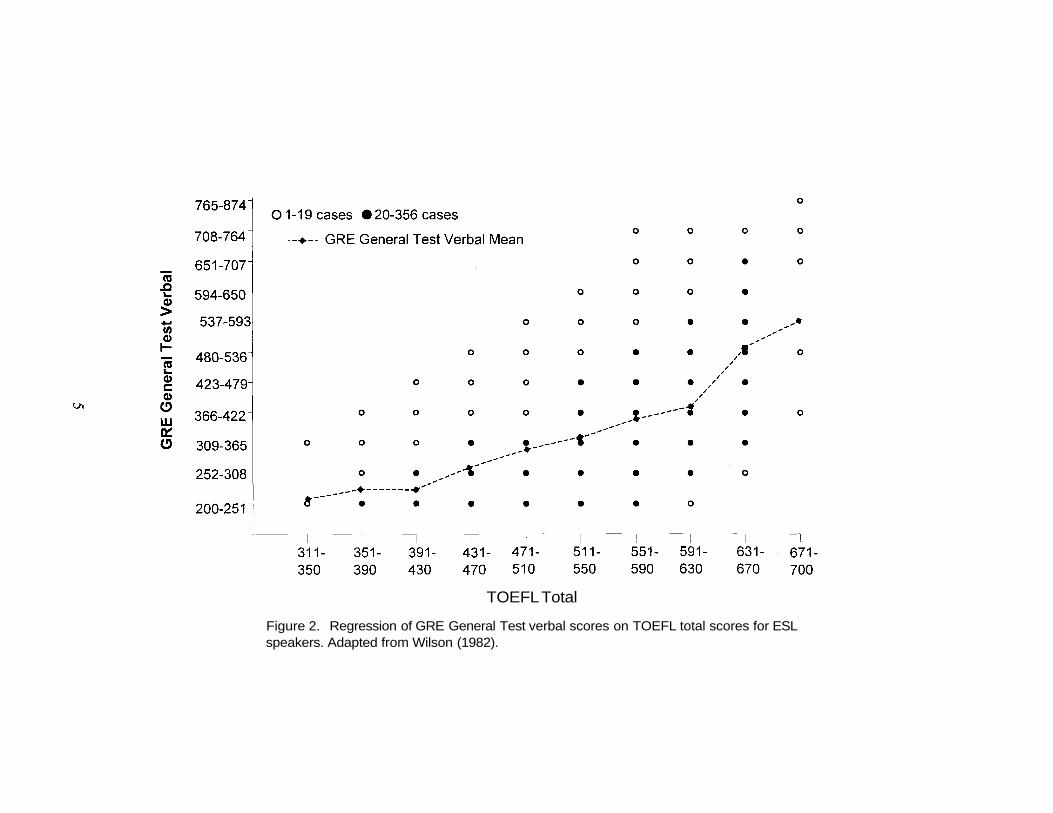
Judging from the inflection point in the nonlinear regressions and in the trends in
variances for the General Test verbal score, it appears that a minimum TOEFL total score of
approximately 200 is needed before the General Test verbal score can be interpreted. In a
previous study (Wilson, 1982), a total score of 430 on the three-section version of TOEFL (using
a different scoring metric from that used for the computer-based version) was identified in the
same way from a regression analysis of the General Test verbal score. Precise comparisons of the
two TOEFL total scores cannot be made because of differences in the scoring metrics, tests, and
test-taking populations, but the present score seems to reflect a higher level of English
proficiency. This score of 200 is 1.37 standard deviations below the mean of the sample and cuts
off the bottom 10% of the distribution; the other score, of 430, is 2.08 standard deviations below
the mean and cuts off the bottom 4%.
General Conclusion
The findings from these two studies are remarkably consistent with previous results,
despite important changes in the delivery format and content of TOEFL and the General Test and
in the test-taking population. Taken together, the findings support the construct validity of
TOEFL and illuminate its interplay with ability tests for ESL test takers.
Although these results were based on the General Test population, it seems likely that
comparable outcomes would be obtained with other test takers and other tests, given the general
resemblance between these findings and earlier results with ACT, SAT, and GMAT test takers
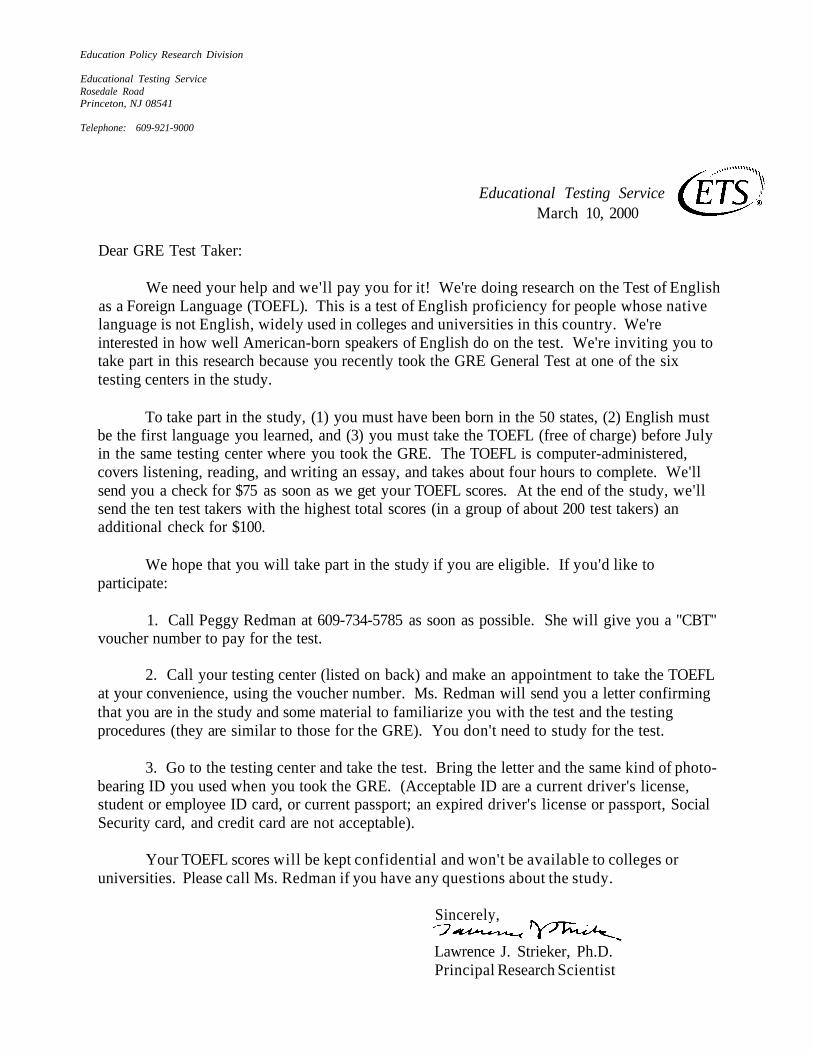
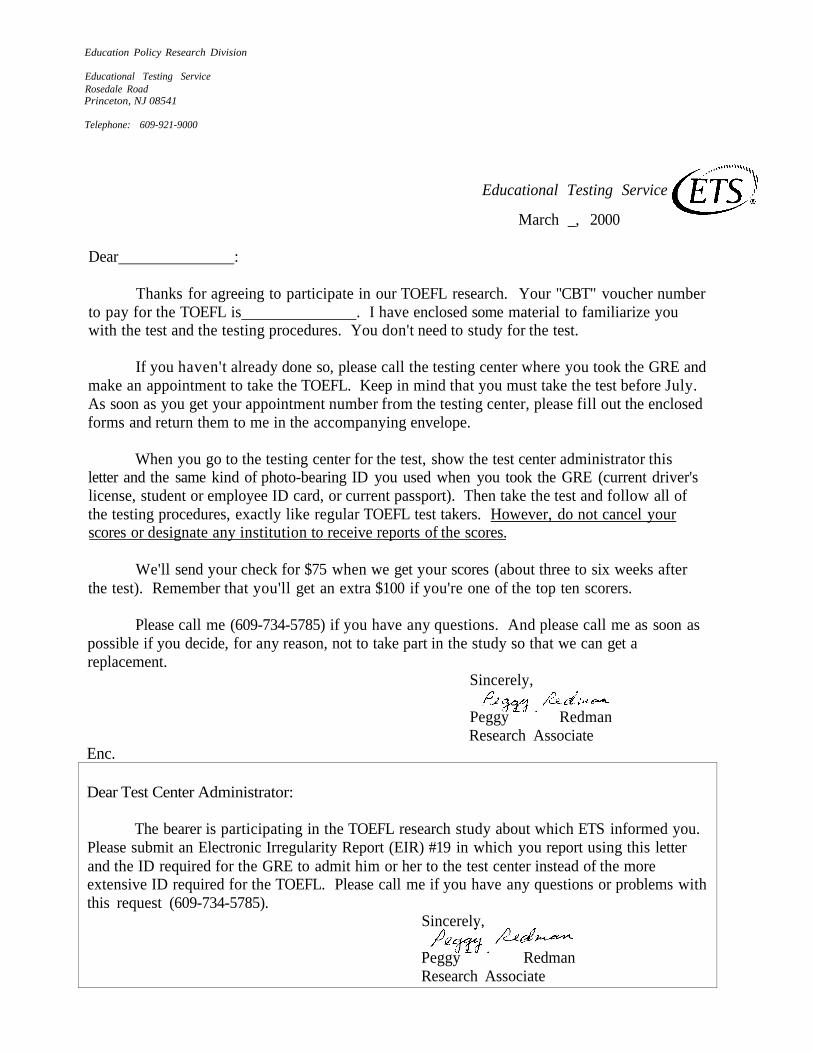
We need your help and we'll pay you for it! We're doing research on the Test of Englishas a Foreign Language (TOEFL). This is a test of English proficiency for people whose nativelanguage is not English, widely used in colleges and universities in this country. We'reinterested in how well American-born speakers of English do on the test. We're inviting you totake part in this research because you recently took the GRE General Test at one of the sixtesting centers in the study.
To take part in the study, (1) you must have been born in the 50 states, (2) English mustbe the first language you learned, and (3) you must take the TOEFL (free of charge) before Julyin the same testing center where you took the GRE. The TOEFL is computer-administered,covers listening, reading, and writing an essay, and takes about four hours to complete. We'llsend you a check for $75 as soon as we get your TOEFL scores. At the end of the study, we'llsend the ten test takers with the highest total scores (in a group of about 200 test takers) anadditional check for $100.
We hope that you will take part in the study if you are eligible. If you'd like toparticipate:
1. Call Peggy Redman at 609-734-5785 as soon as possible. She will give you a "CBT"voucher number to pay for the test.
2. Call your testing center (listed on back) and make an appointment to take the TOEFLat your convenience, using the voucher number. Ms. Redman will send you a letter confirmingthat you are in the study and some material to familiarize you with the test and the testingprocedures (they are similar to those for the GRE). You don't need to study for the test.
3. Go to the testing center and take the test. Bring the letter and the same kind of photo-bearing ID you used when you took the GRE. (Acceptable ID are a current driver's license,student or employee ID card, or current passport; an expired driver's license or passport, SocialSecurity card, and credit card are not acceptable).
Your TOEFL scores will be kept confidential and won't be available to colleges oruniversities. Please call Ms. Redman if you have any questions about the study.
Sincerely,
Lawrence J. Strieker, Ph.D.Principal Research Scientist
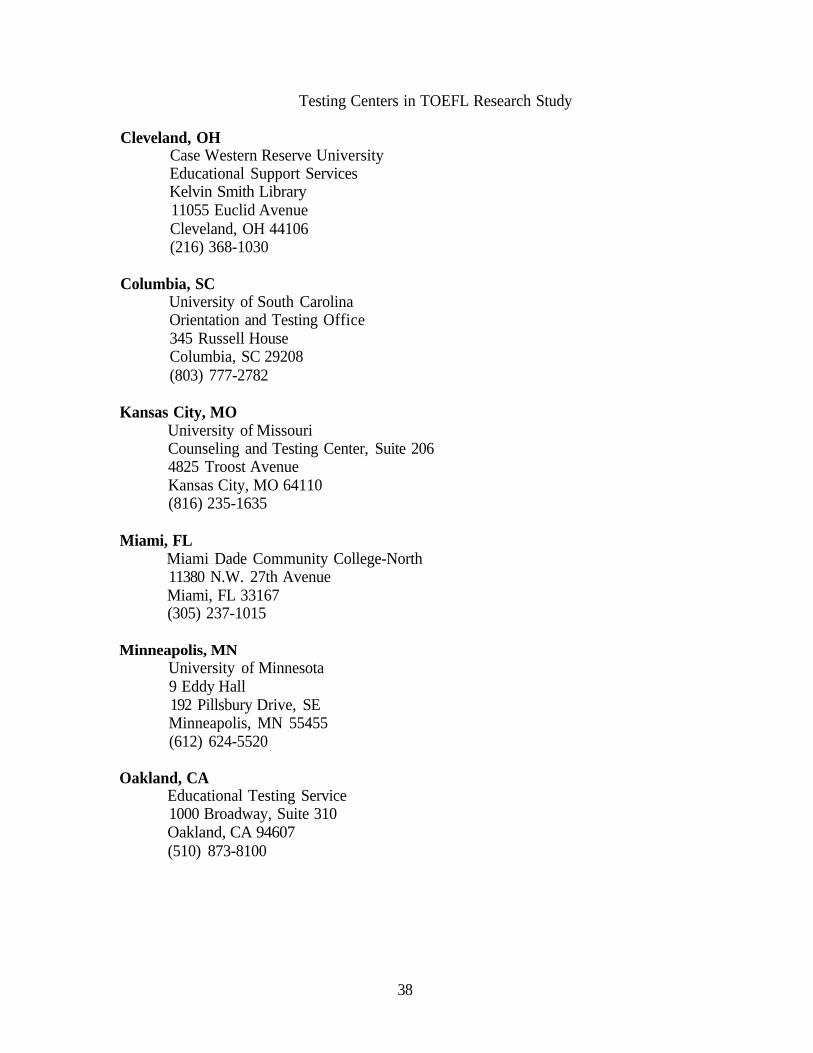
Testing Centers in TOEFL Research Study
Cleveland, OHCase Western Reserve UniversityEducational Support ServicesKelvin Smith Library11055 Euclid AvenueCleveland, OH 44106(216) 368-1030
Columbia, SCUniversity of South CarolinaOrientation and Testing Office345 Russell HouseColumbia, SC 29208(803) 777-2782
Kansas City, MOUniversity of MissouriCounseling and Testing Center, Suite 2064825 Troost AvenueKansas City, MO 64110(816) 235-1635
Thanks for agreeing to participate in our TOEFL research. Your "CBT" voucher numberto pay for the TOEFL is . I have enclosed some material to familiarize youwith the test and the testing procedures. You don't need to study for the test.
If you haven't already done so, please call the testing center where you took the GRE andmake an appointment to take the TOEFL. Keep in mind that you must take the test before July.As soon as you get your appointment number from the testing center, please fill out the enclosedforms and return them to me in the accompanying envelope.
When you go to the testing center for the test, show the test center administrator thisletter and the same kind of photo-bearing ID you used when you took the GRE (current driver'slicense, student or employee ID card, or current passport). Then take the test and follow all ofthe testing procedures, exactly like regular TOEFL test takers. However, do not cancel yourscores or designate any institution to receive reports of the scores.
We'll send your check for $75 when we get your scores (about three to six weeks afterthe test). Remember that you'll get an extra $100 if you're one of the top ten scorers.
Please call me (609-734-5785) if you have any questions. And please call me as soon aspossible if you decide, for any reason, not to take part in the study so that we can get areplacement.
Educational Testing Service
March _, 2000
Sincerely,
Peggy RedmanResearch Associate
Enc.
Dear Test Center Administrator:
The bearer is participating in the TOEFL research study about which ETS informed you.Please submit an Electronic Irregularity Report (EIR) #19 in which you report using this letterand the ID required for the GRE to admit him or her to the test center instead of the moreextensive ID required for the TOEFL. Please call me if you have any questions or problems withthis request (609-734-5785).
Sincerely,
Peggy RedmanResearch Associate
TOEFL Total
Figure 1. Regression of GRE General Test quantitative scores on TOEFLtotal scores for ESL speakers.
40
TOEFL Total
Figure 2. Regression of GRE General Test analytical scores on TOEFLtotal scores for ESL speakers.
41
TOEFL Listening
Figure 3. Regression of GRE General Test quantitative scores on TOEFLListening scores for ESL speakers.
42
TOEFL Listening
Figure 4. Regression of GRE General Test analytical scores on TOEFL Listeningscores for ESL speakers.
43
TOEFL Structure/Writing
Figure 5. Regression of GRE General Test quantitative scores on TOEFLStructure/Writing scores for ESL speakers.
44
TOEFL Structure/Writing
Figure 6. Regression of GRE General Test analytical scores on TOEFLStructure/Writing scores for ESL speakers.
45
TOEFL Reading
Figure 7. Regression of GRE General Test quantitative scores on TOEFLReading scores for ESL speakers.
TOEFL Reading
Figure 8. Regression of GRE General Test analytical scores on TOEFL Readingscores for ESL speakers.
47
TOEFL Total
Figure 9. Trends in GRE General Test quantitative score variances associated with TOEFLtotal scores for ESL speakers.
48
TOEFL Listening
Figure 10. Trends in GRE General Test verbal score variances associated withTOEFL Listening scores for ESL speakers.
49
TOEFL Listening
Figure 11. Trends in GRE General Test quantitative score variances associatedwith TOEFL Listening scores for ESL speakers.
50
TOEFL Listening
Figure 12. Trends in GRE General Test analytical score variances associatedwith TOEFL Listening scores for ESL speakers.
51
TOEFL Structure/Writing
Figure 13. Trends in GRE General Test verbal score variances associated withTOEFL Structure/Writing scores for ESL speakers.
52
TOEFL Structure/Writing
Figure 14. Trends in GRE General Test quantitative score variancesassociated with TOEFL Structure/Writing scores for ESL speakers.
53
TOEFL Structure/Writing
Figure 15. Trends in GRE General Test analytical score variances associatedwith TOEFL Structure/Writing scores for ESL speakers.
54
TOEFL Reading
Figure 16. Trends in GRE General Test quantitative score variances associatedTOEFL Reading scores for ESL speakers.
55
TOEFL Reading
Figure 17. Trends in GRE General Test analytical score variances associatedwith TOEFL Reading scores for ESL speakers.