Coca-Cola West Company, Limited (2579) May 2, 2013 Results briefing for the 1 st quarter of Fiscal Year ending December 2013 [Contact] Planning Department (IR team) TEL 092-641-8774 FAX 092-641-9128 [URL] http: //www.ccwest.co.jp/english [E-mail] [email protected]
Transcript
Coca-Cola West Company, Limited (2579)
May 2, 2013
Results briefing for the 1st quarter of Fiscal Year ending December 2013
I. Overview of account settlement for the 1I. Overview of account settlement for the 1stst quarterquarter
II. Activity Plan for the 2II. Activity Plan for the 2ndnd quarterquarter
III. Making Minami Kyushu CCBC a whollyIII. Making Minami Kyushu CCBC a wholly--owned subsidiaryowned subsidiary
IV. FullIV. Full--year Business Planyear Business Plan
[Reference]
Trend of OTC market share
Mix by brand/by channel
Sales update on vending machines by channel
Q1 Actual sales volume (by channel and by package)
Q2 Volume plan
Performance trend / managerial KPI trend
Coca-Cola System in Japan / Affiliated companies
(Note) Change in the segment indication
From the existing Q‘sai business indicated as “health-food business“, we have changed the segment indication to ”Healthcare & Skincare business” from 2013 as their non health-food, skincare products(Colla rich series) has grown to make up more than 30% of their revenue which necessitated to properly indicate the company’s operations.
3
I. Overview of account settlement I. Overview of account settlement for the 1st quarterfor the 1st quarter
4
■ Our sales volume was behind both target and PY and market share was also negative versus PY both in volume and value.
Account settlement for Q1 (Jan-Mar) - Volume
Diff % Diff %
Volume 38,015 -932 -2.4 -910 -2.3
Vs. Target*1 Vs. PY2013 Q1 actual
Volume ValueMarketshare
-1.1 -1.0
vs. PY(Unit: K cases, %)
(Source: Intage)
(Unit: pts)
Monthly volume trend (vs. PY)
- 3.7
- 2.1- 1.4
- 6
- 3
+0
+3
+6
1月 2月 3月
Jan-Mar -2.3
(%)
*1 Target refers to the figures based on the performance forecast published on Feb 6, 2013.
FebJan Mar
5
Diff % Diff %
Supermarket ※3 8,961 -215 -2.3 +142 +1.6
Convenience store 4,790 -302 -5.9 -199 -4.0
13,750 -517 -3.6 -57 -0.4
Vending 11,030 -336 -3.0 -564 -4.9
Retail 2,393 -153 -6.0 -114 -4.5
Food Service 4,227 -107 -2.5 -63 -1.5
6,614 +182 +2.8 -113 -1.7
38,015 -932 -2.4 -910 -2.3Total
vs. PYQ1 actual
vs. target※2
Chain Store total
Other
Account settlement for Q1 (Jan-Mar) – Sales volume by channel
(Unit: K c/s, % )
■ While sales volume for Chain Store underperformed the target, it was nearly on PY level.→Due to impacts from tough competitions with Georgia, negative in Convenient stores V. PY and target.
→On the other hand, Supermarket enjoyed favorable sales with SS PET being bolstered to have positive V. PY even though the volume was behind target.
■ Highly profitable Vending underperformed both the target and PY in volume.→ Number of withdrawal exceeded the number of placement which resulted less operating VMs.
(-5,700 units V. end of Mar last year)
→ VPM※1dropped.
※1 Sales volume per unit of vending machine※2 Target refers to the figures based on the performance forecast published on Feb 6, 2013※3 Drug store/Discounter/Home center are included in supermarket
6
Account settlement for Q1 (Jan-Mar) – Ongoing initiatives by channel
■ Despite underperformed sales volume V. target, activities for peak season have been executed steadily by channel which is beginning to deliver impacts for sales recovery in Q2 onwards.
Chain storesChain stores
・・ Growth of SS PET (incl. Mini) RevenueGrowth of SS PET (incl. Mini) Revenuein Supermarket improved package mix.in Supermarket improved package mix.
→→CoolersCoolers & Racks utilized to capture POA& Racks utilized to capture POA
→→SS PET dedicated promotions and reinforcedSS PET dedicated promotions and reinforcedsales of mini PET.sales of mini PET.
VendingVending
・・ MarchMarch VPMVPM*1*1 turned positive in School and Sports facilities V. PY.turned positive in School and Sports facilities V. PY.
→→Enhanced product lineup with LowEnhanced product lineup with Low--VPM machines.VPM machines.
→→Increased number of renewal products to fill up Increased number of renewal products to fill up VMsVMs..
(March average VPM was(March average VPM was ++3.3% V. PY for 445 units renewed in Jan.) 3.3% V. PY for 445 units renewed in Jan.)
Volume (K c/s)
Diff V. PY (%) Ratio Diff(points)
SS PET 2,231 +15.5 +3.0
LS PET 5,391 -3.2 -2.9
Actual volume sold in Supermarket
Retail & Retail & Food ServiceFood Service
・・ Sales volumeSales volume & Revenue grew in Kyushu area in HORECA& Revenue grew in Kyushu area in HORECA*2*2 via partner liquor stores.via partner liquor stores.→→sales volume: sales volume: ++4% V. PY4% V. PY /Revenue: /Revenue: ++13% V. PY13% V. PY
・・ All outlet survey is underway in Kansai (KyotoAll outlet survey is underway in Kansai (Kyoto & Kobe) area to aim for expanding trade & Kobe) area to aim for expanding trade model (HORECA) via partner liquor stores.model (HORECA) via partner liquor stores.
*1. Sales volume per unit of vending machine *2. Hotel, Restaurant and Cafe
7
Account settlement for Q1 (Jan-Mar)–Sales volume by package
Diff % Diff %
SS (1,000ml or smal ler) 9,345 +179 +2.0 +1,060 +12.8
MS (smal ler than 1,500ml) 263 -51 -16.3 +64 +32.0
PET LS (1,500ml or larger) 6,010 -366 -5.7 -226 -3.6
Total 15,619 -238 -1.5 +898 +6.1
11,095 -831 -7.0 -1,688 -13.2
2,569 +2 +0.1 +138 +5.7
8,733 +135 +1.6 -258 -2.9
38,015 -932 -2.4 -910 -2.3
vs. PY
Total
Can (incl. bottle can)
Others
Syrup, powder
Q1 actualvs. target※2
(Unit: K c/s, % )
■ Highly profitable SS PET showed Revenue growth mainly in Supermarket and Vending which contributed to sales volume to go beyond both target and PY.
■ On the other hand, high-yielding Canisters was remarkably behind target and PY.
→Huge negative volume V. target and PY in Vending cans (Georgia etc.)
■ Greater decrease in cans far more than the growth of SS PET worsened package mix V. target and PY.
※2 Target refers to the figures based on the performance forecast published on Feb 6, 2013
8
Account settlement for Q1 (Jan-Mar) – Sales volume by brand
Diff % Diff %
Coca-Cola 2,526 +19 +0.7 -72 -2.8
Coca-Cola Zero 1,268 +108 +9.3 +88 +7.5
Fanta 1,443 -94 -6.1 -48 -3.2
Georgia 9,312 -731 -7.3 -847 -8.3
Sokenbicha 1,797 -21 -1.1 -122 -6.4
Aquarius 2,348 -265 -10.1 +44 +1.9
Ayataka 2,150 +258 +13.7 +167 +8.4
I-Lohas 1,513 -103 -6.4 +242 +19.1
Subtotal 22,358 -829 -3.6 -547 -2.4
Other 6,925 -238 -3.3 -104 -1.5
29,283 -1,067 -3.5 -652 -2.2
Syrup, powder 8,733 +135 +1.6 -258 -2.9
38,015 -932 -2.4 -910 -2.3
RTD※1 Total
Total
vs. PYQ1 actual
vs. target※2
Core
8
(Unit: K c/s, % )
■ Coca-Cola sales volume went as planned. It grew after rolling out March music campaign and March MTD volume exceeded both target and PY.
■ Coca-Cola Zero turned positive both V. target and PY with continuous upward trend after February Zero limit campaign.
■ Ayataka, I-Lohas favorably grew in Revenue turning V. PY volume positive.
※1 Packaged products
※2 Target refers to the figures based on the performance forecast published on Feb 6, 2013
*Target refers to the figures based on the performance forecast published on Feb 6, 2013
10
Account settlement for Q1 (Jan-Mar) – Causes of Difference (comparison with Target*)
Key causes Diff (value)
・Coca-Cola business -11.7
・Healthcare & Skincare business +0.3
・Coca-Cola business -15.6
・Healthcare & Skincare business +0.7
Increase/decrease of SG & A
・Increase of promotion/advertisement cost +4.5
・Decrease of outsourcing cost +1.9
・Decrease of labor cost +1.7
・Decrease of sales equipment +1.1
・Healthcare & Skincare business -0.6
・Increase of extraordinary loss (loss on retirement of fixed assets)-1.2
・Corporate tax etc. -0.8
Target
826838
2013 Q1 actual
・Investment loss/gain on equity method +10.6
-11
Ordinaryprofit
Revenue
Gross profiton sales
424 409
(Unit: 000 MM JPY)Diff
-1
-14
Operatingincome
-2 -3
-5 6
+9
+11
Current netprofit
-6 3
*Target refers to the figures based on the performance forecast published on Feb 6, 2013
11
Account settlement for Q1 (Jan-Mar) – Causes of Difference in operating income (Comparison with Target*)
Despite marginal profit decline in Coca-Cola business due to dropped sales volume or worsened package mix, corporate-wide productivity improvement initiatives have made progress to reduce promotional or other costs leaving OI loss of 200 MM JPY V. target. On the other hand, Healthcare & Skincare business finished with OI as planned.
Coca-Cola business (-1.7)
-2 -3.6
(-1.6)
Decreaseof
marginal profit
-12
2013 Q1 actual
WSP drop
-2
Decrease of
other cost
+8
Decrease of labor cost
+1(Raw) materials
etc.
+1
Decrease of promotion
activities
+4Other(SCM)
-2
・Chain stores -3・Vending +1
・ Decrease of IT costs +2
・ Decrease of repair/maintenance +2
・ Decrease of sales equipment-related activity +1 and others
(Unit: 000 MM JPY)
Target*
*Target refers to the figures based on the performance forecast published on Feb 6, 2013
12
Account settlement for Q1 (Jan-Mar) – Causes of Difference in operating income (Comparison with PY)
Key causes Diff (value)
・コカCoca-Cola business -21.3
・Healthcare & Skincare business +0.8
・Coca-Cola business -11.9
・Healthcare & Skincare business +0.7
Increase/decrease of SG & A
・Decrease of labor cost +4.3
・Decrease of outsourcing cost +2.9
・Decrease of sales commission +2.6
・Decrease of depreciation cost +1.3
・Decrease of consumable cost +1.1
・Healthcare & Skincare business -5.2
・Increase of extraordinary loss (loss on retirement of fixed assets)-1.2
・Corporate tax etc. +2.2
Revenue
Gross profiton sales
420 409
PY
826847
2013 Q1 actual(Unit: 000 MM JPY)
Diff
・Investment loss/gain on equity method +12.0
-3
-11
-20
Operatingincome
0.2 -3
-1 6Ordinaryprofit
+8
+7
Current netprofit
-5 3
13
-3(-3)
Account settlement for Q1 (Jan-Mar) – Causes of Decrease in operating income (Comparison with PY)
Despite marginal profit decline in Coca-Cola business due to dropped sales volume or worsened package mix, decreased labor/sales equipment costs contributed to gained OI of 100 MM JPY V. target. On the other hand, Healthcare & Skincare business finished with OI as planned. On the other hand, Healthcare & Skincare business dropped OI by 400 MM JPY from PY due to aggressive promotional costs invested in an attempt to boost future Revenue & OI by capturing new shoppers.
Coca-Cola business (+1)
0.2
(Raw) materialsetc.
+1
SCMimpact
+3
WSP drop
-2
Decrease of
other cost
+5
Other(SCM)
-4
・Decrease of labor cost by staff reductions +3
・Decrease of retirement benefit costs +2
Decrease of
labor cost
+5
・Dropped material price
Healthcare & Skincare
Business
-4
・Increased write-off -2
・Decrease of sales equipment cost +1
・ Decrease of Ad related costs +1
・ Decrease of depreciation costs +1
Decreaseof
marginal profit
-7
・Chain stores -3・Vending +1
(Unit: 000 MM JPY)
PY actual
2013 Q1 actual
14
II. Business Plan for the 2nd quarterII. Business Plan for the 2nd quarter
15
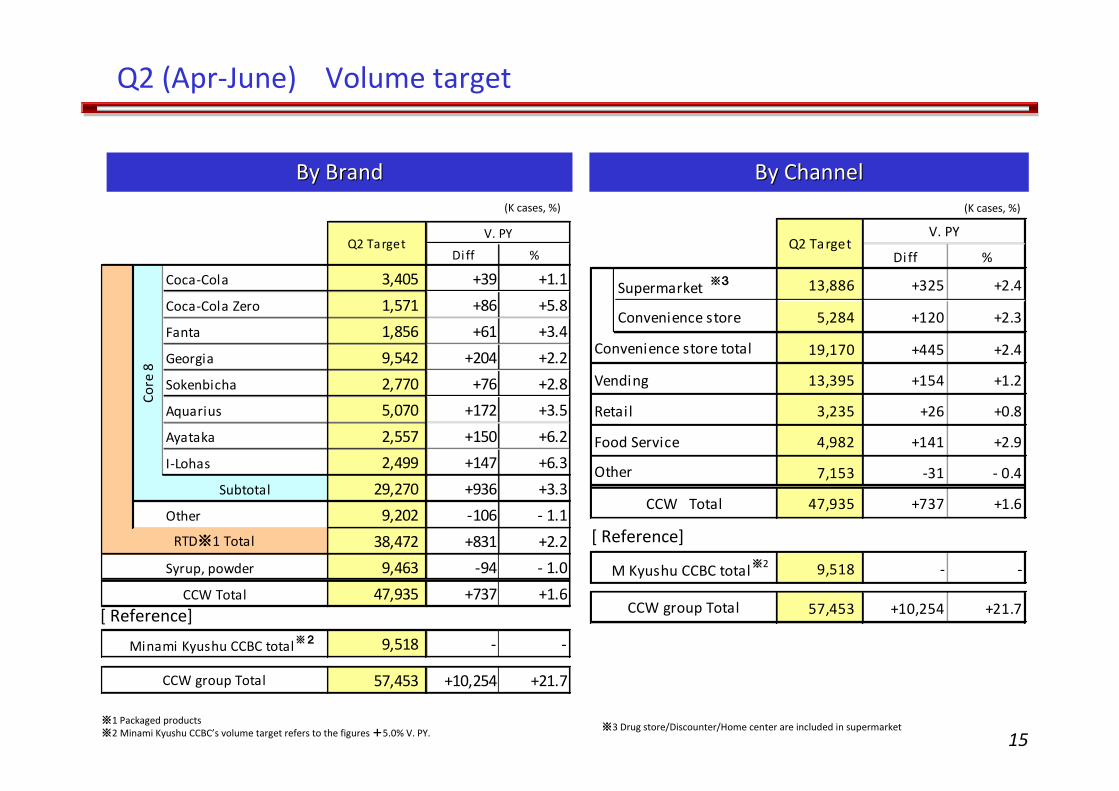
Q2 (Apr-June) Volume target
By BrandBy Brand(K cases, %)(K cases, %)
Diff %
Coca-Cola 3,405 +39 +1.1
Coca-Cola Zero 1,571 +86 +5.8
Fanta 1,856 +61 +3.4
Georgia 9,542 +204 +2.2
Sokenbicha 2,770 +76 +2.8
Aquarius 5,070 +172 +3.5
Ayataka 2,557 +150 +6.2
I-Lohas 2,499 +147 +6.3
Subtotal 29,270 +936 +3.3
Other 9,202 -106 - 1.1
38,472 +831 +2.2
Syrup, powder 9,463 -94 - 1.0
47,935 +737 +1.6
9,518 - -
57,453 +10,254 +21.7
Minami Kyushu CCBC total※2
CCW group Total
CCW Total
V. PYQ2 Target
Core
8
RTD※1 Total
※1 Packaged products※2 Minami Kyushu CCBC’s volume target refers to the figures +5.0% V. PY.
By ChannelBy Channel
Diff %
Supermarket ※3 13,886 +325 +2.4
Convenience store 5,284 +120 +2.3
19,170 +445 +2.4
Vending 13,395 +154 +1.2
Retail 3,235 +26 +0.8
Food Service 4,982 +141 +2.9
7,153 -31 - 0.4
47,935 +737 +1.6
9,518 - -
57,453 +10,254 +21.7
M Kyushu CCBC total※2
CCW group Total
CCW Total
V. PYQ2 Target
Convenience store total
Other
[ Reference]
[ Reference]
※3 Drug store/Discounter/Home center are included in supermarket
16
Brand strategy
Key activities Key activities New products, renewals & communicationNew products, renewals & communication
Music campaignMusic campaign→→Reinforce and expand the currentReinforce and expand the current
campaign by partnering with Karaokecampaign by partnering with Karaokeoutlet operatorsoutlet operators
Expand Zero Limit campaign in the runExpand Zero Limit campaign in the run--up to the peak seasonup to the peak season
Launch product renewals and summer Launch product renewals and summer only productsonly products
Aquarius Zero package renewalAquarius Zero package renewal
National referendum campaign (from Apr National referendum campaign (from Apr 1)1)→→Run a national campaign extensively whereRun a national campaign extensively where
consumers are being asked to cast a voteconsumers are being asked to cast a vote
→→Maximize visibility in all channels Maximize visibility in all channels
Launch I LOHAS 1,555 ml PETLaunch I LOHAS 1,555 ml PET→→Expand availability along with 555ml Expand availability along with 555ml
packagespackages
1,555ml
Aquarius Zero
New package
National referendum campaign
18
Channel strategy – Chain store
■ Drive sales volume and per-case revenue to expand revenue and profit
Expand sales volume Improve per-case revenue
Place coolers and racks Package differentiation between customers’ business categories
Expand coverage of mini PET(300ml)
Activate PoCs fully aligned with campaign
Apr Sokenbicha National referendum campaign
May Coca-Cola Music campaign
+12,000 units
(Number of active racks as of end Mar 2013: 24,000)
・ Leverage adjacencies to expand sales of single serve PET
Deli section
Bread section
・ Rigorously capture check-out and regular PoCs(to stop single serve PET price erosion)
■ Execute OBPPC※2 at individual machine level to optimize assortment
→Enhance sales data collection and analytics with dedicated
resources■ Launch new products
→Identify locations where NPDs are more effective
■ Continuously replace older vending machines to increase replenishment volume→Number of older machines to be replaced: 3,200
【NPD and renewals】
Q2 target3,900 machines
placed
(cumulative total: 5,100)
※1 Sales volume per 1 vending machine ※2 Occasion, Brand, Package, Price and Channel
Ambassa500ml PET
Kocha KadenRoyal Lemonade Tea
425ml PET
GeorgiaEuropean Koku no Bito
280ml PET
Schweppes Bitter Lemon
280ml PET
Georgia Iced coffee
Iced café au lait
Summer only products
■ Effective promotions→Joint project with Coca-Cola(Japan)Company,Limited to analyze
promotional effectiveness
→Devise and execute CCW original promotions
→Prioritize highly effective locations for national promotions
20
Business Model Transformation initiatives
■ We will complete full rollout of Logistic Process Reform and Service Model Optimization this year to generate 3.4 billion yen impact by 2014.
Service Model Optimization
Rollout to Kyushu, Minami Kyushu and Chugoku areas(Kyushu & Minami Kyushu area in May and
Chugoku area in Jun)⇒ Complete rollout in the entire CCW
group territory
Contact centers to expand sales support activities such as vending customer retention calls
(Kyushu area in May and Chugoku area in Jun)
⇒ Complete rollout in the CCW territory
Launch 3 DCs in Kyushu area
⇒ Complete DC rollout in Kyushu area
New vending machine operating model will be introduced to Osaka & Nagasaki areas based on test results (from May onward.)
Logistics Process Reform
Maximize volume and quality of sales activities
to expand revenue and improve efficiency concurrently
Build a logistics network centering on DCs to
realize a efficient logistics structure
Impact(billion JPY)
Logistics Process Reform 2.4
Service model optimization 1.0
Total 3.4
【2014 cost savings impact (CCW only)】
(vs. 2010)
21
ⅢⅢ. Making Minami Kyushu CCBC a wholly. Making Minami Kyushu CCBC a wholly--owned owned subsidiarysubsidiary
22
Summary of Minami Kyushu made a wholly-owned subsidiary
■ Following Minami Kyushu CCBC’s acquisition and cancellation of 600K of its own shares, as of Apr 1,CCW and Minami Kyushu executed a share exchange, making Minami Kyushu a wholly-owned subsidiary of CCW.
[Share exchange ratio] CCW: Minami Kyushu = 1:7
■ CCW used 11,155K its own shares to allot 9,175 shares to Minami Kyushu
shareholders.
■ We expect to incur negative goodwill based on Minami Kyushu’s net assets valued as of end March and Minami Kyushu share value.
(This valuation exercise is still ongoing and will be announced as soon as finalized.)
23
Early realization of integration cost and benefit
・・ Increase inIncrease in--house production leveraging both companieshouse production leveraging both companies’’capabilitiescapabilities
・・ Optimize production lines (suspend lines)Optimize production lines (suspend lines)
・・ Optimize new product production sitesOptimize new product production sites
・・ Standardize specifications of vending machine parts to drive Standardize specifications of vending machine parts to drive cost downcost down
In Commercial area, CCW’s sales strategy (such as OBPPC*) will be deployed in Minami Kyushu CCBC to ensure strategic alliance.
For SCM, one-company supply and demand structure will be put in place to improve productivity.
Minami Kyushu’s administrative and back-office functions will be consolidated into CCW to drive operational efficiency.
Business model transformation initiatives will be rolled out to Minami Kyushu.
■ This year’s operating principles
・・ Increased investment associated with system integration (increasIncreased investment associated with system integration (increased depreciation)ed depreciation)
・・ Reduce cost of systemReduce cost of system--related maintenance and suppliesrelated maintenance and supplies
2013benefit
2013
cost
SCMSCM
CommercialCommercial
OthersOthers
【Key integration cost and benefits】
* Occasion, Brand, Package, Price and Channel
24
ⅣⅣ. Full. Full--year Business Planyear Business Plan
25
Coca-Cola business performance plan has been revised upward to reflect Minami
Kyushu’s performance, integration cost and benefits, while Healthcare & Skincare
business performance plan will remain unchanged.
Full year consolidated operating income plan has been adjusted up 2.3 billion JPY
from the initial plan to 17.8 billion JPY.
FY ending Dec 2013 (Jan-Dec) & Q2 (Apr-Jun) Business Plan
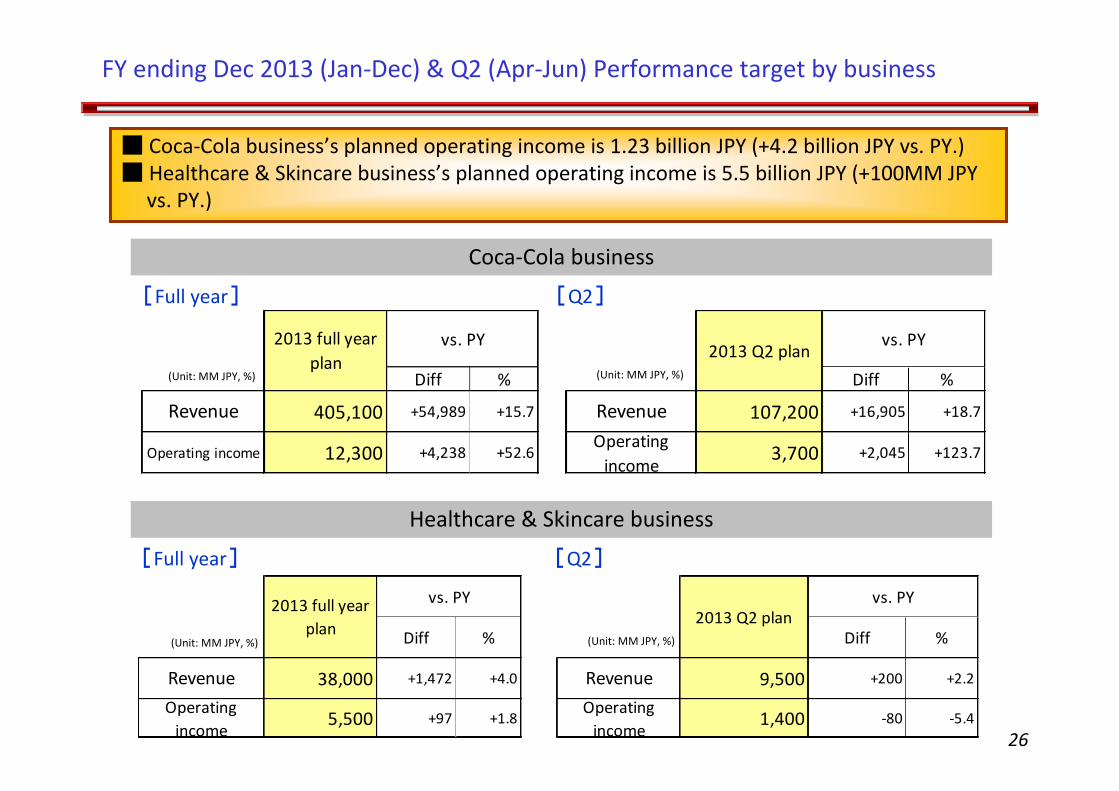
FY ending Dec 2013 (Jan-Dec) & Q2 (Apr-Jun) Performance target by business
(Unit: MM JPY, %)
Coca-Cola business
Healthcare & Skincare business
[Full year] [Q2]
[Full year] [Q2]
■ Coca-Cola business’s planned operating income is 1.23 billion JPY (+4.2 billion JPY vs. PY.)■ Healthcare & Skincare business’s planned operating income is 5.5 billion JPY (+100MM JPY
vs. PY.)
(Unit: MM JPY, %)
(Unit: MM JPY, %)(Unit: MM JPY, %)
27
Summary
■ As the 2nd quarter is critical in strengthening our sales foundation in the
run-up to the peak season, we will resolutely focus on sales activities to
expand sales volume, revenue and profit especially in profitable vending
channel.
■ We will consolidate functions and operations with Minami Kyushu in wide-
ranging fields to generate integration impact early.
■ For Logistics Process Reform and Service Model Optimization initiatives,
we will continue to make steady progress to eventually roll out to the
entire territory including Minami Kyushu to maximize benefits.
28
[Reference][Reference]
29
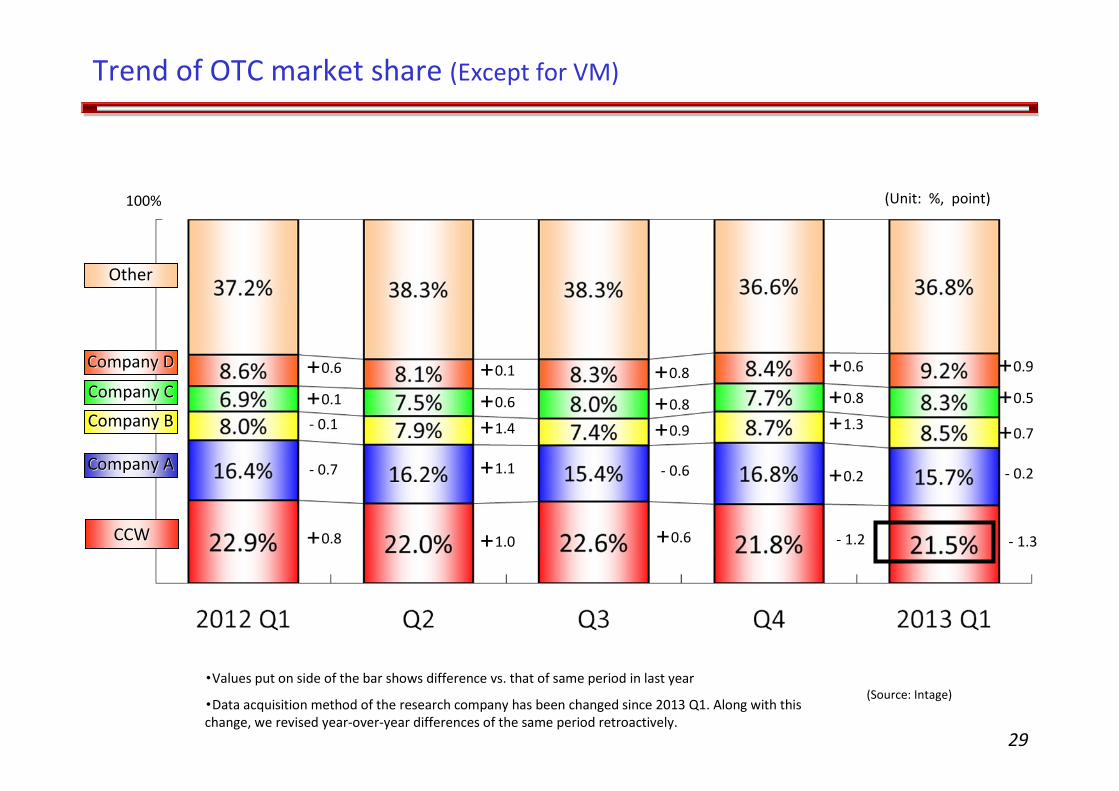
Trend of OTC market share (Except for VM)
・Values put on side of the bar shows difference vs. that of same period in last year
・Data acquisition method of the research company has been changed since 2013 Q1. Along with this change, we revised year-over-year differences of the same period retroactively.
(Source: Intage)
(Unit: %, point)
CCWCCW
OtherOther
Company DCompany D
Company CCompany C
Company BCompany B
Company ACompany A
100%
+0.6
- 0.1
+0.1
- 0.7
+0.8
+0.1
+1.4
+0.6
+1.1
+1.0
+0.8
+0.9
+0.8
- 0.6
+0.6
+0.6
+1.3
+0.8
+0.2
- 1.2
+0.9
+0.7
+0.5
- 0.2
- 1.3
30
Account settlement for Q1 (Jan-Mar) - Mix by brand/by channel
ChannelChannel
BrandBrand
2013
SokenbichaSokenbicha
CocaCoca--ColaCola
AquariusAquarius
GeorgiaGeorgia
OtherOther
CocaCoca--Cola ZeroCola ZeroFantaFanta
Volume Revenue Gross profiton sales
Food ServiceFood Service
VendingVending
RetailRetail
OtherOther
SupermarketSupermarket
CVSCVS
Volume Revenue Gross profiton sales
29%
8%5%
13%6%
17%
51%
17%
11%6%
13%
24%
6%10%
13%
62%
6%
3%
AyatakaAyatakaII--LohasLohas
7%
24%
5%
4%
5%
38%
7%
28%
4%
5%5%
38%
7%
40%
6%
4%
5%
24%
4%3%3%
4%6%
4%6%
5%8%
2012
Volume Revenue Gross profiton sales
Volume Revenue Gross profiton sales
30%
9%5%
13%6%
16%
51%
17%
11%6%
13%
23%
6%10%
12%
62%
6%4%
7%
25%
5%
4%
6%
40%
7%
27%
4%
5%5%
39%
7%
41%
6%
4%
5%
26%
3%3%3%
3%5%
4%6%
4%7%
31
Sub-channel Jan Feb Mar Tota l
At work white -4.7 -10.3 -4.7 -6.5
At work blue -5.8 -10.6 -7.6 -8.0
Mass retailer -5.0 -6.7 -2.6 -4.7
Transportation -2.4 -6.1 -0.6 -2.9
School -2.6 -8.8 +1.1 -3.7
Leisure -2.4 -6.1 -1.4 -3.2
Pachinko -5.1 -8.1 -6.7 -6.6
Sports facility -3.8 -1.1 +0.9 -1.3
Hospital -2.8 -8.2 -3.7 -4.8
Accommodation -0.3 -3.9 -1.5 -1.8
Other (Indoor) -4.9 -9.9 -3.9 -6.1
Outdoor -4.4 -8.3 -4.3 -5.6
Total -4.9 -8.4 -3.9 -5.6
vs. PY (%)
VM sales status by sub-channel
Vs. PY of VPM* of Full Service CAN VM
※ Sales volume per 1 vending machine
32
Q1(Jan-Mar) Actual sales volume (by channel and by package)
(Unit: K c/s, %)
■Chain StoreDiff % Diff %
SS PET (smaller than 1,000ml) 4,675 -65 -1.4 +443 +10.5MS PET (smaller than1,500ml) 220 -73 -24.9 +42 +23.7LS PET (1,500ml or larger) 5,557 -361 -6.1 -173 -3.0Can 2,846 +55 +2.0 -363 -11.3Other 452 -73 -13.9 -5 -1.2
Total 13,750 -517 -3.6 -57 -0.4(Unit: K c/s, %)
■VendingDiff % Diff %
SS PET (smaller than 1,000ml) 3,590 +333 +10.2 +603 +20.2LS PET (1,500ml or larger) 34 +0 +0.3 -5 -12.0Can 6,596 -757 -10.3 -882 -11.8Other (bottle can etc.) 721 +66 +10.1 -141 -16.3Syrup/Powder 89 +22 +32.2 -139 -60.9
Total 11,030 -336 -3.0 -564 -4.9(Unit: K c/s, %)
■Retail & Food serviceDiff % Diff %
SS PET (smaller than 1,000ml) 976 -101 -9.4 +52 +5.7MS PET (smaller than1,500ml) 43 +21 +100.9 +22 +102.3LS PET (1,500ml or larger) 418 -6 -1.5 -48 -10.3Can 596 -47 -7.4 -88 -12.9Other 474 +6 +1.2 -4 -0.9Syrup/Powder 4,114 -133 -3.1 -110 -2.6
Total 6,621 -261 -3.8 -176 -2.6
Q1 Actual
Q1 Actual
Q1 Actual Vs. PY
Vs. target※
Vs. PYVs. target※
Vs. PY
Vs. target※
※Target refers to the figures based on the performance forecast published on Feb 6, 2013
33
(K cases, % )
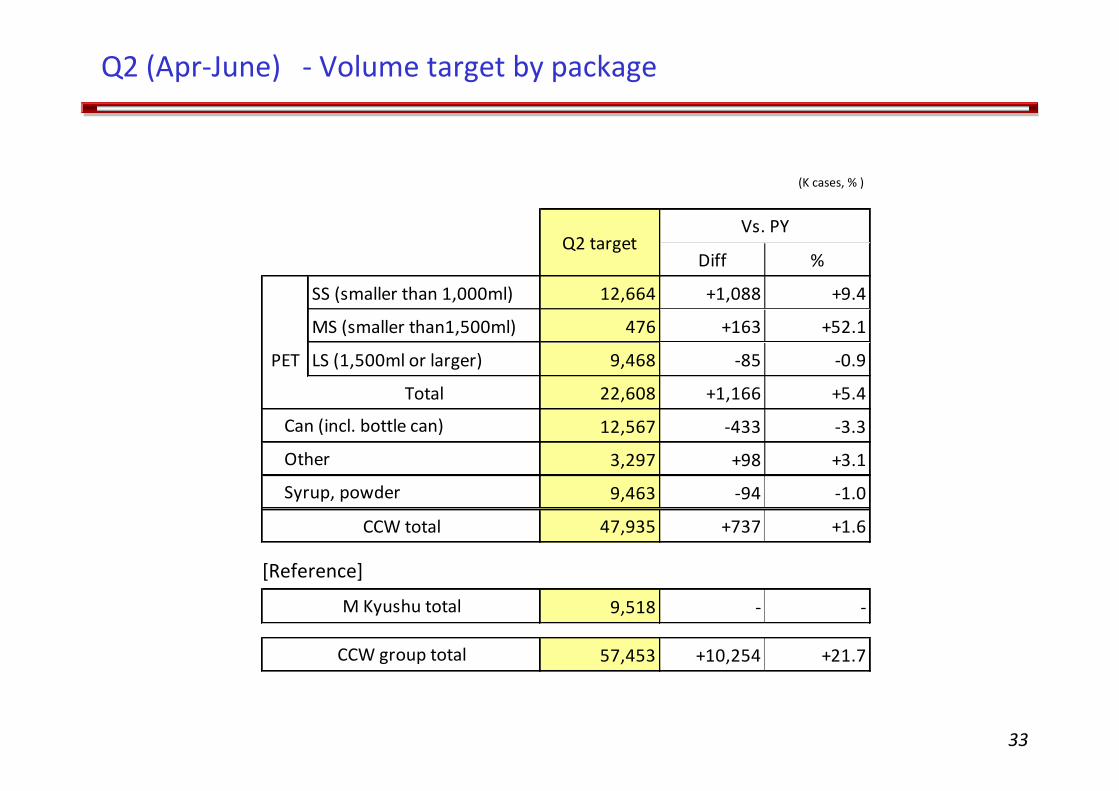
Q2 (Apr-June) - Volume target by package
Diff %
SS (smaller than 1,000ml) 12,664 +1,088 +9.4
MS (smaller than1,500ml) 476 +163 +52.1
PET LS (1,500ml or larger) 9,468 -85 -0.9
Total 22,608 +1,166 +5.4
12,567 -433 -3.3
3,297 +98 +3.1
9,463 -94 -1.0
47,935 +737 +1.6
9,518 - -
57,453 +10,254 +21.7
M Kyushu total
CCW group total
Vs. PY
CCW total
Can (incl. bottle can)
Other
Syrup, powder
Q2 target
[Reference]
34
(K cases, %)
■Chain StoreDiff %
SS PET (smaller than 1,000ml) 6,251 +509 +8.9MS PET (smaller than1,500ml) 443 +161 +57.3LS PET (1,500ml or larger) 8,821 -6 -0.1Can 2,923 -306 -9.5Other 733 +88 +13.6
Total 19,170 +445 +2.4(K cases, %)
■VendingDiff %
SS PET (smaller than 1,000ml) 4,857 +470 +10.7LS PET (1,500ml or larger) 62 -4 -5.8Can 7,679 -120 -1.5Other (bottle can etc.) 727 -79 -9.8Syrup/Powder 70 -113 -61.7
Total 13,395 +154 +1.2(K cases, %)
■Retail & Food serviceDiff %
SS PET (smaller than 1,000ml) 1,420 +64 +4.8MS PET (smaller than1,500ml) 32 +2 +5.4LS PET (1,500ml or larger) 585 -74 -11.2Can 756 -18 -2.3Other 577 +93 +19.2Syrup/Powder 4,847 +100 +2.1
Total 8,217 +168 +2.1
vs. PY
vs. PY
vs. PY
Q2 target
Q2 target
Q2 target
Q2 (Apr-June) - Volume target by channel/by package
In 2006, CCWJ and Kinki CCBC merged the management of both companies by establishing a joint holding company CCWH. In 2009, CCWH, CCWJ, Kinki CCBC and Mikasa CCBC merged and the trade name changed to Coca-Cola West Co., Ltd.
2. The Coca-Cola Company (TCCC)
Established 1919 in Atlanta, Georgia. Carries the rights to grant a license to manufacture and sell Coca-Cola products to the bottlers. TCCC (or its subsidiary) makes franchise agreements with the bottlers.
3. Coca-Cola (Japan) Co., Ltd. (CCJC)
Established 1957 in Tokyo, as “Nihon Inryo Kogyo K.K.,” a wholly-owned subsidiary of The Coca-Cola Company. The company name was changed in 1958 to Coca-Cola (Japan) Company, Limited. CCJC is responsible for marketing planning as well as manufacturing and distribution of concentrate in Japan.
4. Coca-Cola Tokyo Research & Development Co., Ltd.
(CCTR&D)
Established in January 1993 as a wholly-owned subsidiary of The Coca-Cola Company. Since January 1995, carries out product development and technical support to respond to the needs of the Asian region.
5. Coca-Cola bottlers (CCBCs)
There are 12 bottlers in Japan, which are responsible for selling Coca-Cola products in the respective territories.
6. Coca-Cola Business Service Co., Ltd. (CCBSC)
Established through joint investment by TCCC and its bottling partners in Japan, in June 1999. It is charged with providing business consulting services to the Coca-Cola system in Japan, as well as developing and generally maintaining the information systems to support such work. The company procures raw materials.
7. Coca-Cola Customer Marketing Company (CCCMC)
Established through joint investment by Coca-Cola (Japan) Co., Ltd. and all of its bottling partners in Japan, and the company beganoperations on January 1, 2007. It is charged with holding business negotiations with major retailer outlets, such as nationwide convenience stores and supermarket chains, as well as developingproposals for sales promotions and storefront activities.
8. FV Corporation Co., Ltd. (FVC)
Jointly established in May 2001 by CCBCs and CCJC. FVC carries out sales negotiations with national chain vending operators, and deals with non-KO products as well as KO products.
Coca-Cola related companies and their roles
39
Glossary
Term ExplanationChannel ・Vending Retail sale business to distribute products through vending machines to consumers ・Chain store Wholesale business for supermarket chain ・Convenience Store (CVS) Wholesale business for convenience store chains ・Retail Wholesale business for grocery stores, liquor shops, and other over-the-counter outlets ・Food Service Syrup sale business for restaurants, movie theaters, sports areas and theme parksVending
・Regular vending machineA vending machine offered free of charge to a customer who supervises its operation and uses it tosell products purchased from us
・Full service vending machine A vending machine installed and managed directly by us ・Out-market vendhing machine An outdoor machine whose users are relatively unspecific ・In-market vending machine An indoor machine whose users are relatively specific ・VPM Volume Per Machine ・VPPM Volume and Profit Per MachineChain store ・National chain National chain supermarket that CCCMC are responsible for negotiating ・Regional chain Chain supermarket that owns its stores in the two or more bottlers' territories ・Local chain Chain supermarket that owns its stores in the single bottler's territoryOther
・Trade marketingTrade marketing is a specific function that uses shopper and retail knowledge to develop in-storestrategies that ultimately result in higher brand equity and an increase in the quantity and value ofshopper purchases
The plans, performance forecasts, and strategies appearingin this material are based on the judgment of the managementin view of data obtained as of the date this material was released. Please note that these forecasts may differ materially from actualperformance due to risks and uncertain factors such as those listed below.
- Intensification of market price competition- Change in economic trends affecting business climate- Major fluctuations in capital markets- Uncertain factors other than those above